Towards Reproducible LLM Evaluation: Quantifying Uncertainty in LLM Benchmark Scores
Abstract
Large language models (LLMs) are stochastic, and not all models give deterministic answers, even when setting to zero with a fixed random . However, few benchmark studies attempt to quantify uncertainty, partly due to the time and cost of repeated experiments. We use benchmarks designed for testing LLMs’ capacity to reason about cardinal directions to explore the impact of experimental repeats on mean score and prediction interval. We suggest a simple method for cost-effectively quantifying the uncertainty of a benchmark score and make recommendations concerning reproducible LLM evaluation.
Towards Reproducible LLM Evaluation: Quantifying Uncertainty in LLM Benchmark Scores
Robert E. Blackwell1, Jon Barry2, Anthony G. Cohn3,1 1The Alan Turing Institute, 2The Centre for Environment Fisheries and Aquaculture Science, 3School of Computer Science, University of Leeds. Correspondence: rblackwell@turing.ac.uk
1 Introduction
As Generative Artificial Intelligence (GenAI) systems become prevalent, it is natural to want to assess their capabilities and compare their performance. Large Language Models (LLMs) (Devlin et al., 2019; Brown et al., 2020), such as Claude Sonnet and GPT-4o are examples of so-called Foundation Models (Bommasani et al., 2021) that generate textual responses to prompts, having been trained on very large corpora. Vendors compete to provide ever more capable LLMs, making claims and counter-claims about model performance across a variety of tasks including general knowledge and reasoning (e.g. see recent product launches from XAI111https://x.ai/blog/grok-2, accessed October 2024. and OpenAI222https://openai.com/index/gpt-4o-mini-advancing-cost-efficient-intelligence/, accessed October 2024.).
LLM evaluation is a burgeoning field (for a survey see Chang et al., 2024). LLM benchmarks consisting of question and answer pairs, are widely used to assess performance and provide leader boards comparing state-of-the-art, frontier models (e.g. LMSYS Chatbot Arena333https://huggingface.co/spaces/lmsys/chatbot-arena-leaderboard, accessed October 2024.). Specialist benchmarks are emerging to assess model performance across diverse domains including coding (e.g. Zhuo et al., 2024), medical (e.g. Cai et al., 2024) and legal (e.g. Guha et al., 2024).
However, LLMs are stochastic systems (Bender et al., 2021) that may generate non deterministic answers. Despite calls for reproducibility in LLM evaluation (e.g. Burnell et al., 2023), few studies try to quantify uncertainty. Attempts have been made to reduce answer variability (for example, by fixing the random number , prompt engineering (Sahoo et al., 2024) or changing the sampling strategy (e.g., nucleus sampling, Holtzman et al., 2020), but at the time of writing, none of these approaches is reliable for all APIs and models.
We note that reproducibility and determinism are not always desirable properties of an AI system, especially if novel or artistic solutions are sought. The subject of creativity in AI has a long history, for example see Boden (2004). However, in this paper we are primarily interested in benchmarks with questions that can either be answered correctly or incorrectly and can thus test specific capabilities of an LLM.
Reasons for non-determinism in LLMs include the use of probabilistic random sampling, the unpredictable order of subsystem execution in parallel systems and differences in floating point arithmetic implementation Hagmann et al. (2023). LLMs generate text based on probabilities derived from their training data. At each step in the generating process, the model predicts the next word (or token) by sampling a probability distribution of next token likelihood. Whilst random number generators can be seeded, coordination of these seeds is difficult in a distributed system where the order of execution of parallel elements is unpredictable. This is especially the case in shared, cloud infrastructure which may consist of heterogeneous hardware.
Commercial LLM Application Programming Interfaces (APIs) can be costly and are often rate-limited, restricting the throughput and number of experiments that can reasonably be undertaken as part of a benchmark study. In this paper, we explore how the size of benchmarks, the model parameters, and the number of experimental repeats affect uncertainty. We conclude by making practical recommendations for cost-effective LLM sampling, evaluation, and benchmarking.
2 Related Work
Lin et al (2024) differentiate uncertainty from confidence: the former refers to the “dispersion” of the potential predictions for a fixed input, and the latter refers to the confidence of a particular prediction.
Lower temperature settings are associated with more deterministic responses, whereas higher settings promote creativity. In their experiments, Renze and Guven (2024) showed that changes in temperature from 0.0 to 1.0 did not have a statistically significant effect on the problem solving performance of the LLMs tested. Renze and Guven (2024) also showed that uncertainty reduces with temperature and recommend setting an LLM’s sampling temperature to 0.0 to make results more deterministic. Patel et al. (2024) report similar results for clinical tasks.
3 Methods
To explore the stochastic nature of LLMs, we present questions to OpenAI GPT-3.5 Turbo 0125 (GPT-3.5T), OpenAI GPT-4o 2024-05-13 (GPT-4o), Meta Llama 3 70B Instruct (Llama-3 70B), Meta Llama 3 7B (Llama-3 7B), Google Gemini 1.5 Pro preview-0409 (Gemini-1.5P), and Anthropic Claude 3.5 Sonnet 20240620 (Claude-3.5S). The OpenAI models are hosted on Microsoft Azure (with content filtering switched off), Llama-3 70B on Microsoft Azure AI, Gemini-1.5P on Google Vertex and Llama-3 7B on Ollama on a Mac M2. Each question is posed as a prompt in a separate chat completion.
We study two representative, qualitative spatial reasoning benchmarks developed by Cohn and Blackwell (2024). The first benchmark (Small) consists of 100 simple questions with cardinal directions as answers, e.g. “You are watching the sun set. Which direction are you facing?”. The second benchmark (Large) consists of 5760 templated questions with cardinal or intercardinal directions as answers, e.g. “You are walking south along the east shore of a lake; in which direction is the lake?”. We run the experiment as described by Cohn and Blackwell (2024) except that we first run with default model settings (not explicitly setting , or ). We then run with = 0 and a fixed = 123.We use the system prompt “You are a helpful assistant. I will give you a question about directions. The answer is either north, south, east, or west. Please only reply with the answer. No yapping.” for Small and “You are a helpful assistant. I will give you a question about directions. The answer is either north, south, east, west. north-east, north-west, south-east or south-west. Please only reply with the answer. No yapping.” for Large. We vary the number of repeats from 1 to 30 to explore the impact of repetition on mean benchmark score and compute prediction interval as a measure of uncertainty:
Let be the number of benchmark questions, the number of times the experiment is repeated and the score for the -th question in the -th repeat (0 incorrect, 1 correct). The mean score for a single repeat , with questions is given by (Eq. 1), and the mean score over repeats, by (Eq. 2).
| (1) |
| (2) |
The prediction interval for a future observation of the mean over repeats is (3).
| (3) |
where is the standard deviation of and is the critical value from the Student’s -distribution for a confidence level and degrees of freedom (we use = 0.05 for a 95% probability).
Tian et al. (2022) give a short history of prediction intervals dating back to Fisher (1935). Generally, they are used for a single future observation (), but, here, we use them for a future mean. Note that a prediction interval is wider than its corresponding confidence interval. A prediction interval estimates the range where future observations or means of observations will likely fall, while a confidence interval estimates the range where the true population parameter (e.g. mean) lies based on sample data (Chiolero et al., 2012). We are interested in reproducibility of benchmark scores and so we use prediction intervals where .
Finally, to explore whether there are differences in the same model provided by different vendors, we run the Small cardinal reasoning benchmark ( = 0, = 123, = 90) using the Microsoft provided Azure OpenAI API and then the OpenAI provided API. We perform a two-sample t-test to determine whether the results are statistically significantly different at the = 0.05 significance level.
4 Results
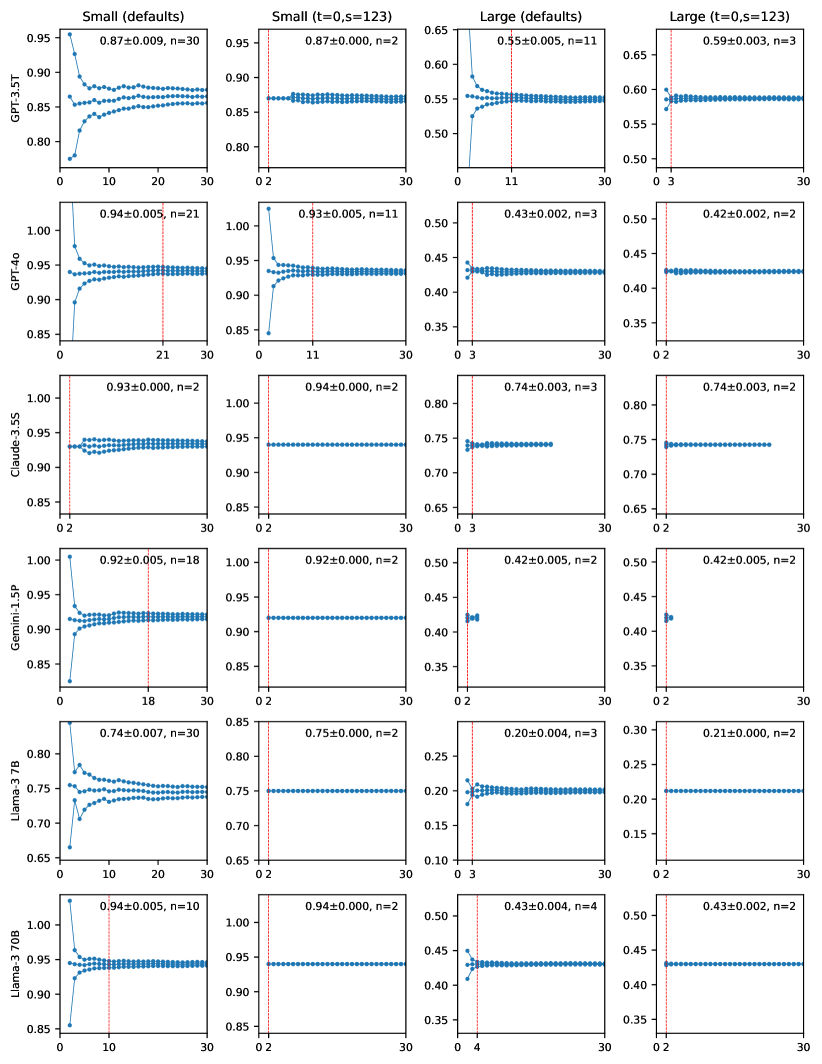
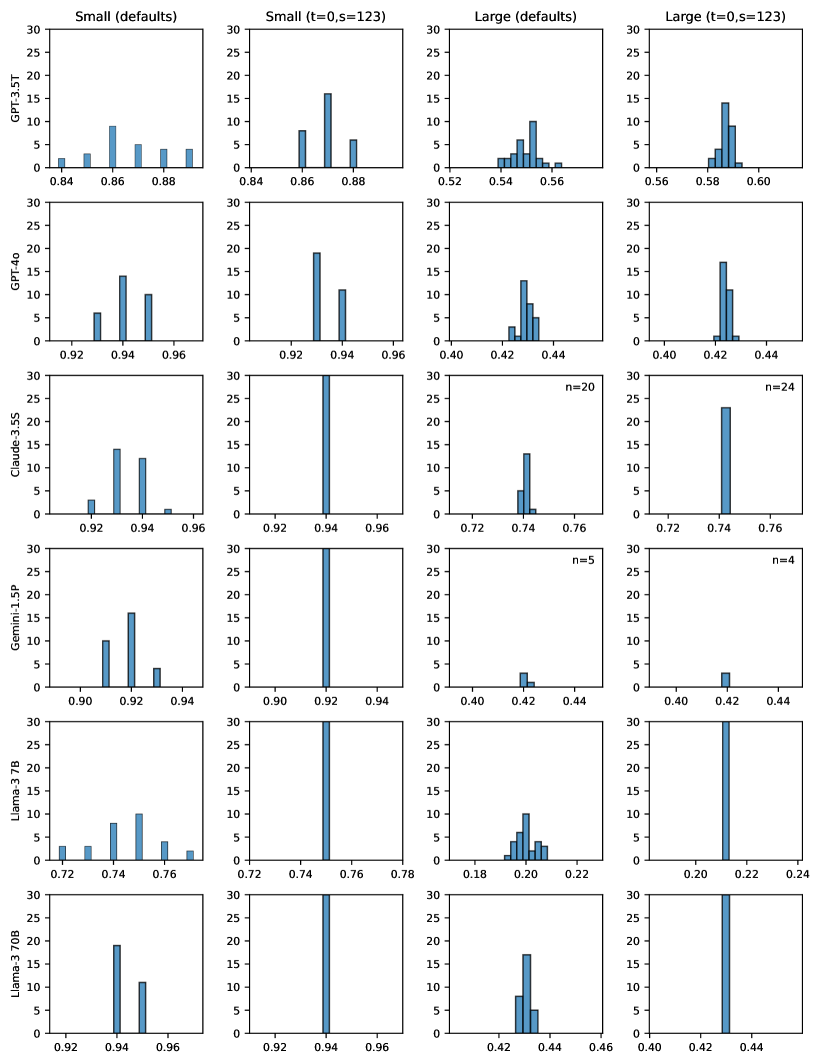
For all models tested, when using the default model settings, the Large benchmark gave a prediction interval width 0.01 after fewer repeats than the Small benchmark (Figure 1). All tests except GPT-3.5T with Large gave a prediction interval width 0.01 in four or fewer repeats.
For both Large and Small benchmarks, setting temperature to 0.0 with a fixed gave a prediction interval width 0.01 after less than or the same number repeats than when using default settings. In all cases except two (GPT-3.5T and Llama-3 7B with Small (defaults)), the prediction interval width reduces to 0.01 within = 30 repeats.
When comparing results for GPT-3.5T from the Microsoft Azure OpenAI API and the OpenAI API applied to the Small dataset, the mean scores were 0.833 and 0.840 respectively ( = 90). A two-sample t-test suggests that the results are statistically significantly different ( = 2.51, = 0.013).
5 Discussion
Although we found no combination of and or and that gave deterministic answers for all models and benchmarks, setting to 0 and fixing (where available) reduced variability for most models and experiments, as expected. Unless creativity of answers is a goal, or there is a requirement to test the default settings of models, it seems sensible to set to 0 with a fixed and thus reduce the number of experimental repeats required to achieve a desired prediction interval width. Evaluators might chose to tune parameters such as or to maximise performance on a model by model or task by task basis, but this could be time consuming and we prefer to compare models using consistent settings.
Llama-3 7B always gave deterministic results when setting the to a fixed value. Hagmann et al.(2023) note the challenges of reproducibility when using distributed, parallel architectures and out-of-order execution. Llama-3 7B is the only model tested that was run locally rather than in the cloud and we suggest that this lack of distributed parallelism allows the random number generator to be consistently seeded, resulting in predictable execution patterns and deterministic results.
It is important to document the precise API, model, version, and parameters being used to conduct a benchmark. Our results show that GPT-3.5T via the Microsoft Azure OpenAI API and GPT-3.5T via the OpenAI API, gave statistically significantly different results for the Small benchmark. Although model versions appear to be consistent in both the Azure OpenAI API and OpenAI API documentation, the two APIs are different and use different message formats. At the time of writing there were multiple versions of GPT-3.5T available (including gpt-3.5-turbo-0125, gpt-3.5-turbo-1106, gpt-3.5-turbo-instruct-0914, gpt-35-turbo-16k-0613, and gpt-35-turbo-0613) and some APIs (e.g. Microsoft Azure OpenAI API) can be set to auto-update, causing possible confusion. Our results also show that model parameters such as and can also change the mean score of a model, e.g. setting to 0 and to 123 for GPT-3.5T applied to Large increased its score from 0.55 to 0.59 (Figure 1).
Inference APIs can be expensive and rate limited, making experimental repeats costly and time-consuming. Our results suggest that when setting to 0.0 with a fixed , it is rarely necessary to conduct more than three repeats to achieve a prediction interval width of 0.01.
6 Conclusions
LLMs are stochastic and not all LLMs provide deterministic answers. However, setting to 0.0 with a fixed appears to reduce answer variability for many models and reduces the possibility of outlier benchmark scores.
Evaluators should take steps to quantify uncertainty in LLM benchmark scores. One way to quantify uncertainty is to provide results in the form , using prediction intervals (Eq. 3); the number of experimental repeats can be increased incrementally until the prediction interval width is below a desirable threshold (perhaps 0.01). Larger benchmarks with more questions reduce the variability of the mean score.
The experimental conditions including benchmark size, model, version, API, parameters, number of experimental repeats, and date of the experiment should be carefully documented, as should the method used to quantify uncertainty.
7 Limitations
This study tested six representative LLMs from four vendors, but there are now many LLMs that could be tested with varying architectures, weights, context windows and parameters.
This study tested two qualitative spatial reasoning benchmarks of different size, question style and complexity, but there are now many benchmarks that could be tested. Different benchmarks are designed to test different knowledge and reasoning tasks. It is possible that some benchmarks may require more experimental repeats for the prediction interval width to reduce acceptably.
We have not looked at the impact of prompt engineering on answer variability.
We have not looked at the impact of linguistic variation (e.g. tense, person form, vocabulary or language) on answer variability.
This study used temperature based sampling and does not consider nucleus () sampling. Preliminary work by the authors suggest that nucleus sampling can also be used to reduce the variability of benchmark score and that the methods described herein for quantifying uncertainty are equally applicable.
LLMs are black box systems and we have no way of knowing precisely how models will perform for future requests. The underlying hardware and software systems may be subject to change without notice. LLM technology is evolving rapidly, and new sampling methods may change the stochasticity of LLMs.
In this paper we have used frequentist statistics to model uncertainty, but it would also be interesting to explore Bayesian statistical approaches.
References
- Bender et al. (2021) Emily M Bender, Timnit Gebru, Angelina McMillan-Major, and Shmargaret Shmitchell. 2021. On the dangers of stochastic parrots: Can language models be too big? In Proceedings of the 2021 ACM conference on fairness, accountability, and transparency, pages 610–623.
- Boden (2004) Margaret A Boden. 2004. The Creative Mind: Myths and Mechanisms, 2nd edition. Routledge, London, UK.
- Bommasani et al. (2021) Rishi Bommasani, Drew A. Hudson, Ehsan Adeli, Russ Altman, Simran Arora, Sydney von Arx, Michael S. Bernstein, Jeannette Bohg, Antoine Bosselut, Emma Brunskill, Erik Brynjolfsson, Shyamal Buch, Dallas Card, Rodrigo Castellon, Niladri Chatterji, Annie Chen, Kathleen Creel, Jared Quincy Davis, Dora Demszky, Chris Donahue, Moussa Doumbouya, Esin Durmus, Stefano Ermon, John Etchemendy, Kawin Ethayarajh, Li Fei-Fei, Chelsea Finn, Trevor Gale, Lauren Gillespie, Karan Goel, Noah Goodman, Shelby Grossman, Neel Guha, Tatsunori Hashimoto, Peter Henderson, John Hewitt, Daniel E. Ho, Jenny Hong, Kyle Hsu, Jing Huang, Thomas Icard, Saahil Jain, Dan Jurafsky, Pratyusha Kalluri, Siddharth Karamcheti, Geoff Keeling, Fereshte Khani, Omar Khattab, Pang Wei Koh, Mark Krass, Ranjay Krishna, Rohith Kuditipudi, Ananya Kumar, Faisal Ladhak, Mina Lee, Tony Lee, Jure Leskovec, Isabelle Levent, Xiang Lisa Li, Xuechen Li, Tengyu Ma, Ali Malik, Christopher D. Manning, Suvir Mirchandani, Eric Mitchell, Zanele Munyikwa, Suraj Nair, Avanika Narayan, Deepak Narayanan, Ben Newman, Allen Nie, Juan Carlos Niebles, Hamed Nilforoshan, Julian Nyarko, Giray Ogut, Laurel Orr, Isabel Papadimitriou, Joon Sung Park, Chris Piech, Eva Portelance, Christopher Potts, Aditi Raghunathan, Rob Reich, Hongyu Ren, Frieda Rong, Yusuf Roohani, Camilo Ruiz, Jack Ryan, Christopher Ré, Dorsa Sadigh, Shiori Sagawa, Keshav Santhanam, Andy Shih, Krishnan Srinivasan, Alex Tamkin, Rohan Taori, Armin W. Thomas, Florian Tramèr, Rose E. Wang, William Wang, Bohan Wu, Jiajun Wu, Yuhuai Wu, Sang Michael Xie, Michihiro Yasunaga, Jiaxuan You, Matei Zaharia, Michael Zhang, Tianyi Zhang, Xikun Zhang, Yuhui Zhang, Lucia Zheng, Kaitlyn Zhou, and Percy Liang. 2021. On the opportunities and risks of foundation models. Preprint, arXiv:2108.07258.
- Brown et al. (2020) Tom Brown, Benjamin Mann, Nick Ryder, Melanie Subbiah, Jared D Kaplan, Prafulla Dhariwal, Arvind Neelakantan, Pranav Shyam, Girish Sastry, Amanda Askell, et al. 2020. Language models are few-shot learners. Advances in Neural Information Processing Systems, 33:1877–1901.
- Burnell et al. (2023) Ryan Burnell, Wout Schellaert, John Burden, Tomer D Ullman, Fernando Martinez-Plumed, Joshua B Tenenbaum, Danaja Rutar, Lucy G Cheke, Jascha Sohl-Dickstein, Melanie Mitchell, et al. 2023. Rethink reporting of evaluation results in ai. Science, 380(6641):136–138.
- Cai et al. (2024) Yan Cai, Linlin Wang, Ye Wang, Gerard de Melo, Ya Zhang, Yanfeng Wang, and Liang He. 2024. Medbench: A large-scale chinese benchmark for evaluating medical large language models. In Proceedings of the AAAI Conference on Artificial Intelligence, volume 38 (16), pages 17709–17717.
- Chang et al. (2024) Yupeng Chang, Xu Wang, Jindong Wang, Yuan Wu, Linyi Yang, Kaijie Zhu, Hao Chen, Xiaoyuan Yi, Cunxiang Wang, Yidong Wang, et al. 2024. A survey on evaluation of large language models. ACM Transactions on Intelligent Systems and Technology, 15(3):1–45.
- Chiolero et al. (2012) Arnaud Chiolero, Valérie Santschi, Bernard Burnand, Robert W Platt, and Gilles Paradis. 2012. Meta-analyses: with confidence or prediction intervals? European journal of epidemiology, 27:823–825.
- Cohn and Blackwell (2024) Anthony G Cohn and Robert E Blackwell. 2024. Evaluating the Ability of Large Language Models to Reason About Cardinal Directions. In 16th International Conference on Spatial Information Theory (COSIT 2024), volume 315 of Leibniz International Proceedings in Informatics (LIPIcs), pages 28:1–28:9, Dagstuhl, Germany. Schloss Dagstuhl – Leibniz-Zentrum für Informatik.
- Devlin et al. (2019) Jacob Devlin, Ming-Wei Chang, Kenton Lee, and Kristina Toutanova. 2019. BERT: Pre-training of deep bidirectional transformers for language understanding. In Proceedings of the 2019 Conference of the North American Chapter of the Association for Computational Linguistics: Human Language Technologies, Volume 1 (Long and Short Papers), pages 4171–4186, Minneapolis, Minnesota. Association for Computational Linguistics.
- Fisher (1935) Ronald A Fisher. 1935. The fiducial argument in statistical inference. Annals of eugenics, 6(4):391–398.
- Guha et al. (2024) Neel Guha, Julian Nyarko, Daniel Ho, Christopher Ré, Adam Chilton, Alex Chohlas-Wood, Austin Peters, Brandon Waldon, Daniel Rockmore, Diego Zambrano, et al. 2024. Legalbench: A collaboratively built benchmark for measuring legal reasoning in large language models. Advances in Neural Information Processing Systems, 36.
- Hagmann et al. (2023) Michael Hagmann, Philipp Meier, and Stefan Riezler. 2023. Towards inferential reproducibility of machine learning research. In The Eleventh International Conference on Learning Representations.
- Holtzman et al. (2020) Ari Holtzman, Jan Buys, Li Du, Maxwell Forbes, and Yejin Choi. 2020. The curious case of neural text degeneration. In International Conference on Learning Representations.
- Lin et al. (2024) Zhen Lin, Shubhendu Trivedi, and Jimeng Sun. 2024. Generating with confidence: Uncertainty quantification for black-box large language models. Preprint, arXiv:2305.19187.
- Patel et al. (2024) Dhavalkumar Patel, Prem Timsina, Ganesh Raut, Robert Freeman, Matthew A levin, Girish N Nadkarni, Benjamin S Glicksberg, and Eyal Klang. 2024. Exploring temperature effects on large language models across various clinical tasks. medRxiv.
- Renze and Guven (2024) Matthew Renze and Erhan Guven. 2024. The effect of sampling temperature on problem solving in large language models. Preprint, arXiv:2402.05201.
- Sahoo et al. (2024) Pranab Sahoo, Ayush Kumar Singh, Sriparna Saha, Vinija Jain, Samrat Mondal, and Aman Chadha. 2024. A systematic survey of prompt engineering in large language models: Techniques and applications. arXiv preprint arXiv:2402.07927.
- Tian et al. (2022) Qinglong Tian, Daniel J Nordman, and William Q Meeker. 2022. Methods to compute prediction intervals: A review and new results. Statistical Science, 37(4):580–597.
- Zhuo et al. (2024) Terry Yue Zhuo, Minh Chien Vu, Jenny Chim, Han Hu, Wenhao Yu, Ratnadira Widyasari, Imam Nur Bani Yusuf, Haolan Zhan, Junda He, Indraneil Paul, et al. 2024. Bigcodebench: Benchmarking code generation with diverse function calls and complex instructions. arXiv preprint arXiv:2406.15877.
Appendix A Supplementary Information
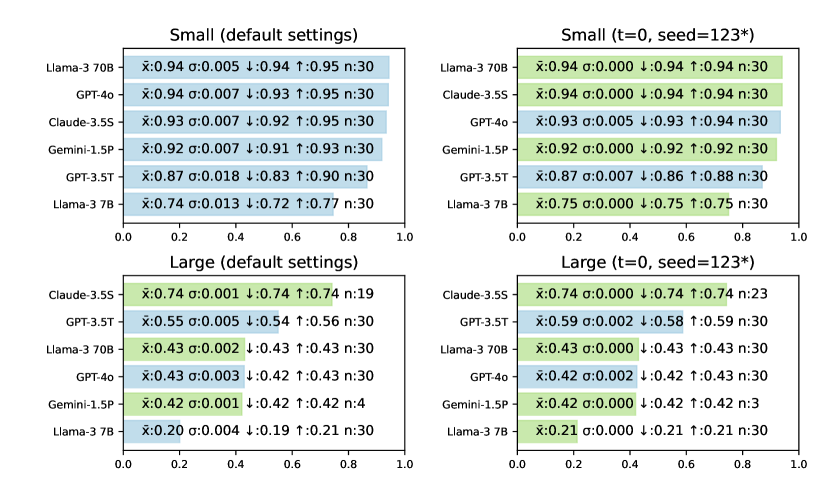
Figure 2 shows summary information for each of the models tested.
The following Python code was used to compute the 95% prediction interval.