First results from a search for axionlike dark matter using octupole-deformed nuclei in a crystal
Abstract
Most of the matter in the universe is in the form of dark matter. However, dark matter has never been observed to interact with normal matter in laboratory experiments. ALPs – ultralight axionlike particles – are a class of dark matter models that are consistent with astrophysical constraints, and produce measurable signatures in the form of oscillating violations of discrete symmetries in nuclei. We report the first results from a search for oscillating parity-odd time-reversal-odd nuclear moments of 153Eu ions in a crystal, which leads to an experimental constraint on the ALP-gluon coupling strength across a wide band of ALP masses.
Astrophysical observations indicate that the majority of matter in the universe is dark matter [1]. However, dark matter has only been observed to interact gravitationally with ordinary matter, and no other interactions with Standard Model particles have been measured [2].
Out of the many models for the cold dark matter within galaxies, ultralight axionlike particles (ALPs) are a well-motivated and viable subset [3, 4, 5]. When ALPs interact with gluons within atomic nuclei, they induce nuclear moments that are odd under parity (P) and time-reversal (T) symmetries, and that oscillate in time [6]. Experiments sensitive to P-odd T-odd nuclear moments – such as searches for permanent electric dipole moments (EDMs) of particles – can detect these oscillations. For example, broadband laboratory bounds on the ALP-gluon coupling strength in the mass range below eV have been obtained from neutron EDM experiments [7, 8]. The HfF+ electron EDM experiment [9] and a series of frequency comparison experiments [10, 11, 12, 13, 14, 15, 16] also provide bounds, which, although less stringent than the bounds from neutron EDM experiments, nevertheless offer useful cross-checks using different physical systems.
In this work, we probe oscillatory P-odd T-odd nuclear moments using precision spectroscopy of octupole-deformed nuclei in a crystal (ONIX). Our measurement method builds upon the search for static nuclear T-violation proposed in Ref. [17]. We use europium-153 (nuclear spin ), a stable isotope with an octupole-deformed nucleus that has a large, collectively enhanced, P-odd T-odd nuclear Schiff moment induced by ALPs [18, 19].
Triply-charged europium ions doped into a yttrium orthosilicate crystal (Eu:YSO) are located at non-centrosymmetric crystal sites, where their charge distribution is strongly electrically polarized by the neighboring ions in the crystal. In these trapped, polarized europium ions, the Schiff moment interacts with the electron density gradient near the nucleus, causing nuclear spin states to shift in energy. These characteristic energy shifts depend on the relative orientation of the nuclear spin vector, , and the electric dipole moment of the polarized atom, . Observation of an oscillating energy shift proportional to is the signature of an oscillatory P-odd T-odd nuclear moment, such as would be produced by ALPs.
Crucially, Eu:YSO contains an equal number of Eu3+ sites with oppositely-directed vectors, distributed throughout the crystal. These sets of oppositely-polarized ions form two ensembles whose ALP-induced energy shifts oscillate precisely out of phase. Meanwhile, the shifts of these two ensembles due to magnetic fields (including stray fields and spurious backgrounds) are identical and in phase. Therefore comparing measurements between the oppositely-polarized ions provides an accurate means to separate ALP signals from magnetic-field-induced systematic errors [20].
Furthermore, the narrow transition of Eu3+ enables optical state control of the europium ions, which leads to fast state preparation, low-noise readout of the nuclear spin states, and simultaneous interrogation of the oppositely-polarized ensembles. Finally, the large number of Eu3+ ions in available in the crystal results in high sensitivity to ALP signals.
To quantify the above discussion, we note that ALPs result in a time-varying value of the dimensionless parameter of quantum chromodynamics (QCD) [6].
| (1) |
Here is the gluon coupling constant ( for the QCD axion) [9], is the ALP field amplitude, is the ultra-high energy scale associated with ALP formation, and is the ALP mass [6]. The parameter in turn creates a nuclear Schiff moment in 153Eu given by
| (2) |
In an electrically polarized Eu3+ ion with dipole moment , the effective Hamiltonian describing the T-odd energy shifts of the nuclear spin states is , where is the ratio of the permanent atomic EDM to the nuclear Schiff moment for Eu3+ [4], and is the equivalent electric field that would have to be applied to the ion to induce in it a dipole moment . The magnitude of the equivalent electric field for the polarized Eu3+ ions in Eu:YSO crystal is estimated to be GV/cm (see Supplemental Material Section I), aligned along the axis of the YSO crystal (denoted as in the following).
Combining the equations above, the effective Hamiltonian for the nuclear spin states is
| (3) |
In our experiment, the P-odd T-odd frequency shift due to is measured. The oscillating part of this frequency shift yields the ALP-gluon coupling strength .
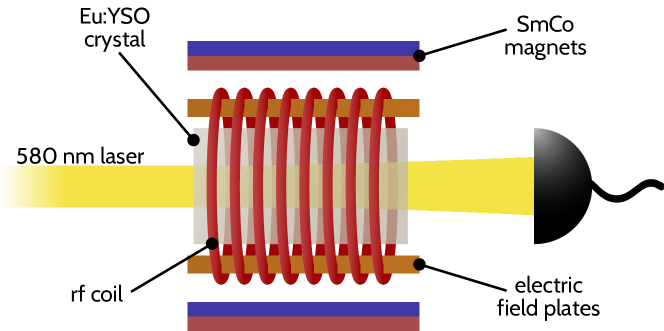
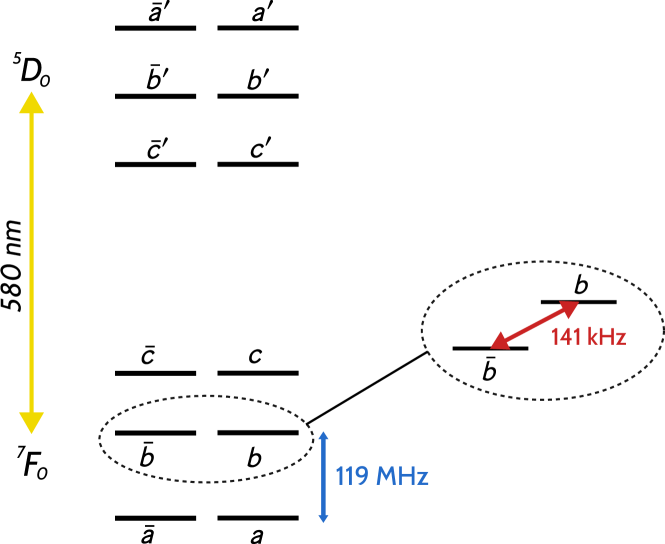
A schematic diagram of the experiment is shown in Fig. 1, and Fig. 2 shows the relevant energy levels and their labels. Measurements were made on a YSO crystal doped with 153Eu3+ at 0.01% concentration. The crystal, , was attached to a cold plate and maintained at . A pair of copper plates adjacent to the crystal were used to apply an electric field, , along the axis. A coil was used to generate radio-frequency (rf) magnetic fields along the axis (parallel to the axis of the crystal). This doubly-resonant coil was used to apply rf fields in a band around to drive the nuclear spin transition in the electronic ground state for state preparation, and to apply fields in a band around to drive the transition for precision spectroscopy. SmCo permanent magnets were used to apply a static magnetic field G across the Eu:YSO crystal; we chose this value of in order to adequately separate the and resonances around 119.2 MHz.
We probed ions at “site 1” in Eu:YSO, where the optical transition is at [22]. The inhomogeneously-broadened linewidth of the optical transition in our sample was , and the linewidth of the spectral anti-holes used for our measurements were typically 1 MHz. When an electric field is applied to the crystal, the spectral anti-holes for the oppositely-polarized ion ensembles shift in opposite directions, by an amount proportional to their respective orientations relative to the crystal axis, . We used an electric field , which produces a spectral shift [3] for the ensembles, to distinguish the optical absorption features from oppositely-polarized ions and extract .
The experiment sequence begins with an optical pumping pulse that sweeps through the resonance [9]. This pulse clears out the population of spectroscopic classes that are unused in the experiment, and creates a flat background for absorption measurements. Next, is turned on, and optical pulses tuned to the and resonances pump ions into the states using the spectral hole burning methods described in Refs. [25, 9]. The electric field is turned off for the subsequent steps, so that the optical absorption features from the ions become separated by 6.6 MHz and can be separately measured. Optical probe pulses tuned to the resonances determine the background absorption level through the crystal for normalization. An adiabatic rf sweep across the transition moves ions out of the state, leaving ions initialized in the state.
Two rf spectroscopy pulses at a carrier frequency , separated by and with a relative phase , are applied to drive the transition. We then apply a second adiabatic sweep over the transition, which transfers the ions in to . Finally, optical probe pulses tuned to are used to measure absorption lines as before, yielding a signal proportional to the population transferred to the state by the spectroscopy pulses. A timing diagram of the measurement sequence is shown in Fig. 3.

To precisely measure the resonance frequency, , we use a modified Ramsey method that yields improved control over systematic errors [26, 27, 28]. In each cycle, we perform measurements for 8 different values of between 0 and . The corresponding absorption signal, versus , is fit to a sinusoid processed to extract the resonance frequency [26]. The values of are separately recorded for the ensembles and denoted as .
The resonance frequency can be expressed as
| (4) |
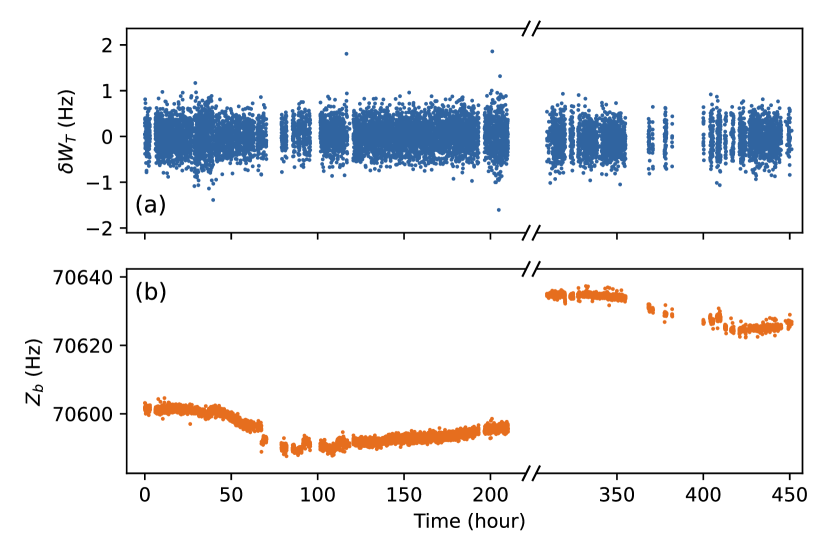
where is the Zeeman shift of the state due to the applied magnetic field, and the P-odd T-odd quantity is the expectation value of the nuclear spin projection onto the direction of . Based on the Zeeman and hyperfine structure constants measured in Refs. [8, 9], we evaluate , see Supplemental Material Section II. The time-varying T-violating shift, , and Zeeman shift, , determined from , are shown as a function of measurement time in Fig. 4. As the interval between samples of is non-uniform (due to occasional laser frequency jumps and experiment pauses), we use the Lomb-Scargle periodogram [30] to determine its power spectral density.
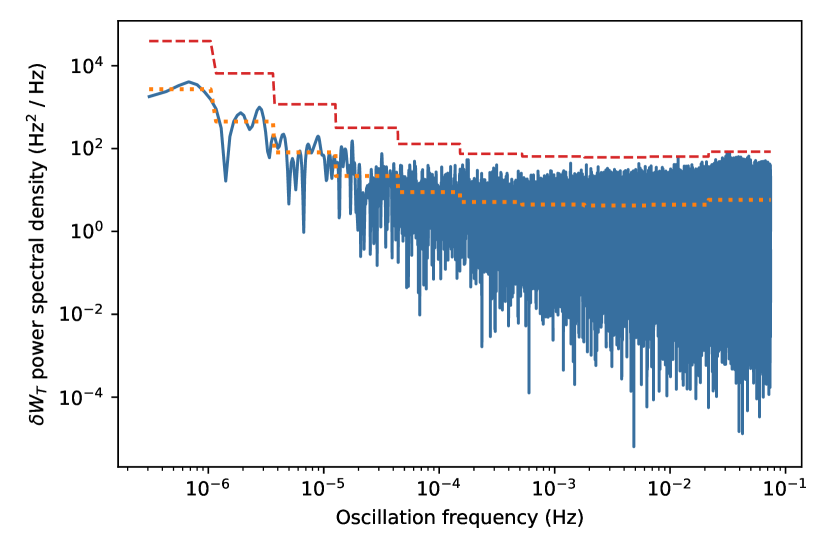
The periodogram frequencies are sampled uniformly from (half the inverse of the experiment duration, s ) to (half the inverse of the experiment cycle time, s) in 603316 steps. The power spectral density of is shown in Fig. 5. To determine the non-ALP background in the power spectrum, we split the spectrum into 10 log-spaced bins such that the noise power in each bin is approximately frequency-independent. As the ALP field is expected to be coherent with a quality factor of [31], the bandwidth of a possible ALP signal is much smaller than the bin bandwidth for each of the bins. Therefore, we use the average power in each frequency bin to build an exponential distribution to search for significant excess power due to ALP-induced oscillations. A 95% confidence level limit derived from the exponential distribution is shown in Fig. 5.
The 95% confidence limits on oscillations can be used to place a bound on ALP-gluon coupling using Eq. 3. However, we have to consider corrections due to the experiment cycle time and the stochastic nature of the ALP field amplitudes [9, 32]. First, for oscillation frequencies comparable to or greater than , the oscillation amplitudes would be underestimated due to downsampling in each experiment cycle. We generated sinusoidal data at different frequencies based on the experiment timestamps, accounting for the experiment cycle time, and computed the power spectrum at the measured frequencies. This yields a calibration curve for the experimental sensitivity as a function of oscillation frequency which is used to scale the exclusion range, similar to the method used in Ref. [9]. Second, the ALP coherence time is approximately times the oscillation period, which is comparable to or greater than the measurement time used in this work for frequencies between and . Therefore the ALP oscillations must be corrected for a stochastic bias. The ALP field amplitude, , follows a Rayleigh distribution whose root-mean-square value is , assuming the ALP is the dominant source contributing to local dark matter with density GeV/cm3 [33, 8]. We increase the deterministic model ALP-gluon coupling bound by a factor of 3 to account for stochasticity following Ref. [32]. The resulting bound, smoothed with a Savitzky-Golay filter for ease of visualization [34], is shown in Fig. 6. The value of that enters Eq. 3 was calculated to be 3.7 in Ref. [18] and 0.15 in Ref. [19]. We use the geometric mean of these two values, 0.74 , to construct the solid line for the exclusion plot shown in Fig. 6, and the difference between these values as the uncertainty band. This bound improves the constraints placed by previous atomic [10, 11, 12, 13, 14, 15, 16] and molecular [9] experiments.

In summary, we have performed precision measurements that constrain oscillatory symmetry-violation in octupole-deformed nuclei in a crystal, leading to a broadband bound on the parameter space of axionlike dark matter. Higher experimental precision is anticipated in the future, from apparatus upgrades to increase the nuclear spin coherence time and reduce noise in the optical detectors. Our measurements also motivate nuclear structure experiments and calculations to resolve the theoretical uncertainty in for 153Eu.
Acknowledgments. We thank Yoshiro Takahashi, Jonathan Weinstein, Eric Hessels and Andrew Jayich for helpful discussions. Julia Ford and Daniel Stedman contributed to the construction of the initial apparatus, and Harish Ramachandran made significant contributions to developing the T-violation search concept. Bob Amos and Paul Woitalla provided vital technical support. M.F. acknowledges funding from a CQIQC Postdoctoral Fellowship, and A.R. acknowledges funding from a CQIQC Undergraduate Summer Research Award. This project was enabled by support from the John Templeton Foundation (Grant No. 63119), the Alfred P. Sloan Foundation (Grant No. G-2023-21045), and NSERC (SAPIN-2021-00025).
References
- [1] Planck Collaboration: N. Aghanim et al. Planck 2018 results. Astronomy & Astrophysics, 641, 2020.
- [2] Gianfranco Bertone and Tim MP Tait. A new era in the search for dark matter. Nature, 562(7725):51–56, 2018.
- [3] Lam Hui. Wave dark matter. Annu. Rev. Astron. and Astrophys., 59:247–289, 2021.
- [4] Elisa G. M. Ferreira. Ultra-light dark matter. The Astronomy and Astrophysics Review, 29(1):7, December 2021.
- [5] Francesca Chadha-Day, John Ellis, and David J. E. Marsh. Axion dark matter: What is it and why now? Science Advances, 8(8):eabj3618, February 2022.
- [6] Y.V. Stadnik and V.V Flambaum. Axion-induced effects in atoms, molecules, and nuclei. Phys. Rev. D, 89(4):043522, 2014.
- [7] C. Abel et al. Search for Axionlike Dark Matter through Nuclear Spin Precession in Electric and Magnetic Fields. Physical Review X, 7(4):041034, 2017.
- [8] Ivo Schulthess, Estelle Chanel, Anastasio Fratangelo, Alexander Gottstein, Andreas Gsponer, Zachary Hodge, Ciro Pistillo, Dieter Ries, Torsten Soldner, Jacob Thorne, and Florian M. Piegsa. New Limit on Axionlike Dark Matter Using Cold Neutrons. Physical Review Letters, 129(19):191801, November 2022.
- [9] Tanya S. Roussy, Daniel A. Palken, William B. Cairncross, Benjamin M. Brubaker, Daniel N. Gresh, Matt Grau, Kevin C. Cossel, Kia Boon Ng, Yuval Shagam, Yan Zhou, Victor V. Flambaum, Konrad W. Lehnert, Jun Ye, and Eric A. Cornell. Experimental Constraint on Axionlike Particles over Seven Orders of Magnitude in Mass. Physical Review Letters, 126(17):171301, April 2021.
- [10] A. Hees, J. Guéna, M. Abgrall, S. Bize, and P. Wolf. Searching for an Oscillating Massive Scalar Field as a Dark Matter Candidate Using Atomic Hyperfine Frequency Comparisons. Physical Review Letters, 117(6):061301, August 2016.
- [11] Colin J. Kennedy, Eric Oelker, John M. Robinson, Tobias Bothwell, Dhruv Kedar, William R. Milner, G. Edward Marti, Andrei Derevianko, and Jun Ye. Precision Metrology Meets Cosmology: Improved Constraints on Ultralight Dark Matter from Atom-Cavity Frequency Comparisons. Physical Review Letters, 125(20):201302, November 2020.
- [12] Takumi Kobayashi, Akifumi Takamizawa, Daisuke Akamatsu, Akio Kawasaki, Akiko Nishiyama, Kazumoto Hosaka, Yusuke Hisai, Masato Wada, Hajime Inaba, Takehiko Tanabe, and Masami Yasuda. Search for Ultralight Dark Matter from Long-Term Frequency Comparisons of Optical and Microwave Atomic Clocks. Physical Review Letters, 129(24):241301, December 2022.
- [13] Nathaniel Sherrill, Adam O Parsons, Charles F A Baynham, William Bowden, E Anne Curtis, Richard Hendricks, Ian R Hill, Richard Hobson, Helen S Margolis, Billy I Robertson, Marco Schioppo, Krzysztof Szymaniec, Alexandra Tofful, Jacob Tunesi, Rachel M Godun, and Xavier Calmet. Analysis of atomic-clock data to constrain variations of fundamental constants. New Journal of Physics, 25(9):093012, September 2023.
- [14] Xue Zhang, Abhishek Banerjee, Mahapan Leyser, Gilad Perez, Stephan Schiller, Dmitry Budker, and Dionysios Antypas. Search for Ultralight Dark Matter with Spectroscopy of Radio-Frequency Atomic Transitions. Physical Review Letters, 130(25):251002, June 2023.
- [15] Abhishek Banerjee, Dmitry Budker, Melina Filzinger, Nils Huntemann, Gil Paz, Gilad Perez, Sergey Porsev, and Marianna Safronova. Oscillating nuclear charge radii as sensors for ultralight dark matter, 2023.
- [16] Hyungjin Kim, Alessandro Lenoci, Gilad Perez, and Wolfram Ratzinger. Probing an ultralight QCD axion with electromagnetic quadratic interaction. Physical Review D, 109(1):015030, January 2024.
- [17] H. D. Ramachandran and A. C. Vutha. Nuclear T-violation search using octopole-deformed nuclei in a crystal. Phys. Rev. A, 108:012819, 2023.
- [18] V. V. Flambaum and H. Feldmeier. Enhanced nuclear Schiff moment in stable and metastable nuclei. Phys. Rev. C, 101(1):015502, January 2020.
- [19] O. P. Sushkov. Schiff moments of deformed nuclei. Physical Review C, 110(1):015501, 2024.
- [20] Bassam Nima, Mingyu Fan, Aleksandar Radak, and Amar Vutha. Comagnetometry using oppositely-polarized Eu3+ ions in a crystal. in preparation.
- [21] V. V. Flambaum and V. A. Dzuba. Electric dipole moments of atoms and molecules produced by enhanced nuclear Schiff moments. Phys. Rev. A, 101(4):042504, April 2020.
- [22] Flurin Könz, Y. Sun, C. W. Thiel, R. L. Cone, R. W. Equall, R. L. Hutcheson, and R. M. Macfarlane. Temperature and concentration dependence of optical dephasing, spectral-hole lifetime, and anisotropic absorption in :. Phys. Rev. B, 68:085109, Aug 2003.
- [23] S. Zhang, N. Lučić, N. Galland, R. Le Targat, P. Goldner, B. Fang, S. Seidelin, and Y. Le Coq. Precision measurements of electric-field-induced frequency displacements of an ultranarrow optical transition in ions in a solid. Appl. Phys. Lett., 117(22):221102, 2020.
- [24] Emmanuel Zambrini Cruzeiro, Jean Etesse, Alexey Tiranov, Pierre-Antoine Bourdel, Florian Fröwis, Philippe Goldner, Nicolas Gisin, and Mikael Afzelius. Characterization of the hyperfine interaction of the excited state of . Phys. Rev. B, 97:094416, Mar 2018.
- [25] R. M. Macfarlane and R. M. Shelby. Coherent transient and holeburning spectroscopy of rare earth ions in solids. In A. A. Kaplyanskii and R. M. Macfarlane, editors, Spectroscopy of Solids Containing Rare Earth Ions, volume 21, pages 51–184. 1987.
- [26] A. C. Vutha and E. A. Hessels. Frequency-offset separated oscillatory fields. Physical Review A, 92(5):052504, November 2015.
- [27] K. Kato, T. D. G. Skinner, and E. A. Hessels. Ultrahigh-precision measurement of the triplet fine structure of atomic helium using frequency-offset separated oscillatory fields. Phys. Rev. Lett., 121:143002, 2018.
- [28] N Bezginov, T Valdez, M Horbatsch, A Marsman, AC Vutha, and EA Hessels. A measurement of the atomic hydrogen lamb shift and the proton charge radius. Science, 365(6457):1007–1012, 2019.
- [29] Ryuzi Yano, Masaharu Mitsunaga, and Naoshi Uesugi. Nonlinear laser spectroscopy of Eu3+:Y2SiO5 and its application to time-domain optical memory. Journal of the Optical Society of America B, 9(6):992, June 1992.
- [30] Jacob T. VanderPlas. Understanding the Lomb–Scargle Periodogram. The Astrophysical Journal Supplement Series, 236(1):16, May 2018.
- [31] Joshua W. Foster, Nicholas L. Rodd, and Benjamin R. Safdi. Revealing the dark matter halo with axion direct detection. Physical Review D, 97(12):123006, June 2018.
- [32] Gary P. Centers, John W. Blanchard, Jan Conrad, Nataniel L. Figueroa, Antoine Garcon, Alexander V. Gramolin, Derek F. Jackson Kimball, Matthew Lawson, Bart Pelssers, Joseph A. Smiga, Alexander O. Sushkov, Arne Wickenbrock, Dmitry Budker, and Andrei Derevianko. Stochastic fluctuations of bosonic dark matter. Nature Communications, 12(1):7321, December 2021.
- [33] Riccardo Catena and Piero Ullio. A novel determination of the local dark matter density. Journal of Cosmology and Astroparticle Physics, 2010(08):004–004, August 2010.
- [34] Abraham Savitzky and M. J. E. Golay. Smoothing and Differentiation of Data by Simplified Least Squares Procedures. Analytical Chemistry, 36(8):1627–1639, July 1964.
- [35] Ciaran O’Hare. cajohare/AxionLimits: AxionLimits, July 2020.
I Equivalent electric field
Eu3+ ions are electrically polarized by their neighboring ions in the YSO crystal. The equivalent electric field, , interacts with the permanent EDM of Eu3+ ions induced by the nuclear Schiff moment to produce the measured T-violating frequency shift , as described in Eq. 3 in the main text.
To date, there have not been any calculations of in Eu:YSO. The nuclear Schiff-moment-induced energy shift in EuCl3:6H2O was calculated in Ref. [1], from which we can estimate in EuCl3:6H2O. The value of in Eu:YSO is then obtained by scaling the EuCl3:6H2O equivalent electric field using the ratio of the experimentally-measured Stark shift coefficients of these two systems [2, 3].
In EuCl3:6H2O, the nuclear Schiff moment of 153Eu shifts the ion energy levels by
| (S1) |
according to Ref. [1]. This energy shift is based on an estimated nuclear Schiff moment of . The permanent electric dipole moment of the 153Eu3+ ion induced by the nuclear Schiff moment is [4]
| (S2) |
The differential Stark shift coefficient for the optical transition is
| (S4) |
where is the differential dipole scalar polarizability of the transition, and is a local field correction factor with being the relative permittivity of the crystal [5].
II Nuclear spin projections
In this section we evaluate the Eu3+ nuclear spin projection along the crystal D1 axis, , which is used in Eq. 4 of the main text. The hyperfine and Zeeman Hamiltonian for the nuclear spin degree of freedom in the ground electronic state in Eu:YSO is
| (S6) |
where G is the magnetic field, is the quadrupole tensor, and is the gyromagnetic tensor [7]. The quadrupole tensor for the ground electronic state of 153Eu:YSO is reported in Ref. [8]. The gyromagnetic tensor has only been measured for the state of 151Eu () in YSO [9]. We scale the 151Eu:YSO tensor by the ratio of the nuclear magnetic dipole moments of 153Eu and 151Eu [10], to estimate the tensor for 153Eu:YSO. The nuclear spin eigenstates are obtained from diagonalization of the above Hamiltonian. The projections of the nuclear spins along the , , and dielectric axes of the crystal are shown in Table S1.
| -1.48 | -0.96 | 1.72 | |
| 1.48 | 0.96 | -1.72 | |
| -0.75 | -0.03 | 0.91 | |
| 0.75 | 0.03 | -0.91 | |
| -0.05 | 0.20 | 0.33 | |
| 0.05 | -0.20 | -0.33 |
References
- [1] A. O. Sushkov, O. P. Sushkov, and A. Yaresko. Effective electric field: Quantifying the sensitivity of searches for new P,T-odd physics with EuCl3:6H2O. Phys. Rev. A, 107(6):062823, June 2023.
- [2] R. L. Ahlefeldt, D. L. McAuslan, J. J. Longdell, N. B. Manson, and M. J. Sellars. Precision Measurement of Electronic Ion-Ion Interactions between Neighboring Eu 3 + Optical Centers. Physical Review Letters, 111(24):240501, December 2013.
- [3] S. Zhang, N. Lučić, N. Galland, R. Le Targat, P. Goldner, B. Fang, S. Seidelin, and Y. Le Coq. Precision measurements of electric-field-induced frequency displacements of an ultranarrow optical transition in ions in a solid. Appl. Phys. Lett., 117(22):221102, 2020.
- [4] V. V. Flambaum and V. A. Dzuba. Electric dipole moments of atoms and molecules produced by enhanced nuclear Schiff moments. Phys. Rev. A, 101(4):042504, April 2020.
- [5] Rose Ahlefeldt. Evaluation of a stoichiometric rare earth crystal for quantum computing. PhD thesis, The Australian National University, 2013.
- [6] N. C. Carvalho, J-M. Le Floch, J. Krupka, and M. E. Tobar. Multi-mode technique for the determination of the biaxial Y2SiO5 permittivity tensor from 300 to 6 K. Applied Physics Letters, 106(19):192904, May 2015.
- [7] J. J. Longdell, M. J. Sellars, and N. B. Manson. Hyperfine interaction in ground and excited states of praseodymium-doped yttrium orthosilicate. Physical Review B, 66(3):035101, June 2002.
- [8] Ryuzi Yano, Masaharu Mitsunaga, and Naoshi Uesugi. Nonlinear laser spectroscopy of Eu3+:Y2SiO5 and its application to time-domain optical memory. Journal of the Optical Society of America B, 9(6):992, June 1992.
- [9] Emmanuel Zambrini Cruzeiro, Jean Etesse, Alexey Tiranov, Pierre-Antoine Bourdel, Florian Fröwis, Philippe Goldner, Nicolas Gisin, and Mikael Afzelius. Characterization of the hyperfine interaction of the excited state of . Phys. Rev. B, 97:094416, Mar 2018.
- [10] N.J. Stone. Table of Nuclear Magnetic Dipole and Electric Quadrupole Moments. Technical Report INDC(NDS)–0658, International Atomic Energy Agency (IAEA), Vienna, February 2014.