Efficient Microscopic Image Instance Segmentation
for Food Crystal Quality Control *
††thanks: * THIS MATERIAL IS BASED UPON WORK SUPPORTED BY THE NATIONAL SCIENCE FOUNDATION UNDER GRANT NO. 2134667.
Abstract
This paper is directed towards the food crystal quality control area for manufacturing, focusing on efficiently predicting food crystal counts and size distributions. Previously, manufacturers used the manual counting method on microscopic images of food liquid products, which requires substantial human effort and suffers from inconsistency issues. Food crystal segmentation is a challenging problem due to the diverse shapes of crystals and their surrounding hard mimics. To address this challenge, we propose an efficient instance segmentation method based on object detection. Experimental results show that the predicted crystal counting accuracy of our method is comparable with existing segmentation methods, while being five times faster. Based on our experiments, we also define objective criteria for separating hard mimics and food crystals, which could benefit manual annotation tasks on similar dataset.
Index Terms:
Image Processing, Instance SegmentationI Introduction
Microscopic images play an important role in manufacturing crystallization process assessment, including food and electronic products [1, 2, 3]. The product we analyzed in this paper is a food product in liquid form; and microscopic images are captured at each step of the processing pipeline for quality control. The quality of samples captured by a microscope is related to the size and density of food crystals. Previously, manufacturers count crystals manually and estimate the crystal density with the naked eye. Food crystals in the microscopic images are similar to some noise or blurry objects, which is difficult for people to handle consistently during manual counting. To save time and keep the analysis process consistent, an automatic and accurate crystal segmentation program is necessary for the microscopic image analysis.
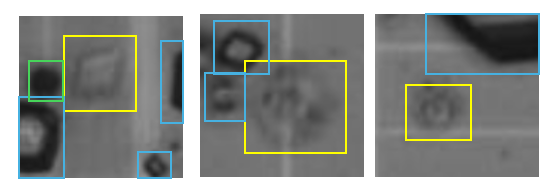
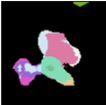
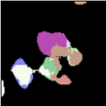
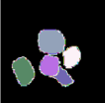
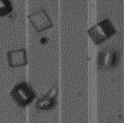
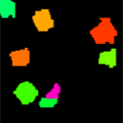
The image processing program proposed in [4] is an earlier approach to deal with images captured by a low-resolution microscope. As the device has been updated, the image resolution is increased and the parameters of the image processing program have not been adapted to the new images. In this paper, we explore deep learning methods to improve the prediction accuracy. However, pre-trained instance segmentation models using public datasets such as ImageNet [5] dataset and DSB2018 dataset [6] do not work well on our data. Our dataset is annotated into three classes: air bubbles, hard mimics, and crystals, where air bubbles can be easily separated. Hard mimics represent the out-of-focus objects, noise, and airborne dust in the images. The hard mimics are of various shapes and similar size as the real crystals, as shown in Fig. 1.
For consistent manual annotation, setting the criteria to distinguish hard mimics and food crystals is very important. However, the experiences of long-time trained operators are not written into standards. In this paper, we set fixed criteria about the definition of hard mimics to help us understand the difference between crystals and hard mimics, and maintain the consistency of manual ground truth labeling. All the criteria are learned from the experimental descriptions of the manufacturers and these criteria can also benefit similar microscopic dataset annotation.
The data we used is named the seed count food crystal dataset. The “Seed Count” stage is the first stage of all the processing steps, which is the most important one for manufacturers to decide whether an early stop is needed if the product is of bad quality. The most significant assessment item is the crystal counts per square millimeter, while the size of the crystals and the area covered by crystals are also essential for quality control. In this paper, we use deep learning based method to improve the prediction accuracy of these metrics.
Deep learning has been widely used in image instance segmentation in recent years [7, 8, 9]. Image instance segmentation separates objects of the same class and predicts a pixel-wise mask for each object. The existing image segmentation methods such as Mask R-CNN [9], Mask-scoring R-CNN [10], and Stardist [11] outperform the prior image processing method we used [4]. However, the inference process of the segmentation methods is slow. To speed up the prediction and improve the counting accuracy, we explored a detection-based method and designed a post-processing program to segment crystals pixel-wisely. The prediction accuracy of our proposed method improves somewhat over the existing segmentation methods; and it is much more efficient in terms of computation time.
II Related Work
In this section, we review existing works related to image instance segmentation and food crystal image analysis.
II-A Instance segmentation
Image segmentation maps one image into the pixel-wise mask of different object classes inside. Instance segmentation, one sub-task of image segmentation, predicts objects from the same class into individual masks instead of one mask. It has been used in both 2D and 3D image analysis areas such as medical image segmentation [12, 13], virtual reality [14, 15], autonomous driving [16, 17] and so on. Due to the remarkable achievement of deep neural networks, in this section, we focus on the instance segmentation methods using deep learning technology.
Instance segmentation can be separated into “detect and segment” models and directly segment models. One-step segmentation models predict pixel-wise instance masks directly based on the latent representatives learned by the backbone network. Stardist [11] is a widely used method for nuclei instance segmentation. The model combines a U-net architecture with fully connected layers to predict the polygon shape object probability and distance from the edge to the object center.
The “detect and segment” models predict the bounding box region of objects first with object detection model, and then pixel-wisely segment the output masks. For example, Mask R-CNN [9] predicts the object bounding box with the region proposal network, and then highlights the box region of the predicted feature maps for classification and pixel-wise segmentation. Further, Mask-scoring R-CNN [10] is proposed to improve the prediction details, which calibrates the inaccurate mask confidence score by estimating the quality of each predicted instance mask. In our paper, we use a different method to realize the “detect and segment” idea. The object detection and pixel-wise segmentation are separated. We combine the deep learning object detection method, You Only Look Once (Yolo) framework [18], with image processing segmentation techniques to improve the prediction accuracy.
II-B Food crystal image analysis
Food crystal samples are mostly found in liquid and solid food products, such as milk, cheese, and sugar [19, 20, 21]. The automatic image analysis results not only provide valuable evaluation metrics but also benefit crystallization process prediction [22, 23]. The crystals in the microscopic images of each product have different shapes and size distributions. It is hard to directly apply a model developed for one food crystal image dataset to a different food crystal image dataset. Existing segmentation works related to food crystal image analysis can be split into image processing methods and deep learning methods. For example, ASSugarNet has been proposed [20] to improve overlapping crystal prediction with a pyramid deep neural network. Other studies such as [19, 4] implement automatic image processing pipelines to realize image segmentation. In our study, we focus on predicted counting accuracy instead of overlapped crystal sizes, and prior image processing works achieve poor results compared to existing deep learning segmentation methods.
III Method
In this section, we describe our model architecture including the object detection model and the post processing module.
III-A Object detection model
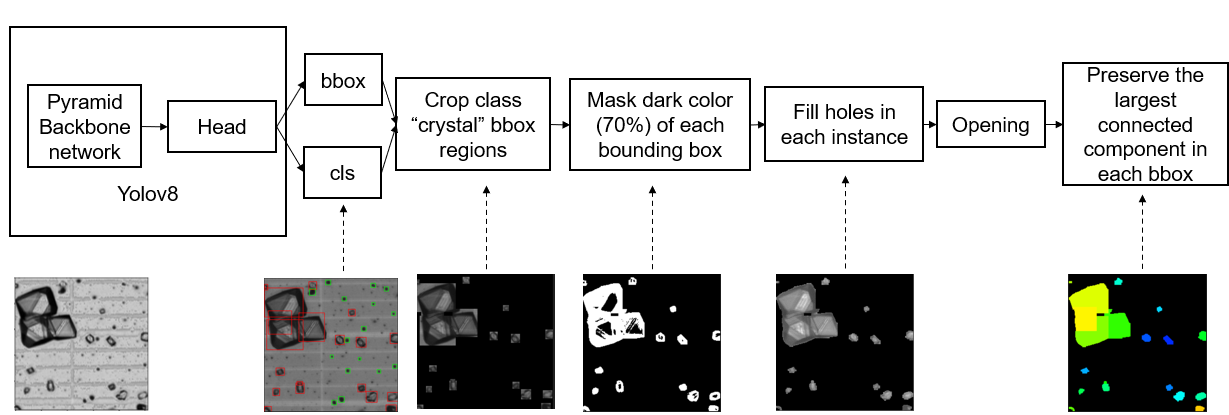
Yolov8 is used here as the object detection model [18]. As shown in Fig. 2, the architecture includes a five-layer pyramid backbone network and a Yolov8 head that extracts the output features of the top three layers in the backbone network. The predicted bounding box (bbox) belongs to one of the three classes (cls): crystal, hard mimic, and air bubble.
III-B Post processing
The post-processing pipeline shown in Fig. 2 includes five parts. We process the crystal class predictions and crop out the bounding box areas. To separate the background color and the crystal edges, binarization is applied by assigning the 70% darkest pixels within each bbox region as 1 and others as 0. This is an experimental threshold we tested on our dataset. Next, we perform a set of morphological operations. We use an infilling operation to fill the holes inside the edges of crystals. After this step, the extracted edges for each crystal are thicker than the actual edges, so we use an opening operation to remove the extra edge pixels. Finally, since each bbox can include the boundary or corner of other crystals, we only preserve the largest connected component in each bbox to remove the residual areas.
IV Dataset and Manual Annotation Criterion
IV-A Seed count food crystal dataset
The dataset we used was captured from a high-resolution microscope device during the seed count manufacturing stage. The liquid product is dropped on one slide of glass and covered with another. During this operation, inevitable air pockets and dust particles form between the glass and the liquid, which generates air bubbles and some of the hard mimics.
There are two datasets we used in this study. Dataset 1 is a pixel-wise labeled dataset comprising 171 training images and 96 test images, each sized 256256. All the annotations were completed by one operator, encompassing all three classes: crystal, hard mimic, and air bubble. Dataset 2 only includes the total ground truth crystal counts of each image instead of pixel-wise labels, consisting of 35 images with size 15362048, which were generated by a more experienced operator different from the operator who generated the Dataset 1 annotations. Because there is potential individual bias in the annotations of the first dataset, we use the second dataset to validate our results.
IV-B Manual annotation criteria
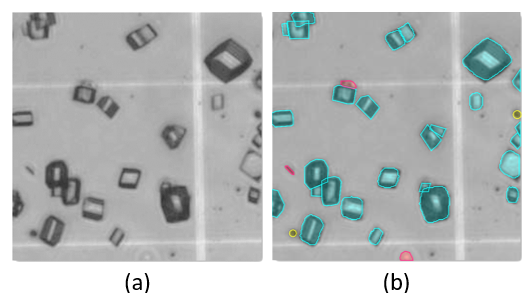
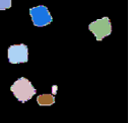
As shown in Fig. 3, the instances marked with blue are crystals while those marked with red are hard mimics. Hard mimics have blurry edges or non-polygon shapes, but the difference between hard mimics and crystals needs additional differential criteria. The criteria we set are listed below:
-
•
Hard mimics have a non-polygon shape with at least one edge invisible or blurry
-
•
An object with all faint edges is a hard mimic
-
•
Small items with no openings in them are hard mimics
-
•
Items on the boundary with no openings and very small items are hard mimics
All the criteria are derived from the descriptions of experienced operators. The “non-polygon shape” in the first bullet and “small items” in the third bullet of the criteria are used to separate crystals from out-of-focus items and noise.
V Experiments


V-A Experimental Setting
We compared our method with several existing image segmentation methods. All the models are trained using the training images from Dataset 1 (171 images with size 256256), given ground truth labels of the three classes. The training and testing processes are performed on an NVIDIA GeForce GTX 1080 Ti GPU.
We trained the detection model with 1000 epochs using the Adam optimizer [24] with , and . The learning rate was initialized as 0.01. The box loss gain was set at 7.5, and the class loss gain at 0.5. The scale of the model is Yolov8 large.
V-B Quantitative Results
We test the models on the 96 test images in Dataset 1. As shown in Table. I, there are five evaluation metrics used. The three metrics on the left are the measurements that manufacturers pay attention to. CntAcc represents counting accuracy, CovErr represents the crystal-covered area error, and SizeErr represents the mean crystal size error in the units of micronmeters. The detailed equations are listed in (LABEL:eq:1). The last two metrics are segmentation accuracy metrics; and both used an intersection over union (IoU) confidence threshold of 50%. mAP50 represents mean average precision, recall50 is the recall metric.
| (1) | ||||
In Equation (LABEL:eq:1), is the number of test images. and are the predicted and ground truth crystal counts, respectively. and are the predicted and ground truth crystal-covered area of each image. and are the predicted and ground truth average crystal size of each image.
| Models | CntAcc (%) | CovErr (%) | SizeErr | mAP50 (%) | recall50 (%) |
|---|---|---|---|---|---|
| Mask RCNN [9] | 81.865 | 2.576 | 1.295 | 74.61 | 82.76 |
| Mask-s RCNN [10] | 89.941 | 1.548 | 1.365 | 80.76 | 82.06 |
| Stardist [11] | 76.849 | 1.962 | 1.551 | 89.86 | 68.86 |
| Yolov8 segm [18] | 92.915 | 1.263 | 2.367 | 74.57 | 91.45 |
| Ours | 92.573 | 1.050 | 1.330 | 83.29 | 87.01 |
As shown in Table I, the bolded numbers are the best value for each metric, and the under-lined numbers are the second-best value. Segmentation models (first four models in Table I) have different performances due to the difference in model architectures. We focus on analyzing the difference between our method and segmentation models.
For the most important metric CntACC, the Yolov8 segmentation model achieves the best performance while our method is the second-best performing one. The detection module of our method is trained on the bounding box labels, which focuses on crystal location prediction. CntAcc metric represents the accuracy of the detection module. Compared to segmentation models (first four models in Table I) trained on pixel-wise instance labels, our experiment shows that the detection module requires less information from the ground truth and achieves similar performance on the CntAcc metric.
However, the Yolov8 segmentation model has a worse performance on the CovErr and SizeErr metrics than ours, as shown in Table I. These metrics are also highly related to the food crystal quality. The CovErr and SizeErr metrics of our method benefit from the post-processing module. Compared to segmentation models that directly predict pixel-wise masks, our two-step architecture efficiently segments pixel-wise information in the second step and achieves comparable results to other methods.
The last two columns in Table I measure instance-wise segmentation accuracy, mAP50 represents the percentage of predicted crystals that are accurate while recall50 represents the percentage of true crystals that are predicted. There is a trade-off between mAP50 and recall50, and either being low is a strong weakness. Compared to the segmentation models, our method balances the two metrics by separating detection and pixel-wise segmentation. The detection module accurately predicts the location of instances, while post-processing achieves high IoU between instances.
In general, our method has the best or the second-best performance for all the metrics, while other methods have their obvious shortcomings.
To evaluate our method more objectively, we test on the 35 images in Dataset 2. Table II shows the quantitative results of the best three models from previous experiments. The crystal count accuracy of our method is also the highest of all the methods.
V-C Processing Time Comparison
The time consumption of different methods is evaluated on the GPU that was indicated previously as the platform used for the experiments. We test the best-performing three models in Section V-B. The existing segmentation methods take 32-37 seconds for one image of size 15362048, as shown in Table III, while our proposed method takes only 5.94 seconds. The object detection model takes 3.67 seconds, and the post-processing pipeline takes 1.82 seconds. The processing time of the proposed method is about five to six times faster than the existing segmentation methods.
V-D Qualitative Comparison
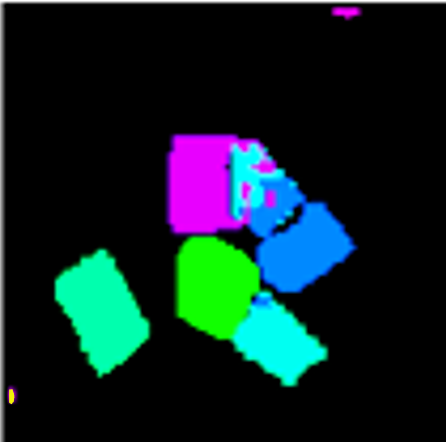
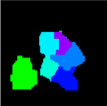
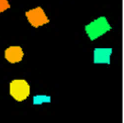
In this section, we visually compare the segmentation results of different methods. There are five prediction results in Fig. 4. Fig. 4(a) and Fig. 4(h) are the original images. Fig. 4(b) and Fig. 4(i) are the ground truth labeled images. From the frist row, we compare the number of crystals in the cluster. Fig. 4(c) and Fig. 4(d), which are the results of Mask RCNN [9] and Mask-scoring RCNN [10], include more crystals than the ground truth. The Stardist [11] result shown in Fig. 4(e) has one crystal missing. The Yolov8 segmentation [18] result shown in Fig. 4(f) includes two small hard mimics on the top and left edges. In the result image of our method (Fig. 4(g)), the number of crystals matches with the ground truth. In the second row, Fig. 4(j) and Fig. 4(k) incorrectly detected a bubble. Fig. 4(l) has one crystal missing on the right side of the image, while Fig. 4(m) has one missing on the bottom. To conclude, our method has a higher counting accuracy than other methods.
V-E Limitation and Future Works
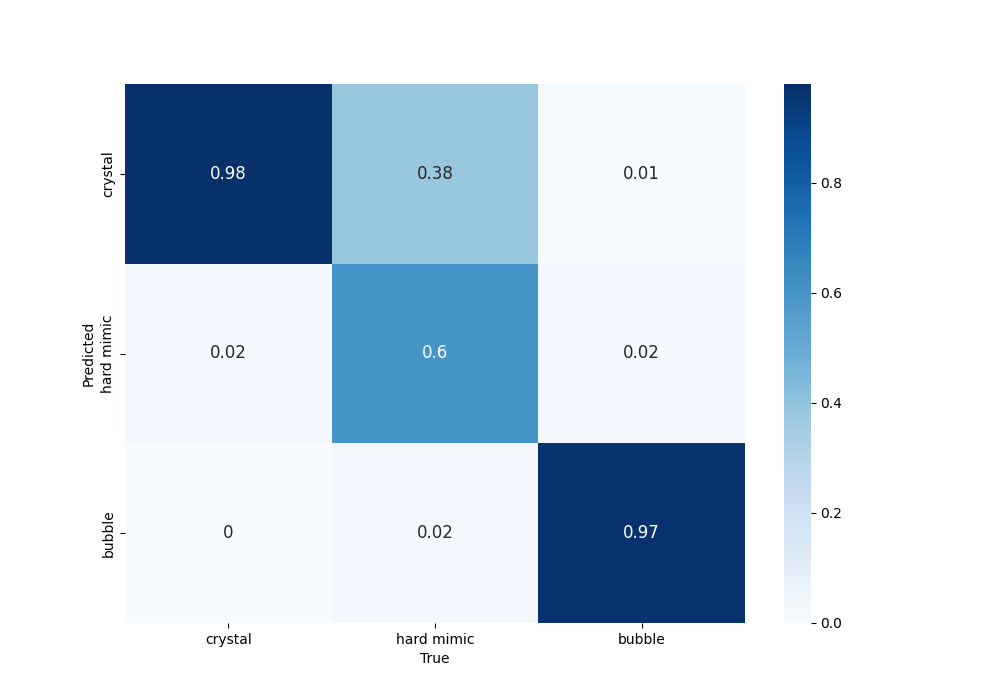
Our proposed method has the following two limitations. First, the object detection classification accuracy can be further improved. As shown in Fig. 5, the prediction accuracy of the hard mimic class is much lower than that of the crystal class and the bubble class. The second limitation is that very large crystals fall outside the data distribution learned by the model, which are then predicted as multiple small pieces around the edges. This is an important issue to solve in our future work. We would further work on the images from the later stages of the manufacturing pipeline and address the crystal overlapping issue.
VI Conclusion and Future Work
In this paper, we propose an efficient food crystal microscopic image segmentation method. We improve the crystal counting accuracy, which is the most important metric that manufacturers care about, with our object detection based method. The architecture proposed combines existing detection deep neural networks with a post-processing image processing module. The processing time is five to six times faster than the existing segmentation methods. The program proposed benefits the daily life of the manufacturer with whom we are collaborating.
References
- [1] S. Chao, Y. Yen, Y. Song, Y. Chen, H. Wu, and N. Wu, “A study on the interior microstructures of working sn particle electrode of li-ion batteries by in situ x-ray transmission microscopy,” Electrochemistry Communications, vol. 12, no. 2, pp. 234–237, 2010.
- [2] Z. Zhu, Q. Zhou, and D. Sun, “Measuring and controlling ice crystallization in frozen foods: A review of recent developments,” Trends in Food Science and Technology, vol. 90, pp. 13–25, 2019.
- [3] H. Kiani and D. Sun, “Water crystallization and its importance to freezing of foods: A review,” Trends in Food Science and Technology, vol. 22, no. 8, pp. 407–426, 2011.
- [4] Q. Liang, A. Shakouri, and J. Allebach, “Analysis of food processing crystal images,” Electronic Imaging, vol. 35, pp. 196–1, Jan. 2023.
- [5] J. Deng, W. Dong, R. Socher, L. Li, L. Kai, and F. Li, “Imagenet: A large-scale hierarchical image database,” 2009 IEEE Conference on Computer Vision and Pattern Recognition, pp. 248–255, 2009.
- [6] J. C. Caicedo, A. Goodman, K. W Karhohs, B. A. Cimini, J. Ackerman, M. Haghighi, C. Heng, T. Becker, M. Doan, C. McQuin, M. Rohban, S. Singh, and A. E. Carpenter, “Nucleus segmentation across imaging experiments: the 2018 data science bowl,” Nature methods, vol. 16, no. 12, pp. 1247–1253, 2019.
- [7] W. Gu, S. Bai, and L. Kong, “A review on 2d instance segmentation based on deep neural networks,” Image and Vision Computing, vol. 120, pp. 104401, 2022.
- [8] Y. Zhang, Y. Liu, K. Nie, J. Zhou, Z. Chen, J. Chen, X. Wang, B. Kim, R. Parajuli, R. S. Mehta, M. Wang, and M. Su, “Deep learning-based automatic diagnosis of breast cancer on MRI using mask R-CNN for detection followed by ResNet50 for classification,” Academic Radiology, vol. 30, pp. S161–S171, 2023.
- [9] K. He, G. Gkioxari, P. Dollár, and R. Girshick, “Mask R-CNN,” IEEE International Conference on Computer Vision, pp. 2961–2969, 2017.
- [10] Z. Huang, Licha L. Huang, Y. Gong, C. Huang, and X. Wang, “Mask scoring R-CNN,” IEEE/CVF Conference on Computer Vision and Pattern Recognition, pp. 6409–6418, 2019.
- [11] U. Schmidt, M. Weigert, C. Broaddus, and G. Myers, “Cell detection with star-convex polygons,” International Conference on Medical Image Computing and Computer Assisted Intervention, pp. 265–273, Sep. 2018.
- [12] Y. Zhou, O. F. Onder, Q. Dou, E. Tsougenis, H. Chen, and P. Heng, “Cia-net: Robust nuclei instance segmentation with contour-aware information aggregation,” Information Processing International Conference in Medical Imaging, pp. 682–693, Jun. 2019.
- [13] Z. Qian, K. Li, M. Lai, E. I. Chang, B. Wei, Y. Fan, and Y. Xu, “Transformer based multiple instance learning for weakly supervised histopathology image segmentation,” International Conference on Medical Image Computing and Computer-Assisted Intervention, pp. 160–170, 2022.
- [14] H. Zhang, G. Luo, Y. Tian, K. Wang, H. He, and F. Wang, “A virtual-real interaction approach to object instance segmentation in traffic scenes,” IEEE Transactions on Intelligent Transportation Systems, vol. 22, no. 2, pp. 863–875, 2020.
- [15] L. Han, T. Zheng, L. Xu, and L. Fang, “OCCUSEG: Occupancy-aware 3d instance segmentation,” IEEE/CVF Conference on Computer Vision and Pattern Recognition, pp. 2940–2949, 2020.
- [16] D. Zhou, J. Fang, X. Song, L. Liu, J. Yin, Y. Dai, H. Li, and R. Yang, “Joint 3d instance segmentation and object detection for autonomous driving,” IEEE/CVF Conference on Computer Vision and Pattern Recognition, pp. 1839–1849, 2020.
- [17] E. Mohamed, M. Ewaisha, M. Siam, H. Rashed, S. Yogamani, W. Hamdy, M. El-Dakdouky, and A. El-Sallab, “Monocular instance motion segmentation for autonomous driving: Kitti INSTANCEMOTSEG dataset and multi-task baseline,” IEEE Intelligent Vehicles Symposium (IV), pp. 114–121, 2021.
- [18] G. Jocher, A. Chaurasia, and J. Qiu, “Yolo by ultralytics,” GitHub, Jan. 2023, Available online: https://github.com/ultralytics/ultralytics (accessed on 12 January 2023).
- [19] A. B. Schumacher, A. H. Englert, J. B. Susin, L. D. F. Marczak, and N. S. M. Cardozo, “An automated measuring methodology for crystal size in sweetened condensed milk using digital image processing and analysis,” Food Analytical Methods, vol. 8, pp. 1858–1867, 2015.
- [20] X. Wu, Y. Meng, J. Zhang, J. Wei, and X. Zhai, “Amodal segmentation of cane sugar crystal via deep neural networks,” Journal of Food Engineering, vol. 348, pp. 111435, 2023.
- [21] G. Impoco, L. Tuminello, N. Fucà, M. Caccamo, and G. Licitra, “Segmentation of structural features in cheese micrographs using pixel statistics,” Computers and Electronics in Agriculture, vol. 79, no. 2, pp. 199–206, 2011.
- [22] O. Velazquez-Camilo, E. Bolaños-Reynoso, E. Rodriguez, and J. Alvarez-Ramirez, “Characterization of cane sugar crystallization using image fractal analysis,” Journal of Food Engineering, vol. 100, no. 1, pp. 77–84, 2010.
- [23] W. L. Wu, M. M. Mills, U. Schacht, C. Rabinowitz, V. Vlachos, and Z. K. Nagy, “Sensor fusion and calibration-based adaptive image analysis procedure for in situ crystal size measurement,” Crystal Growth & Design, vol. 23, no. 10, pp. 7076–7089, 2023.
- [24] D. P. Kingma and J. Ba, “Adam: A method for stochastic optimization,” International Conference for Learning Representations, p. 13, 2014.