Discovering New Shadow Patterns for Black-Box Attacks on Lane Detection of Autonomous Vehicles
Abstract.
Ensuring autonomous vehicle (AV) security remains a critical concern. An area of paramount importance is the study of physical-world adversarial examples (AEs) aimed at exploiting vulnerabilities in perception systems. However, most of the prevailing research on AEs has neglected considerations of stealthiness and legality, resulting in scenarios where human drivers would promptly intervene or attackers would be swiftly detected and punished. These limitations hinder the applicability of such examples in real-life settings. In this paper, we introduce a novel approach to generate AEs using what we term negative shadows: deceptive patterns of light on the road created by strategically blocking sunlight, which then cast artificial lane-like patterns. These shadows are inconspicuous to a driver while deceiving AV perception systems, particularly those reliant on lane detection algorithms. By prioritizing the stealthy nature of attacks to minimize driver interventions and ensuring their legality from an attacker’s standpoint, a more plausible range of scenarios is established. In multiple scenarios, including at low speeds, our method shows a high safety violation rate. Using a 20-meter negative shadow, it can direct a vehicle off-road with a 100% violation rate at speeds over 10 mph. Other attack scenarios, such as causing collisions, can be performed with at least 30 meters of negative shadow, achieving a 60-100% success rate. The attack also maintains an average stealthiness of 83.6% as measured through a human subject experiment, ensuring its efficacy in covert settings.
1. Introduction
Autonomous vehicles (AVs) have revolutionized the transportation sector, promising reduced human errors, improved traffic congestion, and enhanced fuel efficiency. However, this complexity in technology introduces several vulnerabilities. Recent works have explored these vulnerabilities, exposing security flaws in sensor systems and perception algorithms, demonstrating successful attacks that manipulate sensor data or fool object detection (Sun et al., 2020; Han et al., 2022). AVs interconnectedness and reliance on complex networks further amplify these risks, as system tampering or unauthorized manipulations within the convoluted setup could result in catastrophic consequences, such as accidents with potentially fatal injuries.
To systematically address the security concerns surrounding AVs, it is imperative to establish a standardized framework for these self-driving systems. The Society of Automotive Engineers (SAE) systematically categorizes AVs based on their degree of automation from Levels 0-5. Within this framework, technologies such as Automated Lane Centering (ALC) play a crucial role in enhancing AV safety and reliability. ALC, a Level-2 driving automation technology, ensures consistent lane-keeping by fine-tuning a vehicle’s steering based on speed and position (Becker et al., 2018). Widely adopted by manufacturers such as Tesla with their Autopilot system (Tesla, Inc, 2023), and Mercedes-Benz with the Drive Pilot (Mercedes-Benz USA, 2023), ALC systems rely on accurate lane detection (LD) technologies to function effectively. LD is a fundamental and non-trivial task within ALC systems (Dai et al., 2020). Primarily viewed as a vision task (Huval et al., 2015; Lee et al., 2017), LD plays a pivotal role in the driving operations of AVs. Traditionally, LD algorithms utilized handcrafted and highly-specialized filters for the extraction of low-level lane features (Aly, 2008; Chiu and Lin, 2005; Gonzalez and Ozguner, 2000; Neven et al., 2018; Pan et al., 2018; Revilloud et al., 2016). However, progress in computer vision, particularly deep learning (DL) models, have significantly enhanced LD capabilities, providing improved robustness, especially in complex environmental conditions (Pan et al., 2018).
ALC systems leverage LD information to maintain lane centering, improving safety and control in lateral vehicle movements. However, their reliance on accurate LD algorithms, often employing machine learning (ML) and DL models (Yang, 2023), introduces a vulnerability to attacks (Goodfellow et al., 2014; Kurakin et al., 2018). DL models are vulnerable to attacks that leverage slight changes to the input during testing (Biggio et al., 2012; Papernot et al., 2017; Szegedy et al., 2013). The modified inputs are known as adversarial examples (AE), and these modifications have no impact on how humans observe but can adversely affect the perception system of an AV toward misclassification. Recent research aim to identify if a malicious attacker can deceive the LD algorithms in the ALC system by altering the environment captured by an AV’s camera (Boloor et al., 2019; Sato et al., 2021; Cao et al., [n. d.]). Our objective is to execute a physical-world attack on the ALC system by targeting the camera sensor without directly tampering with the vehicle.
Despite existing literature focusing on attacks on perception systems in AV (Sato et al., 2021; Jing et al., 2021; Zhu et al., 2021a; Sun et al., 2020), our focus is on generating AEs that adhere to being (i) stealthy, (ii) practical, and (iii) legal. Stealthiness is crucial, requiring the attack to either remain imperceptible to a human driver or not immediately identifiable as a malicious act targeting the AV. For autonomous vehicles of Levels 1-3, humans are still effectively driving and need to engage with the steering wheel and pedals at all times. With virtually all vehicles being Level 3 and below (Buchholz and Richter, 2023) in the foreseeable future, it is obvious that AEs require to be stealthy to humans to avoid a takeover of the vehicle which would void the attack. Furthermore, practicality becomes necessary to ensure the attack is feasible and easily replicable in real-world scenarios without significant implementation challenges. For instance, a physical road patch as proposed by prior works restricts replicability and thus reduces practicality of the attack. Lastly, aligning with legal principles increases the chances of an adversary executing and easily replicating the attack scenario, as they will have a lower chance to get detected and prevented by law enforcement, a factor often overlooked in previously proposed attacks. This comprehensive approach ensures that the attack is functional, reproducible, and hazardous due to its concealed but lawful nature. This paper proposes a remote physical-world attack that leverages physical benign objects in the environment to generate Negative Shadow (NS), i.e., non-shaded or brighter area inside shadowy regions, that successfully deceives the perception of an AV. The attack is remote since it does not require any physical perturbations of the road pavement.
This paper makes the following contributions:
-
1.
Practicality, Stealthiness, and Legality of the Negative Shadow Attack. We introduce the Negative Shadow (NS) Attack (see Section 5), a novel and covert method within AV systems. The NS Attack utilizes an appropriate object such as canopy or fence positioned on private property to cast an NS. This approach does not only demonstrate the practicality of the NS Attack but also highlights its stealthiness and confirms that executing this attack is within legal boundaries and does not violate any laws or regulations, leveraging private property rights ((2024), MCC).
-
2.
Exploiting a Common Vulnerability in LD Algorithms. To make the NS Attack possible, we exploit a widespread vulnerability in the preprocessing of LD algorithms (Zhu et al., 2021b). This vulnerability allows for the effective execution of the NS Attack without requiring in-depth knowledge of ALC systems. Our systematic evaluation confirms that NSes explore the impact of various parameters on the misdetection by LD algorithms, leading them to incorrectly identify the NS as a genuine lane marking.
-
3.
Evaluating Attack Effectiveness and Safety Implications. We assess the safety implications of the NS Attack using two methods: (1) software-in-the-loop simulation and (2) miniature road testing with Openpilot (Comma.ai, 2023) off-vehicle. Our results demonstrate that NS Attack can cause a high violation rate in various scenarios, even at low vehicle speeds. For instance, the NS attack can steer the victim vehicle off the road with a violation rate of 100% at any speed faster than 10 mph with a Negative Shadow length of 20m. Other attack scenarios, such as forcing vehicle collisions, can be performed at longer Negative Shadow lengths of at least 30m with a 60-100% success rate.
-
4.
Assessing the Stealthiness of NS Attack through Human Studies. The effectiveness of the NS Attack crucially depends on its stealthiness. To evaluate this, we conducted a human study experiment aimed at empirically assessing the subtlety of the NS attack and its potential to go unnoticed by drivers. The study confirms the challenge for drivers in detecting the NS Attack, highlighting its stealth and effectiveness in real-world scenarios.
2. Background
Autonomous Driving (AD). AD systems are structured modularly, consisting of sensing, perception, planning, and actuation components, collectively enabling vehicles to navigate autonomously (Schwarting et al., 2018). Sensors like cameras for RGB video and LiDAR for 3D point clouds capture the environment. The perception module refines this data using ML models trained on diverse datasets to identify, track, and predict nearby objects (Song et al., 2023; Zhang et al., 2022). The planning module, assisted by automated lane centering technology, determines the vehicle’s path.
It combines path exploration and navigation planning algorithms, including lane changes and overtaking, optimizing the vehicle’s path and avoiding stationary obstacles. In autonomous driving systems (ADS), the control subsystem becomes critical after planning. It precisely follows the planned trajectory by adjusting the vehicle’s throttle, brake, and steering according to the path and navigation strategies from the planning phase. This control aspect integrates sophisticated strategies for longitudinal and lateral adjustments, ensuring the vehicle stays on its intended path and responds effectively to changing road conditions (Samak et al., 2021).
SAE Autonomy Levels. SAE defines six levels of driving automation for AVs, adopted by the US Department of Transportation. In contrast to Levels 1/2 (L1/L2) autonomy, L3 and higher AVs have a more comprehensive sensor suite, including Lidars and ultrasonic sensors. This extensive array of sensors provides a broader and more detailed understanding of the vehicle’s surroundings, making attacks or failures in LD/ALC systems less likely to result in safety violations. The redundancy and variety of data from other sensors and systems allow the vehicle to compensate for defects in LD/ALC, maintaining safety and preventing violations.
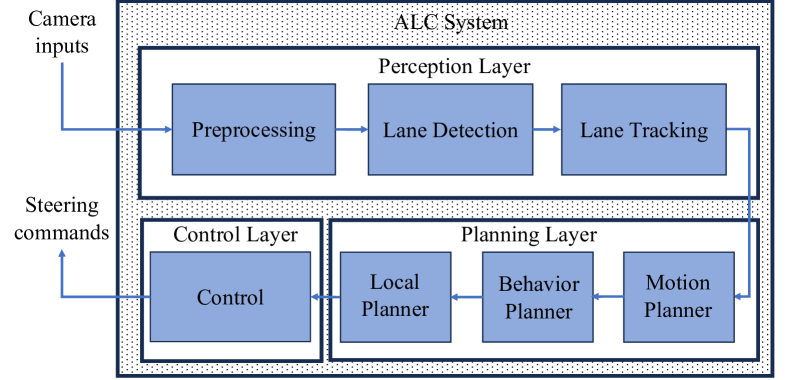
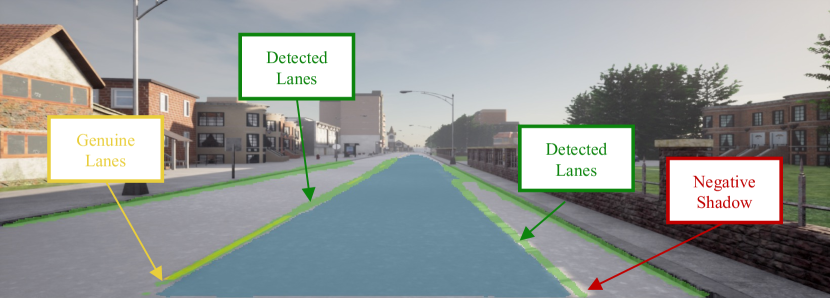
Automated Lane Centering (ALC). A typical ALC system design (see Fig.1) operates in three steps (Sato et al., 2021). First, the process begins with preprocessing camera inputs in the perception layer. This includes steps like estimating Maximum-likelihood Gaussian (Gopinath, 1998) parameters for LD, supplemented by techniques such as mean-shift segmentation (Michel et al., 2014), grayscale conversion (Grundland and Dodgson, 2007), edge detection with a modified Canny edge detector (Canny, 1986), concluding with hyperbola pair fitting (Cheng et al., 2008). For structured road environments, it then uses Eigenvalue Decomposition Regularized Analysis (EDRDA) in conjunction with previously extracted lane-marking information for precise lane detection (Yenikaya et al., 2013). Finally, the system involves continuous lane tracking, a key component of advanced driver assistance systems. The lane tracking algorithm actively adjusts the vehicle’s direction and position in real-time, based on a predefined motion model that predicts the vehicle’s future position, considering parameters such as current speed, direction, and steering inputs (Kumar and Simon, 2015).
After this perception task, the motion planning algorithms of the vehicle calculate an optimal future trajectory (to Artificial Intelligence, 2023). Lastly, the control layer simply executes the trajectory produced by the planner as actuation commands in the form of steering angle changes. The range of these changes is limited by the physical constraints of mechanical control units to ensure driving stability and safety (Becker et al., 2018).
3. Related Work
Several studies focus on attacking LD algorithms, affecting AV navigation. Boloor et al. (Boloor et al., 2019) demonstrated an end-to-end attack using simple physical manipulations, such as painting black lines on roads, to alter AV paths. Sato et al. (Sato et al., 2021) proposed an adversarial perturbation on a road patch that swerves an AV off-lane. Jing et al. (Jing et al., 2021) refined this by solving an optimization problem for perturbation placement in the digital domain, then implementing it practically. Cao et al. (Cao et al., [n. d.]) identified the back of a vehicle as an effective attack vector and designed a practical attack against ALC with remote adversarial patches.
A recent study explores natural phenomena, such as shadows, as a stealthy attack vector. Zhong et al. (Zhong et al., 2022) proposed a shadow-based attack on the perception system of an AV, deceiving a CNN-based traffic sign recognition (TSR) model. However, their experiments were conducted in a controlled setting, focusing on traffic signs.
Table 1 compares various attacks, highlighting the operational criteria of each. The DRP attack, as proposed by Sato et al. (Sato et al., 2021), presents significant challenges. It requires physically printing out a long patch tailored for each specific AV and deploying street workers to apply it. This is particularly difficult on busy roads and constitutes a direct law violation because it involves attackers disguising themselves in worker suits to place the patch on the street. Such actions, including painting or altering road surfaces without authorization, are illegal (U.S. Department of Transportation, 2023). Similarly, the Black Strip Attack described by Boloor et al. (Boloor et al., 2019) is a direct law violation as it involves painting a dark patch directly onto the street, which is illegal (Group, 2024). However, the attack is practical and stealthy since it requires only basic materials to alter the road surface visually. The RAP-ALC attack designed by Cao et al. (Cao et al., [n. d.]) uses remote adversarial patches placed behind a vehicle. Although practical, as it does not require physical presence in the middle of the road, the large and easily detectable patch behind the car reduces its stealthiness. The attacker can execute this attack from their own vehicle, which places the attack in a legal gray area, as it does not involve altering public infrastructure directly. However, it is still visible to the victim, making it less effective in terms of stealth.
4. Attack Formulation
4.1. Threat Model
Attacker’s Goal. The primary objective of the attacker is to deceive the AVs’ perception system of L1/L2 vehicles (L1 typically refers to cars with basic automation features and L2 to those with advanced driver-assistance systems), leading to a misinterpretation of the road environment and a potential deviation from their intended path. These deviations from the designated driving route pose severe safety hazards, including:
-
1.
Driving off the road: Increases the risk of colliding with objects or vehicles outside the designated lanes, potentially leading to accidents, vehicle damage, and human injuries.
-
2.
Colliding with traffic dividers: Results in collisions with road curbs and barriers, posing a significant danger to vehicle occupants, causing damage to the vehicle, and potentially leading to traffic disruptions.
-
3.
Endangering pedestrians and cyclists: Poses a serious threat to pedestrians/cyclists on the route, leading to life-threatening accidents, severe injuries, legal consequences, and emotional trauma for all parties involved.
Method of Attack. According to data collected by HUD and Census in the 2017 American Housing Survey (AHS), 73 percent of U.S. households describe their neighborhood as either suburban or rural, with 52 percent identifying as suburban and 21 percent as rural (User, 2017). Properties in these areas are typically large enough to provide ample space for various activities. This means that the attacker can easily implement their methods on their property.
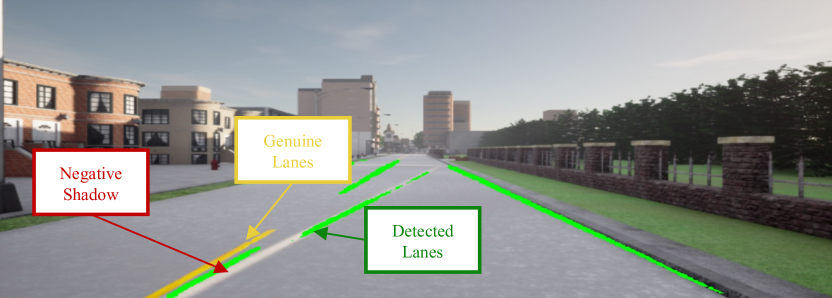
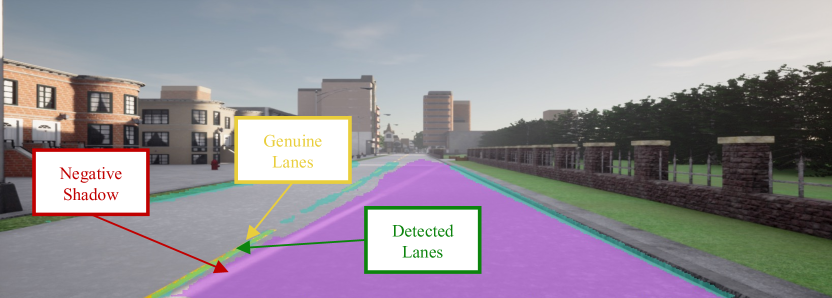
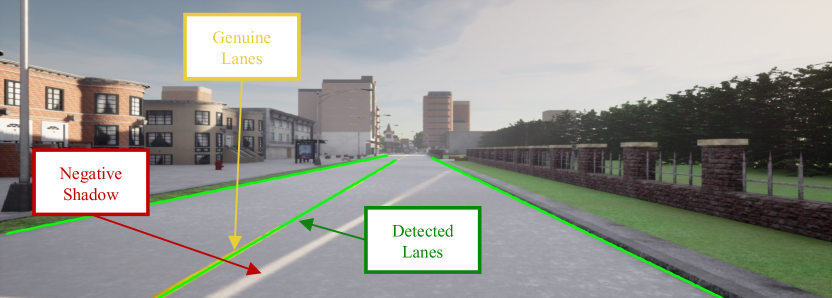
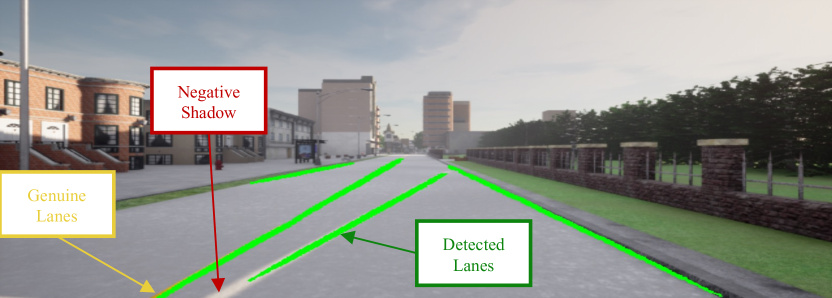
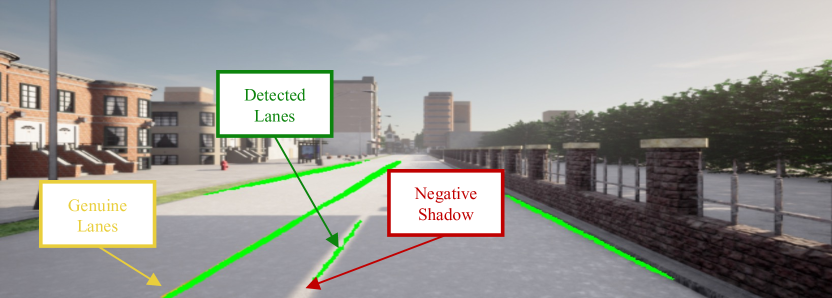
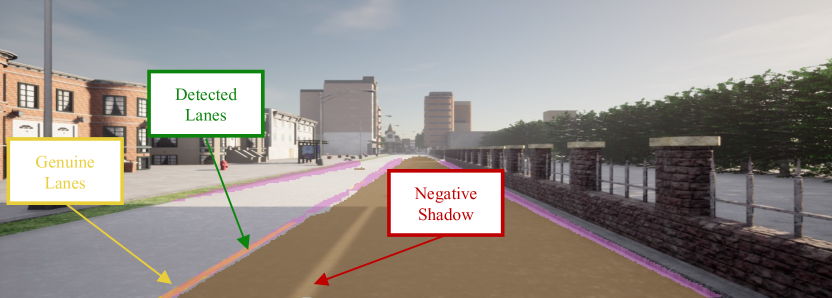
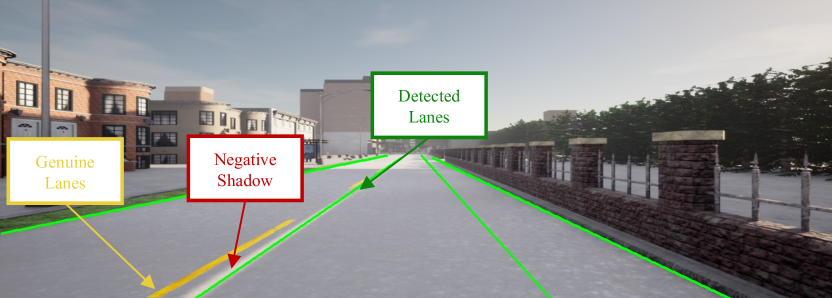
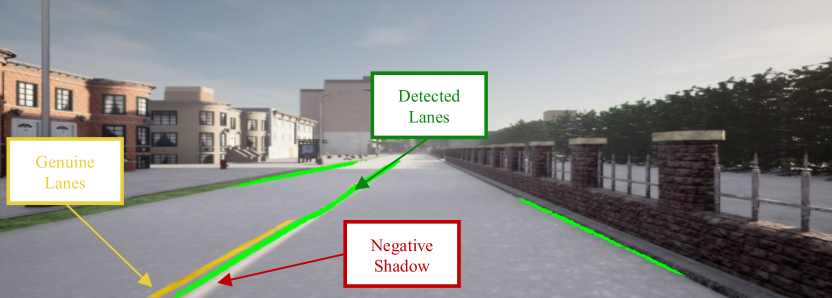
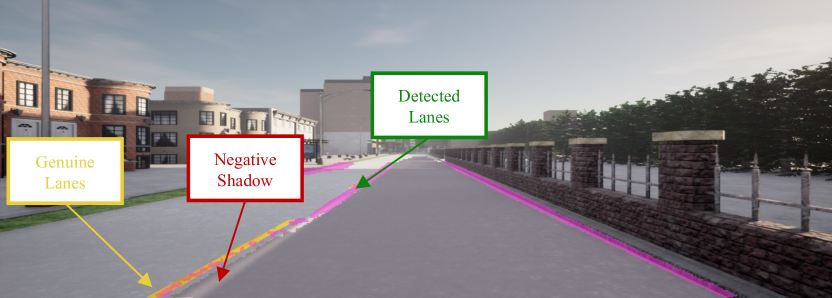
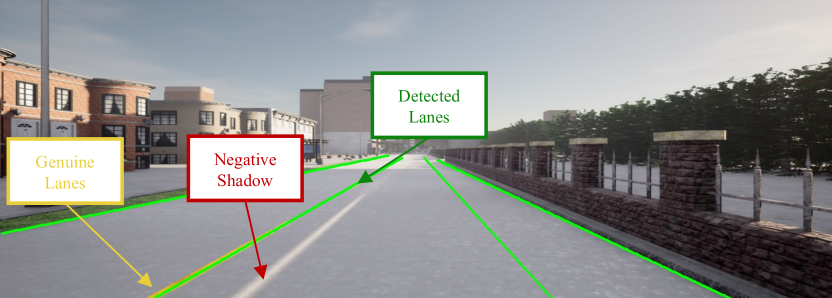
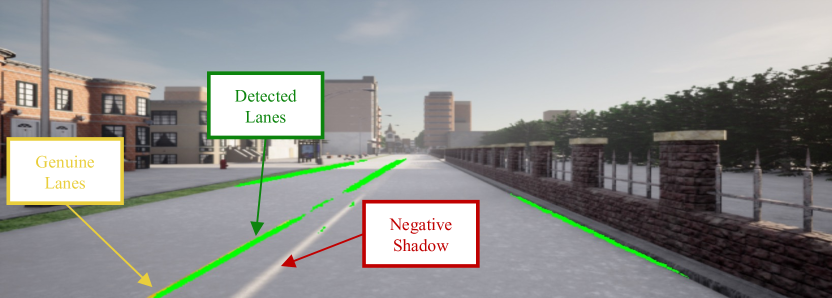
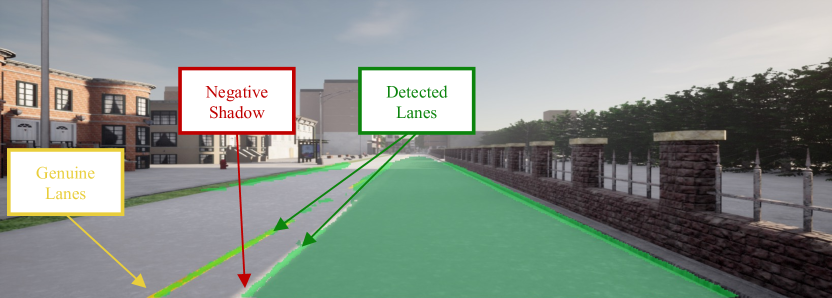
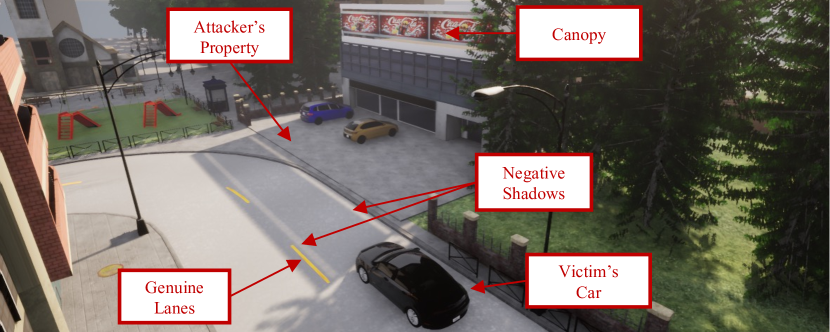
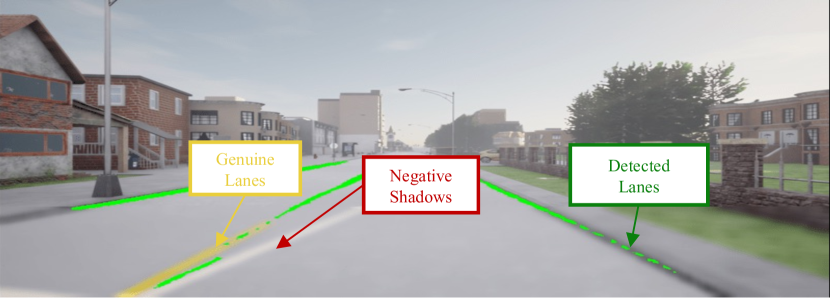
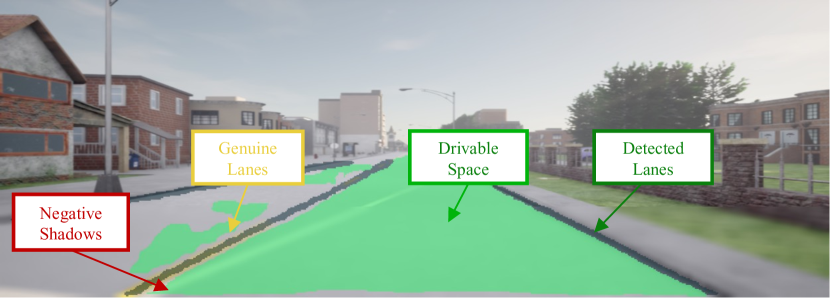
To execute this attack, the attacker strategically employs an object on their property to cast a shadow on the road using sunlight. The object features two rectangular holes, producing bright spots similar to lane markings within the shadowed area. This manipulation exploits the natural occurrence of shadows, a ubiquitous environmental phenomenon, ingeniously utilizing their property adjacent to the street, remarkably achieving this without violating any traffic rules or laws and ensuring their safety. Key element of this attack is the attacker making two parallel rectangular holes in any object. For example, the attacker can use a canopy positioned on top of the building, as depicted in Fig. 2, which casts two negative shadows (NSes) alongside the original lane markings, effectively concealing the attack. Alternatively, the attacker could create two rectangular holes in the fence located in front of their property to cast NSes. The sophistication of this attack lies in the challenge it poses for human drivers to distinguish these artificially created adversarial shadows from normal ones.
Shadow-Based Attack. The attacker will use a shadow-based attack compatible with real-world conditions, verified for feasibility and stealthiness through digital and physical experiments. The generated shadows replicate road lanes, providing an effective, practical method for attacking LD systems. This method is an indirect law violation — not breaking any legislation in the United States directly — since the attack can be executed from the attacker’s property, without needing to be physically present in the middle of the street. However, as shown later in this paper, this attack still causes safety violations for the victim’s car. As a result, this attack falls into a legal gray zone as it utilizes the attacker’s own property without breaking any laws directly or tampering with public infrastructure. Table 1 highlights that the shadow-based attack uniquely meets key operational criteria effectively.
Attack Conditions. We assume that the vehicles are driving within the legal speed limit of the street, and the attacker casts two NSes, long enough to influence the victims’ car’s movement within the speed zone. The attacker can use the canopy’s common appearance, which resembles a typical advertisement billboard strategically placed on private property, to preserve the attack’s inconspicuous and covert nature, ensuring it goes unnoticed.
Attacker Knowledge and Capabilities. The attacker does not require detailed knowledge of the victim’s ALC, taking advantage of a common weakness found in LD algorithms (see Section 4.2), making the approach both effective and challenging to detect.
Operational Timeframe and Effectiveness. For simplicity and without loss of generality, we assumed the front view of the house faces either east or west, and the attacker has the opportunity to launch their attack within the timeframe from sunrise to sunset, leveraging the property’s orientation to align with the path of the sun. Additionally, the road is aligned north-south, which is extremely common in grid patterns across the US. As an example, consider a house located at a latitude of 34°N and a longitude of 82°W with an object that is 10m long and positioned at a height of 10m. During the mid-winter day on December 22, the object can cast shadows ranging from 90 to 45m from 8 AM to 9 AM, and from 45 to 205m from 4 PM to 5 PM, depending on its orientation (either west or east facing). Similarly, on the mid-summer day of June 21, the shadows range from 95 to 45m from 7 AM to 8 AM, and from 40 to 85m from 7 PM to 8 PM (calculations detailed in Section 5.2).
4.2. Black-Box Treatment of LD Algorithms
LD algorithms, essential for autonomous driving and ADAS, are designed to identify and track lane boundaries on roadways marked by painted lines of varying patterns (Sheu et al., 2021). These algorithms commonly use edge detection techniques, such as the Sobel operator (Sobel, 1968) or the Canny edge detector (Canny, 1986), to extract lane markings (Zheng et al., 2019). Color-based thresholds are often incorporated (Yang et al., 2019), as lane markings typically appear as bright lines against the darker road background. Advanced LD algorithms may also integrate ML and deep learning methodologies (Ding et al., 2022), enhancing lane recognition precision. Geometric considerations, such as perspective transformations (Sheu et al., 2021), simplify the LD process by providing a bird’s-eye view of the road (Zakaria et al., 2023).
These features are not exclusive to any single LD algorithm but represent commonalities across a broad spectrum. For instance, edge detection is widely used due to its effectiveness in distinguishing sharp contrasts between lane markings and the surrounding environment. Thus, the attacker does not need to know the specific LD algorithm in the victim’s car. Instead, they can focus on a universally adopted pre-processing step found in many LD algorithms — removing or reducing shadows from sensor data (Hoang et al., 2017). This allows the attacker to craft an adversarial strategy targeting this widespread characteristic, treating LD algorithms as black-box entities. Consequently, the behavior in LD algorithms can be anticipated and shared vulnerabilities can be exploited by attackers, even without detailed knowledge of the specific algorithms used.
4.3. Design Considerations
During our investigation, we defined four key considerations for our novel attack. In this subsection, we focus on these considerations, which are crucial for ensuring the feasibility, effectiveness, practicality, and stealthiness of our approach in various scenarios.
C1. The LD algorithm incorporates a pre-processing step specifically designed to eliminate shadows. Shadows, resulting from environmental conditions such as sun position, cloud cover, or artificial lighting, can impact the visibility of road lanes. They introduce complexities that hinder automatic recognition and classification systems (Tran et al., 2010). Bright or dark illuminations can fragment a solid lane into disjointed segments, leading to misinterpretations such as a solid lane being recognized as dashed (Hoang et al., 2017; Zhao et al., 2022). Pronounced shadows can cause LD algorithms to overlook lane markings entirely (Liu et al., 2021b). To address these challenges, advanced LD algorithms incorporate image processing techniques (Honda and Uchida, 2023; Liu et al., 2021a; Che et al., 2023), including color space transformations (Starosolski, 2014; Bianco et al., 2012) and histogram equalization (Zimmerman et al., 1988), ensuring accurate lane detection regardless of lighting conditions.
C2. In terms of deployment time and associated expenses, many other attacks are often seen as inefficient and costly. The Dirty Road Patch (DRP) attack, as described by Sato et al. (Sato et al., 2021), exemplifies this design consideration. While the concept appears straightforward, implementing this attack is time-consuming and expensive. Producing patches is complex; each must be specifically engineered for different ALC systems, requiring a unique design for each vehicle type. This increases material costs and prolongs the design and testing phase. Deploying patches requires the attacker to physically access the target location, ideally during low-traffic periods to avoid detection and ensure safety, necessitating multiple site visits. Additionally, real-world conditions, such as changes in lighting or weather, can affect the patch’s effectiveness, potentially requiring further adjustments and reprinting.
Similarly, the Drone-LiDAR Exploit attack described by Zhu et al. (Zhu et al., 2021a), also poses significant financial and temporal constraints. Procuring and customizing drones can entail substantial financial investment, particularly if specialized equipment or modifications are needed. The use of reflective objects might further escalate costs. Preparing for this attack is time-consuming, involving identifying effective adversarial locations, setting up, calibrating, testing drones, and obtaining necessary permissions. Conducting preliminary observations and refining strategies through multiple trials further increases time commitments. Overall, the financial and temporal investments required for these attacks can be costly.
C3. From a legal perspective, conducting the majority of these attacks is explicitly prohibited by law. In the DRP attack (Sato et al., 2021), deploying deceptive road patches to mislead ALC systems is illegal, posing significant risks to vehicle occupants and other road users. This violates road safety standards and constitutes criminal impersonation in many states (Justia, 2023; USLegal, Inc., 2023). Similarly, the Drone-LiDAR Exploit attack (Zhu et al., 2021a) raises legal concerns due to FAA regulations (Federal Aviation Administration, 2023). Operating drones in restricted areas, especially near sensitive zones, contravenes legal standards and can lead to serious legal consequences, including civil penalties or certificate actions (P.A., 2023; Federal Aviation Administration, 2023). Overall, executing such attacks is unequivocally illegal and could result in severe legal repercussions.
C4. If the human is in the loop, obvious attacks will result in manual takeover and mitigation. To ensure the success of the NS Attack, the shadows it creates must go unnoticed by drivers, allowing AV systems to maintain control. In vehicles with SAE autonomy levels 1-3, where human intervention is required, drivers must remain alert and ready to take over if the autonomy stack fails (Synopsys, Inc, 2023). Detection of anomalies by drivers would undermine the attack’s effectiveness. A dedicated human study experiment has been conducted to evaluate the stealthiness of the NS Attack and its potential to evade detection by human drivers (see Section 8).
5. Negative Shadow (NS) Attack Design
5.1. Negative Shadow
To address C1, we developed the NS Attack targeting vulnerabilities in shadow detection and removal algorithms used in AVs. The NS Attack exploits Negative Shadows (NSes), innovative luminous patterns on road surfaces when sunlight filters through openings in an opaque, rotatable light barrier known as canopy. Unlike conventional shadows, NSes resemble lane markings and are produced by canopies installed over road sections. These structures cast dark shadows by blocking sunlight and are perforated to create bright, misleading patterns on the road.
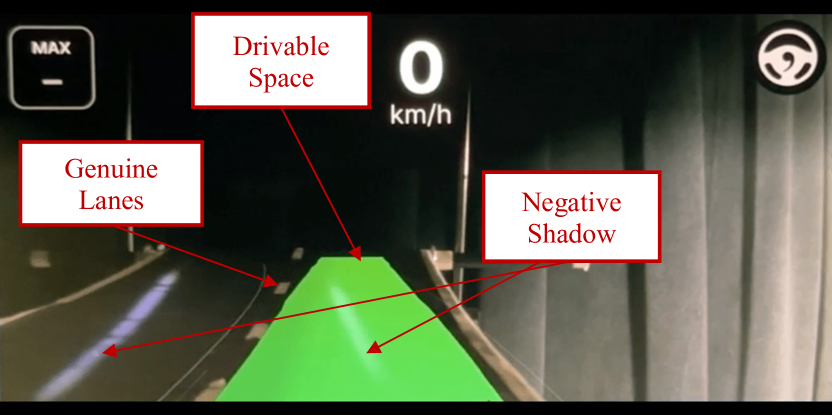
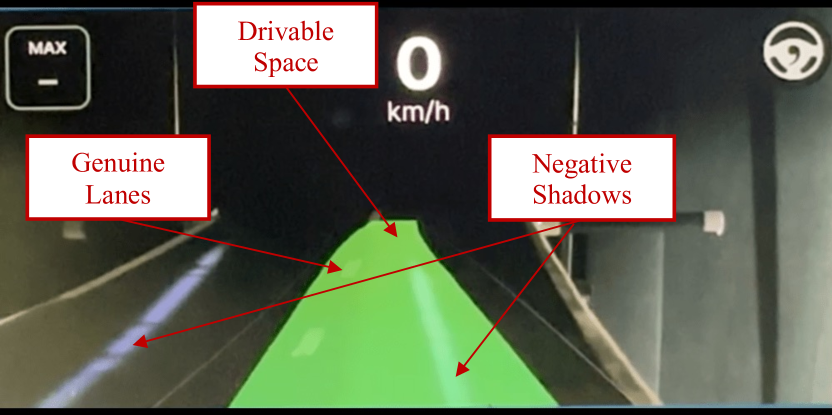
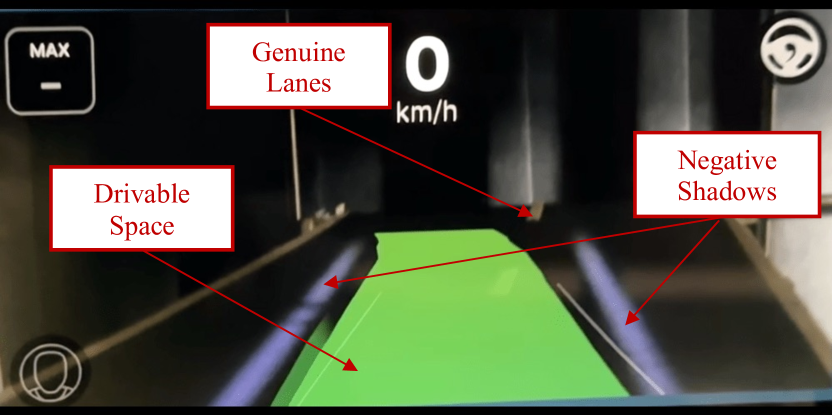
These NSes, characterized by their unique formation and appearance, pose a challenge for the pre-processing phase of LD algorithms as they are not typically filtered out. Since it has been observed that bright spots within these shadows are prone to intensity bias, we exploited this characteristic. Our strategy involved overshadowing a large area while preserving a region shaped like a road marking (Zhu et al., 2021b). This method effectively bypasses the shadow detection algorithms, potentially leading the LD systems to misdetect these patterns as genuine lane markings.
5.2. Shadow Calculation
To calculate shadow length, we use equations considering the sun’s position, trajectory, and specific calendar date. This method enables precise shadow measurements for any location and time, including negative shadow lengths, which linearly correspond to shadows cast by objects (Calculator, [n. d.]). We first calculate the day number , a measure of time elapsed from a fixed reference point, crucial for determining the sun’s position. This is represented in Equation 1, factoring in the current calendar year, month, and day:
| (1) |
Following this, the eccentric anomaly is computed, indicating the sun’s position in its elliptical orbit around the Earth, adjusted for the orbit’s eccentricity and the mean anomaly . The eccentric anomaly describes the sun’s location along its orbit path, as shown in Equation 2:
| (2) |
The sun’s rectangular coordinates in the ecliptic plane (, ) are then calculated in Equation 3. The coordinates (, ) represent the sun’s position in a flat model of its orbit:
| (3) |
These coordinates are then subsequently transformed into equatorial coordinates (, , ) by considering the obliquity of the ecliptic (oblecl), as detailed in Equation 4:
| (4) |
This transformation is essential for determining the sun’s right ascension and declination as depicted in Equation 5. Celestial coordinates (, ) locate the sun in the sky.
| (5) |
These calculations collectively enable the accurate determination of the sun’s azimuth and altitude . The azimuth is the compass direction from which the sun is shining, and the altitude indicates the height of the sun in the sky, affecting how long a shadow is, as depicted in Equation 6:
| (6) |
Finally, for a more comprehensive analysis that accounts for objects not positioned vertically, an adjusted formula for shadow length calculation is utilized, as detailed in Equation 7. This formula considers the height , length of the object, and the angle from the vertical, significant for accurately calculating the shadow length of tilted or inclined objects.
| (7) |
5.3. Movable Attack Components
To address C2, the NS Attack offers an efficient and cost-effective solution. Its portability allows deployment in various locations without location-specific adjustments. Once an opaque panel and an automated mobile mount are acquired, there are no recurring costs, unlike the DRP attack, which requires unique and costly patches for each location. Setting up the NS Attack is time-efficient; by calculating the distance between the holder and the road, along with the road’s width, it can cast a NS that mimics lane markings without intricate planning, repeated tests, or constant adjustments. The NS Attack avoids high costs and extensive time commitments, providing a straightforward and cost-effective alternative.
To address C3, the NS Attack presents a clear advantage from a legal standpoint. Unlike other methods, such as the DRP attack (Sato et al., 2021) or the Drone-LiDAR Exploit attack (Zhu et al., 2021a), which may violate multiple regulations, the NS Attack operates within the boundaries of the attacker’s private property. Setting up this attack does not require the attacker to access public roads or impersonate a road worker, avoiding direct law violations related to creating intentional road hazards or deceiving other road users. The only requirement is placing an appropriate object on the attacker’s personal property (e.g., front yard) near the roadside to create the NS, which is legal as long as they adhere to specific setbacks from the property lines (Homes, 2023).
6. Misdetection Evaluation
This section consists of two related but distinct evaluations. In 6.1, we used an empirical approach within the CARLA simulator (CARLA, 2023b). Here, a canopy with openings is employed to generate sunlight patterns on the road, simulating genuine lane markings. Subsequently, in 6.2, we adopt a approach to assess a wide range of potential parameter values and develop a Python script to systematically project T patterns on images captured from the simulator. The goal is to accurately evaluate the performance of the LD algorithms in recognizing these patterns. The NS Attack is more effective in the absence of original lane markings. To reflect real-world conditions, we conducted experiments with pre-existing lane markings.
| Length (m) | Width (times) | |||||||||||||
|---|---|---|---|---|---|---|---|---|---|---|---|---|---|---|
| Distance (m) | 1 | 2 | 3 | 4 | 5 | 8 | 10 | 20 | 1 | 2 | 3 | 4 | 5 | 6 |
| 0.1 | ✗/ ✗/ ✗ | ✗/ ✗/ ✗ | ✗/ ✓/ ✓ | ✗/ ✓/ ✓ | ✓/ ✓/ ✓ | ✓/ ✓/ ✓ | ✓/ ✓/ ✓ | ✓/ ✓/ ✓ | ✓/ ✓/ ✓ | ✓/ ✓/ ✓ | ✓/ ✓/ ✗ | ✗/ ✗/ ✗ | ✗/ ✗/ ✗ | ✗/ ✗/ ✗ |
| 0.5 | ✗/ ✗/ ✗ | ✗/ ✗/ ✗ | ✗/ ✗/ ✗ | ✗/ ✗/ ✗ | ✗/ ✓/ ✗ | ✗/ ✓/ ✓ | ✗/ ✓/ ✓ | ✗/ ✓/ ✓ | ✗/ ✓/ ✓ | ✗/ ✓/ ✗ | ✗/ ✓/ ✗ | ✗/ ✗/ ✗ | ✗/ ✗/ ✗ | ✗/ ✗/ ✗ |
| 1.0 | ✗/ ✗/ ✗ | ✗/ ✗/ ✗ | ✗/ ✓/ ✗ | ✗/ ✓/ ✗ | ✓/ ✓/ ✗ | ✓/ ✓/ ✓ | ✓/ ✓/ ✓ | ✓/ ✓/ ✓ | ✓/ ✓/ ✗ | ✗/ ✓/ ✗ | ✗/ ✓/ ✗ | ✗/ ✗/ ✗ | ✗/ ✗/ ✗ | ✗/ ✗/ ✗ |
6.1. Exploratory Evaluation
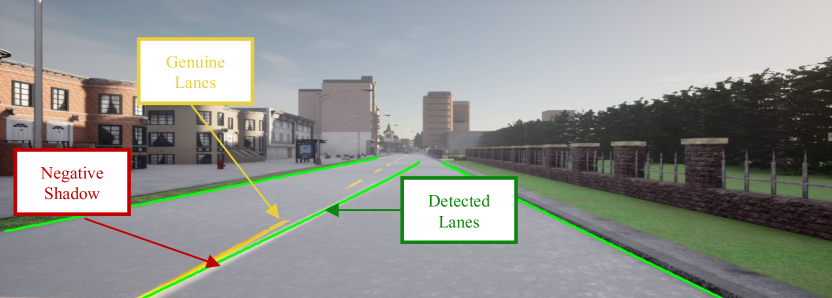
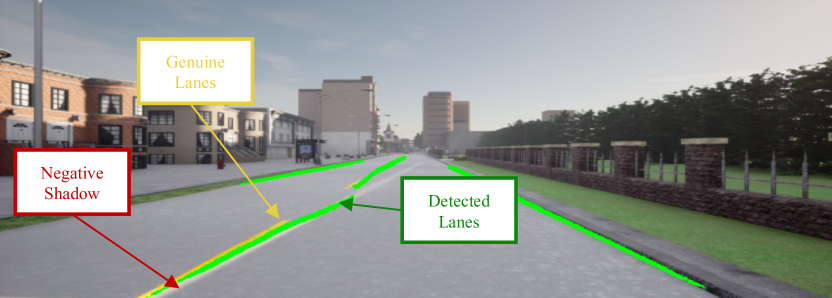
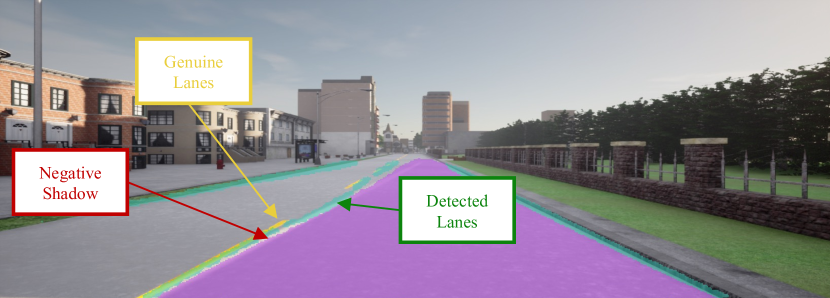
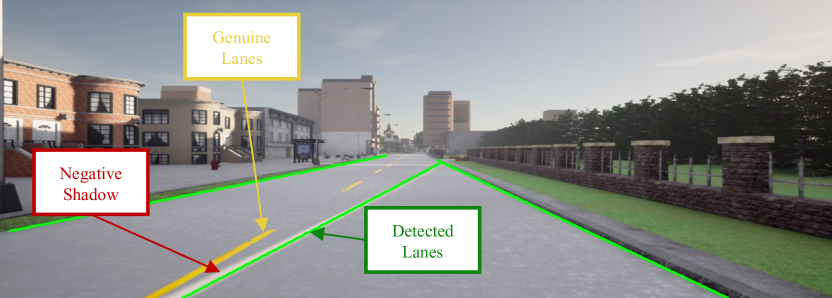
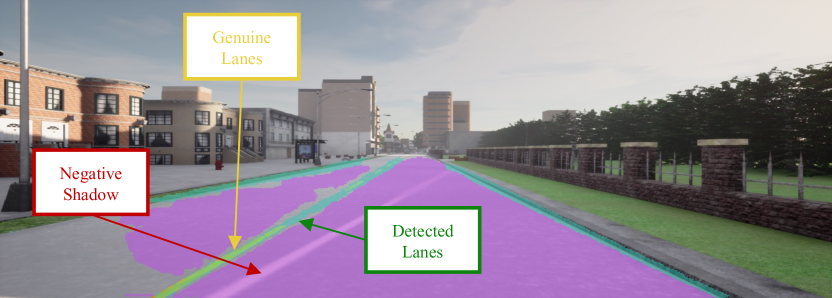
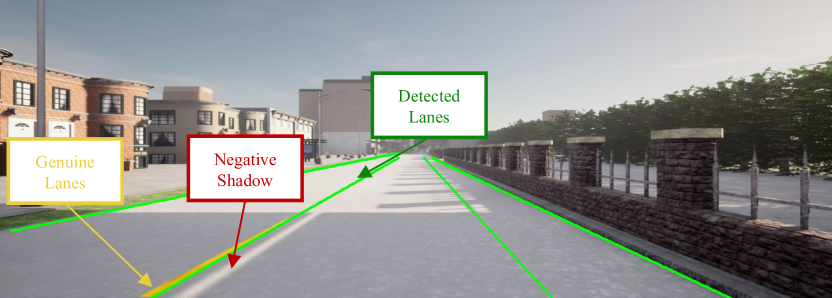
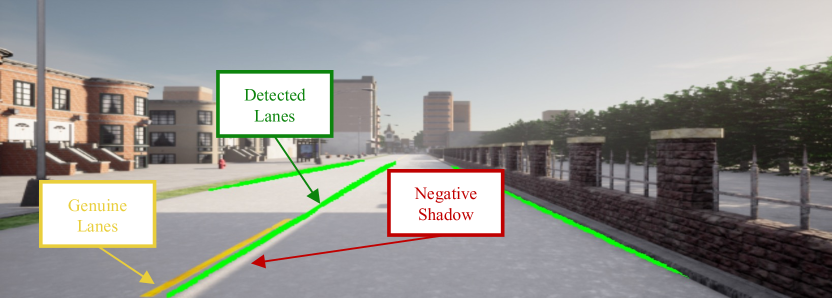
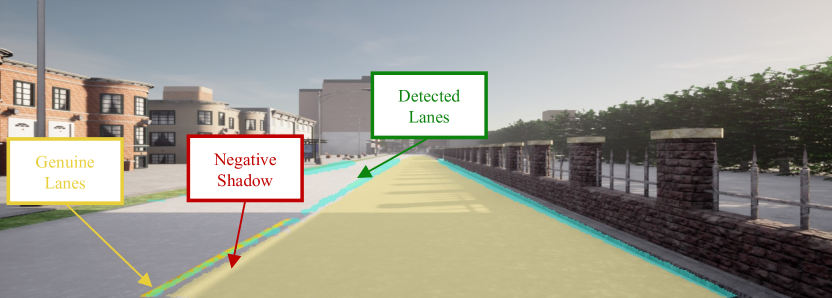
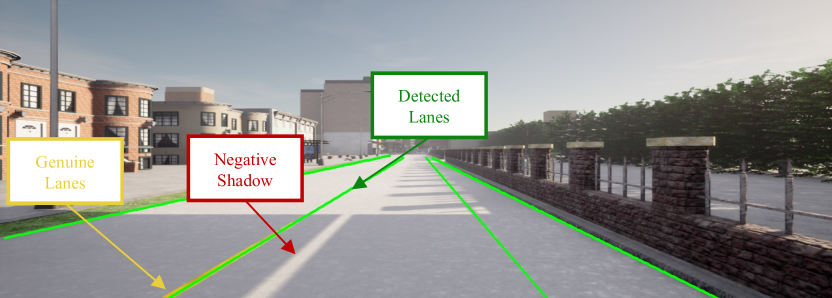
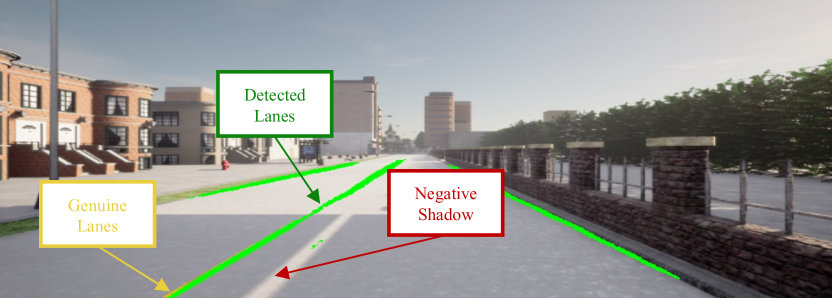
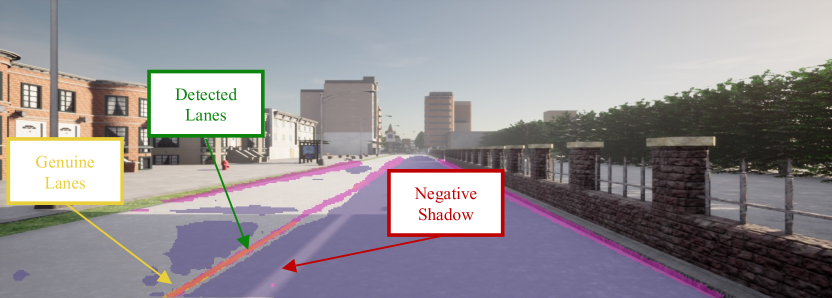
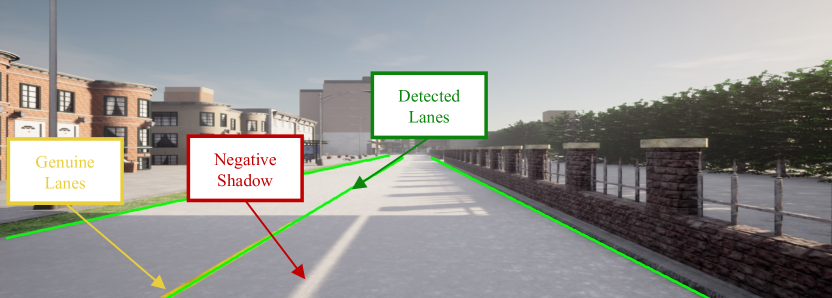
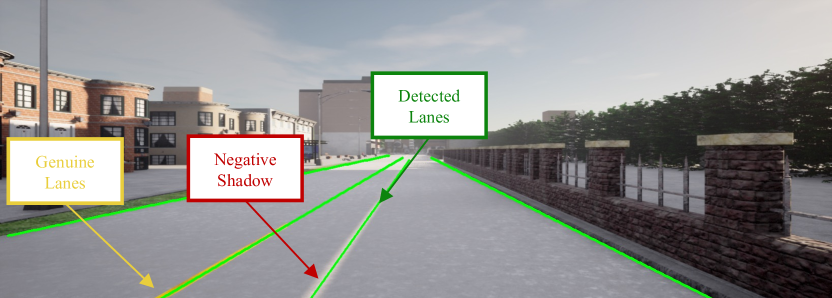
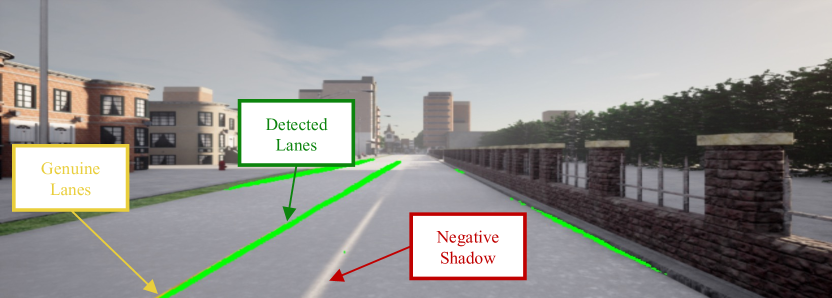
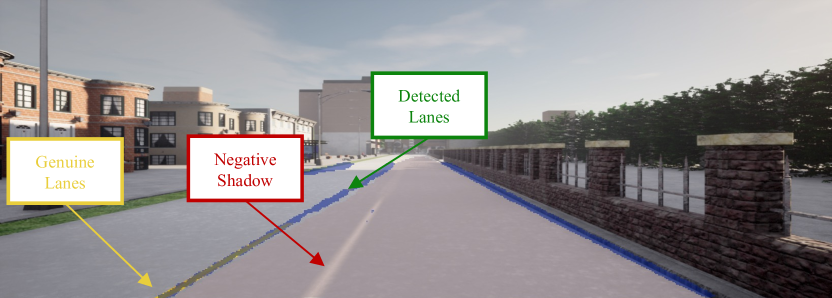
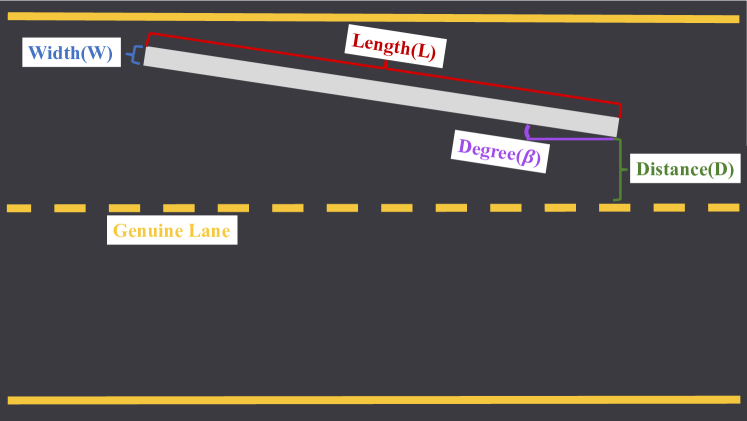
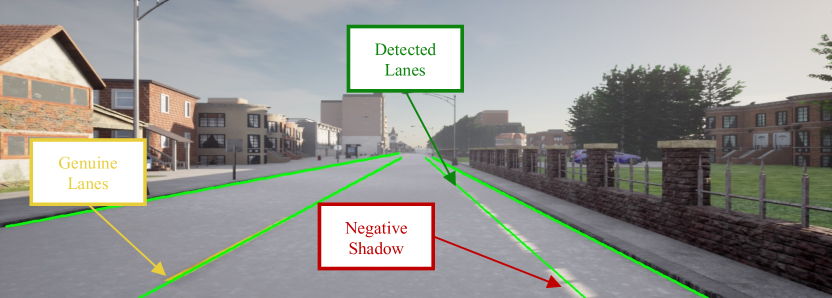
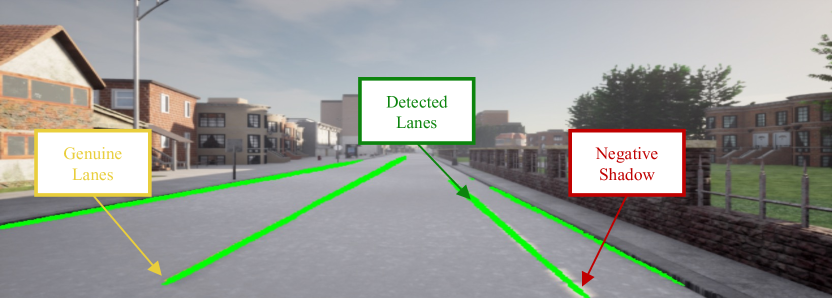
In autonomous driving, shadows from trees, buildings, and vehicles challenge LD algorithms, potentially causing errors (Tran et al., 2010; Heidarizadeh, 2021). LD algorithms mitigate this with pre-processing techniques, converting RGB images into illuminant-invariant spaces for effective segmentation (Hillel et al., 2014; Alvarez and Ĺopez, 2010; Beyeler et al., 2014). This study introduces a method to assess LD algorithms’ susceptibility to misidentification caused by shadow removal. The approach involves a canopy over a road section with openings, creating bright patterns similar to lane markings. These patterns (NSes) shown in Fig. 2, are characterized by four parameters: (1) Width, (2) Length, (3) Distance from the lane marking, and (4) Angle relative to the original lane markings—resulting in various shapes and sizes of the NS, as illustrated in Fig. 3.
An exploratory evaluation is conducted to understand how three LD algorithms — CLRerNet (Honda and Uchida, 2023), TwinLiteNet (Che et al., 2023), and HybridNets (Vu et al., 2022) — respond to different NSes, characterized by their width, length, distance, and angle. The goal is to determine the optimal ranges for these parameters that lead to effective misdetection of NSes as genuine lane markers. Due to the exploratory nature, only a limited range of values was evaluated. The selection of TwinLiteNet (segmentation-based), HybridNets (multi-task), and CLRerNet (anchor-based) was based on their high accuracy according to leaderboards (Code, 2024). This ensures an examination across varied algorithmic approaches for potential NS misdetection.
To assess these parameters, we used a controlled experimental setup within CARLA (CARLA, 2023b), an open-source simulator for autonomous driving research, providing a realistic urban environment for testing AVs. An object with a hole was strategically positioned to create various NSes by adjusting its orientation and distance to the sun. This generated different NSes defined by the four key parameters. A 2020 Lincoln MKZ (CARLA, 2023a) was driven in the CARLA Town02 environment to capture images for analysis using three contemporary state-of-the-art LD algorithms.
The length of the NS is crucial for the lane tracking component of LD algorithms. To assess its effect, the width of the NS was set equal to the original lane markings in the CARLA Town environment. This NS was placed on the right side of the road, testing NS lengths from 1m to 20m at distances of 0.1m, 0.5m, and 1m from the original lane marking. Table 2 presents the results, with each cell containing three entries for the performance of CLRerNet, TwinLiteNet, and HybridNets. The symbols ’✓’ and ’✗’ indicate successful or unsuccessful detection of the NS as a genuine lane marker by the algorithms. Refer to Fig. 13 (see Appendix A) for a more analysis of how the LD algorithms react to a 4m NS at different distances. Results indicate that for shorter lengths, all three algorithms consistently fail to misdetect the NS as a genuine lane marking, regardless of the distance. As the NS length increases, CLRerNet and TwinLiteNet consistently misdetect NSes as lane markings across all distances, while HybridNets demonstrate varying sensitivity. In summary, longer NSes increase the likelihood of LD algorithm misdetection, highlighting the importance of understanding the impact of NS parameters on algorithm performance for a more comprehensive analysis.
The width of the NS varied from 1x to 6x the original lane markings in the simulator. For each width, the NS was positioned on the right side of the road at distances of 0.1m, 0.5m, and 1m from the original lane marking. The NS length was set to 20m, considered adequate for effective detection based on previous findings.
Table 2 shows the performance of CLRerNet, TwinLiteNet, and HybridNets. Symbols ‘✓’ and ‘✗’ denote successful or unsuccessful detection of the NS as a lane marker. The results reveal that when the width of the NS is up to three times the original lane markings, the algorithms show varied detection abilities. Beyond this width, all algorithms fail to detect the NSes as lane markings, indicating a threshold beyond which the NS width no longer resembles a genuine lane marker. Fig. 14 (see Appendix A) illustrates the reaction of these algorithms to NSes with the same width as the original lane markings at different distances. CLRerNet tends to detect lanes closer to the curbs or middle lane.
To evaluate the effect of the angle between the original lane marking and the NS, the NS width matched the lane markings in CARLA and was placed 0.1m from the original lane marking. The angle was adjusted in increments: 5.73°, 7.66°, 9.2°, 11.53°, 13.06°, and 53°. Experimentation showed that CLRerNet and HybridNets misdetect NSes as lane markings at smaller angles, particularly up to 9.2°. Their performance decreases at angles larger than 11.53°. TwinLiteNet consistently misdetects across all angles, showing higher resilience to changes in NS angles relative to lane markings, as shown in Fig. 12 (see Appendix A).
To analyze the distance parameter, a 25m long NS, matching the width of the original lane markings, was placed at varying distances — 0.1m, 1m, 2m, 3m, and 4m — from the genuine lane marking on the right side of the road. Despite these variations, all three LD algorithms consistently misidentified the NS as a genuine lane marker, regardless of the distance, as shown in Fig. 4. This highlights that, as long as the NS is sufficiently long and its width and angle align with previous observations, the distance from the lane marking does not significantly impact the algorithms’ misdetection likelihood.
The objective of this exploratory evaluation is to identify specific parameter thresholds at which our NS Attack is most effective. By pinpointing critical values for width, length, distance, and angle, the study narrows down the search space, setting the stage for a more comprehensive analysis described in the next subsection.
6.2. Systematic Evaluation
The Lane Detection function represents general lane detection algorithms. Its input, , is an image of a road view captured by a camera mounted on a vehicle. The output of , , comprises pixels corresponding to the original lane markings, as shown in Equation 8. The function in Algorithm 1 applies a negative shadow onto the image, resulting in an output that shows a set of pixels where negative shadows are placed on them, . The objective of is to understand the interaction between different parameters. We define a systematic evaluation method that allows for an investigation in understanding how the width, length, and angle of the NS create adversarial samples that lead to recognize alongside , thereby misdetecting negative shadows as original lane markings, as illustrated in Equation 9.
| (8) | |||
| (9) |
For our investigation, the 2020 Lincoln MKZ vehicle model (CARLA, 2023a) was driven in the CARLA Town02 environment. We gathered four images, each with a different vertical distance to the closest center lane marking. The bounds for width, length, and angle variables for the NSes were defined based on the 4 m width of the right lane from the yellow center line to the curb. Parameter bounds and step increases are shown in Table 3. Coordinate bounds for the NSes were defined such that no NS has an x-coordinate greater than 4 m on a 2D plane with the y-axis as the yellow center line marker and the x-axis perpendicular to it. Shadows must be within the right lane. To remove an NS violating this rule, we use .
Using the bounds of the variable parameters, purging any shadow that falls outside of the right lane, we generated 7,979 unique shadows, separated into 320 25-row CSV files to lower memory requirements per loop. We then designed an algorithm that takes four input images, overlays a given NS on each, and sends both pre-attack and post-attack images to the LD algorithms to evaluate the attack performance (see Algorithm 1).
The algorithm first applies shadows defined in a CSV file, then sends every image with an overlaid shadow and pre-attack input images to CLRerNet, HybridNets, and TwinLiteNet for lane detection. The outputs and are compared by subtracting pre-attack control images from post-attack images. Using a gray-scale adaptive threshold, the number of non-zero pixels is counted. If the result exceeds a calibrated threshold (number of pixels making up one detected lane), the attack is considered successful. Experiments were conducted using Python 3 on an Ubuntu 22.04 computer with 32 GB RAM, NVIDIA RTX 3070, and Intel i9-10900K, with a runtime of 199.14 minutes.
| Features | ||
|---|---|---|
| Parameters | Bounds | Step |
| Width | 0.1-4m | 0.2m |
| Length | 1-10m, 15m, 25m, 40m | 1m |
| Degree | 0-15°, 30, 45, 90 | 5 |
| Distance | 0.1-4m | 0.2m |
Fig. 6 depicts the relationship between the NS length and success rate of LD algorithms. As NS length increases, the success rate for detecting NSes also increases. However, a larger results in a shorter NS on the road surface, leading to a decreased success rate with wider NS. Anomalies in the width-success plot for HybridNets occur near a width of m. While the success rate is relatively constant with distance, for CLRerNet and TwinLiteNet, the success rate drops when the distance is close to 4m due to curb detection.
The mean value of each parameter was computed for both successful and failed attack outcomes, as shown in Table 4. Fig. 6 shows that a NS with m, m, and has the highest success rate across all input images and LD algorithms. A parallel coordinates plot illustrates the relationship between four parameter samples taken from the mean to one standard deviation away, and their respective attack outcomes in Fig. 5.
7. Safety Evaluation
7.1. Software-in-the-Loop Simulation
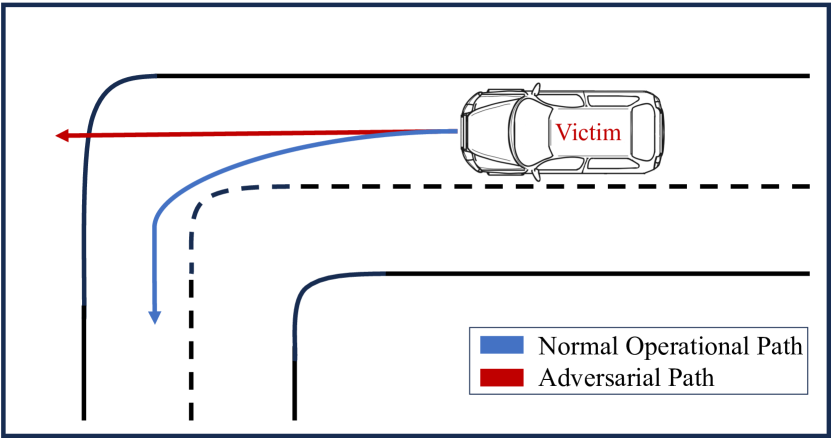
Our study defines three scenarios to evaluate safety impacts. These scenarios are essential as they depict real risks to drivers and passengers. The first scenario, shown in Fig. 7(a), involves a left-turn maneuver by the victim car. Here, the adversary aims to steer the vehicle off the designated road, potentially leading to hazards like ditches, uneven terrain, obstacles, or collisions with pedestrians, which could cause severe injuries or fatalities.
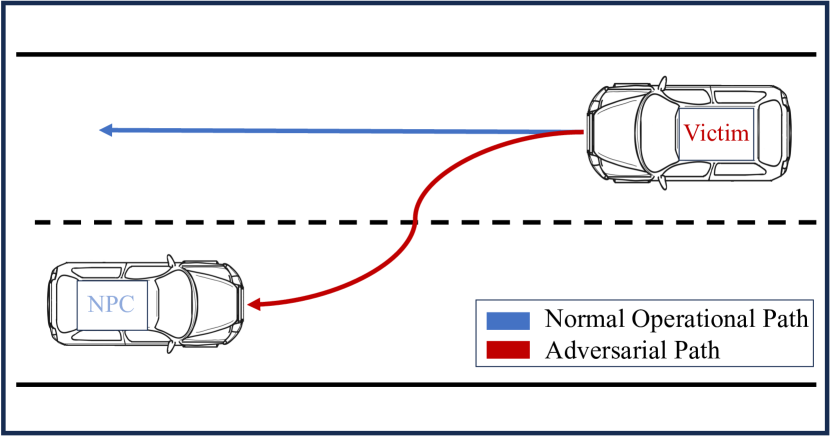
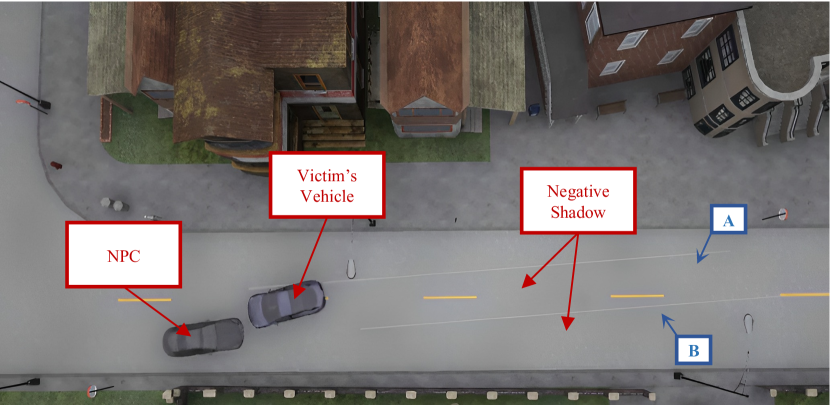
The second scenario (see Fig. 7(c)) occurs on a local road involving two cars, one being the victim car. The victim car encounters a non-player-controlled (NPC) vehicle from the opposite direction. The attacker aims to deceive the victim car’s perception system, intending to cause a head-on collision with the NPC vehicle.
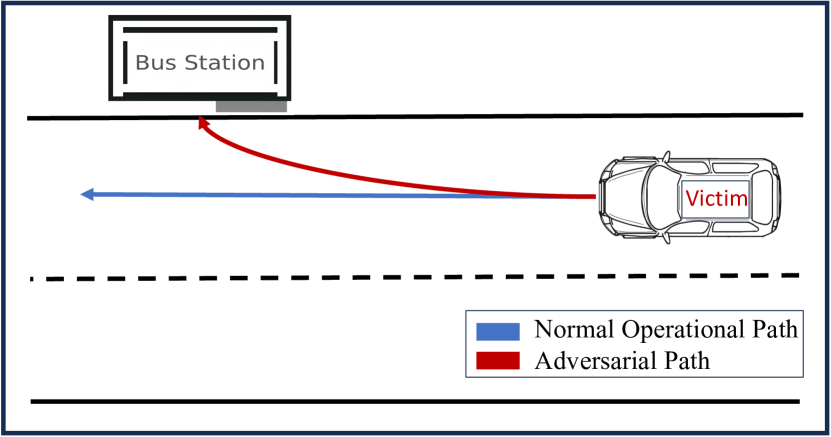
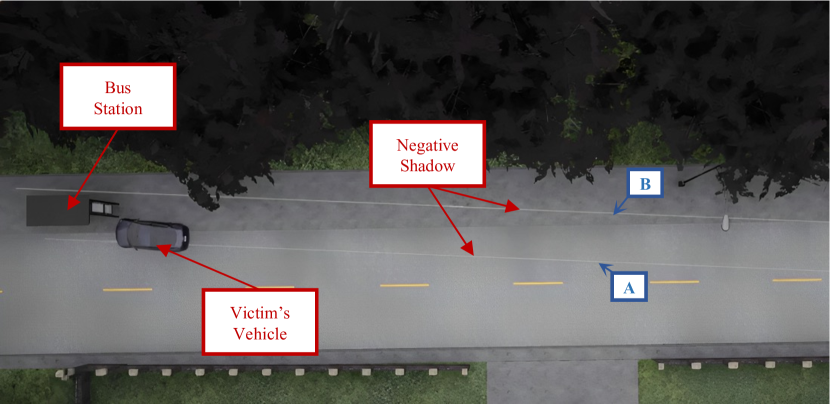
We establish a third scenario, where the vehicle is influenced to veer off-road to the right, as shown in Fig. 7(e). Here, the attacker aims to cast a NS that misleads the vehicle, causing it to deviate right towards a bus station.
We use Openpilot v0.9.5 (Comma.ai, 2023), an open-source L2 advanced driver assistance system, as an AV stack with CARLA in the loop to evaluate the three defined scenarios. Openpilot hardware, such as the Comma 3X (comma.ai, 2023), integrates with a vehicle’s in-vehicle network to automate specific driving tasks, such as steering and acceleration. By leveraging the bridge between Openpilot and CARLA, we can simulate and assess the outcomes of our scenarios in a detailed virtual environment, ensuring thorough testing of Openpilot’s decision-making algorithms under challenging conditions. This approach provides valuable insights into the system’s performance and safety in scenarios that mimic real-world situations.
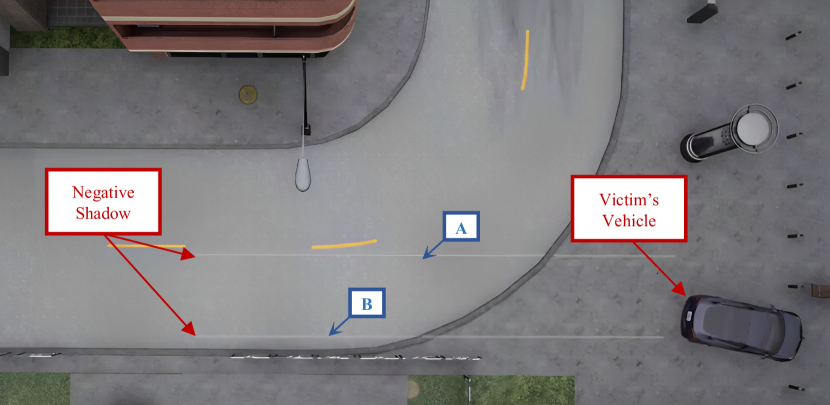
The first scenario, illustrated in Fig. 7(b), shows the car being led off its intended path during a left-turn maneuver, resulting in off-road hazards and collisions. Initially, this scenario was tested with one NS, labeled A, cast parallel and adjacent to the genuine lane marking, extending from the road surface to the non-drivable space. The attack was unsuccessful despite the vehicle mistaking the NS for a genuine lane marking. This was because the vehicle detected the area between the curb and the NS as drivable. As it approached a left turn, the vehicle continued to use the curb as a guide. When the curb started curving left, the vehicle interpreted this as the drivable space expanding in that direction, causing it to ignore the NS and correctly making the left turn. To address this, another NS, labeled B, was cast parallel to the curb, extending over the road and into the non-drivable space. As the vehicle approached the left turn, it misdetected the space between the two NSes as drivable space, causing the vehicle to veer off-road.
| Lane Detection Algorithms (Success, Failure) | |||
|---|---|---|---|
| Parameters | CLRerNet (✓, ✗) | HybridNets (✓, ✗) | TwinLiteNet (✓, ✗) |
| Width (m) | (1.16, 1.43) | (1.24, 1.30) | (1.20, 1.62) |
| Distance (m) | (1.18, 1.10) | (1.16, 1.15) | (1.13, 1.33) |
| Length (m) | (6.50, 5.53) | (6.44, 4.92) | (6.8, 1.5) |
| (°) | (14.53, 16.84) | (14.75, 17.89) | (13.38, 29.85) |
In the second scenario (Fig. 7(d)), the car is tricked into a head-on collision with an oncoming vehicle. Initially, a single NS is cast on the right side of the road from the victim’s car’s perspective, labeled A. The vehicle detects the space between the NS and the genuine lane marking as drivable. As it passes the NS, it detects the space between the curb and the NS as drivable, preventing a safety violation. To overcome this, another NS, labeled B, is cast parallel to the first, with half the street’s width between them. The vehicle initially detects the area between the right NS and the original lane marking as drivable. As it nears the left NS, it overlooks the original lane, considering the left NS as the new boundary. It then detects the area between the two NSes as drivable, causing a safety violation and a successful attack.
The third scenario in Fig. 7(f) shows the victim’s car misled by an NS created by the attacker, causing it to veer towards a bus station. Initially, the NS, labeled A, was cast on the road. As the victim’s vehicle approached, it detected the space between the NS and the curb as drivable. However, once the vehicle passed the NS, it identified the space between the genuine lane marking and the curb as drivable. Consequently, the attack was not successful. To address this, a second NS, labeled B, is introduced parallel to the first one. As the victim’s car approaches, it initially perceives the space between A and the curb as drivable. However, as the car continues forward, it views lane B as the right boundary of the drivable space, positioning the drivable space between A and B. As a result, this shift causes the car to change direction, leading to a collision with a bus station.
To assess the efficiency and effectiveness of each scenario, we varied NSes lengths from 10 to 70 m in 10 m steps and tested speeds from 10 mph to 60 mph (Table 7). The ‘✓’ indicates a successful attack, while the ‘✗’ denotes a failure. Higher vehicle speeds generally require longer NSes for successful attacks, with the correlation between vehicle speed and NS length being crucial for determining attack efficacy.
| Length (m) | |||||||
|---|---|---|---|---|---|---|---|
| Speed (mph) | 10 | 20 | 30 | 40 | 50 | 60 | 70 |
| 10 | ✗/✗/✗ | ✓/✗/✗ | ✓/✗/✗ | ✓/✗/✗ | ✓/✗/✗ | ✓/✗/✗ | ✓/✗/✗ |
| 15 | ✗/✗/✗ | ✓/✗/✗ | ✓/✓/✗ | ✓/✓/✗ | ✓/✓/✗ | ✓/✓/✗ | ✓/✓/✓ |
| 20 | ✗/✗/✗ | ✓/✗/✗ | ✓/✓/✗ | ✓/✓/✗ | ✓/✓/✗ | ✓/✓/✓ | ✓/✓/✓ |
| 35 | ✗/✗/✗ | ✓/✗/✗ | ✓/✓/✗ | ✓/✓/✗ | ✓/✓/✓ | ✓/✓/✓ | ✓/✓/✓ |
| 60 | ✗/✗/✗ | ✓/✗/✗ | ✓/✗/✗ | ✓/✗/✗ | ✓/✗/✓ | ✓/✓/✓ | ✓/✓/✓ |
Analysis of the table data reveals diverse risk patterns for each scenario. In the first scenario, the risk of vehicular misdirection increases with distance, regardless of speed. The second scenario indicates a higher collision risk beyond 30 m, especially at higher speeds. The third scenario shows low risk at varying speeds and distances, except at high speeds (35 and 65 mph) and long distances (50 to 70 m), where the danger increases. Given these observations, it is more accurate to state that while speed and attack effectiveness are somewhat correlated in certain scenarios, the distance, or length of the NS, plays a more significant role. Overall, the success of the attacks appears to be influenced more by distance than by speed alone. As shown in Fig. 8, the average success rate increases with the length of the NS across these scenarios, reaching an average of 93.33% at a NS length of 70 m. This underscores the critical influence of NS length on scenario success.
The average driver reaction time with ALC systems may exceed 2.5 seconds (Sato et al., 2021), so reactions should be under 2.5 seconds to counter the attack effectively. This means the driver needs to take over within 2.5 seconds. For each scenario, the vehicle was driven at different speeds, and the reaction time was calculated based on the distance between the deviation at the negative shadow’s detection and the goal defined in Section 7.1. Table 5 shows the time of attack occurrence for each scenario described in Section 7. If the reaction time is within 2.5 seconds, it is marked as a ’✓’; if it takes more than 2.5 seconds, it is marked as a ’✗’.
For example, in the second scenario at 60 mph with 30m and 60m negative shadows, reaction times were 0.55 seconds and 1.364 seconds, respectively. In the third scenario at 35 mph with 50m and 70m negative shadows, reaction times were 1.59 seconds and 2.23 seconds. In the first scenario with a 40m negative shadow at 35 mph and 60 mph, reaction times were 0.98 seconds and 0.42 seconds, respectively. Table 6 is formed by merging the outcomes of table 5 with table 7. It showcases scenarios where an attack was successful and the driver’s reaction time was too slow to prevent a safety risk.
| Length (m) | |||||||
|---|---|---|---|---|---|---|---|
| Speed (mph) | 10 | 20 | 30 | 40 | 50 | 60 | 70 |
| 10 | ✗/✗/✗ | ✗/✗/✗ | ✗/✗/✗ | ✗/✗/✗ | ✗/✗/✗ | ✗/✗/✗ | ✗/✗/✗ |
| 15 | ✗/✗/✗ | ✓/✗/✗ | ✓/✓/✗ | ✓/✗/✗ | ✓/✗/✗ | ✓/✗/✗ | ✓/✗/✗ |
| 20 | ✗/✗/✗ | ✓/✗/✗ | ✓/✓/✗ | ✓/✓/✗ | ✓/✗/✗ | ✓/✗/✗ | ✓/✗/✗ |
| 35 | ✗/✗/✗ | ✓/✗/✗ | ✓/✓/✗ | ✓/✓/✗ | ✓/✓/✓ | ✓/✓/✓ | ✓/✓/✓ |
| 60 | ✗/✗/✗ | ✓/✗/✗ | ✓/✗/✗ | ✓/✗/✗ | ✓/✗/✓ | ✓/✓/✓ | ✓/✓/✓ |
| Length (m) | |||||||
|---|---|---|---|---|---|---|---|
| Speed (mph) | 10 | 20 | 30 | 40 | 50 | 60 | 70 |
| 10 | ✗/✗/✗ | ✓/✗/✗ | ✓/✗/✗ | ✓/✓/✗ | ✓/✓/✗ | ✓/✓/✗ | ✓/✓/✗ |
| 15 | ✗/✗/✗ | ✓/✗/✗ | ✓/✓/✗ | ✓/✓/✗ | ✓/✓/✗ | ✓/✓/✗ | ✓/✓/✓ |
| 20 | ✗/✗/✗ | ✓/✗/✗ | ✓/✓/✗ | ✓/✓/✗ | ✓/✓/✗ | ✓/✓/✓ | ✓/✓/✓ |
| 35 | ✗/✗/✗ | ✓/✗/✗ | ✓/✓/✗ | ✓/✓/✗ | ✓/✓/✓ | ✓/✓/✓ | ✓/✓/✓ |
| 60 | ✗/✗/✗ | ✓/✗/✗ | ✓/✗/✗ | ✓/✗/✗ | ✓/✗/✓ | ✓/✓/✓ | ✓/✓/✓ |
7.2. Miniature Road Setup
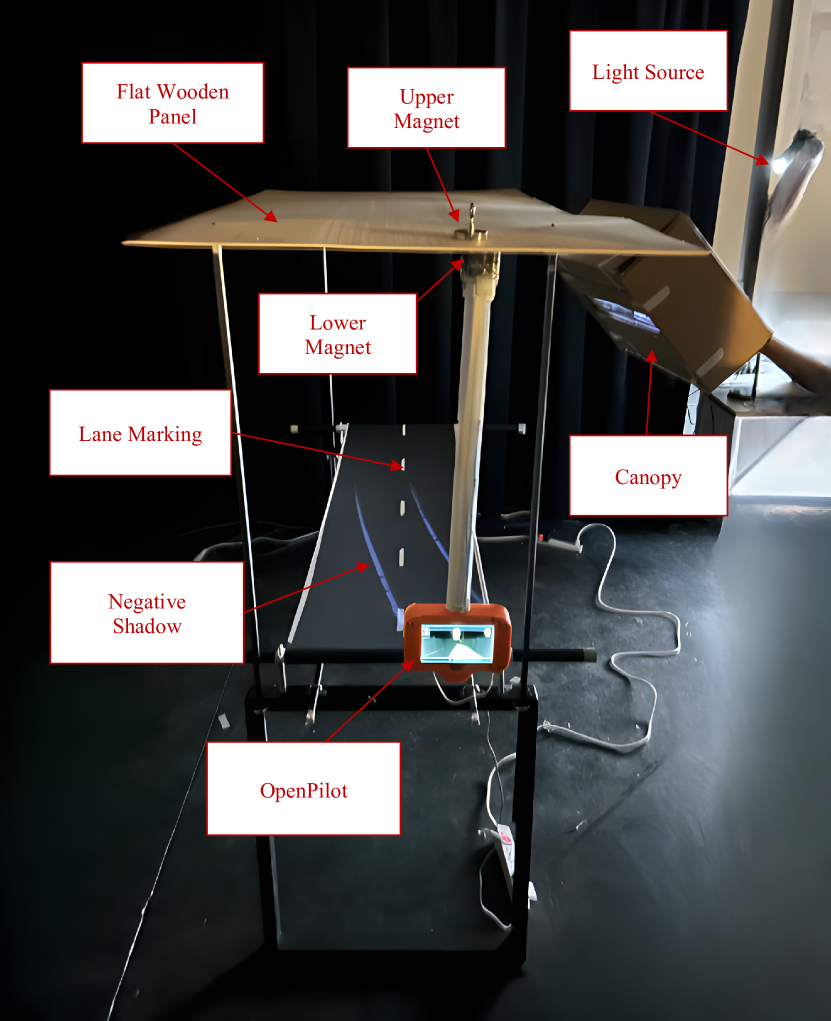
Our objective in this subsection is to evaluate the feasibility of the attack in a real-world environment by implementing the second scenario from the previous subsection, which demonstrates how Openpilot misdetects the NS as genuine lane markings and drives into the other lane. To illustrate this, we constructed a miniature road model replicating an assumed original road with a total length of 50 m, as shown in Fig. 7(g). A typical US street is 360 cm wide with lane markings 16 cm wide (CivilSir, 2024). Our model is 45 cm wide and 165 cm long. To scale down the lane markings, we calculated the ratio of the lane marking width (16 cm) to the road width (360 cm). Applying this ratio to our model’s width (45 cm), the lane markings for our mini road should be approximately 2 cm wide.
Given that the lane markings on the assumed road are dashed, we adjusted their length in our model. The typical pattern of 3-meter-long markings followed by 9 meters of space was proportionally scaled down. Using the ratio of our model’s length (165 cm) to the assumed road’s length (5000 cm), each lane marking on our miniature road is approximately 9.9 cm long, with 29.7 cm of space between them. A flat wooden panel was placed parallel to the road surface with a strategically positioned magnet. Another magnet was attached below the panel to one end of a pipe, with the Comma 3X device running Openpilot v0.9.5 connected to the other end. Manually moving the magnet on the panel allowed the Comma 3X to move due to the magnetic attraction.
To cast two parallel NSes over the miniature road, we mounted two parallel holes in the canopy, each with a width of 0.31 cm and a length of 42 cm. The light source was fixed at an angle of 46.7° to the miniature road. The canopy was placed 83 cm horizontally and 61 cm vertically from the road model. By moving the canopy, we adjusted the distance between the canopy and the road, thereby altering the NSes cast on the road surface. Fig. 9(a) shows Comma 3X detecting genuine lane markings and identifying drivable space between them. As OpenPilot moved forward (Fig. 9(b)), it mistakenly identified the right NS as genuine lane markings, placing drivable space between the original marking and the right NS. Further ahead, it overlooked the original marking, detected the left NS as genuine lane markings, and repositioned the drivable space between the left and right NSes (Fig. 9(c)). This caused the vehicle to drive incorrectly over the lane, confirming previous simulation results. The experiment was repeated multiple times to understand the relationship between the illuminance (measured in lux) of a NS and Openpilot’s misdetection. In each trial, the Comma 3X was moved forward from a fixed starting point where Openpilot correctly detects genuine lane markings to test NSes cast under varying illuminance values. The objective was to determine the distance at which Openpilot began to misinterpret NSes as genuine lane markings. As illustrated in Fig. 10, the misdetection distance ranged from 63.5 cm to 10.16 cm, decreasing as illuminance increased from 40 to 757 lux. This indicates that as the NSes become brighter, Openpilot begins to misdetect them as genuine lane markings earlier.
8. Human Factor Evaluation
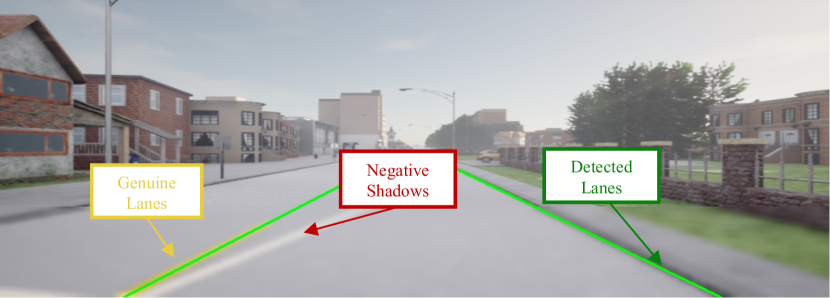
To evaluate the stealthiness of the attack, we conducted a human study experiment, employing CARLA and Unreal Engine 4 to generate the necessary videos. We obtained an approval from our university’s IRB (Registration No. REDACTED) to conduct this study. We first selected ‘Town04’ from CARLA’s available maps since it resembled a real-life town with a long, straight road, suitable as the context for the proposed attack. Subsequently, any objects exhibiting either intense lighting or high reflectivity were eliminated, as these could disrupt the attack in alignment. Following these modifications, the focus shifted to devising the attack. This was accomplished by strategically positioning an opaque panel with two parallel holes, casting a shadow along the right section of a straight road. The Negative Shadows formed next to and parallel to the original lane markings were designed to replicate genuine lane markings on one side of the street.
The experiment assessed participant responses to the attack under different weather conditions: clear day and overcast with recently wet ground. Changes in weather conditions affected the visibility and perception of the NSes. Therefore, the experiment incorporated two distinct weather scenarios, and the experimental setup was modified accordingly to ensure optimal visibility and effectiveness of the NSes under these varying conditions. The experiment also included a control scenario for each weather condition without the attack to observe the participants’ behavior under normal conditions. This approach was designed to understand the participants’ reactions in various situations comprehensively.
Lastly, we utilized CARLA’s built-in autonomous driving capabilities, set to cautious mode, for maneuvering the car in our video recordings, during which the NSes were strategically placed at specific periods. A key aspect of these recordings was ensuring the absence of vehicle or pedestrian traffic, to maintain focus solely on the road and the effects of the attack. Future research could investigate participant reactions to our attack under varying traffic densities, providing insights into how crowded environments might influence the effectiveness or perception of the attack.
In addition to these videos, we had a keyboard for the participants to use. To gauge their response, we created a Python script that measures their reaction time with this keyboard. The script was programmed such that, upon the participant pressing the space bar, it recorded the video’s timestamp and did so again at a second press. This allowed for the automatic calculation of the duration of their reaction based on these timestamps. Once we had all these tools working, we created a small pilot study of a few people to test if our setup was working properly. Once that was completed with a positive outcome, we anonymously acquired 60 participants to keep an unbiased response and start our official human study.
| Questions | Options | Percentages |
| Age | 18-19 | 5% |
| 20-21 | 17% | |
| 22-23 | 23% | |
| 24-25 | 25% | |
| 26-27 | 18% | |
| 28 or older | 12% | |
| Gender | Male | 80% |
| Female | 20% | |
| Prefer not to say | 0% | |
| Other | 0% | |
| Ethnicity | Hispanic or Latino or Spanish Origin | 0% |
| Not Hispanic or Latino or Spanish Origin | 97% | |
| I do not wish to provide this information | 3% | |
| Driver’s License | Yes | 100% |
| No | 0% | |
| AV Experience | Very Often | 7% |
| Somewhat | 20% | |
| Rarely | 23% | |
| Never | 50% |
We conducted our experiment by asking the participants pre-experiment questions to gather their demographic information, as shown in Table 8. Once this was done, we would deceive the participants by saying we were running testing for different weather conditions within a video game to achieve an unbiased reaction from them. We then proceeded to tell the participants that they would be watching a prerecorded video of an autonomous vehicle, and if at any point they felt like something was not right in the simulation, then they should press the space bar once and then a second time when that situation was resolved. Note that human engagement is necessary in AVs of L1/L2. During this, we gathered their reaction time lengths and exact timestamps in the videos, information crucial for comparing their reaction times to the periods when the NSes were present. Once this was concluded, we asked them a series of post-experiment questions to validate our data. We eliminated participants based on whether they knew the true intention of our study before we revealed our deception at the end. This ensured our data was accurate.
Missed Detection Rate refers to the percentage of times participants failed to detect an attack or misidentified normal conditions as an attack across different weather conditions. The results indicate that the Missed Detection Rate for attacks varies with weather, reaching 85% in wet conditions and 80% in clear conditions. Notably, under clear conditions without an attack, this rate was 86%, highlighting difficulties in distinguishing normal from attack scenarios. These findings suggest a low awareness of NS attacks, implying high success chances for adversaries in L1 and L2 vehicles.
9. Limitations and Defense Discussion
9.1. Limitation
During our experiments, we faced two main limitations. Firstly, we focused on L1/L2 AVs, whereas L3 and higher AVs use High Definition (HD) Maps, which provide precise road attributes like curvature, slope, road width, lane width, and speed limits (Liu et al., 2020). This prior road knowledge reduces their reliance on lane detection algorithms, making safety violations less likely despite some misdetections by the NS Attack. Secondly, real-world vehicle testing is limited due to safety concerns, making simulations essential. Advanced simulators like CARLA are widely used in industry and academia for their ability to replicate real-world conditions safely and effectively detect AV safety and security issues (Norden et al., 2019; Scanlon et al., 2021; Dosovitskiy et al., 2017; Song et al., 2023). Additionally, a miniature-scale testbed, as discussed in Section 7.2, was used to simulate physical vehicle evaluations.
9.2. Defense
We propose a defense method against the NS Attack, named Luminosity Filter Pre-Processing. This method involves the normalization (Pizer et al., 1987; Foracchia et al., 2005; Patro and Sahu, 2015) and selective filtering (Nagao and Matsuyama, 1979; Chui et al., 2017) of excessively bright areas in images before lane detection. The algorithm first normalizes brightness to create uniform luminosity. It then identifies bright spots significantly differing from their surroundings, using contextual cues to differentiate between genuine lane markings and artificial bright spots. Removing these bright areas ensures they do not influence lane detection. This pre-processing minimizes false positives from manipulated bright spots, adding robustness to the LD workflow. All images referenced in 6.1 were processed through this pipeline and applied to three LD algorithms (Fig. 11). The NS attack was effectively defended against by our method for CLRerNet (74%), TwinLiteNet (87%), and HybridNets (100%).
10. Conclusion
In this paper, we exploited a common vulnerability in LD algorithms that leads to the misdetection of lane markings. Our approach utilizes four parameters: length, width, distance, and the angle between the NS and the genuine lane marking. We determined the optimal values to ensure LD algorithms misdetect the NS as genuine lanes. Experiments in a simulated environment showed that a 20m NS attack could steer any AV off the road at speeds above 10 mph. To assess the stealthiness of the NS attack, we conducted a human study, which yielded an average stealthiness rating of 83.6%. Finally, we proposed a defense method, ’Luminosity Filter Pre-Processing,’ which showed success rates of 74%, 87%, and 100% against the NS attack when tested on the CLRerNet, TwinLiteNet, and HybridNets algorithms, respectively.
References
- (1)
- Alvarez and Ĺopez (2010) José M Álvarez Alvarez and Antonio M Ĺopez. 2010. Road detection based on illuminant invariance. IEEE transactions on intelligent transportation systems 12, 1 (2010), 184–193.
- Aly (2008) Mohamed Aly. 2008. Real time detection of lane markers in urban streets. In 2008 IEEE intelligent vehicles symposium. IEEE, 7–12.
- Becker et al. (2018) Christopher Becker, Larry Yount, Shane Rozen-Levy, John Brewer, et al. 2018. Functional safety assessment of an automated lane centering system. Technical Report. United States. Department of Transportation. National Highway Traffic Safety Administration.
- Beyeler et al. (2014) Michael Beyeler, Florian Mirus, and Alexander Verl. 2014. Vision-based robust road lane detection in urban environments. In 2014 IEEE International Conference on Robotics and Automation (ICRA). IEEE, 4920–4925.
- Bianco et al. (2012) Simone Bianco, Arcangelo Bruna, Filippo Naccari, and Raimondo Schettini. 2012. Color space transformations for digital photography exploiting information about the illuminant estimation process. JOSA A 29, 3 (2012), 374–384.
- Biggio et al. (2012) Battista Biggio, Blaine Nelson, and Pavel Laskov. 2012. Poisoning attacks against support vector machines. arXiv preprint arXiv:1206.6389 (2012).
- Boloor et al. (2019) Adith Boloor, Xin He, Christopher Gill, Yevgeniy Vorobeychik, and Xuan Zhang. 2019. Simple physical adversarial examples against end-to-end autonomous driving models. In 2019 IEEE International Conference on Embedded Software and Systems (ICESS). IEEE, 1–7.
- Buchholz and Richter (2023) Katharina Buchholz and Felix Richter. 2023. Infographic: Cars increasingly ready for autonomous driving. https://www.statista.com/chart/25754/newly-registered-cars-by-autonomous-driving-level/
- Calculator ([n. d.]) Shadow Calculator. [n. d.]. Shadow Calculator. http://shadowcalculator.eu. Accessed on April 5, 2024.
- Canny (1986) John Canny. 1986. A computational approach to edge detection. IEEE Transactions on pattern analysis and machine intelligence 6 (1986), 679–698.
- Cao et al. ([n. d.]) Yulong Cao, Yanan Guo, Takami Sato, Qi Alfred Chen, Z Morley Mao, and Yueqiang Cheng. [n. d.]. Remote Adversarial Attack on Automated Lane Centering. ([n. d.]).
- CARLA (2023a) CARLA. 2023a. CARLA Lincoln 2020 MKZ Model. https://carla.readthedocs.io/en/latest/catalogue_vehicles/#lincoln-mkz-2020
- CARLA (2023b) CARLA. 2023b. CARLA Simulator. https://carla.org
- Che et al. (2023) Quang Huy Che, Dinh Phuc Nguyen, Minh Quan Pham, and Duc Khai Lam. 2023. TwinLiteNet: An Efficient and Lightweight Model for Driveable Area and Lane Segmentation in Self-Driving Cars. arXiv preprint arXiv:2307.10705 (2023).
- Cheng et al. (2008) Hsu-Yung Cheng, Chih-Chang Yu, Chien-Cheng Tseng, Kuo-Chin Fan, Jenq-Neng Hwang, and Bor-Shenn Jeng. 2008. Hierarchical lane detection for different types of roads. In 2008 IEEE International Conference on Acoustics, Speech and Signal Processing. IEEE, 1349–1352.
- Chiu and Lin (2005) Kuo-Yu Chiu and Sheng-Fuu Lin. 2005. Lane detection using color-based segmentation. In IEEE Proceedings. Intelligent Vehicles Symposium, 2005. IEEE, 706–711.
- Chui et al. (2017) Charles K Chui, Guanrong Chen, et al. 2017. Kalman filtering. Springer.
- CivilSir (2024) CivilSir. 2024. Standard width of road — standard Road Lane width. https://civilsir.com/standard-width-of-road-standard-road-lane-width/
- Code (2024) Papers With Code. 2024. Lane Detection. https://paperswithcode.com/task/lane-detection
- comma.ai (2023) comma.ai. 2023. comma 3X - make driving chill. https://comma.ai/shop/comma-3x
- Comma.ai (2023) Comma.ai. 2023. Comma.ai Openpilot. https://www.comma.ai/openpilot
- Dai et al. (2020) Xingjian Dai, Jin Xie, Jianjun Qian, and Jian Yang. 2020. Lane detection combining details and integrity: an advanced method for lane detection. In Proceedings of the 2020 3rd International Conference on Algorithms, Computing and Artificial Intelligence. 1–6.
- Ding et al. (2022) Wenfei Ding, Huinan Sun, and Dezhong Ma. 2022. Research on Curve Lane Detection Method Based on Deep Learning. https://doi.org/10.3233/ATDE221099
- Dosovitskiy et al. (2017) Alexey Dosovitskiy, German Ros, Felipe Codevilla, Antonio Lopez, and Vladlen Koltun. 2017. CARLA: An open urban driving simulator. In Conference on robot learning. PMLR, 1–16.
- Federal Aviation Administration (2023) Federal Aviation Administration. 2023. Small Unmanned Aircraft Systems (UAS) Regulations (Part 107). https://www.faa.gov/uas/commercial_operators/part_107_rules/
- Foracchia et al. (2005) Marco Foracchia, Enrico Grisan, and Alfredo Ruggeri. 2005. Luminosity and contrast normalization in retinal images. Medical image analysis 9, 3 (2005), 179–190.
- Gonzalez and Ozguner (2000) Juan Pablo Gonzalez and Umit Ozguner. 2000. Lane detection using histogram-based segmentation and decision trees. In ITSC2000. 2000 IEEE Intelligent Transportation Systems. Proceedings (Cat. No. 00TH8493). IEEE, 346–351.
- Goodfellow et al. (2014) Ian J Goodfellow, Jonathon Shlens, and Christian Szegedy. 2014. Explaining and harnessing adversarial examples. arXiv preprint arXiv:1412.6572 (2014).
- Gopinath (1998) Ramesh A Gopinath. 1998. Maximum likelihood modeling with Gaussian distributions for classification. In Proceedings of the 1998 IEEE International Conference on Acoustics, Speech and Signal Processing, ICASSP’98 (Cat. No. 98CH36181), Vol. 2. IEEE, 661–664.
- Group (2024) Shouse Law Group. 2024. California Penal Code 594 PC - Vandalism Laws. https://www.shouselaw.com/ca/defense/penal-code/594/.
- Grundland and Dodgson (2007) Mark Grundland and Neil A Dodgson. 2007. Decolorize: Fast, contrast enhancing, color to grayscale conversion. Pattern Recognition 40, 11 (2007), 2891–2896.
- Han et al. (2022) Xingshuo Han, Guowen Xu, Yuan Zhou, Xuehuan Yang, Jiwei Li, and Tianwei Zhang. 2022. Physical backdoor attacks to lane detection systems in autonomous driving. In Proceedings of the 30th ACM International Conference on Multimedia. 2957–2968.
- Heidarizadeh (2021) Akram Heidarizadeh. 2021. Preprocessing Methods of Lane Detection and Tracking for Autonomous Driving. arXiv preprint arXiv:2104.04755 (2021).
- Hillel et al. (2014) Aharon Bar Hillel, Ronen Lerner, Dan Levi, and Guy Raz. 2014. Recent progress in road and lane detection: a survey. Machine vision and applications 25, 3 (2014), 727–745.
- Hoang et al. (2017) Toan Minh Hoang, Na Rae Baek, Se Woon Cho, Ki Wan Kim, and Kang Ryoung Park. 2017. Road lane detection robust to shadows based on a fuzzy system using a visible light camera sensor. Sensors 17, 11 (2017), 2475.
- Homes (2023) Rocket Homes. 2023. How Close Can You Build To Your Property Line. https://www.rockethomes.com/blog/homeowner-tips/how-close-can-you-build-to-property-line
- Honda and Uchida (2023) Hiroto Honda and Yusuke Uchida. 2023. CLRerNet: Improving Confidence of Lane Detection with LaneIoU. arXiv preprint arXiv:2305.08366 (2023).
- Huval et al. (2015) Brody Huval, Tao Wang, Sameep Tandon, Jeff Kiske, Will Song, Joel Pazhayampallil, Mykhaylo Andriluka, Pranav Rajpurkar, Toki Migimatsu, Royce Cheng-Yue, et al. 2015. An empirical evaluation of deep learning on highway driving. arXiv preprint arXiv:1504.01716 (2015).
- Jing et al. (2021) Pengfei Jing, Qiyi Tang, Yuefeng Du, Lei Xue, Xiapu Luo, Ting Wang, Sen Nie, and Shi Wu. 2021. Too good to be safe: Tricking lane detection in autonomous driving with crafted perturbations. In 30th USENIX Security Symposium (USENIX Security 21). 3237–3254.
- Justia (2023) Justia. 2023. Road Hazards Causing Car Accidents & Potential Legal Claims. https://www.justia.com/car-accidents/types-of-car-accidents/road-hazards/
- Kumar and Simon (2015) Ammu M Kumar and Philomina Simon. 2015. Review of lane detection and tracking algorithms in advanced driver assistance system. Int. J. Comput. Sci. Inf. Technol 7, 4 (2015), 65–78.
- Kurakin et al. (2018) Alexey Kurakin, Ian J Goodfellow, and Samy Bengio. 2018. Adversarial examples in the physical world. In Artificial intelligence safety and security. Chapman and Hall/CRC, 99–112.
- Lee et al. (2017) Seokju Lee, Junsik Kim, Jae Shin Yoon, Seunghak Shin, Oleksandr Bailo, Namil Kim, Tae-Hee Lee, Hyun Seok Hong, Seung-Hoon Han, and In So Kweon. 2017. Vpgnet: Vanishing point guided network for lane and road marking detection and recognition. In Proceedings of the IEEE international conference on computer vision. 1947–1955.
- Liu et al. (2021a) Lizhe Liu, Xiaohao Chen, Siyu Zhu, and Ping Tan. 2021a. Condlanenet: a top-to-down lane detection framework based on conditional convolution. In Proceedings of the IEEE/CVF International Conference on Computer Vision. 3773–3782.
- Liu et al. (2020) Rong Liu, Jinling Wang, and Bingqi Zhang. 2020. High definition map for automated driving: Overview and analysis. The Journal of Navigation 73, 2 (2020), 324–341.
- Liu et al. (2021b) Ruijin Liu, Zejian Yuan, Tie Liu, and Zhiliang Xiong. 2021b. End-to-end lane shape prediction with transformers. In Proceedings of the IEEE/CVF winter conference on applications of computer vision. 3694–3702.
- (48) Millennium Challenge Corporation (MCC). 2024. Property Rights and Land Policy. https://www.mcc.gov/sectors/sector/property-rights-and-land-policy/
- Mercedes-Benz USA (2023) Mercedes-Benz USA. 2023. DRIVE PILOT Automated Driving. https://www.mbusa.com/en/owners/manuals/drive-pilot. accessed: 06.12.2023.
- Michel et al. (2014) Julien Michel, David Youssefi, and Manuel Grizonnet. 2014. Stable mean-shift algorithm and its application to the segmentation of arbitrarily large remote sensing images. IEEE Transactions on Geoscience and Remote Sensing 53, 2 (2014), 952–964.
- Nagao and Matsuyama (1979) Makoto Nagao and Takashi Matsuyama. 1979. Edge preserving smoothing. Computer graphics and image processing 9, 4 (1979), 394–407.
- Neven et al. (2018) Davy Neven, Bert De Brabandere, Stamatios Georgoulis, Marc Proesmans, and Luc Van Gool. 2018. Towards end-to-end lane detection: an instance segmentation approach. In 2018 IEEE intelligent vehicles symposium (IV). IEEE, 286–291.
- Norden et al. (2019) Justin Norden, Matthew O’Kelly, and Aman Sinha. 2019. Efficient black-box assessment of autonomous vehicle safety. arXiv preprint arXiv:1912.03618 (2019).
- P.A. (2023) Rupprecht Law P.A. 2023. FAA Enforcement Actions Against Drone Pilots. https://jrupprechtlaw.com/faa-enforcement-actions-drones/
- Pan et al. (2018) Xingang Pan, Jianping Shi, Ping Luo, Xiaogang Wang, and Xiaoou Tang. 2018. Spatial as deep: Spatial cnn for traffic scene understanding. In Proceedings of the AAAI Conference on Artificial Intelligence, Vol. 32.
- Papernot et al. (2017) Nicolas Papernot, Patrick McDaniel, Ian Goodfellow, Somesh Jha, Z Berkay Celik, and Ananthram Swami. 2017. Practical black-box attacks against machine learning. In Proceedings of the 2017 ACM on Asia conference on computer and communications security. 506–519.
- Patro and Sahu (2015) SGOPAL Patro and Kishore Kumar Sahu. 2015. Normalization: A preprocessing stage. arXiv preprint arXiv:1503.06462 (2015).
- Pizer et al. (1987) Stephen M Pizer, E Philip Amburn, John D Austin, Robert Cromartie, Ari Geselowitz, Trey Greer, Bart ter Haar Romeny, John B Zimmerman, and Karel Zuiderveld. 1987. Adaptive histogram equalization and its variations. Computer vision, graphics, and image processing 39, 3 (1987), 355–368.
- Revilloud et al. (2016) Marc Revilloud, Dominique Gruyer, and Mohamed-Cherif Rahal. 2016. A lane marker estimation method for improving lane detection. In 2016 IEEE 19th International Conference on Intelligent Transportation Systems (ITSC). IEEE, 289–295.
- Samak et al. (2021) Chinmay Vilas Samak, Tanmay Vilas Samak, and Sivanathan Kandhasamy. 2021. Control strategies for autonomous vehicles. In Autonomous driving and advanced driver-assistance systems (ADAS). CRC Press, 37–86.
- Sato et al. (2021) Takami Sato, Junjie Shen, Ningfei Wang, Yunhan Jia, Xue Lin, and Qi Alfred Chen. 2021. Dirty road can attack: Security of deep learning based automated lane centering under Physical-World attack. In 30th USENIX Security Symposium (USENIX Security 21). 3309–3326.
- Scanlon et al. (2021) John M Scanlon, Kristofer D Kusano, Tom Daniel, Christopher Alderson, Alexander Ogle, and Trent Victor. 2021. Waymo simulated driving behavior in reconstructed fatal crashes within an autonomous vehicle operating domain. Accident Analysis & Prevention 163 (2021), 106454.
- Schwarting et al. (2018) Wilko Schwarting, Javier Alonso-Mora, and Daniela Rus. 2018. Planning and decision-making for autonomous vehicles. Annual Review of Control, Robotics, and Autonomous Systems 1 (2018), 187–210.
- Sheu et al. (2021) Jia-Shing Sheu, Tsai Chun-Kang, and Wang Po-Tong. 2021. Driving Assistance System with Lane Change Detection. Advances in Technology Innovation 6, 3 (2021), 137.
- Sobel (1968) I Sobel. 1968. Feldman G (1968) a 3 3 isotropic gradient operator for image processing. a talk at the Stanford Artificial Project (1968).
- Song et al. (2023) Ruoyu Song, Muslum Ozgur Ozmen, Hyungsub Kim, Raymond Muller, Z Berkay Celik, and Antonio Bianchi. 2023. Discovering Adversarial Driving Maneuvers against Autonomous Vehicles. In 32nd USENIX Security Symposium (USENIX Security 23). 2957–2974.
- Starosolski (2014) Roman Starosolski. 2014. New simple and efficient color space transformations for lossless image compression. Journal of Visual Communication and Image Representation 25, 5 (2014), 1056–1063.
- Sun et al. (2020) Jiachen Sun, Yulong Cao, Qi Alfred Chen, and Z Morley Mao. 2020. Towards robust LiDAR-based perception in autonomous driving: General black-box adversarial sensor attack and countermeasures. In 29th USENIX Security Symposium (USENIX Security 20). 877–894.
- Synopsys, Inc (2023) Synopsys, Inc. 2023. Autonomous Driving Levels Explained. https://www.synopsys.com/automotive/autonomous-driving-levels.html. accessed: 06.12.2023.
- Szegedy et al. (2013) Christian Szegedy, Wojciech Zaremba, Ilya Sutskever, Joan Bruna, Dumitru Erhan, Ian Goodfellow, and Rob Fergus. 2013. Intriguing properties of neural networks. arXiv preprint arXiv:1312.6199 (2013).
- Tesla, Inc (2023) Tesla, Inc. 2023. Autopilot and Full Self-Driving Capability. https://www.tesla.com/support/autopilot. accessed: 06.12.2023.
- to Artificial Intelligence (2023) Intro to Artificial Intelligence. 2023. Motion Planning Module in Autonomous Vehicle: Mission Planner. https://medium.com/intro-to-artificial-intelligence/motion-planning-module-in-autonomous-vehicle-mission-planner-671b2155dec1
- Tran et al. (2010) Trung-Thien Tran, Jin-Ho Son, Byun-Jae Uk, Jong-Hwa Lee, and Hyo-Moon Cho. 2010. An adaptive method for detecting lane boundary in night scene. In International Conference on Intelligent Computing. Springer, 301–308.
- U.S. Department of Transportation (2023) Federal Highway Administration U.S. Department of Transportation. 2023. Pavement Markings: Regulations and Standards. https://highways.dot.gov/safety/other/visibility/pavement-markings-regulations-standards
- User (2017) HUD User. 2017. According to data HUD and Census collected in the 2017 American Housing Survey (AHS). https://www.huduser.gov/portal/pdredge/pdr-edge-frm-asst-sec-080320.html#:~:text=According%20to%20data%20HUD%20and,describe%20their%20neighborhood%20as%20rural
- USLegal, Inc. (2023) USLegal, Inc. 2023. Criminal Impersonation Law and Legal Definition. https://definitions.uslegal.com/c/criminal-impersonation/
- Vu et al. (2022) Dat Vu, Bao Ngo, and Hung Phan. 2022. Hybridnets: End-to-end perception network. arXiv preprint arXiv:2203.09035 (2022).
- Yang (2023) Mingyue Yang. 2023. Lane Detection Methods Survey for Automatic Driving. In Journal of Physics: Conference Series, Vol. 2547. IOP Publishing, 012015.
- Yang et al. (2019) Wei-Jong Yang, Yoa-Teng Cheng, and Pau-Choo Chung. 2019. Improved lane detection with multilevel features in branch convolutional neural networks. IEEE Access 7 (2019), 173148–173156.
- Yenikaya et al. (2013) Sibel Yenikaya, Gökhan Yenikaya, and Ekrem Düven. 2013. Keeping the vehicle on the road: A survey on on-road lane detection systems. acm Computing Surveys (CSUR) 46, 1 (2013), 1–43.
- Zakaria et al. (2023) Noor Jannah Zakaria, Mohd Ibrahim Shapiai, Rasli Abd Ghani, MNM Yasin, Mohd Zamri Ibrahim, and Nurbaiti Wahid. 2023. Lane detection in autonomous vehicles: A systematic review. IEEE Access (2023).
- Zhang et al. (2022) Qingzhao Zhang, Shengtuo Hu, Jiachen Sun, Qi Alfred Chen, and Z Morley Mao. 2022. On adversarial robustness of trajectory prediction for autonomous vehicles. In Proceedings of the IEEE/CVF Conference on Computer Vision and Pattern Recognition. 15159–15168.
- Zhao et al. (2022) Wenbo Zhao, Wei Tian, Chengyu Lu, and Xianwang Yu. 2022. Lane Detection under Low-illumination Condition by Enhanced Feature Learning. Technical Report. SAE Technical Paper.
- Zheng et al. (2019) Ling Zheng, Bijun Li, Bo Yang, Huashan Song, and Zhi Lu. 2019. Lane-level road network generation techniques for lane-level maps of autonomous vehicles: A survey. Sustainability 11, 16 (2019), 4511.
- Zhong et al. (2022) Yiqi Zhong, Xianming Liu, Deming Zhai, Junjun Jiang, and Xiangyang Ji. 2022. Shadows can be dangerous: Stealthy and effective physical-world adversarial attack by natural phenomenon. In Proceedings of the IEEE/CVF Conference on Computer Vision and Pattern Recognition. 15345–15354.
- Zhu et al. (2021b) L. Zhu, K. Xu, Z. Ke, and R. W. Lau. 2021b. Mitigating intensity bias in shadow detection via feature decomposition and reweighting. In Proceedings of the IEEE/CVF International Conference on Computer Vision. 4702–4711.
- Zhu et al. (2021a) Yi Zhu, Chenglin Miao, Tianhang Zheng, Foad Hajiaghajani, Lu Su, and Chunming Qiao. 2021a. Can we use arbitrary objects to attack lidar perception in autonomous driving?. In Proceedings of the 2021 ACM SIGSAC Conference on Computer and Communications Security. 1945–1960.
- Zimmerman et al. (1988) John B Zimmerman, Stephen M Pizer, Edward V Staab, J Randolph Perry, William McCartney, and Bradley C Brenton. 1988. An evaluation of the effectiveness of adaptive histogram equalization for contrast enhancement. IEEE Transactions on Medical Imaging 7, 4 (1988), 304–312.
Appendix A LD Experiments