Evolutionary Greedy Algorithm for Optimal Sensor Placement Problem in Urban Sewage Surveillance
Abstract.
Designing a cost-effective sensor placement plan for sewage surveillance is a crucial task because it allows cost-effective early pandemic outbreak detection as supplementation for individual testing. However, this problem is computationally challenging to solve, especially for massive sewage networks having complicated topologies. In this paper, we formulate this problem as a multi-objective optimization problem to consider the conflicting objectives and put forward a novel evolutionary greedy algorithm (EG) to enable efficient and effective optimization for large-scale directed networks. The proposed model is evaluated on both small-scale synthetic networks and a large-scale, real-world sewage network in Hong Kong. The experiments on small-scale synthetic networks demonstrate a consistent efficiency improvement with reasonable optimization performance and the real-world application shows that our method is effective in generating optimal sensor placement plans to guide policy-making.
1. Introduction
The COVID-19 pandemic highlighted the importance of a reliable monitoring system for disease outbreak detection. In the past pandemic, individual RT-PCR test is the most commonly used method for disease surveillance. However, it has limitations in timelessness, and accessibility, and would interfere with people’s daily life (Zhang et al., 2023). Sewage surveillance performs biological or chemical tests on wastewater samples to reflect the overall health conditions of a community and has demonstrated effectiveness in fighting infectious diseases (Smith et al., 2016; McLeod, 2000). It has gained people’s attention as a complementary passive sensing approach to detecting viral outbreaks in a large urban area, with over 55 countries adopting it to monitor the outbreak of COVID-19 (Vandenberg et al., 2021; Daughton, 2020; O’Keeffe, 2021; Mercer and Salit, 2021; Sims and Kasprzyk-Hordern, 2020; Naughton et al., 2023). Although the influence of COVID-19 is gradually decreasing and is no longer a global public health issue of concern, the actions taken to combat COVID-19 hold significant guidance for public health in the post-pandemic phase. One important aspect of future early warning systems is to extend the sewage surveillance systems as a sustainable infrastructure for long-term health monitoring, such as antibiotic-resistant virus surveillance (Hamzelou, 2023; Aarestrup and Woolhouse, 2020; Larsson et al., 2022).
However, designing a cost-effective sewage surveillance system is challenging, especially for networks with large sizes. Firstly, cost-effective detection is a multi-objective optimization problem in nature since it usually involves multiple conflicting objectives, such as coverage and budget. Secondly, a given number of sensors will be placed to achieve the desired performance for a network. For large networks, more sensors should be deployed, increasing the computational cost. Fundamentally, the design of the sewage surveillance system can be formulated as an optimal sensor placement (OSP) problem in networks, where we are given a network with a signal passing along the network, and we need to select a given number of nodes to capture this signal cost-effectively.
The typical greedy algorithm solves a problem by selecting the best possible choice at each iteration. It can find the suboptimal solutions with near optimality guarantee more efficiently and is usually applied to single-objective optimization problems (Jiang et al., 2019). However, for multi-objective optimization problems, we aim to generate a set of solutions that define the best trade-off between several competing objectives. Different from single-objective optimization, the quality of the solutions of multi-objective optimization cannot be measured by the unique objective function but should be determined based on dominance (Deb et al., 2002). Nakai et al. (Nakai et al., 2022) proposed the nondominated-solution-based multi-objective greedy (NMG) method to extend the greedy algorithm for multi-objective optimization. At each step, NMG employs non-dominated sorting to evaluate multiple objective functions simultaneously and select solutions based on their ranks and crowding distances. However, traversing all the potential candidate sites in the sensor placement is time-consuming because the size of solutions for non-dominated sorting is large.
To solve these problems, this work aims to develop a multi-objective optimization model for the sewage surveillance system design and propose a novel Evolutionary Greedy (EG) algorithm by introducing the evolutionary mechanism into the NMG to scale up it to large-scale problems. Specifically, at each iteration, we generate some new solutions and combine these solutions with the solutions passed into this iteration for non-dominated sorting. Furthermore, we design a final solution candidate set to evaluate the quality of solutions which dominate other solutions and meet the cost constraint. The effectiveness of EG is first verified on small-scale synthetic networks. Then, we apply it to a real-world sewage network in Tuen Mun District, Hong Kong for a case study.
2. Problem Statement
Our previous work (Wang et al., 2024) proposed a multi-objective optimization model for sewage surveillance. Building on this foundation, we modify the model to find the location of sensors that can maximize sensing coverage while minimizing expected search cost, with the number of sensors as a constraint rather than an objective.
Given a sewage network with manholes, let = (, , …, ) denote a sensor placement plan, where denotes a sensor placed at manhole , and denotes a manhole without a sensor. Let be a binary variable, where represents the manhole is upstream of manhole and otherwise. Furthermore, we adopt the concept of entry set proposed by Nourinejad et al. (Nourinejad et al., 2021) to approach the upstream-downstream relationship between sensors. The entry set of the sensor placed at manhole is composed of the manholes for which the sensor is the first to detect the presence of the virus originating from those manholes. We use to denote the size of the entry set of the sensor placed at manhole . An example can be found in Figure 1. The optimization problem can be formulated as follows:
| (1) | ||||
| (2) | ||||
| (3) | s.t. | |||
| (4) | ||||
| (5) |
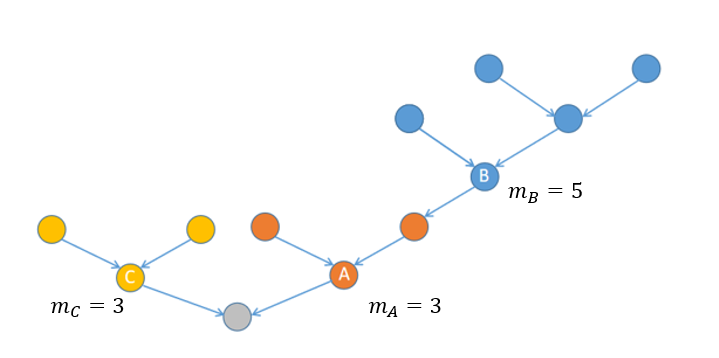
Objective 1 maximizes the effective coverage of a sensor placement plan and objective 2 minimizes the additional search cost to detect the exact location of the virus. Objective 2 is inspired by the concept of spatial resolution of satellite imagery, where the observational resolution measures the level of observed details provided by a sensing plan. Because of the limited budget, all the sensor placement plans should satisfy the cost constraint (3). Equation (4) illustrates the calculation of the entry set size, which equals the total number of manholes covered by that sensor minus the sum of the entry set sizes of all sensors located upstream of the current sensor. To calculate , we adopt a backward search strategy, in which we identify the upstream-most sensors, calculate for them, remove them, and repeat the above steps until there is no sensor in the network. Equation (5) guarantees that is a binary variable and is an integer.
3. Methodology
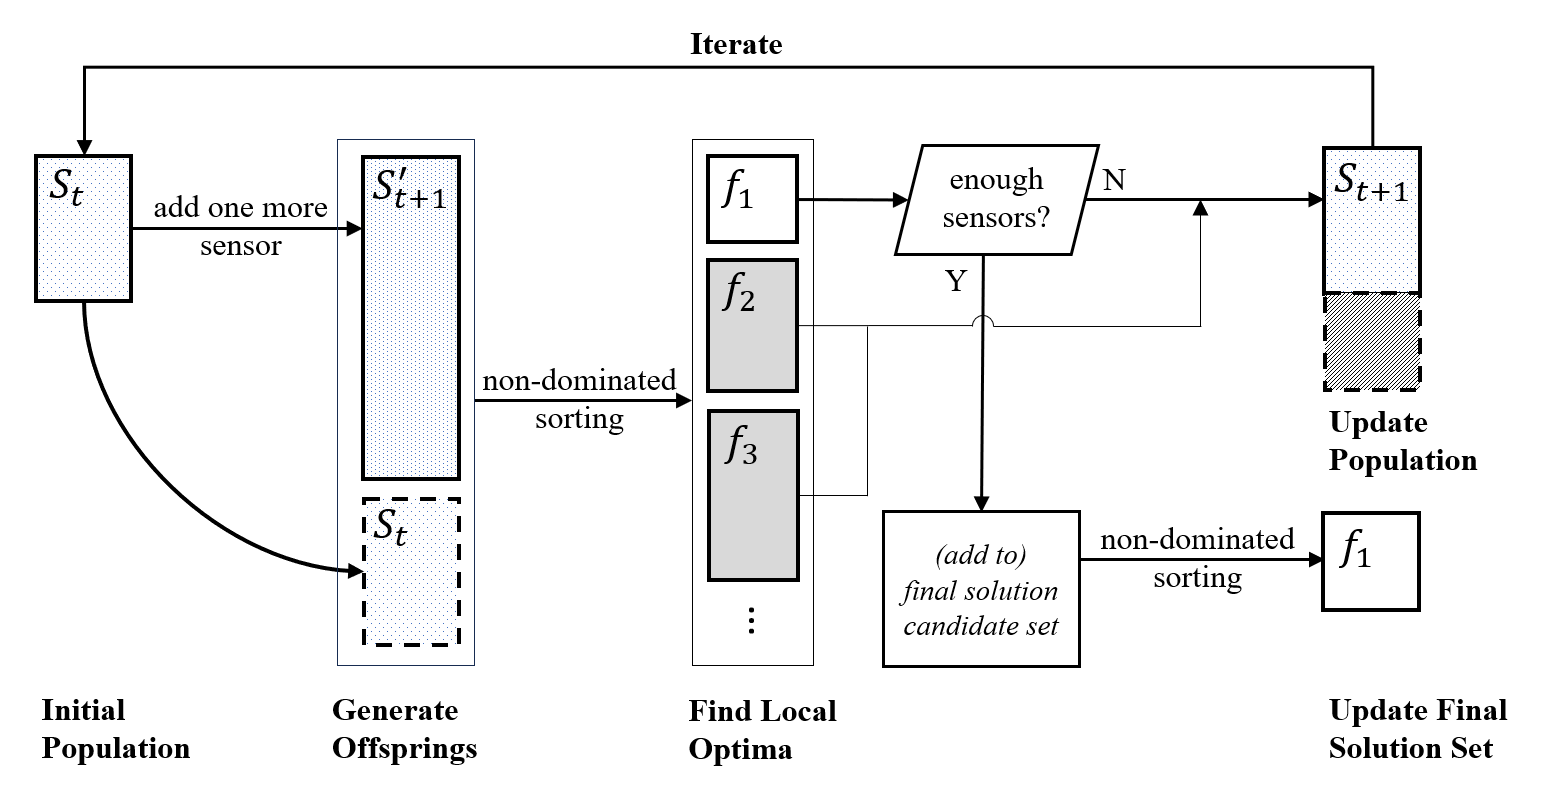
To address the problems mentioned in Section 2, we proposed a new algorithm EG to solve the model by combining greedy and evolutionary algorithms. The flowchart is shown in Figure 2.
Initialize population. Just like in a classic greedy algorithm, a population of sensor placement plans is initialized from scratch, with each plan initially not having any sensors.
Generate offsprings. In each iteration, each sensor placement plan from the previous population, , will generate new sensor placement plans by adding one more sensor. While the classic greedy algorithm iterates through all candidate locations, it is usually not computationally feasible to do so for large-scale optimization problems. We assign a parameter, , to denote the number of distinct new plans generated from each original plan. A total of sensor placement plans will be generated. Duplicates are removed.
Find local optima. Different from NMG, the local optima at each step is selected from a combined set of newly generated sensor placement plans () and plans in the former step () using a non-dominated sorting algorithm, which assigns solutions to the corresponding front and measures the crowding distance of each solution (Deb et al., 2002). After sorting, solutions in the first front () are the local optimal solutions at this iteration. Top solutions from solutions not having met the sensor number constraint (Eq.3) are selected to form the next population, .
Update final solution set. In each iteration, local optimal solutions having met the sensor number constraint (Eq.3) will be added to the final solution candidate set and sorted. The optimization process ends when the of the candidate set is populated with at least final solutions.
4. Experiment Setup
4.1. Network Data
We examine the effectiveness of the model and algorithm in both synthetic cases and a real-life case in the mega-city of Hong Kong:
-
•
Small-scale Synthetic Data. Several small-scale synthetic networks were created to preliminarily examine the effectiveness of the model formulation and optimization algorithms. First, generation probabilities of node types having different outdegrees were summarized from real-world sewage networks. Second, synthetic networks were generated using Monte Carlo sampling configured using real-world node generation probabilities.
-
•
Large-scale Real-world Data. A large-size, real-world sewage network data in the Tuen Mun District, Hong Kong, with 4,394 nodes and 4,308 edges was used to test the algorithmic performances on large-scale networks. The original dataset was obtained from HK GeoInfo Map111https://www.map.gov.hk/gm/. Necessary data prepossessing work was performed manually to fix network topological issues and the processed data can be found at https://github.com/hkuzebralab/spo-nsga.
4.2. Evaluation Metric & Baseline
We use the hypervolume indicator (HV) (Guerreiro et al., 2021), which measures the volume of the n-dimensional region between the solution set and a reference point to evaluate the quality of the Pareto-optimal solutions generated by different algorithms. A max-min normalization procedure was carried out to convert all objective values to the range of 0 to 1 before to the HV computation because distinct objectives had varied scales. Therefore, in our problem, the reference point was set to (1, 1). The NMG algorithm proposed by Nakai et al. (Nakai et al., 2022) is utilized as a baseline.
5. Results & Discussion
5.1. Performance & Efficiency on Synthetic Networks
We first test the algorithm on synthetic networks with varying sizes from 100 to 3000 in terms of performance and efficiency.
Performance. Table 1 summarizes normalized HV. For the network with the size of 100, the EG algorithm with produces the best solutions, with the highest HV of 0.301. For the networks with sizes of 500 and 1000, the NMG algorithm generates the best solutions, with the highest HV of 0.339 and 0.298 respectively. The highest HVs of the proposed algorithm are 0.320 and 0.270, only 5.6% and 9.4% worse than the NMG algorithm. Furthermore, as increases, the HVs increase though some fluctuations may exist.
| size | NMG | EG(5) | EG(10) | EG(15) | EG(20) | EG(25) |
|---|---|---|---|---|---|---|
| 100 | 0.297 | 0.266 | 0.277 | 0.301 | 0.301 | 0.284 |
| 500 | 0.339 | 0.212 | 0.294 | 0.309 | 0.320 | 0.310 |
| 1000 | 0.298 | 0.226 | 0.251 | 0.257 | 0.269 | 0.270 |
| 1500 | ** | 0.182 | 0.232 | 0.257 | 0.264 | 0.272 |
| 2000 | ** | 0.190 | 0.217 | 0.236 | 0.254 | 0.250 |
| 2500 | ** | 0.140 | 0.215 | 0.237 | 0.243 | 0.254 |
| 3000 | ** | 0.150 | 0.209 | 0.241 | 0.252 | 0.262 |
-
•
Note: 1. NMG represents the non-dominated-solution-based multi-objective greedy algorithm, EG () represents the new evolutionary greedy algorithm and new plans are generated from one plan.
-
•
2. ** represents that a solution cannot be obtained within the specific time frame (3 days in this study)
Efficiency. We report the execution time in Table 2 to analyze the algorithms’ efficiency. According to Table 2, the NMG algorithm cannot generate a feasible solution for the networks with more than 1500 nodes in 3 days. For networks with sizes of 100, 500 and 1000, the proposed EG algorithm performs consistently more efficiently than the NMG algorithm, with all experiments being finished in 1 hour. For one specific network, the execution time of our new algorithm is shorter than that of the NMG algorithm, and the efficiency increases for larger networks. Comparing the NMG algorithm and the EG algorithm with , the efficiency increases by 100 times, 1753 times and 4000 times. Since the number of solutions that need to be sorted at each iteration increases, the efficiency of the proposed algorithm decreases as becomes larger, but still within the acceptable time range. We can conclude that our algorithm can find solutions with reasonable performance more efficiently.
| size | NMG | EG(5) | EG(10) | EG(15) | EG(20) | EG(25) |
|---|---|---|---|---|---|---|
| 100 | 60.69 | 0.59 | 1.63 | 3.60 | 5.30 | 6.70 |
| 500 | 13503.35 | 7.70 | 17.61 | 37.80 | 52.71 | 74.33 |
| 1000 | 113634.28 | 28.39 | 66.55 | 132.97 | 183.05 | 230.37 |
| 1500 | ** | 65.40 | 162.11 | 288.94 | 400.25 | 482.01 |
| 2000 | ** | 137.53 | 316.95 | 540.83 | 738.66 | 900.49 |
| 2500 | ** | 226.56 | 530.00 | 860.05 | 1231.59 | 1466.69 |
| 3000 | ** | 366.28 | 855.06 | 1324.21 | 1929.44 | 2361.41 |
-
•
Note: 1. NMG represents the non-dominated-solution-based multi-objective greedy algorithm, EG () represents the new evolutionary greedy algorithm and new plans are generated from one plan.
-
•
2. ** represents that a solution cannot be obtained within the specific time frame (3 days in this study)
5.2. Application: A Case Study in Hong Kong
We further apply the proposed algorithm to the sewage network in Tuen Mun District, Hong Kong to investigate how can the evolutionary greedy algorithm be applied to solve the real-world problem. We set the cost constraint as 100 based on the actual sampling situation. We generate 20 solutions and test different numbers of new plans to generate at each iteration. Table 3 shows that the proposed algorithm achieves the best performance when with an execution time of 3.9 minutes, ensuring both efficient computation and high-quality solutions. Therefore, we take these solutions for further analysis.
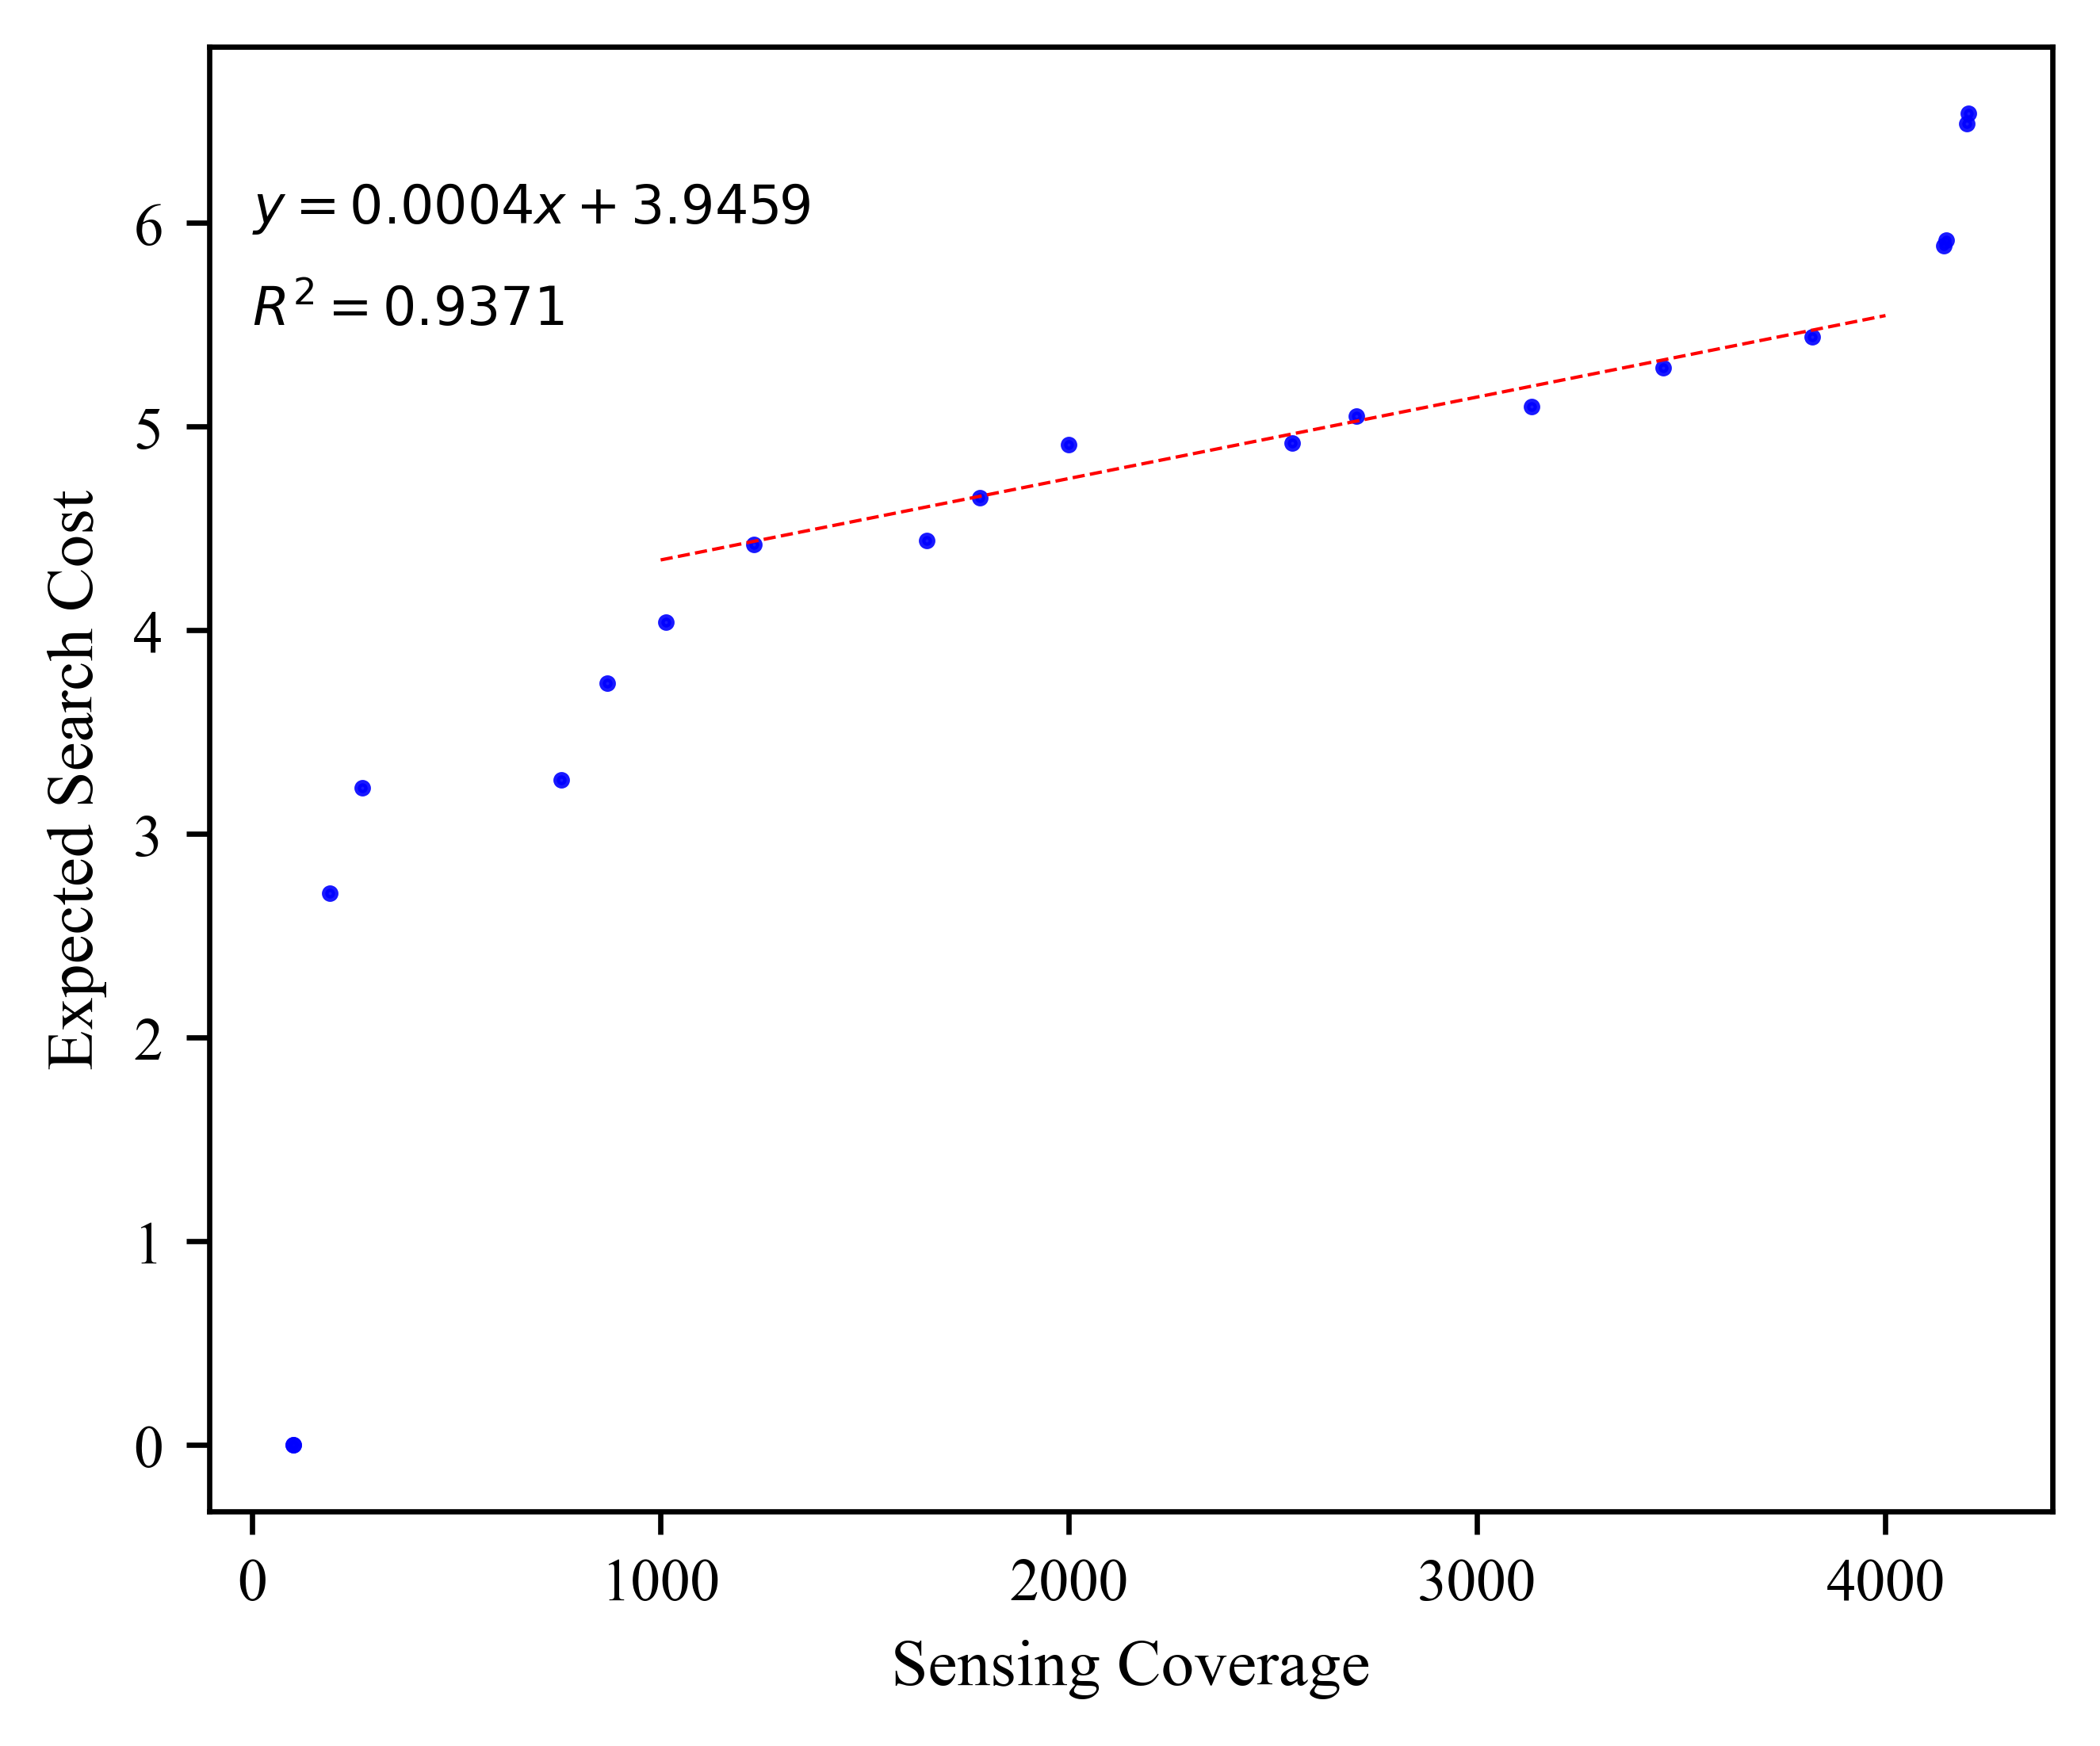
Figure 3 demonstrates the Pareto front of the obtained solutions, which can be used to analyze the trade-off between the conflicting objectives. With the sensing coverage increasing, the expected search cost increases. It is noticeable that the expected search cost increases slowly when sensing coverage increases from 1229 to 3820. We extract those solutions and fit them with a linear function. The is 0.9371, indicating that the linear function can capture the relationship between sensing coverage and expected search cost perfectly. The slope is 0.0004, indicating that our algorithm can generate solutions that ensure adequate sensing coverage with minimal increase in expected search cost.
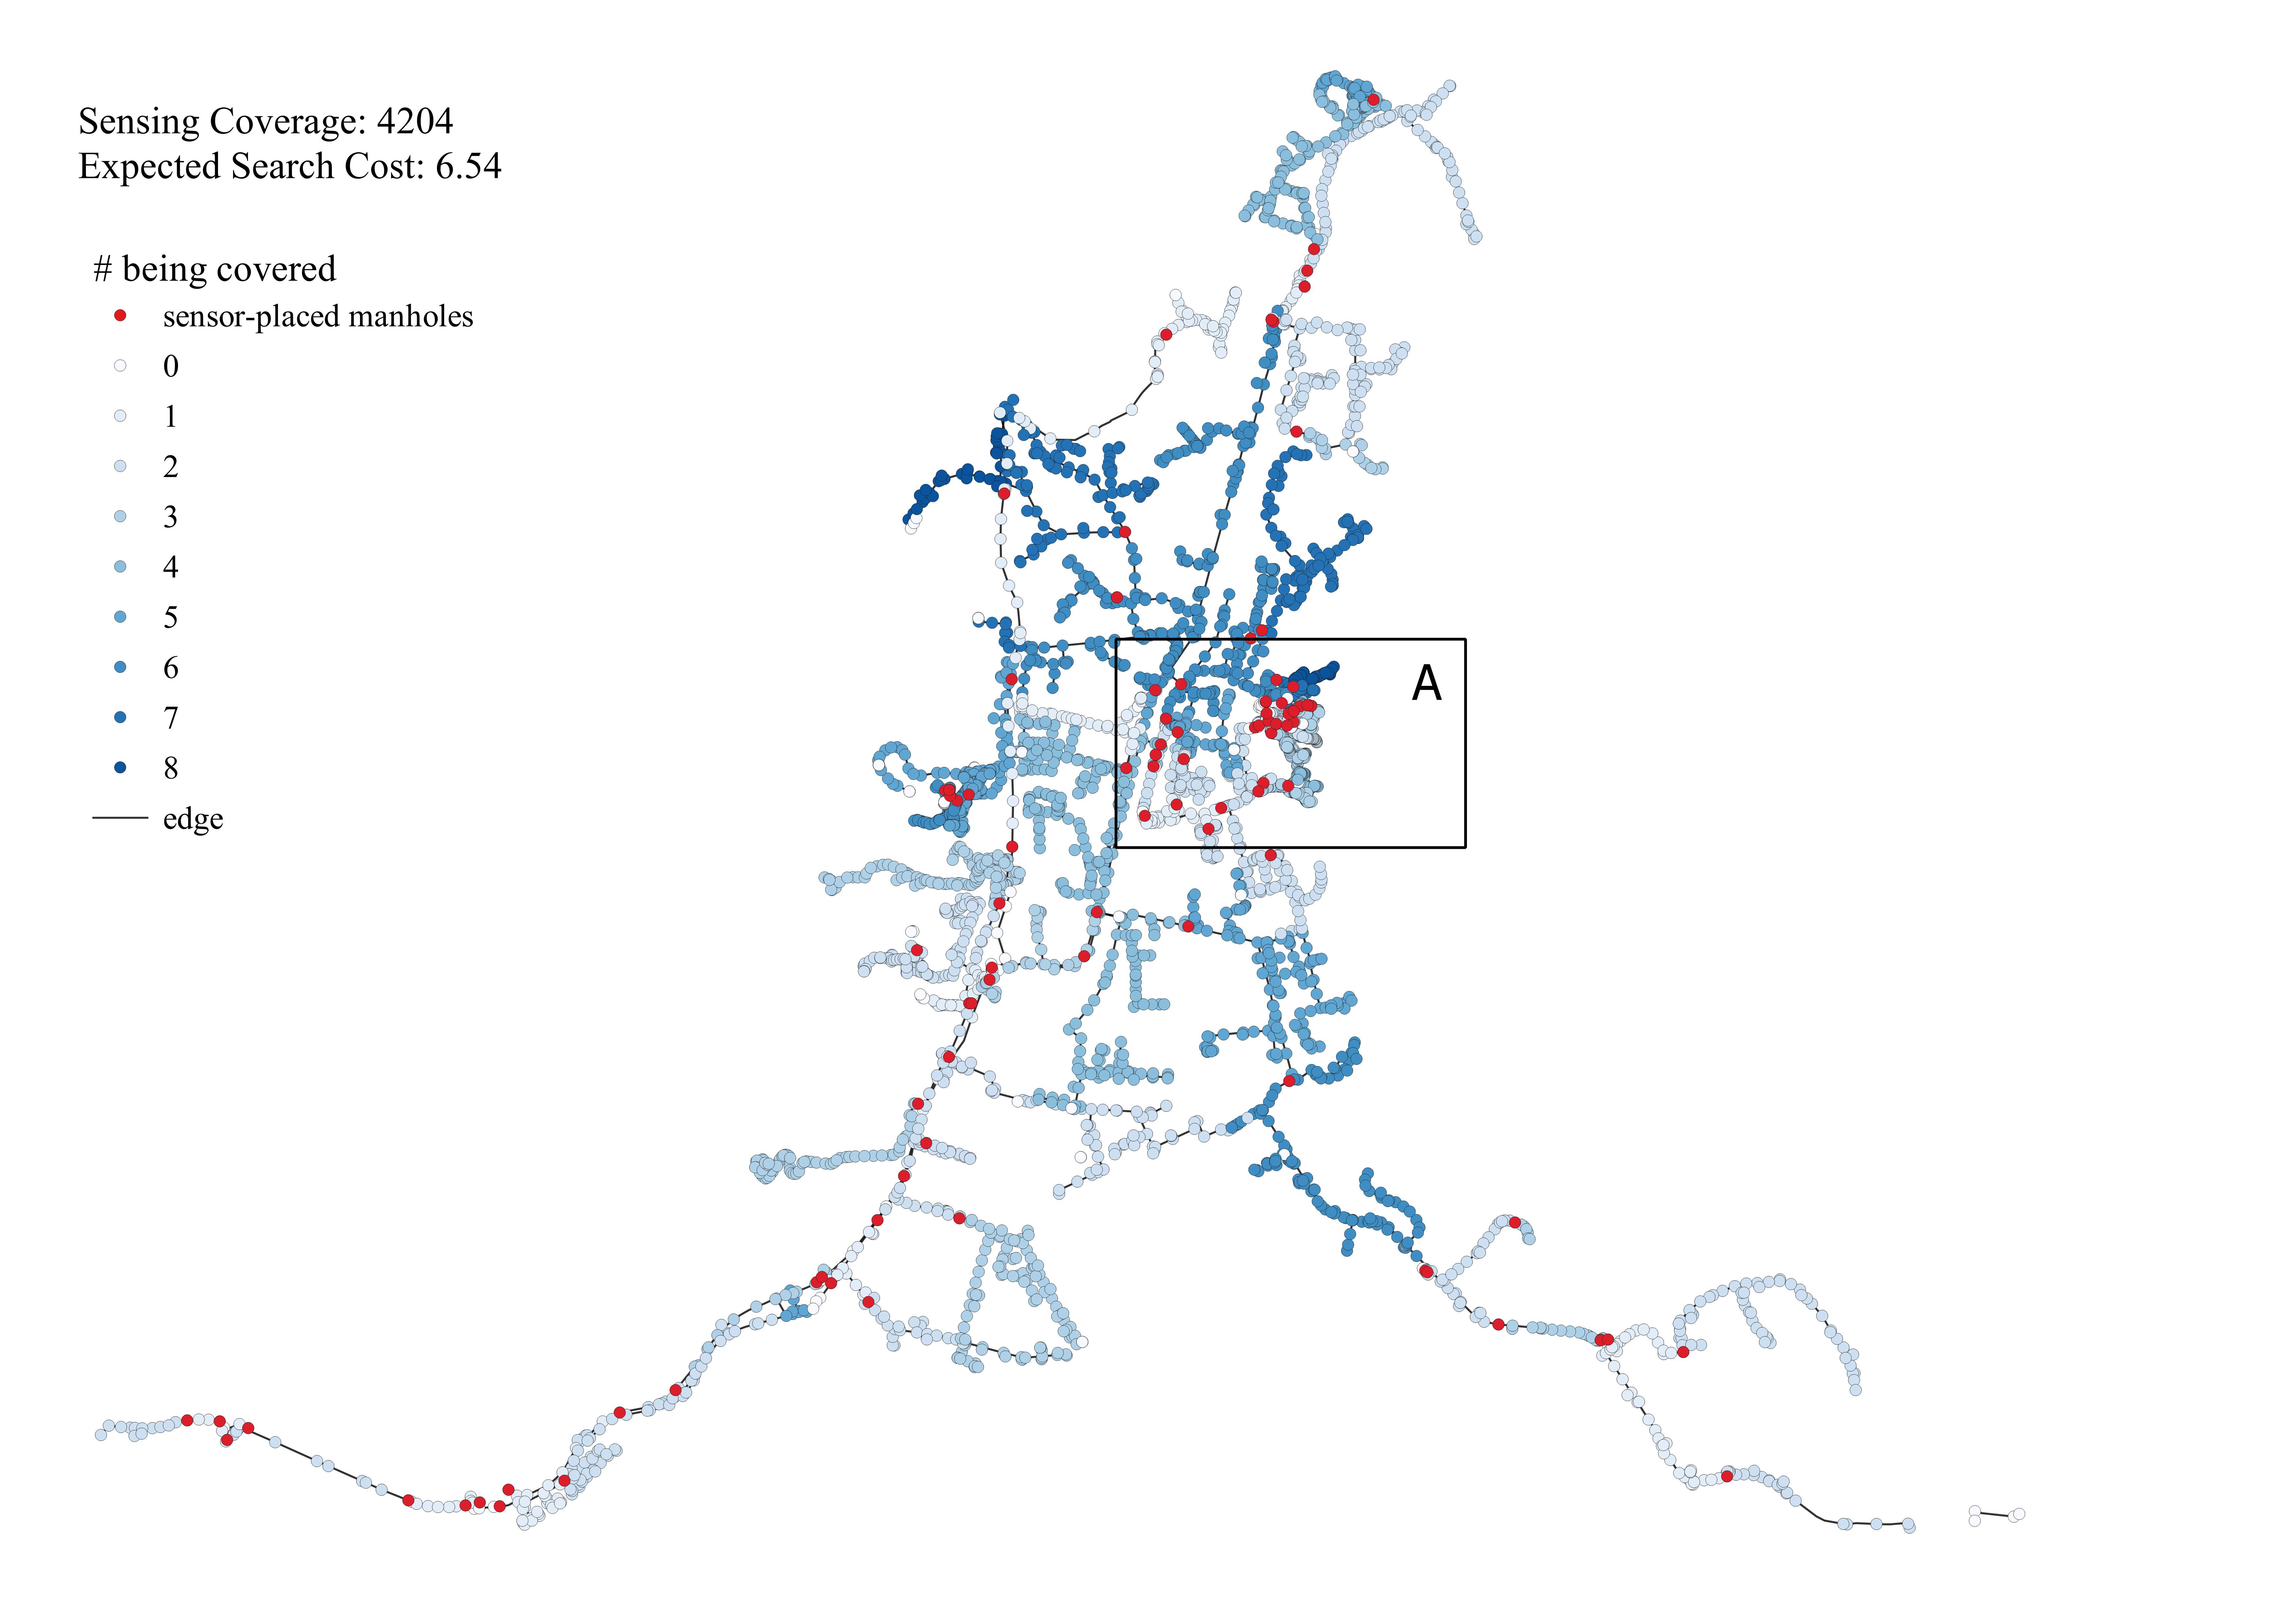
Furthermore, we select the solution with the maximum sensing coverage as an example and visualize it in Figure 4. The sensing coverage and expected search cost of this solution are 4204 and 6.54 respectively. The sensors are evenly distributed in the sewage system, with some sensors clustering in area A. The maximum number of being covered times of each manhole is 8 and these manholes are mainly located above area A. Manholes located far away from the main branch are less covered.
| EG(5) | EG(10) | EG(15) | EG(20) | EG(25) | EG(30) | |
|---|---|---|---|---|---|---|
| Time | 31.07 | 72.55 | 121.49 | 178.70 | 235.17 | 327.76 |
| HV | 0.222 | 0.240 | 0.258 | 0.272 | 0.282 | 0.276 |
6. Conclusion
The sewage system is a fundamental city infrastructure and plays an important role in the early detection of disease outbreaks. To provide reasonable decision support, this paper formulated a multi-objective optimization problem and presented an evolutionary greedy algorithm to optimize the sensor placement for sewage surveillance. The algorithm comparison on synthetic networks illustrates that our algorithm can achieve good performance with less computation time. The proposed model and algorithm are successfully tested in a case study of Tuen Mun District, Hong Kong, highlighting the significance and applicability of our method in addressing real-world problems.
References
- (1)
- Aarestrup and Woolhouse (2020) Frank M Aarestrup and Mark EJ Woolhouse. 2020. Using sewage for surveillance of antimicrobial resistance. Science 367, 6478 (2020), 630–632.
- Daughton (2020) Christian G Daughton. 2020. Wastewater surveillance for population-wide Covid-19: The present and future. Science of the Total Environment 736 (2020), 139631.
- Deb et al. (2002) Kalyanmoy Deb, Samir Agrawal, Amrit Pratap, and T. Meyarivan. 2002. A fast and elitist multiobjective genetic algorithm: NSGA-II. IEEE Trans. Evol. Comput. 6 (2002), 182–197.
- Guerreiro et al. (2021) Andreia P. Guerreiro, Carlos M. Fonseca, and Luí s Paquete. 2021. The Hypervolume Indicator. Comput. Surveys 54, 6 (jul 2021), 1–42. https://doi.org/10.1145/3453474
- Hamzelou (2023) Jessica Hamzelou. 2023. We can use sewage to track the rise of antibiotic-resistant bacteria. MIT Technology Review (2023). https://www.technologyreview.com/2023/01/13/1066837/sewage-track-antibiotic-resistant-bacteria/
- Jiang et al. (2019) Chaoyang Jiang, Zhenghua Chen, Rong Su, and Yeng Chai Soh. 2019. Group Greedy Method for Sensor Placement. IEEE Transactions on Signal Processing 67, 9 (2019), 2249–2262. https://doi.org/10.1109/TSP.2019.2903017
- Larsson et al. (2022) DG Joakim Larsson, Carl-Fredrik Flach, and Ramanan Laxminarayan. 2022. Sewage surveillance of antibiotic resistance holds both opportunities and challenges. Nature Reviews Microbiology (2022), 1–2.
- McLeod (2000) Kari S McLeod. 2000. Our sense of Snow: the myth of John Snow in medical geography. Social science & medicine 50, 7-8 (2000), 923–935.
- Mercer and Salit (2021) Tim R Mercer and Marc Salit. 2021. Testing at scale during the COVID-19 pandemic. Nature Reviews Genetics 22, 7 (2021), 415–426.
- Nakai et al. (2022) Kumi Nakai, Yasuo Sasaki, Takayuki Nagata, Keigo Yamada, Yuji Saito, and Taku Nonomura. 2022. Nondominated-solution-based multi-objective greedy sensor selection for optimal design of experiments. IEEE Transactions on Signal Processing 70 (2022), 5694–5707.
- Naughton et al. (2023) Colleen C Naughton, Fernando A Roman Jr, Ana Grace F Alvarado, Arianna Q Tariqi, Matthew A Deeming, Krystin F Kadonsky, Kyle Bibby, Aaron Bivins, Gertjan Medema, Warish Ahmed, et al. 2023. Show us the data: global COVID-19 wastewater monitoring efforts, equity, and gaps. FEMS Microbes 4 (2023), xtad003.
- Nourinejad et al. (2021) Mehdi Nourinejad, Oded Berman, and Richard C Larson. 2021. Placing sensors in sewer networks: A system to pinpoint new cases of coronavirus. PloS one 16, 4 (2021), e0248893.
- O’Keeffe (2021) Juliette O’Keeffe. 2021. Wastewater-based epidemiology: current uses and future opportunities as a public health surveillance tool. Environmental Health Review 64, 3 (2021), 44–52.
- Sims and Kasprzyk-Hordern (2020) Natalie Sims and Barbara Kasprzyk-Hordern. 2020. Future perspectives of wastewater-based epidemiology: monitoring infectious disease spread and resistance to the community level. Environment international 139 (2020), 105689.
- Smith et al. (2016) Donald B Smith, Julius O Paddy, and Peter Simmonds. 2016. The use of human sewage screening for community surveillance of hepatitis E virus in the UK. Journal of Medical Virology 88, 5 (2016), 915–918.
- Vandenberg et al. (2021) Olivier Vandenberg, Delphine Martiny, Olivier Rochas, Alex van Belkum, and Zisis Kozlakidis. 2021. Considerations for diagnostic COVID-19 tests. Nature Reviews Microbiology 19, 3 (2021), 171–183.
- Wang et al. (2024) Sunyu Wang, Ke Xu, and Yulun Zhou. 2024. Cost-effective sensor placement optimization for large-scale urban sewage surveillance. Sustainable Cities and Society (2024), 105250.
- Zhang et al. (2023) Zhicheng Zhang, Sonja Neumeister, Angel Desai, Maimuna S Majumder, and Fei Fang. 2023. Unlocking the Potential of Public Datasets: Wastewater-Based Epidemiological Forecasting During COVID-19. In epiDAMIK 6.0: The 6th International workshop on Epidemiology meets Data Mining and Knowledge Discovery at KDD 2023.