LLMCount: Enhancing Stationary mmWave Detection with Multimodal-LLM
Abstract
Millimeter wave sensing provides people with the capability of sensing the surrounding crowds in a non-invasive and privacy-preserving manner, which holds huge application potential. However, detecting stationary crowds remains challenging due to several factors such as minimal movements (like breathing or casual fidgets), which can be easily treated as noise clusters during data collection and consequently filtered in the following processing procedures. Additionally, the uneven distribution of signal power due to signal power attenuation and interferences resulting from external reflectors or absorbers further complicates accurate detection. To address these challenges and enable stationary crowd detection across various application scenarios requiring specialized domain adaption, we introduce LLMCount, the first system to harness the capabilities of large-language models (LLMs) to enhance crowd detection performance. By exploiting the decision-making capability of LLM, we can successfully compensate the signal power to acquire a uniform distribution and thereby achieve a detection with higher accuracy. To assess the system’s performance, comprehensive evaluations are conducted under diversified scenarios like hall, meeting room, and cinema. The evaluation results show that our proposed approach reaches high detection accuracy with lower overall latency compared with previous methods.
Index Terms:
component, formatting, style, styling, insert.I Introduction
Millimeter wave (mmWave) sensing enables a natural way to detect surrounding objects, which has shown huge potential in various application scenarios like crowd detection, transportation management[1], or industrial automation[2], with its non-invasive and privacy-preserving features. Among the various application scenarios, crowd detection shows huge potential in providing necessary information for healthcare [3], education, or entertainment services. Traditional methods like camera-based approaches [4] utilize computer vision detection algorithms to detect the crowd from captured images on a specific position. However, such approaches raise the problem of privacy disclosure and are often affected by limited illumination conditions. To avoid such defects, WiFi-based approaches [5] are proposed. Whilst, such approaches ignore the detection accuracy, lacking the ability to identify the precise location of each individual in the crowd. To tackle the above-mentioned problems, mmWave sensing approaches [6] are adopted. In addition, as the main medium of emerging 5G communications, mmWave also contains the potential to be exploited as a ubiquitous sensing tool in the upcoming artificial general intelligence era.
Previous works of mmWave sensing for crowd detection have shown their capability of sensing the crowd at satisfactory accuracy. However, we still face some challenges: Firstly, parameter optimization in the data enhancement process often lacks precision, leading to either data distortion or over-enhancement. This misadjustment significantly affects the accuracy and reliability of target detection, undermining the overall system performance [7]. Secondly, the high computational demands of mmWave systems strain local device resources, increasing operational costs and limiting deployment in energy-constrained environments. Efficient algorithmic improvements are essential to balance computational intensity with power consumption without sacrificing detection accuracy [8]. Lastly, the ability of mmWave sensing to generalize across different sensors is limited, as existing methods are often inflexible to varying operational conditions and sensor characteristics. Enhancing adaptability is crucial for scaling the technology across diverse deployment scenarios and sensor types [9].
To tackle the above-mentioned challenges, we hereby propose LLMCount, aiming to exploit the power of multimodal large-language models (MLLM) to enhance the sensing performance of millimeter-wave sensors. We conclude our contributions as follows:
-
•
We achieved higher detection performance by harnessing the decision-making power of MLLM to gain better data processing capability.
-
•
By offloading most processing to the cloud, we mitigate the local computation consumption and increase the detection frequency.
-
•
The system’s ability to generalize across diverse devices and scenarios in detection is significantly enhanced.
Note: To facilitate observation & comparison, we visualize the intermediate data in this workflow as heatmaps.
II System Design
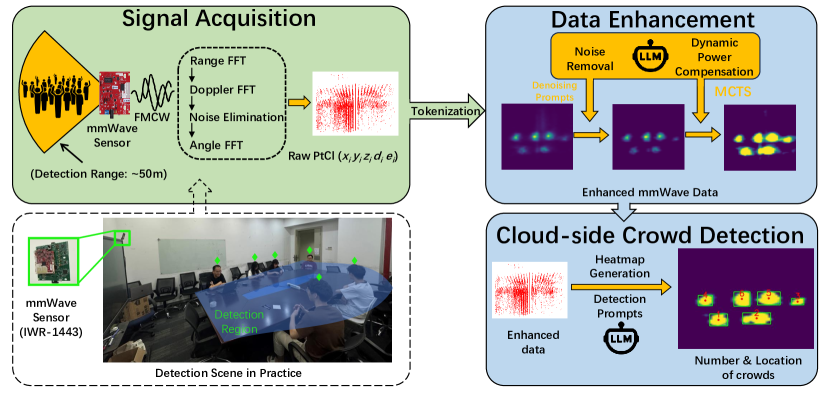
We illustrate the system architecture of LLMCount in Figure 1, which consists of three modules, with one running on local processing units (shown in light green) and two deployed on multimodal-LLM as processing agents (shown in light blue). By leveraging LLMCount, users can collect the raw mmWave data using commodity radar chips and upload the raw data to the cloud-side agents for detection and get the detection results in real time. The working region for the system covers a region with a radius of about 50 meters (varies depending on sensor type) which is capable of most application scenarios.
II-A Signal Acquisition
In this work, we use IWR-1443 by Texas Instrument as the testbed, the working region covers an area of half-round with a radius of 50 meters. The signal acquisition module is composed of a mmWave radar chip deployed on an edge computing unit with limited computation resources (Nvidia Jetson Nano). The collected data is initially preprocessed locally and output in the format of raw point clouds with noise interference included. Then, the data is output as coordinates and instantaneous velocities of the points generated by the radar. In practice, during each short interval referred to as a ’frame’, the radar generates multiple points. Each of these points is represented by a vector:
| (1) |
in which refers to the index of this point in current frame, , and refers to the point’s spatial coordinates (relative position to the radar antenna), refers to doppler, the relative velocity to the radar antenna, the refers to the energy intensity of the reflected signal.
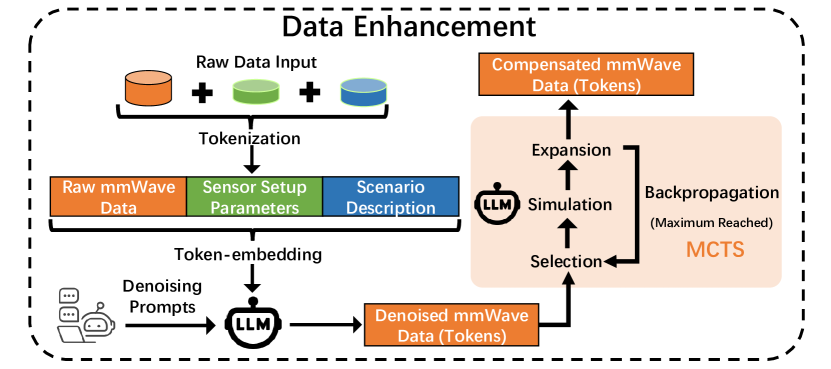
II-B Data Enhancement
Collected raw mmWave data are often accompanied by noise and distributed ununiformly as results of multipath effect [10], environmental reflection [11], and propagation attenuation [12] which can not be directly employed for crowd detection. To prepare the raw data for accurate detection, we utilize the decision-making power of MLLM to enhance the raw data. In this work, we transform the noise removal process along with signal power compensation to MLLM to leverage its adaptive capability. The overall workflow is demonstrated in Figure 2.
Noise Removal
In this part, we focus on optimizing the noise removal process by harnessing the generalization and analyzing capability of MLLM. We first convert the raw data into tokens as part of the fundamental input. To further enhance the noise removal performance, we provide the setup information of the mmWave sensors as auxiliary data to provide contextual interpretation of the raw data, including frequency range, chirp configuration, plus range and doppler resolutions, which help to allocate different processing granularity. These features are often neglected in previous works [13]. Since interference factors vary depending on the working scenarios, we include a description of the current working scenario to guide more informed decisions about what may constitute noise versus valid signal data. To ensure a standardized input for context and scenario descriptions, we define six attributes to describe current working scenarios: Environment Type (Indoor/Outdoor), Surface Characteristics (Smooth/Rough), Material Properties (Metallic/Non-Metallic), Crowd Density (Sparse/Dense), Motion Dynamic (Static/Dynamic), and Obstacles (Obstructed/Unobstructed). Such an approach ensures a more stable and efficient processing. The final step is to direct the MLLM’s focus by providing specifically crafted prompts to effectively utilize the single input sequence for the noise removal process.
In practice, we integrate and encode the data of four modalities into token-based embeddings, enabling effective processing by the MLLM. Through tokenization, we convert the original inputs into a unified sequence of tokens. This approach allows the MLLM to analyze and process the data holistically, enhancing noise removal performance. To achieve efficient processing for real-time detection, we fix the length of the token sequences for the raw data by allocating a fixed window for the acquired mmWave data of 200ms. As shown in Figure 2, the four input modalities are converted into tokens and then concatenated into a single sequence.
Dynamic Power Compensation
Previous research has shown the signal power attenuation effect [14] for both emitted and received signals during propagation [15], which can be represented as the following formula:
Where, Ld and LRl represent the signal attenuation due to distance and signal reflection loss, respectively. We ignore the LRl here as it is not relevant to the energy loss in the scenario under discussion.
While existing methods [16] utilize the formula corresponding to the radar chip configurations to fit the trend of signal attenuation and compensate for it, these methods often fail to generalize across different scenarios where radar parameters and working scenarios vary. In this step, we inherit the input of the setup description and scenarios description in the previous step to assist power compensation, ensuring more robust and adaptable performance across diverse conditions.
To extend beyond the limitations of the traditional method in handling complex data compensation tasks, we propose to integrate LLM with Monte Carlo Tree Search (MCTS). Based on pre-defined prompts, LLM generates various compensation strategies, while MCTS searches and optimizes these strategies, identifying the most effective compensation path. The state of MCTS represents the current condition of the data being compensated. Action space in this workflow is selecting a specific prompt, which guides the system in further modifying or amplifying the data, such as Prompts to adjust specific data features or prompts that guide LLM. The main steps in the workflow of MCTS are organized as follows:
-
•
Initialization: Prior to executing the MCTS algorithm, we initialize by selecting raw data as the starting state and constructing a root node incorporating this raw data.
-
•
Selection: MCTS algorithm navigates through the tree from the root using a pre-defined strategy. The Upper Confidence Bound (UCB) formula is employed to balance exploration and exploitation when selecting the most promising child node (action), described as follows:
where is the average score of the compensation in node . is total number of visits across all nodes up to the current moment. is the number of visits to node . is a constant that balances exploration versus exploitation.
-
•
Simulation: After selecting an action, the algorithm proceeds with the simulation phase, where the LLM generates a compensation result and calculates the compensation score.
The compensation score can be calculated by
where represents compensation Effectiveness, which evaluates the overall quality improvement after the LLM-based compensation, represents compensation Accuracy, focuses on how closely the compensation data meets certain predefined targets, is compensation Stability, measuring how consistently the compensation data performs across multiple iterations or variations in prompt usage.
-
•
Expansion: Once a local prompt is selected and executed, the expansion phase generates a new compensation scheme for the partial data. Subsequently, a new prompt is generated to dynamically adjust the data, which is then incorporated into the tree as a new action along with the corresponding new state.
-
•
Backpropagation: After the simulation, backpropagation is the process of propagating the results of a simulation from the leaf nodes back to the root node. For each node sisi, the visit count and total compensation score are updated based on the current simulation. Specifically, the visit count is incremented by one and the total compensation score is increased by the compensation score obtained from the simulation.
After updating the visit count and total compensation score, the average compensation score for node is calculated as:
-
•
Termination: The algorithm repeats these phases until termination conditions are met, such as early stopping (when the improvement in search results diminishes or when repeated results are generated), search constraints (when the predetermined number of rollouts is reached or when one or more nodes in the tree reach the maximum depth constraint), and criteria based on LLM logits.
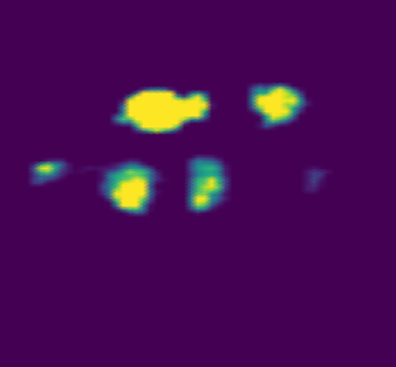
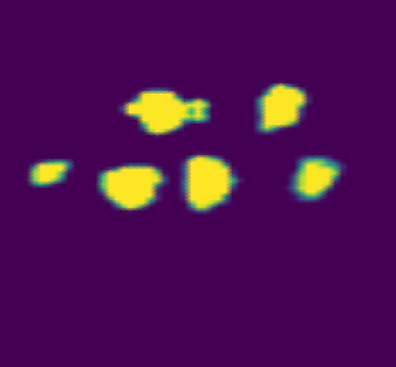
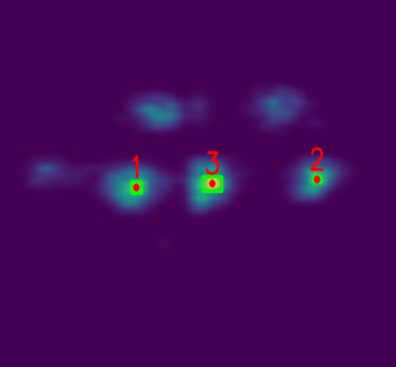
We compare the dynamic power compensation results of the traditional method [16] with our proposed LLM-based approach to demonstrate its effectiveness. As shown in Figure 8 and Figure 8, the LLM-based method provides more effective compensation at corner positions, ensuring higher robustness in detection.
II-C Cloud-side Crowd Detection
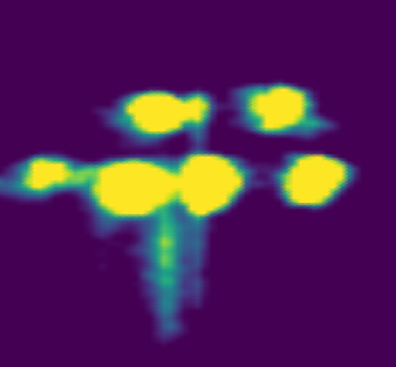
Heatmap Generation
Once the signal is enhanced, the data is converted into heatmaps based on the x-y plane and intensity levels as described in Equation 1. To incorporate intensity factors into the heatmap, each point is repeated according to its intensity value. For example, a point at with an intensity of 6 will be replicated six times in the heatmap generation.
Next, we segment the data into sub-regions and count the number of points in each segment:
where represents there are points in .
Then we generate a heatmap with a controlled color range, the intensity of the colors represents the density of points.
where is the area of sub-region and is the number of points in sub-region
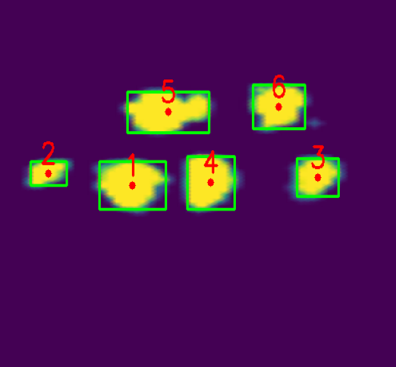
LLM-assisted Detection The final step of LLMCount is to utilize LLM to detect and annotate each individual in the crowd. To minimize the detection performance fluctuations, we implement a sliding time window strategy and set overlap between consecutive windows, ensuring consistent and accurate counting even in dynamic environments. This approach significantly enhances the accuracy and reliability of valid point cloud counting, as demonstrated in the experimental results.
III Evaluation
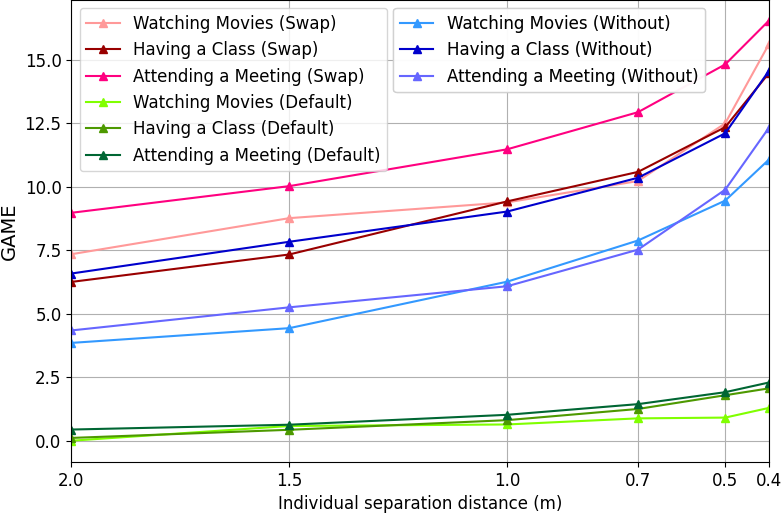
We evaluate the performance of our system in two key metrics: Counting Accuracy and Grid Average Mean Error (GAME). To ensure comprehensive evaluation across multiple dimensions, we conduct the tests in real-world setups along with an ablation study to verify the effectiveness of each module.
III-A Real-world Experiments
We evaluate the system in various real-world scenarios, including ’Watching Movies’, ’Having a Class’, and ’Attending a Meeting’. Volunteers are seated at distances from 0.4m to 2.0m, sitting naturally. During each 15-minute session, samples are collected every 10 seconds to assess counting accuracy and Grid Average Mean Error (GAME). GAME measures the average error across individual grids, reflecting the discrepancy between the original and approximated grids. It is calculated as:
where represents represents the level of division. For each increase in , the image is divided into grid cells, and represents the grid patch.
We illustrate the experiment results in Figure9 and Figure 10, noted as ‘Default’.
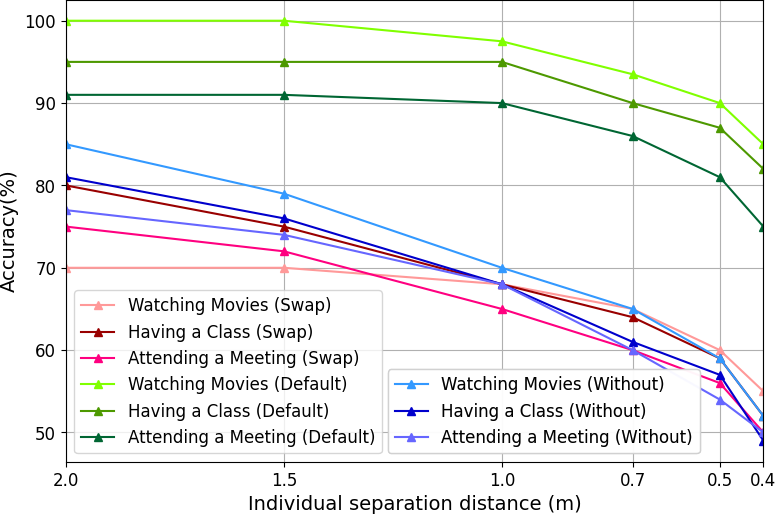
III-B Ablation Study
We first verify the effectiveness of the data enhancement order by swapping the steps of noise removal and dynamic power compensation: The detection performance in Figrue 9 and Figure 10 shows error occurred after the swapping while the comparison between the results visualized in Figure 8 and Figure 8 reveals that significant noise arises when the order is reversed. This occurs because the noise isn’t removed before the power compensation process, causing the noise to be amplified along with the signal during the compensation process.
We then verify the necessity of the whole data enhancement module by performing the detection directly without one. Figure 8 and Figure 8 shows the visualized detection results with/without the data enhancement, then we compare the detection performance in Figrue 9 and Figure 10, which reveals a considerable performance drop, demonstrating the effectiveness of this module.
References
- [1] George R. MacCartney, Theodore S. Rappaport, and Sundeep Rangan, “Rapid fading due to human blockage in pedestrian crowds at 5g millimeter-wave frequencies,” in GLOBECOM 2017 - 2017 IEEE Global Communications Conference, 2017, pp. 1–7.
- [2] Ting Wu, Theodore S. Rappaport, and Christopher M. Collins, “Safe for generations to come: Considerations of safety for millimeter waves in wireless communications,” IEEE Microwave Magazine, vol. 16, no. 2, pp. 65–84, 2015.
- [3] Zhicheng Yang, Parth H. Pathak, Yunze Zeng, Xixi Liran, and Prasant Mohapatra, “Monitoring vital signs using millimeter wave,” in Proceedings of the 17th ACM International Symposium on Mobile Ad Hoc Networking and Computing, New York, NY, USA, 2016, MobiHoc ’16, p. 211–220, Association for Computing Machinery.
- [4] Dongfang Yang, Ekim Yurtsever, Vishnu Renganathan, Keith A Redmill, and Ümit Özgüner, “A vision-based social distancing and critical density detection system for covid-19,” Sensors, vol. 21, no. 13, pp. 4608, 2021.
- [5] Chenshu Wu, Zheng Yang, Zimu Zhou, Xuefeng Liu, Yunhao Liu, and Jiannong Cao, “Non-invasive detection of moving and stationary human with wifi,” IEEE Journal on Selected Areas in Communications, vol. 33, no. 11, pp. 2329–2342, 2015.
- [6] Yuwei Cheng, Hu Xu, and Yimin Liu, “Robust small object detection on the water surface through fusion of camera and millimeter wave radar,” in Proceedings of the IEEE/CVF international conference on computer vision, 2021, pp. 15263–15272.
- [7] Saeed Amirgholipour, Wenjing Jia, Lei Liu, Xiaochen Fan, Dadong Wang, and Xiangjian He, “Pdanet: Pyramid density-aware attention based network for accurate crowd counting,” Neurocomputing, vol. 451, pp. 215–230, 2021.
- [8] Hyuckjin Choi, Manato Fujimoto, Tomokazu Matsui, Shinya Misaki, and Keiichi Yasumoto, “Wi-cal: Wifi sensing and machine learning based device-free crowd counting and localization,” IEEE Access, vol. 10, pp. 24395–24410, 2022.
- [9] Mingliang Gao, Alireza Souri, Mayram Zaker, Wenzhe Zhai, Xiangyu Guo, and Qilei Li, “A comprehensive analysis for crowd counting methodologies and algorithms in internet of things,” Cluster Computing, vol. 27, no. 1, pp. 859–873, 2024.
- [10] Carl Gustafson, Katsuyuki Haneda, Shurjeel Wyne, and Fredrik Tufvesson, “On mm-wave multipath clustering and channel modeling,” IEEE transactions on antennas and propagation, vol. 62, no. 3, pp. 1445–1455, 2013.
- [11] Qianqian Zhang, Walid Saad, and Mehdi Bennis, “Reflections in the sky: Millimeter wave communication with uav-carried intelligent reflectors,” in 2019 IEEE Global Communications Conference (GLOBECOM). IEEE, 2019, pp. 1–6.
- [12] Fatemeh Norouzian, Emidio Marchetti, Marina Gashinova, Edward Hoare, Costas Constantinou, Peter Gardner, and Mikhail Cherniakov, “Rain attenuation at millimeter wave and low-thz frequencies,” IEEE Transactions on Antennas and Propagation, vol. 68, no. 1, pp. 421–431, 2019.
- [13] Xiaotong Zhang, Zhenjiang Li, and Jin Zhang, “Synthesized millimeter-waves for human motion sensing,” in Proceedings of the 20th ACM Conference on Embedded Networked Sensor Systems, 2022, pp. 377–390.
- [14] Hua Wang, Peter M Asbeck, and Christian Fager, “Millimeter-wave power amplifier integrated circuits for high dynamic range signals,” IEEE Journal of Microwaves, vol. 1, no. 1, pp. 299–316, 2021.
- [15] Parikha Mehrotra, Baibhab Chatterjee, and Shreyas Sen, “Em-wave biosensors: A review of rf, microwave, mm-wave and optical sensing,” Sensors, vol. 19, no. 5, pp. 1013, 2019.
- [16] Kaiyuan Hu, Hongjie Liao, Mingxiao Li, and Fangxin Wang, “Mmcount: Stationary crowd counting system based on commodity millimeter-wave radar,” in ICASSP 2024 - 2024 IEEE International Conference on Acoustics, Speech and Signal Processing (ICASSP), 2024, pp. 56–60.