On the explosion engine of supernovae driven by a hadron-quark phase transition
Abstract
A hadron-quark phase transition (PT) may trigger supernova explosions during stellar core collapse. However, both success and failure have occurred in previous attempts to explode dying stars via this mechanism. We systematically explore the outcomes of the PT-induced collapse of proto-compact stars (PCSs), with spherically symmetric general relativistic hydrodynamic simulations and a controlled series of hybrid equations of state. Our results reveal the dependence of successful and failed explosions on the PT and quark matter characteristics. A small portion () of the released binding energy transforms into the diagnostic explosion energy , which saturates at erg near the black hole formation. We draw the phase diagrams for the possible fates of supernova explosions driven by hadron-quark PTs, where the control parameters are the onset density, energy gap of the PT, and the quark matter speed of sound. Our findings can be used to guide further investigations on PT-driven core-collapse supernovae and help identify hadron-quark PT-induced PCS collapse from future observations.
1 Introduction
Massive stars die violently by the gravitational collapse of stellar cores and give birth to neutron stars (NSs) or stellar-mass black holes (BHs). Sometimes, they are observed as Type II/Ibc supernovae and identified as core-collapse supernovae (CCSNe). The central engine of CCSN explosions has been under investigation for more than half a century but still not fully understood (see Bethe 1990; Janka 2012; Müller 2020; Burrows & Vartanyan 2021 for reviews). Currently, two well-explored scenarios exist: the delayed neutrino heating mechanism (Bethe & Wilson, 1985) which possibly produces most explosions with an energy up to a few erg, and the magnetohydrodynamic mechanism (LeBlanc & Wilson, 1970) which may be responsible for those extraordinary “hypernovae” up to erg. In addition, a strong hadron-quark phase transition (PT) may trigger successful CCSN explosions (see, e.g., Sagert et al. 2009), even for very massive blue supergiant stars (Fischer et al., 2018).
Though free quarks may get deconfined from nucleons in the supernova interior (Witten, 1984), the quantum chromodynamics (QCD) phase diagram in such extreme environments is quite unclear. The existence of quark-gluon plasma has already been confirmed at relatively high temperatures and low densities via heavy-ion collisions in terrestrial laboratories (Adams et al., 2005; Adamczyk et al., 2017). Recent progress in analyzing observations of massive pulsars favors the occurrence of quark deconfinement in their dense and cold cores (Annala et al., 2023). Hadron-quark PTs can naturally occur in the proto-compact star (PCS) interior since the thermodynamic conditions realized throughout their evolution reside in the QCD phase diagram between that of heavy-ion collisions and cold NSs (Alford et al., 2008; Baym et al., 2018). Nevertheless, there is no current consensus on the exact properties of the PT (Oertel et al., 2017; Bastian, 2021).
Previous efforts have explored the consequences of hadron-quark PTs in detailed CCSN simulations (see, e.g., Nakazato et al. 2013; Zha et al. 2020; Jakobus et al. 2022; Kuroda et al. 2022; Largani et al. 2024). By assuming a strong PT, successful explosions have been obtained even in spherical symmetry (Sagert et al., 2009; Fischer et al., 2018). Simulations show that the massive PCS collapses to a small radius after the onset of PT and rebounds to form a second bounce shock. Such a second collapse and bounce will normally be accompanied by the release of a millisecond neutrino burst (Sagert et al., 2009) and a distinct gravitational wave (GW) signal (Zha et al., 2020). These two signals provide unique signatures of quark deconfinement in future galactic CCSNe (Adams et al., 2013), and may also shed light on the elusive nature of neutrino (Pitik et al., 2022). Along with the GW signals from isolated and merging NSs involving PTs (Lin et al., 2006; Bauswein et al., 2019; Most et al., 2019; Fujimoto et al., 2023), future astrophysical observations can considerably enrich our understanding of the QCD phase diagram.
The outcomes of previous simulations heavily depend on the properties of the employed hybrid equation of state (EoS) and the progenitor models. A suite of 97 simulations in Jakobus et al. (2022) gives only 2 successful explosions, which suggests that the viability of PT-driven explosions remains ambiguous. In this work, we carry out a systematic study to explore the general relationship between the PT characteristics and the fate of CCSNe.
2 Modeling the PT-driven explosion
Canonical CCSN simulations feature the production of a PCS mainly composed of hadrons, after the implosion of the stellar core. A shock wave generated during the first core bounce propagates out and stalls at 100-200 km. The system enters a period of mass accretion onto the surface of the nascent PCS, which grows in mass and contracts. The PCS central density eventually exceeds several times the nuclear saturation density, g cm-3 or . Note that the PCS matter is too dense for photons to decouple, and even neutrinos get trapped in the inner core (with densities higher than g cm-3). The PCS may undergo a hadron-quark PT at this stage and collapse into a hot hybrid star with a smaller radius. Previous simulations have shown that a second core bounce, induced by the stiffening of quark matter EoS, can generate a new shock wave and lead to a successful explosion (Sagert et al., 2009; Fischer et al., 2018; Zha et al., 2020).
In this work, we concentrate on the collapse and second bounce phase of the nascent PCS. As neutrinos get mostly trapped in the interior of PCS, we assume a -equilibrium with constant electron lepton number fraction of for the nuclear EoS. In previous surveys of the progenitor dependence (Schneider et al., 2020; Zha et al., 2021), the most common entropies111The most common entropy of a PCS is defined as the specific entropy weighted by mass (see Equation (4) in Zha et al. (2021)), which avoids the disguisement effect from both the central cold region of PCS and the hot region right below the accretion shock. of PCSs are typically in the range of during a few seconds postbounce. To capture the collapse moment in actual simulations, we build up isentropic PCSs (described in Section 2.1) with to mimic the conditions right before their collapse. With these simplifications, we perform spherically symmetric simulations of PCSs with the general-relativistic hydrodynamic code GR1D (O’Connor & Ott, 2010; O’Connor, 2015). The grid size is uniform of 100 m in the innermost , and becomes logarithmically increasing up to km with 500 more zones. Outside the PCSs (20-30 km), we set an atmosphere with a constant density of which is sufficiently low to avoid affecting the shock dynamics.
2.1 Hadron-Quark Hybrid EoS
A series of hadron-quark hybrid EoSs are constructed with a first-order PT, from the SFHo relativistic mean field model (Steiner et al., 2013). The hadronic part is described by the isentropic EoS with a specific entropy . Quark matter is parametrized in terms of three quantities: the pressure of the transition from nuclear matter to quark matter (), the energy gap of the PT () and the sound speed in the quark matter (). This constant-sound-speed (CSS) parameterization (Alford et al., 2013) can be written as:
| (1) |
where is the total energy density of nuclear EoS at the transition density . The baryonic density for quark matter is derived from and following the Appendix of Alford et al. (2013). The Maxwell construction (Glendenning, 1992, 2001) is employed for the PT, i.e., the pressures and baryon chemical potentials222We take neutron chemical potentials for the hadronic matter. are equilibrated across the PT region. We restore approximately the thermal effect induced by shock heating via an “ideal-gas” ansatz (see, e.g., Janka et al. 1993; Bauswein et al. 2010, 2019), with a thermal index mimicking the behavior of full EoSs (Bauswein et al., 2010; Steiner et al., 2013; Blacker et al., 2023). Explicitly, is given by
| (2) |
with the initial density of pure quark matter. This thermal component becomes relevant only for extra internal energies beyond the barotropic EoS (Equation (1)).
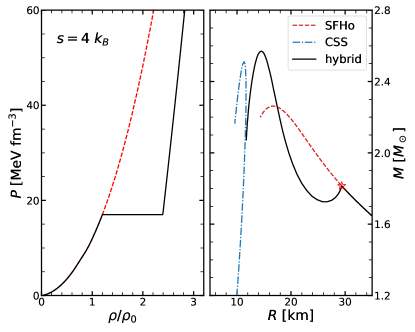
Figure 1 shows a typical model with , and which has a PT region from 1.2 to 2.4. The squared sound speed jumps from for hadronic matter to 0 in the PT region and leaps to for quark matter. We also plot the mass-radius (M-R) relations of hot compact stars in the right panel. The M-R curve for the hybrid EoS has two extreme masses, i.e., the most massive hybrid star () and purely hadronic star () connected by a stable and unstable branch, while those for pure hadron and quark matter have only one extreme mass each. This hybrid model forms the so-called “disconnected” third-family topology (Alford et al., 2013; Heinimann et al., 2016).
2.2 Proto-Compact Star Evolution-A representative Case

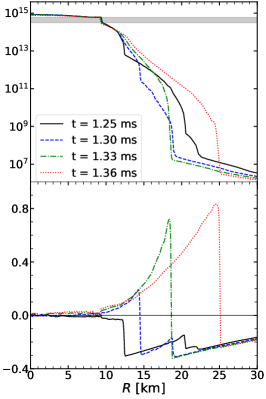
The hydrodynamic simulation of a PCS begins at its onset mass of PT, e.g., in the above model. Its evolution is illustrated in Figure 2. Initially, we perturb the PCS by adding a radial infall velocity as
| (3) |
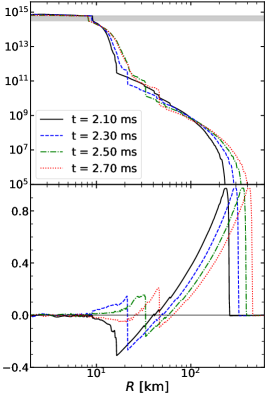
where with being the PCS radius and . The PCS becomes gravitationally unstable and starts to collapse. Within the first ms, it contracts slowly with the formation and growth of a quark core. The quark core mass reaches while the maximum infall velocity accelerates to a few percent of . The following evolution looks quite similar to the PCS collapse in the realistic CCSN simulations of Largani et al. (2024). In the following 0.2 ms, the hadronic shell collapses violently and the infall velocity exceeds of (see the left panel in Figure 2). The quark core remains quasi-static and expands swiftly into . The collapsing inner hadronic shell overshoots the highly incompressible quark core and bounces back. The outgoing pressure waves steepen into a shock front at the transition to the supersonically infalling shell. Such an evolution turns into the sharp velocity gradient at the shock front (see the middle panel in Figure 2). The shock then expands rapidly through the steep PCS surface and results in matter outflows with velocities exceeding . After that, a secondary shock wave is generated and propagates outward with reduced speeds (see the right panel in Figure 2).
After the PCS reaches its final hydrostatic equilibrium (e.g., ms), we make a conjecture about the final explosion energy by integrating the reduced binding energy over the region where is positive (see Equations (3-4) in Müller et al. 2012). The above model produces B ().
3 A systematic study in the QCD Phase Transition Driven Explosion
In this section, we systematically survey how the fate of PT-induced post-bounce dynamics depends on the PT characteristics.
3.1 Phase Transition Dependence and its Interpretation
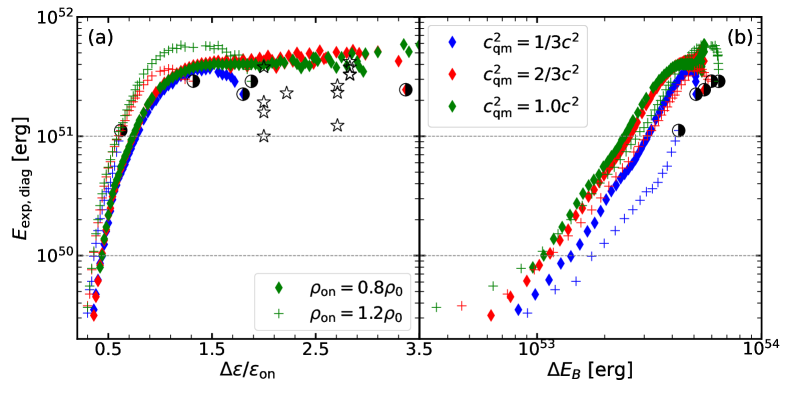
The PT dependence of the final is illustrated in Figure 3 (a). Firstly, it is evident that increases as increases, but saturates until a certain large beyond which explosion fails and prompt BH formation occurs. In the BH formation cases, the central density rises abruptly to exceed about and the central lapse function drops below a few . is suppressed near the critical values of right before prompt BH formation, marked by the half-filled black circles. for (plus symbols) shifts systematically upward when compared to that of (diamond symbols). turns out to be approximately insensitive to except for the region close to prompt BH formation. This can be understood as a softer quark matter reduces the power of bounce but leads to a more compact hybrid star (smaller radius) which increases the released binding energy.
Secondly, both and have a great impact on the critical for prompt BH formation. A larger decreases it, since a larger is reached which facilitates the BH formation. However, a larger hinders it, because a stiffer quark matter increases which impedes the further collapse of the PCS. We also find that the condition of BH formation is reached in the center before the gravitational mass of the PCS exceeds by a deficit of -. Eventually, reaches an upper limit at a moderate and a large , e.g., at and .
Thirdly, the explosion models obtained by full simulations333Quark matter appears off-center earlier than the collapse moment in detailed simulations due to the entropy-dependent PT, while it first appears in the center in our simulations. After the collapse moment, which is defined as when the PCS infall velocities reach a few percent of , the evolution is similar in both cases., reported in Largani et al. (2024), are also included in Figure 3 (a) (black unfilled stars). The onset densities of their hybrid EoSs are when and . Their EoSs include extra repulsive interactions (Bastian, 2021), which result in bigger quark cores. This reduces the released binding energy and . Note that their also contain the contributions from the stellar envelopes of progenitors. In practice, would be shifted down by about B if taking the envelope into account (Bruenn et al., 2016). Such a deficit is currently not considered in our models. Nevertheless, several different energies are reported for a single hybrid EoS in their work, due to different progenitor stars. This phenomenon can be understood by the dependence on the compactness of the progenitor (Zha et al., 2021). Generally speaking, the PCS from a less compact progenitor evolves with a smaller value of the entropy and tends to release less explosion energy in the PT-induced collapse. After considering the above effects, the detailed explosion models are fairly compatible with the predictions of our simplified models.
To draw a quantitative view of the above PT dependence, we estimate the binding energy released in the collapse of the PCS by
| (4) |
The definition of is based on the existence of a third family topology in the M-R curve (cf. Figure 1), i.e., a hybrid twin star of resides on the inner stable branch. A core of this hybrid twin star is extracted with the same baryonic mass as the hadronic twin star . is defined as the gravitational mass of the extracted core. Note that a larger will normally result in a larger .
We plot as a function of in Figure 3 (b). Firstly, considering one specific series of models (e.g. red diamonds), is linearly proportional to , e.g., . It also suggests that only a small part of transforms into , and the transformation efficiency has a similar linear dependence on . The transformation efficiency rises roughly from 0.05% to 0.9% with the growth of . saturates at large . also tends to saturate at large . This dual effect explains the aforementioned saturation of at large in Figure 3 (a). In our simulations, is ultimately produced by the first PT-induced bounce shock for models with large . Consequently, this bounce will get firstly strengthened and then saturated as increases. A suppression effect also emerges before the boundary of prompt BH formation (e.g., blue diamonds). However, there is a caveat in estimating for cases close to BH formation as GR1D cannot continue past this point due to the choice of slicing (O’Connor & Ott, 2010).
Secondly, at , models on the less energetic side (e.g., red pluses in ) noticeably deviate from the linear-dependence of vs. . We find that these models are typically located near the vanishing boundary of twin stars in the phase diagram for the M-R relation of compact stars (cf. Figure 3 in Alford et al. 2013). This collective deviation is attributed to the boundary effect which suppresses .
Thirdly, for (red diamonds in Figure 3 (b)) shifts systematically upward when compared to that of (blue diamonds in Figure 3 (b)). At a fixed , such upward trends are universal among different . It also means that the transformation efficiency from to is increased for a large . Actually, at a fixed , a large reduces noticeably, especially from to , but leaves relatively small influence on . As a result, the above improvement from occurs and tends to saturate after . Finally, a large can slightly reduce the slope between and at a fixed .
3.2 Fate of CCSNe with QCD Phase Transition
A collapse of the PCS with is assumed to result in a successful SN explosion. This assumption is based on the fact that the explosion energy normally ranges from 0.1 B to 5 B for Type II SN light curves (Pejcha & Prieto, 2015; Müller et al., 2017; Goldberg et al., 2019; Barker et al., 2022). We also regard 1 B as another benchmark energy, since this is the magnitude of the estimated explosion energy of SN 1987A (Handy et al., 2014).
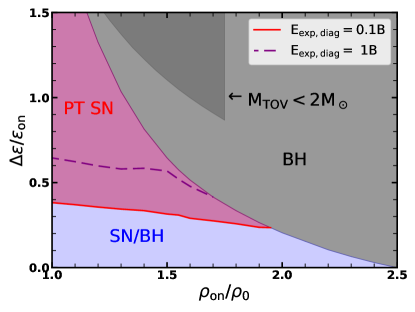
Figure 4 demonstrates the possible outcomes of CCSN simulations, according to in the collapse of PCS. is currently fixed at . For a weak PT (blue), the second bounce is normally weak as well, e.g., . The post-bounce evolution should still be dominated by the delayed neutrino heating in the gain region, and it subsequently ends up as a canonical neutrino-driven explosion or delayed BH formation. It is generally the latter scenario in spherical symmetry (Zha et al., 2021; Jakobus et al., 2022; Largani et al., 2024). In contrast, an energetic second bounce shock can be generated for a strong PT (red). It takes over and merges with the stalled accretion shock. This can potentially unbind the stellar envelope if the mass accretion rate is not too high, even in spherical symmetry (Sagert et al., 2009; Fischer et al., 2018). The critical between neutrino-driven and PT-induced explosions is approximately proportional to , with and both positive. This can be well explained by the effect of revealed in Figure 3. We also display the critical line of . As expected, it is generally parallel to the above boundary, except for a bump near the region of prompt BH formation.
A strong PT launching at a high (gray region) will lead to a prompt collapse into BH in our simulations. Particularly interesting is that the collapse of PCS will inevitably result in a prompt BH formation if the PT launches at a density above (i.e., ). This potentially renders a way to constrain the PT, by combining the initial mass function for precollapse stars and observed compact remnants of CCSNe. We also show the region (dark) where the maximum mass predicted by the TOV equation is smaller than . These models can be excluded by the observed pulsars, according to the entropy-dependent behavior of M-R relations (Hempel et al., 2016).

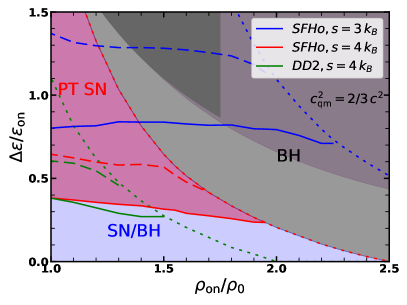
The left panel of Figure 5 further compares the phase diagrams for quark matter with different stiffness ( and ). It is found that the critical line of stays almost unchanged. That of remains in the vicinity with a similar bump. The boundary of prompt BH formation extends significantly more into the area with lower and lower , once decreases. In short, all features agree well with the findings in Figure 3. In the right panel of Figure 5, we test the influence of the entropy . The result shows that less will be created in the collapse of a colder PCS (smaller ), and prompt BH formation is less likely. This is consistent with the conclusion in Zha et al. (2021). has an upper limit at for . We also test the impact of hadronic EoS with the DD2 EoS (Hempel et al., 2012). In the plane of vs. , DD2 shifts upward when compared to SFHo at . The phase diagram for DD2 (see the right panel of Figure 5) has a similar morphology as that of SFHo but the phase boundaries are shifted downwards.
4 Conclusions
In this work, we systematically explore the impact of hadron-quark PTs on the PCSs born in CCSNe. Our simplified models show evolutionary scenarios similar to those in detailed simulations. Our study reveals the dependence of PT-induced explosions on the PT and quark matter characteristics as follows:
-
•
The explosion is generally strengthened by a larger or , while it is less sensitive to .
-
•
The explosion energy strongly correlates with the binding energy released as the PCS collapses, with . Tentatively, the maximum is for this explosion mechanism.
-
•
An increase of from to increases the efficiency for the released binding energy transforming into the explosion energy, by a factor of 2-4.
-
•
Beyond a critical the PT leads to the BH formation instead of an explosion. At a larger or smaller , the critical value of for the prompt BH formation to occur is smaller.
-
•
The morphology of the phase diagrams for the fates of PT-induced collapse of PCSs is rather generic across different , PCS entropies, and hadronic EoSs.
The above results are obtained under the assumption of isentropic EoSs and PCSs with a constant electron lepton number fraction, as well as an “ideal-gas” model for extra thermal effect. Such simplifications are meant to catch the main features of the PT-induced collapse of PCSs. Despite the caveat, the generic morphology of the phase diagrams provides useful guidance for future surveys employing realistic EoSs and detailed CCSN simulations. Searching for hadron-quark PTs in such extreme astrophysical conditions is complementary to efforts at future experimental facilities, e.g., FAIR at GSI (Friman et al., 2011), NICA at Dubna (Blaschke et al., 2016) and HIAF at Huizhou (Zhou, 2018), to study high-density matter in heavy-ion collisions.
References
- Adamczyk et al. (2017) Adamczyk, L., Adkins, J. K., Agakishiev, G., et al. 2017, Nature, 548, 62, doi: 10.1038/nature23004
- Adams et al. (2005) Adams, J., Aggarwal, M. M., Ahammed, Z., et al. 2005, Nucl. Phys. A, 757, 102, doi: 10.1016/j.nuclphysa.2005.03.085
- Adams et al. (2013) Adams, S. M., Kochanek, C. S., Beacom, J. F., Vagins, M. R., & Stanek, K. Z. 2013, ApJ, 778, 164, doi: 10.1088/0004-637X/778/2/164
- Alford et al. (2013) Alford, M. G., Han, S., & Prakash, M. 2013, Phys. Rev. D, 88, 083013, doi: 10.1103/PhysRevD.88.083013
- Alford et al. (2008) Alford, M. G., Schmitt, A., Rajagopal, K., & Schäfer, T. 2008, Reviews of Modern Physics, 80, 1455, doi: 10.1103/RevModPhys.80.1455
- Annala et al. (2023) Annala, E., Gorda, T., Hirvonen, J., et al. 2023, Nature Communications, 14, 8451, doi: 10.1038/s41467-023-44051-y
- Barker et al. (2022) Barker, B. L., Harris, C. E., Warren, M. L., O’Connor, E. P., & Couch, S. M. 2022, ApJ, 934, 67, doi: 10.3847/1538-4357/ac77f3
- Bastian (2021) Bastian, N.-U. F. 2021, Phys. Rev. D, 103, 023001, doi: 10.1103/PhysRevD.103.023001
- Bauswein et al. (2019) Bauswein, A., Bastian, N.-U. F., Blaschke, D. B., et al. 2019, Phys. Rev. Lett., 122, 061102, doi: 10.1103/PhysRevLett.122.061102
- Bauswein et al. (2010) Bauswein, A., Janka, H. T., & Oechslin, R. 2010, Phys. Rev. D, 82, 084043, doi: 10.1103/PhysRevD.82.084043
- Baym et al. (2018) Baym, G., Hatsuda, T., Kojo, T., et al. 2018, Reports on Progress in Physics, 81, 056902, doi: 10.1088/1361-6633/aaae14
- Bethe (1990) Bethe, H. A. 1990, Reviews of Modern Physics, 62, 801, doi: 10.1103/RevModPhys.62.801
- Bethe & Wilson (1985) Bethe, H. A., & Wilson, J. R. 1985, ApJ, 295, 14, doi: 10.1086/163343
- Blacker et al. (2023) Blacker, S., Bauswein, A., & Typel, S. 2023, Phys. Rev. D, 108, 063032, doi: 10.1103/PhysRevD.108.063032
- Blaschke et al. (2016) Blaschke, D., Aichelin, J., Bratkovskaya, E., et al. 2016, European Physical Journal A, 52, 267, doi: 10.1140/epja/i2016-16267-x
- Bruenn et al. (2016) Bruenn, S. W., Lentz, E. J., Hix, W. R., et al. 2016, ApJ, 818, 123, doi: 10.3847/0004-637X/818/2/123
- Burrows & Vartanyan (2021) Burrows, A., & Vartanyan, D. 2021, Nature, 589, 29, doi: 10.1038/s41586-020-03059-w
- Fischer et al. (2018) Fischer, T., Bastian, N.-U. F., Wu, M.-R., et al. 2018, Nature Astronomy, 2, 980, doi: 10.1038/s41550-018-0583-0
- Friman et al. (2011) Friman, B., Höhne, C., Knoll, J., et al. 2011, The CBM Physics Book, Vol. 814 (Springer-Verlag), doi: 10.1007/978-3-642-13293-3
- Fujimoto et al. (2023) Fujimoto, Y., Fukushima, K., Hotokezaka, K., & Kyutoku, K. 2023, Phys. Rev. Lett., 130, 091404, doi: 10.1103/PhysRevLett.130.091404
- Glendenning (1992) Glendenning, N. K. 1992, Phys. Rev. D, 46, 1274, doi: 10.1103/PhysRevD.46.1274
- Glendenning (2001) —. 2001, Phys. Rep., 342, 393, doi: 10.1016/S0370-1573(00)00080-6
- Goldberg et al. (2019) Goldberg, J. A., Bildsten, L., & Paxton, B. 2019, ApJ, 879, 3, doi: 10.3847/1538-4357/ab22b6
- Handy et al. (2014) Handy, T., Plewa, T., & Odrzywołek, A. 2014, ApJ, 783, 125, doi: 10.1088/0004-637X/783/2/125
- Harris et al. (2020) Harris, C. R., Millman, K. J., van der Walt, S. J., et al. 2020, Nature, 585, 357, doi: 10.1038/s41586-020-2649-2
- Heinimann et al. (2016) Heinimann, O., Hempel, M., & Thielemann, F.-K. 2016, Phys. Rev. D, 94, 103008, doi: 10.1103/PhysRevD.94.103008
- Hempel et al. (2012) Hempel, M., Fischer, T., Schaffner-Bielich, J., & Liebendörfer, M. 2012, ApJ, 748, 70, doi: 10.1088/0004-637X/748/1/70
- Hempel et al. (2016) Hempel, M., Heinimann, O., Yudin, A., et al. 2016, Phys. Rev. D, 94, 103001, doi: 10.1103/PhysRevD.94.103001
- Hunter (2007) Hunter, J. D. 2007, Computing in Science and Engineering, 9, 90, doi: 10.1109/MCSE.2007.55
- Jakobus et al. (2022) Jakobus, P., Müller, B., Heger, A., et al. 2022, MNRAS, 516, 2554, doi: 10.1093/mnras/stac2352
- Janka (2012) Janka, H.-T. 2012, Annual Review of Nuclear and Particle Science, 62, 407, doi: 10.1146/annurev-nucl-102711-094901
- Janka et al. (1993) Janka, H. T., Zwerger, T., & Moenchmeyer, R. 1993, A&A, 268, 360
- Kuroda et al. (2022) Kuroda, T., Fischer, T., Takiwaki, T., & Kotake, K. 2022, ApJ, 924, 38, doi: 10.3847/1538-4357/ac31a8
- Largani et al. (2024) Largani, N. K., Fischer, T., & Bastian, N.-U. F. 2024, ApJ, 964, 143, doi: 10.3847/1538-4357/ad24f2
- LeBlanc & Wilson (1970) LeBlanc, J. M., & Wilson, J. R. 1970, ApJ, 161, 541, doi: 10.1086/150558
- Lin et al. (2006) Lin, L. M., Cheng, K. S., Chu, M. C., & Suen, W. M. 2006, ApJ, 639, 382, doi: 10.1086/499202
- Most et al. (2019) Most, E. R., Papenfort, L. J., Dexheimer, V., et al. 2019, Phys. Rev. Lett., 122, 061101, doi: 10.1103/PhysRevLett.122.061101
- Müller (2020) Müller, B. 2020, Living Reviews in Computational Astrophysics, 6, 3, doi: 10.1007/s41115-020-0008-5
- Müller et al. (2012) Müller, B., Janka, H.-T., & Marek, A. 2012, ApJ, 756, 84, doi: 10.1088/0004-637X/756/1/84
- Müller et al. (2017) Müller, T., Prieto, J. L., Pejcha, O., & Clocchiatti, A. 2017, ApJ, 841, 127, doi: 10.3847/1538-4357/aa72f1
- Nakazato et al. (2013) Nakazato, K., Sumiyoshi, K., & Yamada, S. 2013, A&A, 558, A50, doi: 10.1051/0004-6361/201322231
- O’Connor (2015) O’Connor, E. 2015, ApJS, 219, 24, doi: 10.1088/0067-0049/219/2/24
- O’Connor & Ott (2010) O’Connor, E., & Ott, C. D. 2010, Classical and Quantum Gravity, 27, 114103, doi: 10.1088/0264-9381/27/11/114103
- Oertel et al. (2017) Oertel, M., Hempel, M., Klähn, T., & Typel, S. 2017, Reviews of Modern Physics, 89, 015007, doi: 10.1103/RevModPhys.89.015007
- Pejcha & Prieto (2015) Pejcha, O., & Prieto, J. L. 2015, ApJ, 806, 225, doi: 10.1088/0004-637X/806/2/225
- Pitik et al. (2022) Pitik, T., Heimsoth, D. J., Suliga, A. M., & Balantekin, A. B. 2022, Phys. Rev. D, 106, 103007, doi: 10.1103/PhysRevD.106.103007
- Sagert et al. (2009) Sagert, I., Fischer, T., Hempel, M., et al. 2009, Phys. Rev. Lett., 102, 081101, doi: 10.1103/PhysRevLett.102.081101
- Schneider et al. (2020) Schneider, A. d. S., O’Connor, E., Granqvist, E., Betranhandy, A., & Couch, S. M. 2020, ApJ, 894, 4, doi: 10.3847/1538-4357/ab8308
- Steiner et al. (2013) Steiner, A. W., Hempel, M., & Fischer, T. 2013, ApJ, 774, 17, doi: 10.1088/0004-637X/774/1/17
- Witten (1984) Witten, E. 1984, Phys. Rev. D, 30, 272, doi: 10.1103/PhysRevD.30.272
- Zha et al. (2020) Zha, S., O’Connor, E. P., Chu, M.-c., Lin, L.-M., & Couch, S. M. 2020, Phys. Rev. Lett., 125, 051102, doi: 10.1103/PhysRevLett.125.051102
- Zha et al. (2021) Zha, S., O’Connor, E. P., & Schneider, A. d. S. 2021, ApJ, 911, 74, doi: 10.3847/1538-4357/abec4c
- Zhou (2018) Zhou, X. 2018, Nucl. Phys. Rev., 35, 339, doi: 10.11804/NuclPhysRev.35.04.339