Oscillatory dissipative tunneling in an asymmetric double-well potential
Abstract
Dissipative tunneling remains a cornerstone effect in quantum mechanics. In chemistry, it plays a crucial role in governing the rates of chemical reactions, often modeled as the motion along the reaction coordinate from one potential well to another. The relative positions of energy levels in these wells strongly influences the reaction dynamics. Chemical research will benefit from a fully controllable, asymmetric double-well equipped with precise measurement capabilities of the tunneling rates. In this paper, we show that a continuously driven Kerr parametric oscillator with a third order non-linearity can be operated in the quantum regime to create a fully tunable asymmetric double-well. Our experiment leverages a low-noise, all-microwave control system with a high-efficiency readout of the which-well information. We explore the reaction rates across the landscape of tunneling resonances in parameter space. We uncover two new and counter-intuitive effects: (i) a weak asymmetry can significantly decrease the activation rates, even though the well in which the system is initialized is made shallower, and (ii) the width of the tunneling resonances alternates between narrow and broad lines as a function of the well depth and asymmetry. We predict by numerical simulations that both effects will also manifest themselves in ordinary chemical double-well systems in the quantum regime. Our work paves the way for analog molecule simulators based on quantum superconducting circuits.
I Introduction
Engineering Hamiltonians to produce a desired potential landscape is a crucial task in quantum computing [1, 2, 3, 4, 5]. Among these landscapes, double-wells hold particular importance, serving as models for diverse systems like two-level defects [6, 7], nuclear structures [8], and chemical reactions [9, 5]. However, tuning parameters experimentally within these systems, like the barrier height, often proves to be challenging [5, 10]. Additionally, classical computational models can struggle with accuracy, e.g. failing to reach chemical accuracy [11]. Consequently, developing a low-noise system capable of generating tunable double-well potentials is highly desirable for the simulation of quantum chemistry problems.
In this manuscript, we report the results of the activation dynamics of a continuously tunable asymmetric double-well parametric oscillator. During our exploration we found two unexpected effects. First, we find that the asymmetric double-well can experience a significantly longer activation time (well-switching time) from one well to the other than the symmetric one, even when the system is initialized in the shallower well. This is counterintuitive, because one would think that by reducing the barrier height, the activation time should decrease [12, 13, 14]. We find this is not always the case in our system due to a subtle quantum effect described below, which suggests a technique to stabilize bosonic quantum states. The second unexpected effect is that the activation exhibits pronounced quantum resonances whose width alternates between narrow and broad with both the depth and the asymmetry of the wells. This is a manifestation of the width of the Hamiltonian anti-crossing of the energy levels close to the top of the barrier of the double-well energy surface. The location and width of these resonances are well explained within the rotating wave approximation (RWA) and by a semiclassical model, but we note that there is only qualitative agreement between the measured rates and the model.
Based on the experimental and theoretical observation of these effects in the Kerr parametric oscillator (KPO), we investigate whether they are present in other double-well systems. A particularly important class of double-well problems are found in chemistry, for example for modelling electron-transfer reactions [5]. We predict the effects should be generically observable in quantum dissipative double-wells.
II Setup and Model system
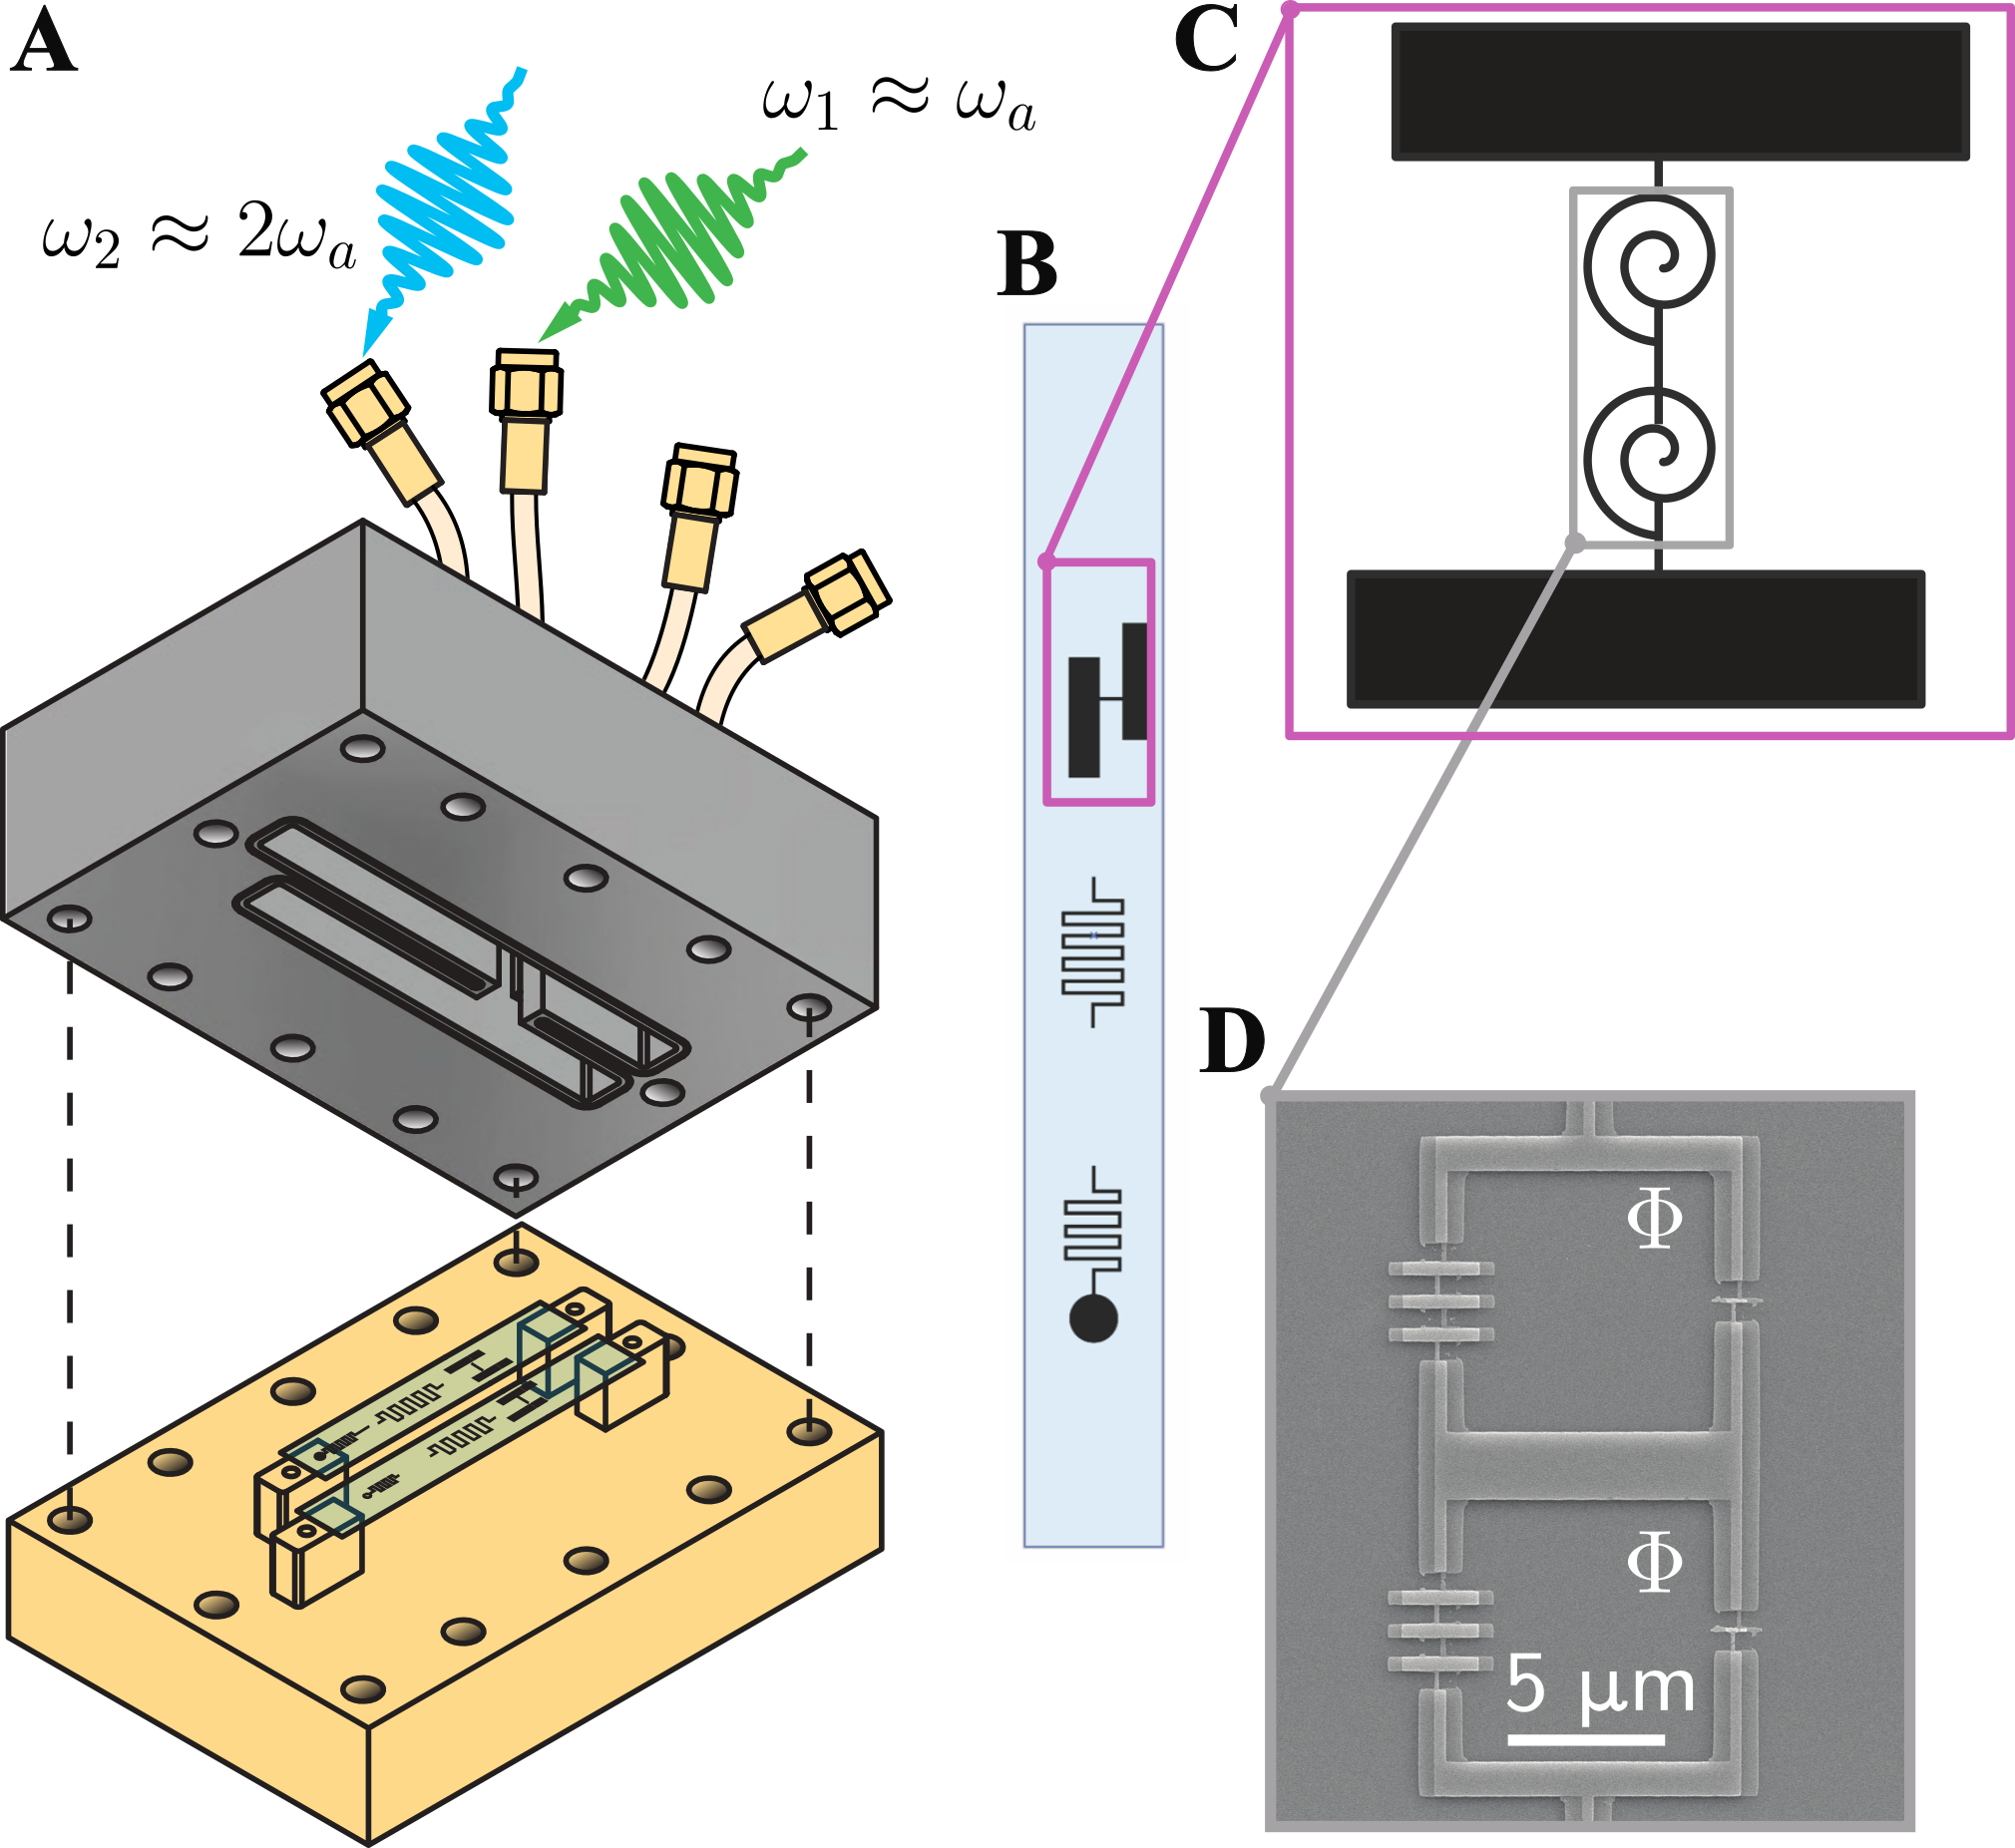
Our setup consists of two chips with superconducting circuits, shown in Fig. 1 A, that are addressable by microwave drives via charge-coupling. In this experiment, we only make use of one of the two chips. The relevant chip contains an array of two superconducting nonlinear asymmetric inductive elements (SNAILs) [16, 17] shunted by a large capacitor [18], as depicted in Fig. 1 B-D.
| (1) | ||||
where is the bare resonance frequency of the SNAIL transmon, are the third- and fourth-order non-linearities of the circuit and is the bosonic annihilation operator. This Hamiltonian is the so-called (asymmetric) parametric oscillator Hamiltonian when and [19, 20]. Here, is the amplitude and the frequency of the drive that will henceforth be referred to as the linear (additive) drive, while and are the amplitude and frequency of what we refer to as the squeezing, or two-photon, parametric drive. The phase is the relative phase between the two drives. By applying displaced frame transformations, transforming into the rotating frame and keeping some terms beyond the RWA [15, 21], we arrive at the effective Hamiltonian describing the asymmetric parametric oscillator
| (2) |
where is the leading order Kerr non-linearity, and with the renormalized SNAIL transmon resonance frequency. The drive coefficients are given by and .
The relation to a double-well becomes apparent in the classical limit by defining
| (3) |
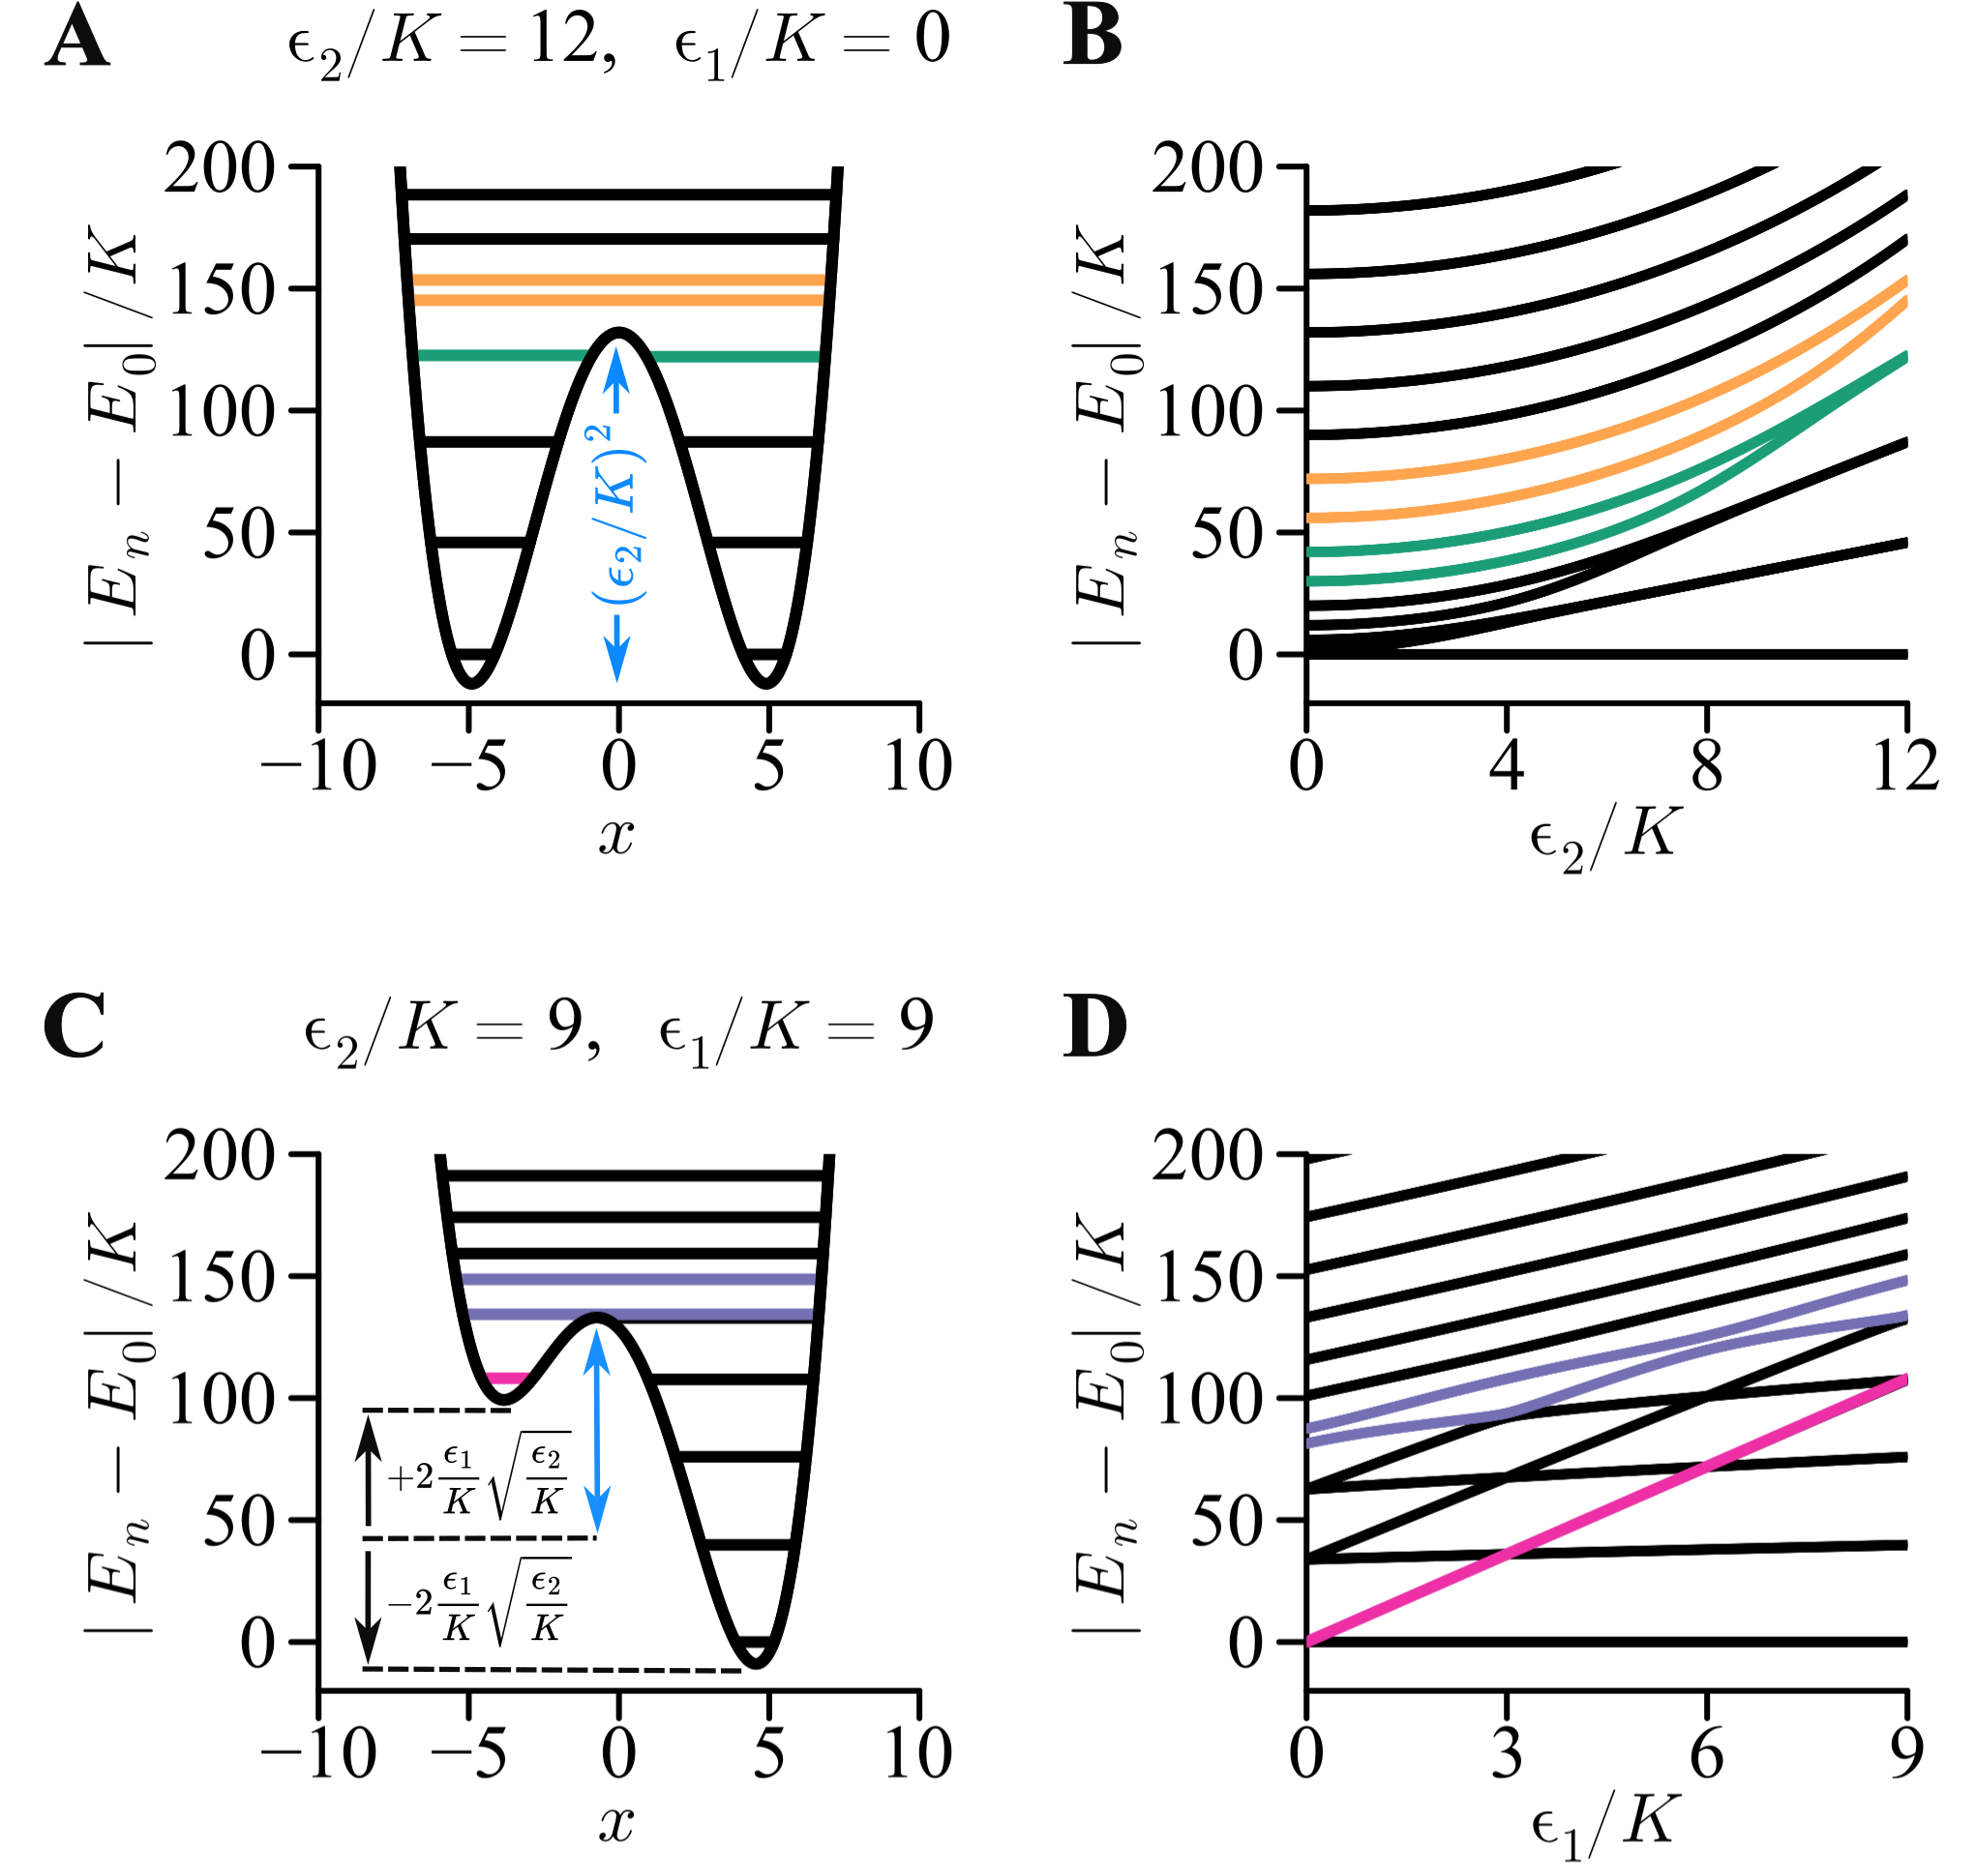
where together with , , and . Two instances of are shown in Fig. 2 A and C, while in Fig. 2 B and D, the associated energy spectra of Eq. 2 are shown as a function of the control parameters and for . From Eq. 2 or Eq. 3, controls the asymmetry of the wells and controls their depth [19]. Note, however, that the parametric oscillator Hamiltonian cannot be written as a sum of kinetic [] and potential [] energy since cross terms like are present. These terms can lead to interesting consequences [13, 23, 24, 25] but they do not play a critical role in the new effects described in this paper (see Section IV).
For , we recover the conventional (symmetric) parametric oscillator Hamiltonian that creates a double-well along the position axis [22, 18, 15, 24, 25, 26]. If , the phase becomes relevant. For , the linear drive adds a term proportional to the momentum, , thus not breaking the symmetry of the double-well. For , this drive adds a term proportional to the position, , thus lifting the degeneracy between the two wells [19, 27] (see Fig. 2 C and D). In the main text, we focus on the case and leave the experimental study of the effect of the phase-variation for the Supplementary Material (SM).
III Experiment and analysis
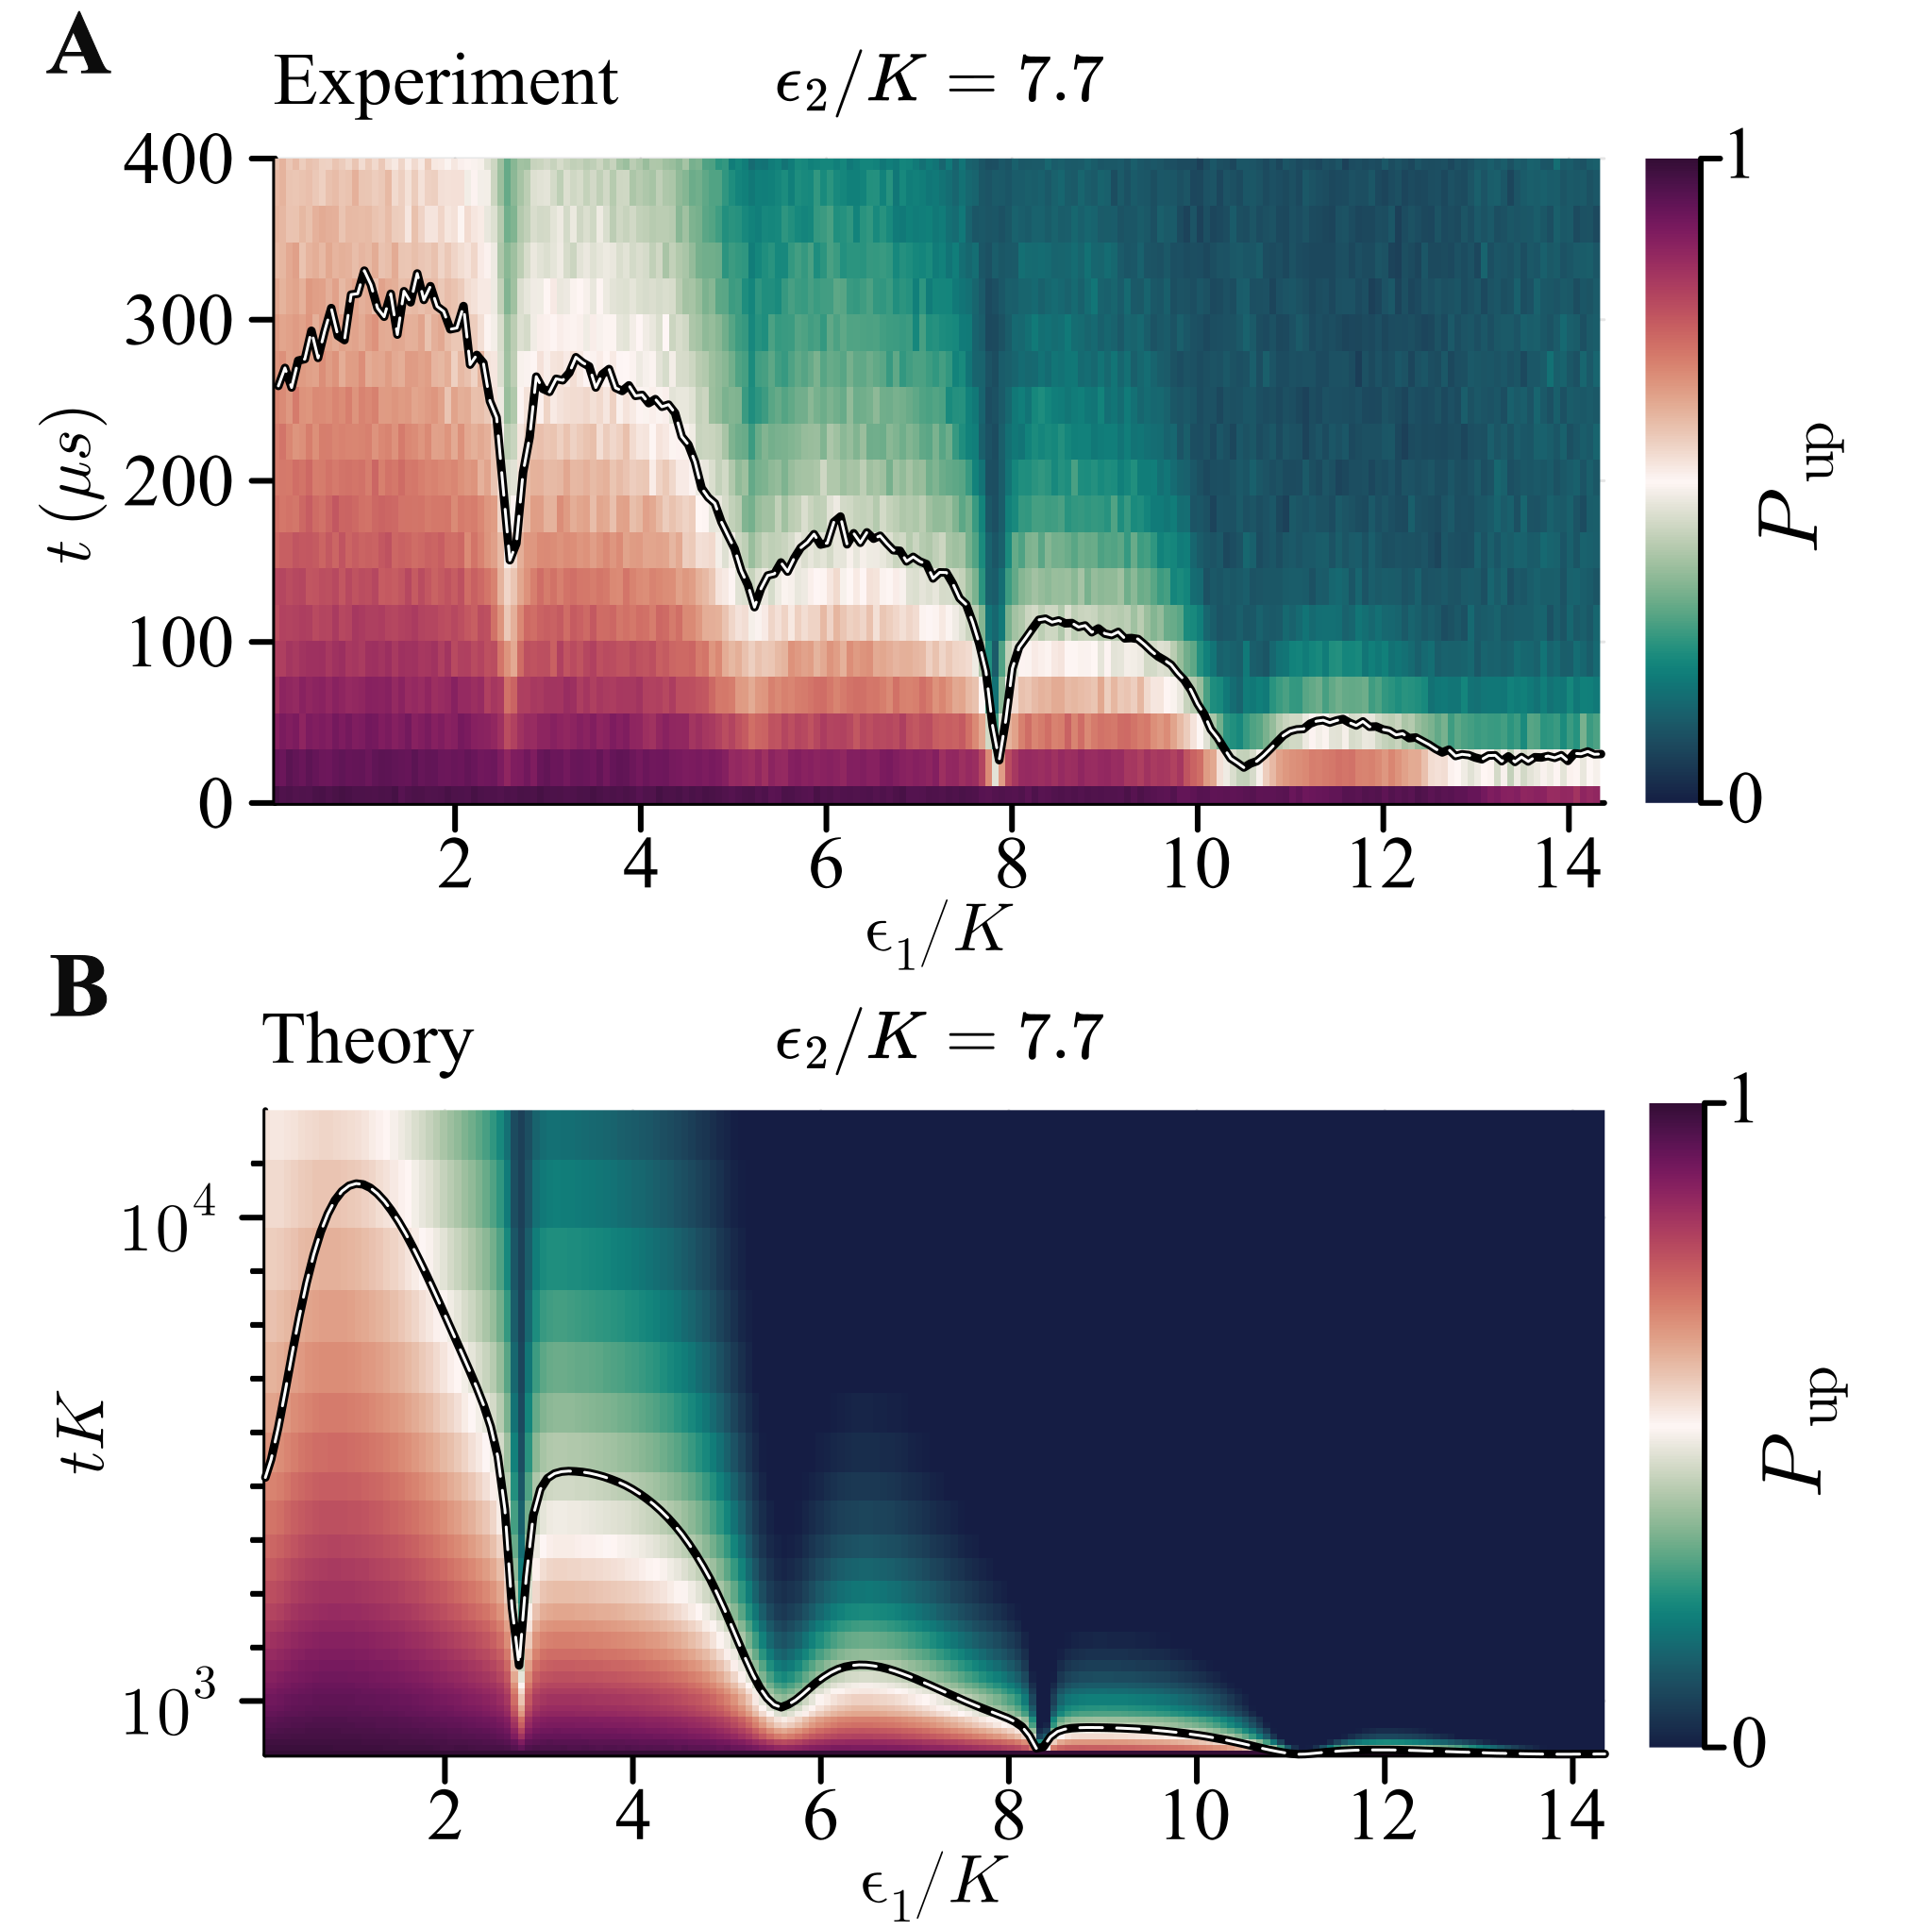
To measure the activation rate of our system, the states localized at the bottom of the wells need to be prepared and monitored as a function of time. A number of steps are required for this. To ready the setup for our experiments, we bias our SNAIL loops with an external magnetic field sourced by a solenoid lying below the copper part of the enclosure (orange block in Fig. 1 A). This flux allows us to set the Hamiltonian parameters and . In this work, we choose a flux point at which we directly measure GHz and kHz (see SM for this and other calibrations). From the flux dependence of both and we can fit a model for the SNAIL [17] to extract MHz and kHz. The values of and are directly proportional to the microwave amplitude we apply to our sample and, therefore, we have precise control over and . In our system, dielectric loss sets the single-photon lifetime to 20 µs.
By turning on the squeezing drive, and waiting five times the single-photon lifetime, we prepare the oscillator in its steady state. We observe the bifurcation of our SNAIL oscillator by homodyning the emitted radiation activated by a tone parametrically coupling the parametric oscillator with the on-chip readout resonator itself coupled to our quantum-limited amplifier detection line [18]. The homodyne signal clearly shows the typical pair of stable oscillations out-of-phase by . Importantly, the photons emitted by the oscillator during readout are continuously replenished by the squeezing drive: the driven oscillator in presence of dissipation remains in one of its two quasi-steady states. Acquiring a single data point for the which-well information takes 4 µs, which is typically much shorter than the activation time across the double-well parametric oscillator barrier. We postselect the instances when the system is initially found in the shallower well. By performing a second measurement after a variable waiting time (see SM), one can detect well-switching. By repeating these measurements, one can determine the probability per unit time of witnessing an activation event and therefore obtain the activation rate for a given set of Hamiltonian parameters and .
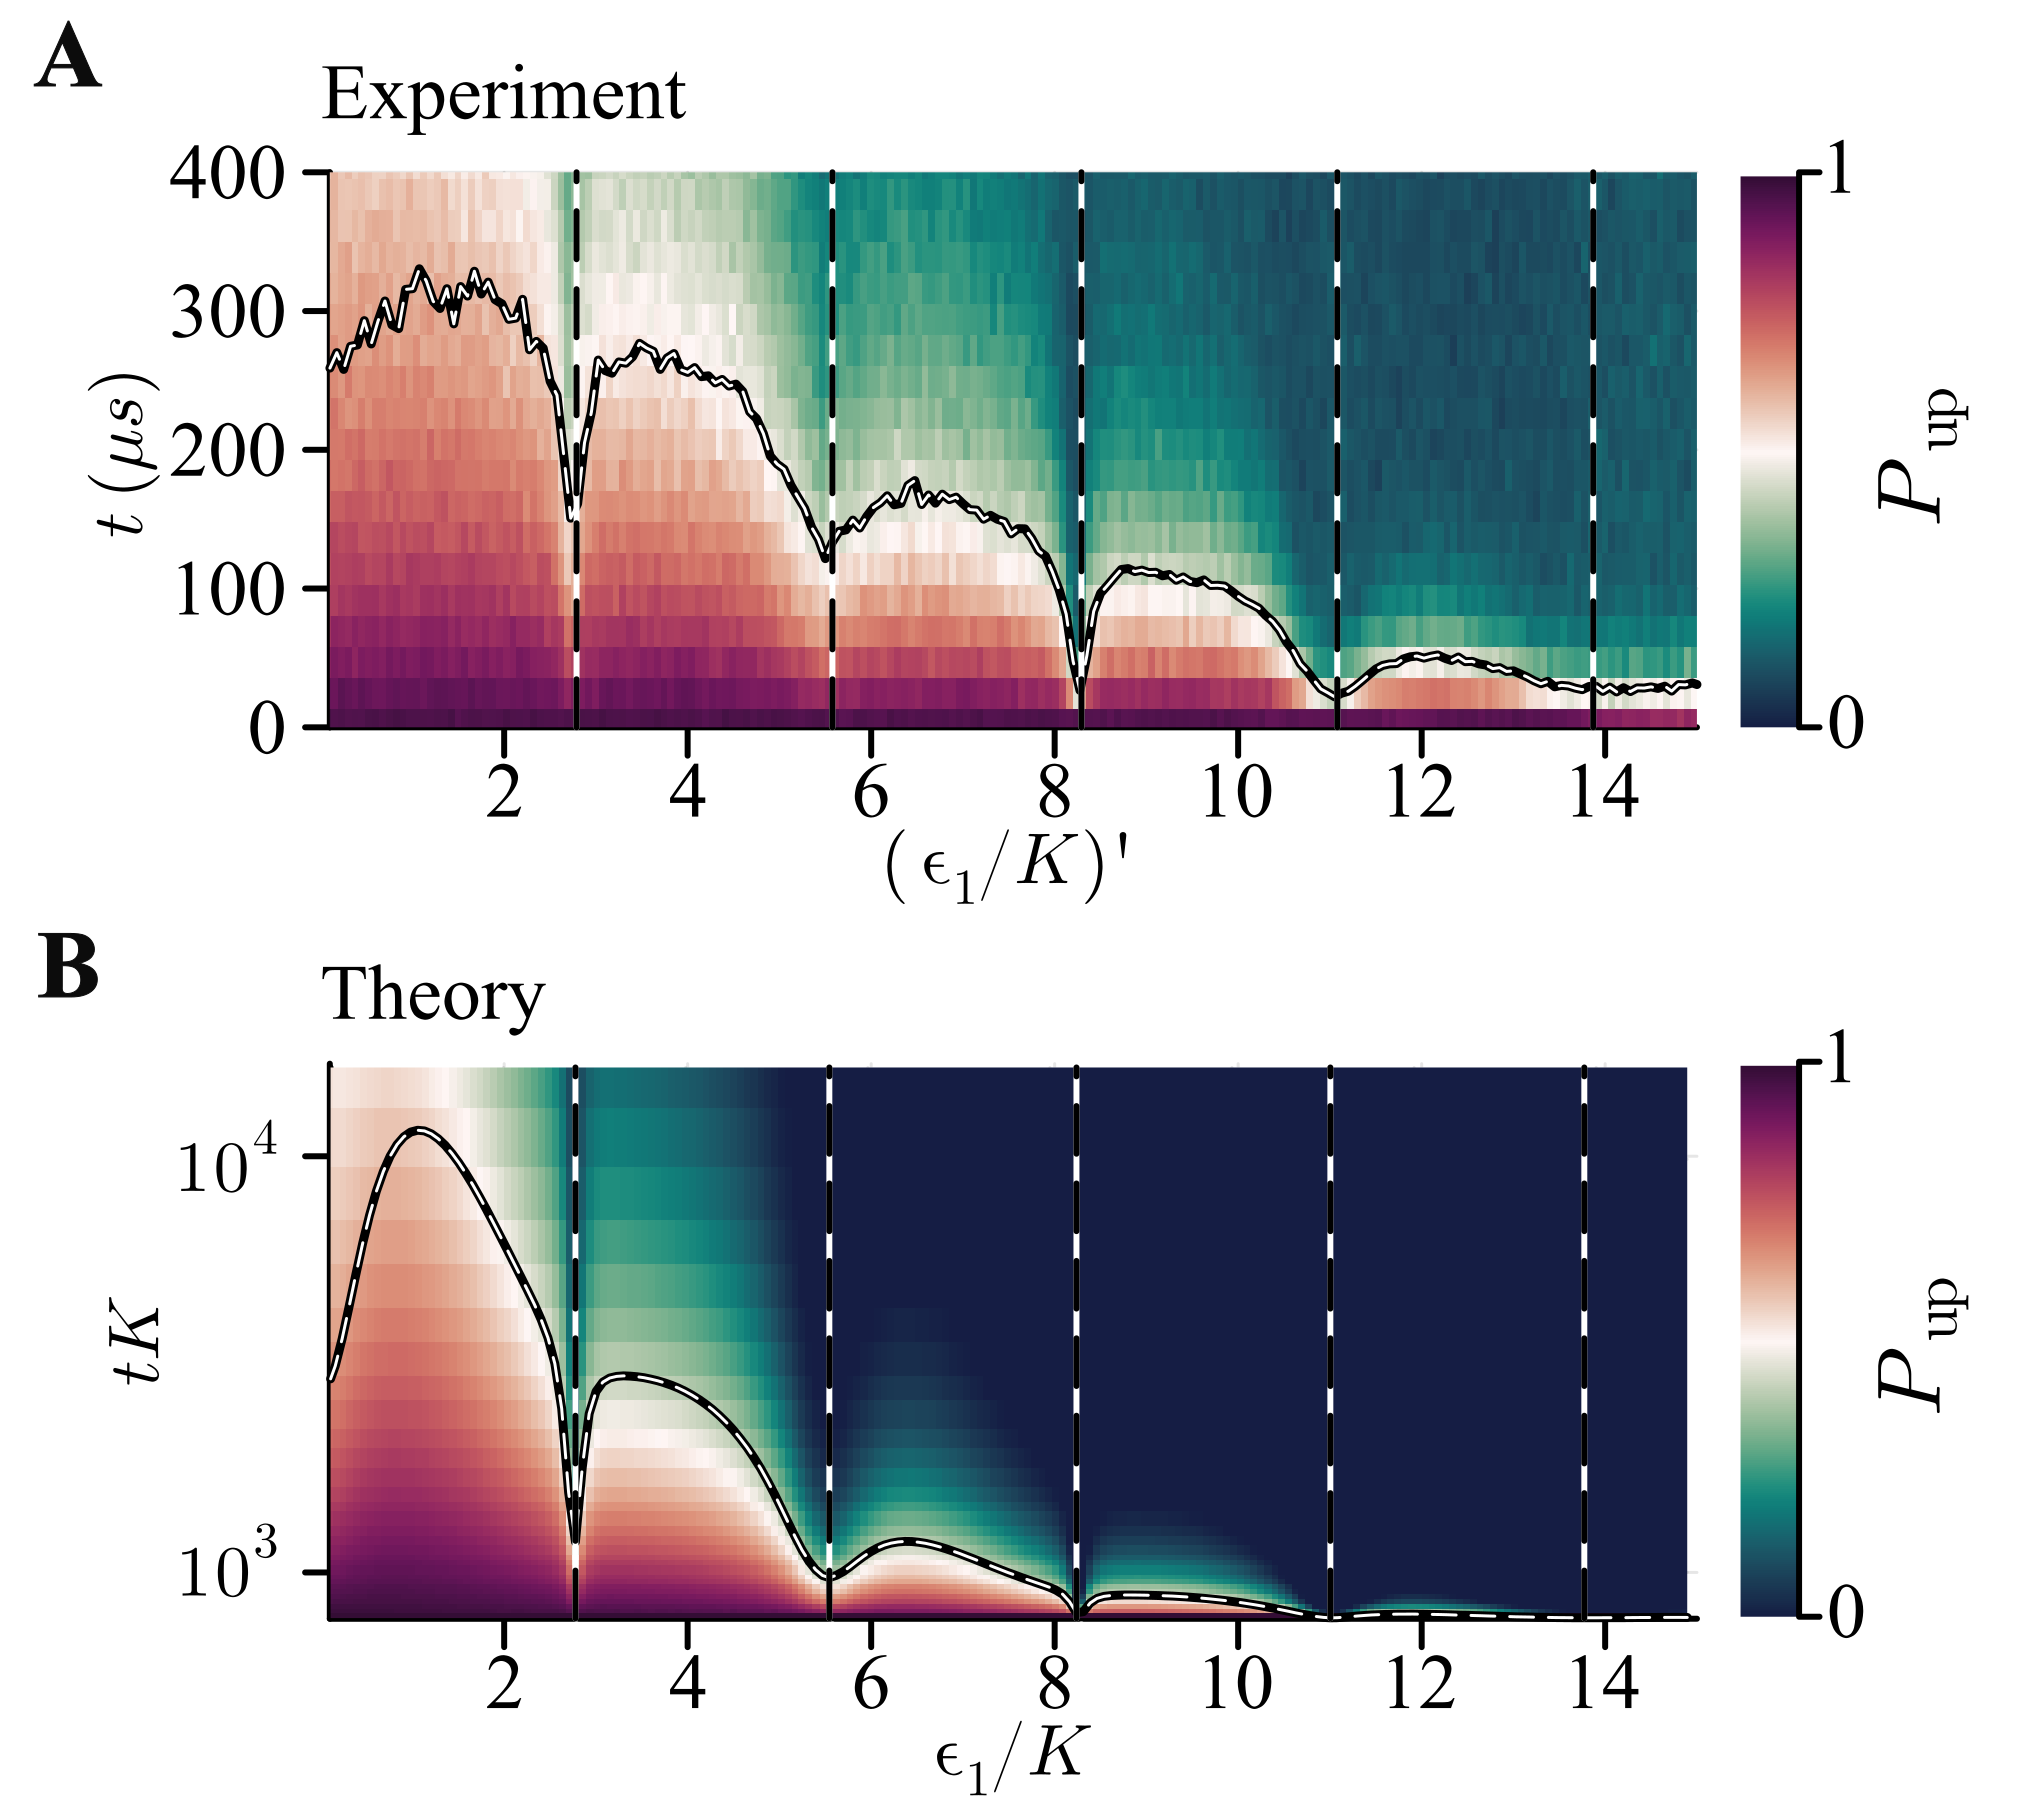
In Fig. 3 A we show measurements of the population dynamics of the wells for different values of the asymmetry, controlled by . For these measurements the squeezing amplitude is set to . The probability, as a function of time, of being in the initial well is well approximated by an exponential decay (see SM). This timescale of this exponential is a direct measurement of the activation rate (). In Fig. 3 B we see a theory prediction computed from a Lindbladian model including single-photon loss at rate and gain associated with a finite temperature corresponding to a mean number of thermal photons (or equivalently 95 mK at 6 GHz). The agreement between theory and experiment for the variations of with well parameters is remarkable, except when we consider the measured scale of , which differs from theory by more than an order of magnitude. This remains only qualitatively understood [30].
We observe in both the theory and in the experiment resonances for certain values of , where the activation rate is markedly increased. These are resonances between levels localized in different wells. The resonances for levels deep within the wells behave effectively as level crossings since the coupling is exponentially small due to the suppression of tunneling under the barrier. Therefore, these activation events are mediated by thermal and quantum heating [14, 13] from the ground state into the tunneling levels at the barrier top.
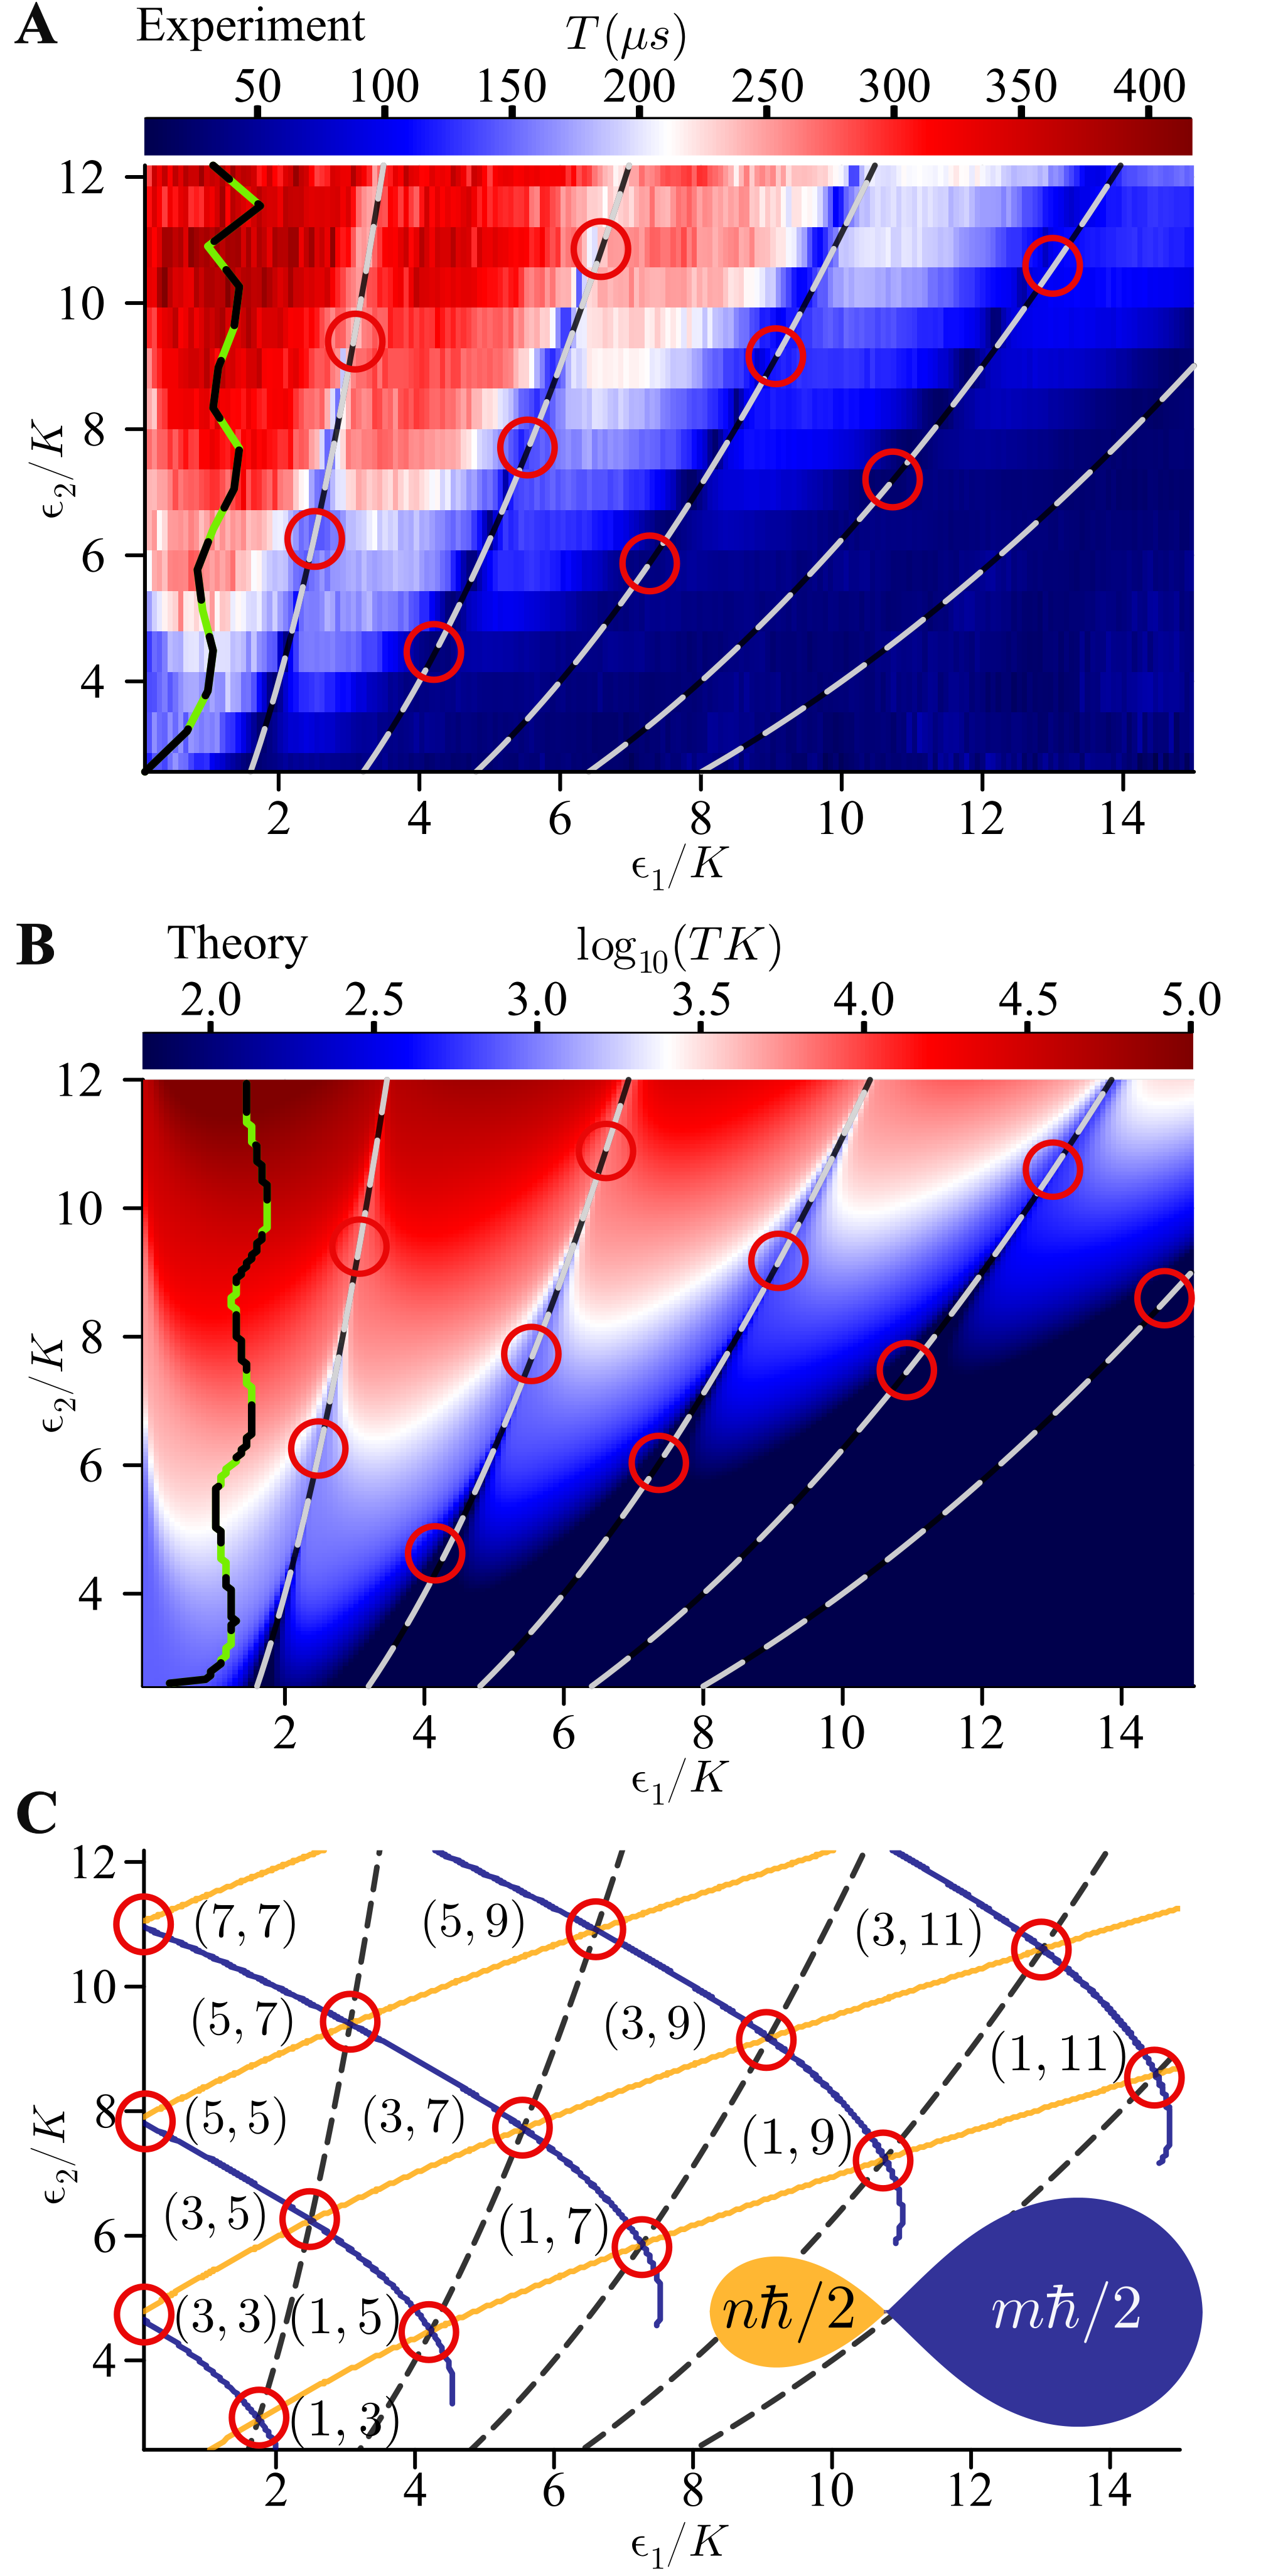
That the crossing is of over-the-barrier type is seen from Figs. 3 and 4 by noting that the alternating width of the different resonance in Fig. 2 D correspond to the strength of the anticrossings of the spectrum at the barrier top (purple levels in Fig. 2 C). This interpretation of the data allows us to predict the location in parameter space where resonant tunneling takes place. This happens when the uncoupled levels in the right and left well align. By realizing that the energy spacing of the levels in the wells can be estimated by [22] and that the asymmetry, defined as the energy difference between the lower-lying state of each well, can be estimated from Eq. 3 as (see also [20]) we write the resonance condition as ()
| (4) |
where numbers the different resonances. This simple formula predicts the location of the resonances with remarkable precision (see dashed lines in Fig. 4).
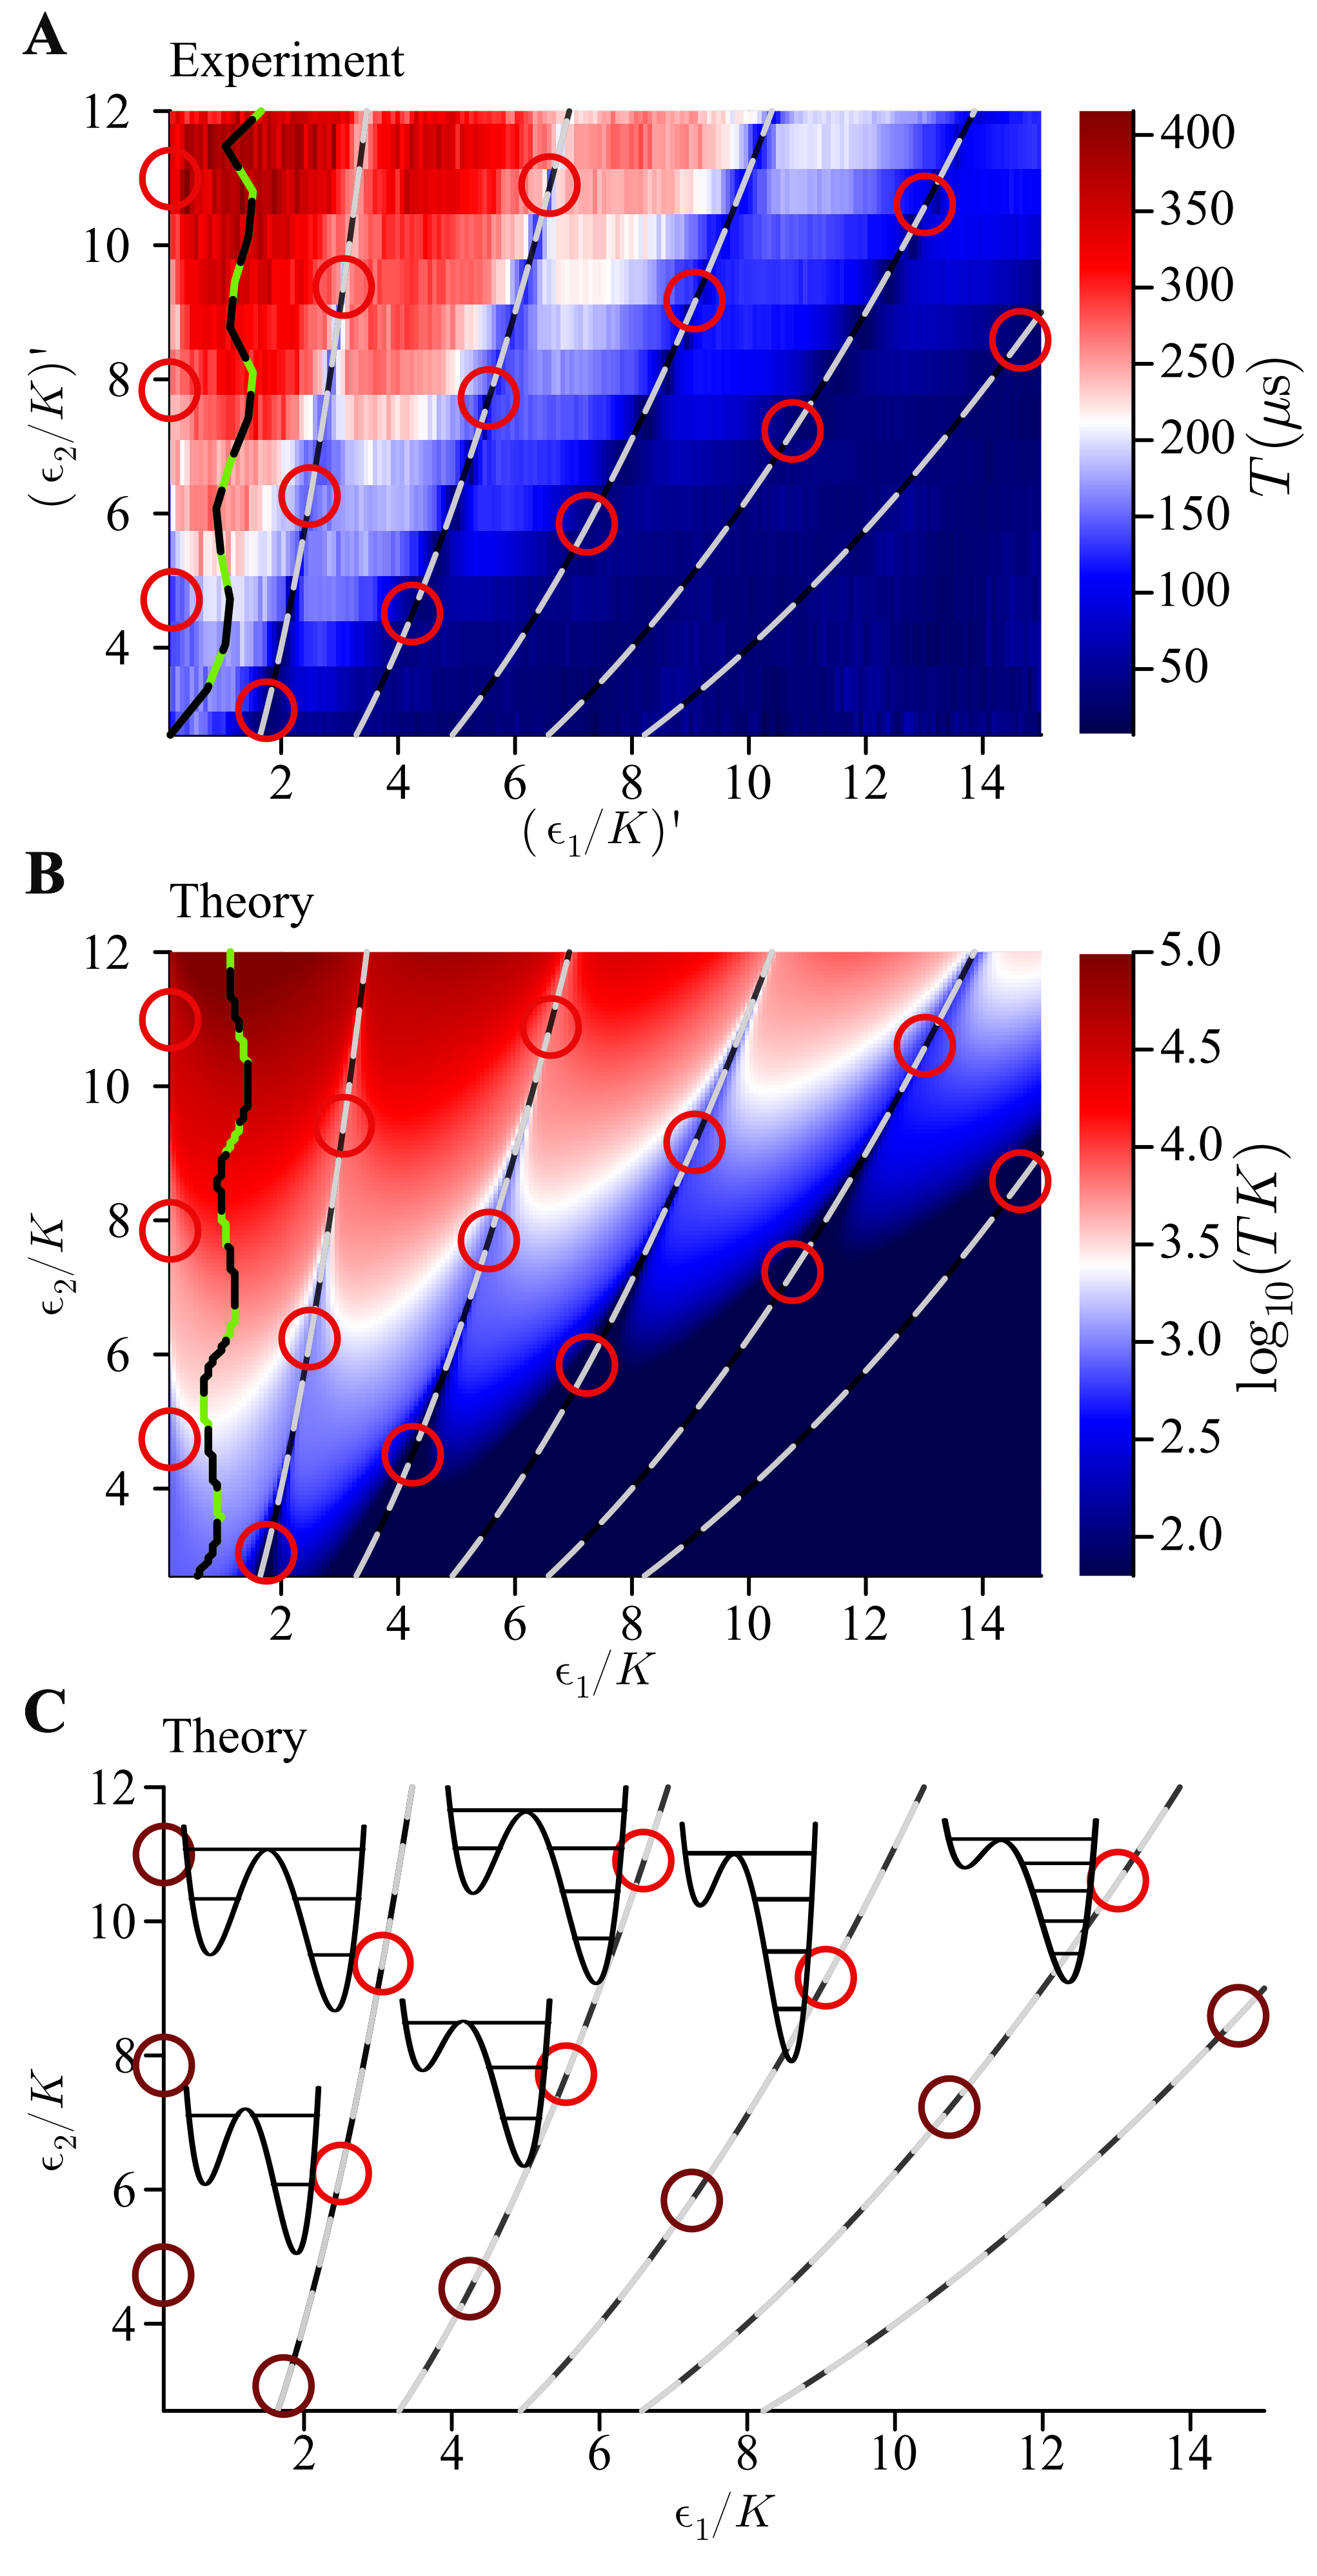
We complement this analysis with a semiclassical action quantization taken here as a proxy for the quantum levels. The number of allowed quantum orbits is given by the number of action quanta enclosed by the asymmetric “figure eight” lemniscate delineating the phase space separatrix in between the wells. The orange and blue curves in Fig. 4 C show the pairs and where the Einstein–Brillouin–Keller (EBK) [31] action quantization condition is met. That is,
| (5) |
where are the odd quantum numbers of the shallow and deeper wells respectively. The triple intersection points of the parabolas from Eq. 4 with the equi-action curves meeting the quantization condition mark the point in parameter space where a new level enters the wells in the tunneling resonances condition. We mark them with red circles labeled by , the quantum number of each well. At these points, where each well contains exactly and semiclassical orbits, we expect the resonance to broaden due to a new orbit contributing to the activation rate. This is seen as sharpening structures in Fig. 4 A and B (see also Fig. 3 for the broadened resonances).
In Fig. 4 A we show the measured activation time for a scan of both and . The resonances are shown to have widths that change along the scan. They are found to reflect the width of the tunneling anti-crossings at the top of the barrier. This can be seen by following the purple energy curves and their tunnel splitting in Fig. 2 D. The agreement of the semiclassical Hamiltonian theory with the experiment is remarkable (see SM for a full quantum treatment). The Hamiltonian theory predicts, quantitatively, the resonance condition and, qualitatively, their widths.
In Fig. 4 B, we show the Lindbladian model of the experiment. The agreement is excellent with regard to the location and behavior of the resonance in parameter space, but falls short in quantitatively predicting the activation rates measured. However, many features of the data are correctly captured. For example, the Lindbladian model shows that an asymmetric system can have a longer activation lifetime than the symmetric system, even if one of the wells is markedly shallower. See this directly from Fig. 3 at . The green-black line in Fig. 4 A shows the experimentally determined maxima of activation time as a function of the control parameters. The theoretical maxima are shown in Fig. 4 B by the line of the same colors. The location of the maxima is nontrivial, and it is relevant because it can readily be used to extend the lifetime of a Kerr-cat qubit [18]. The effect was unknown to us before the analysis of our experimental data.
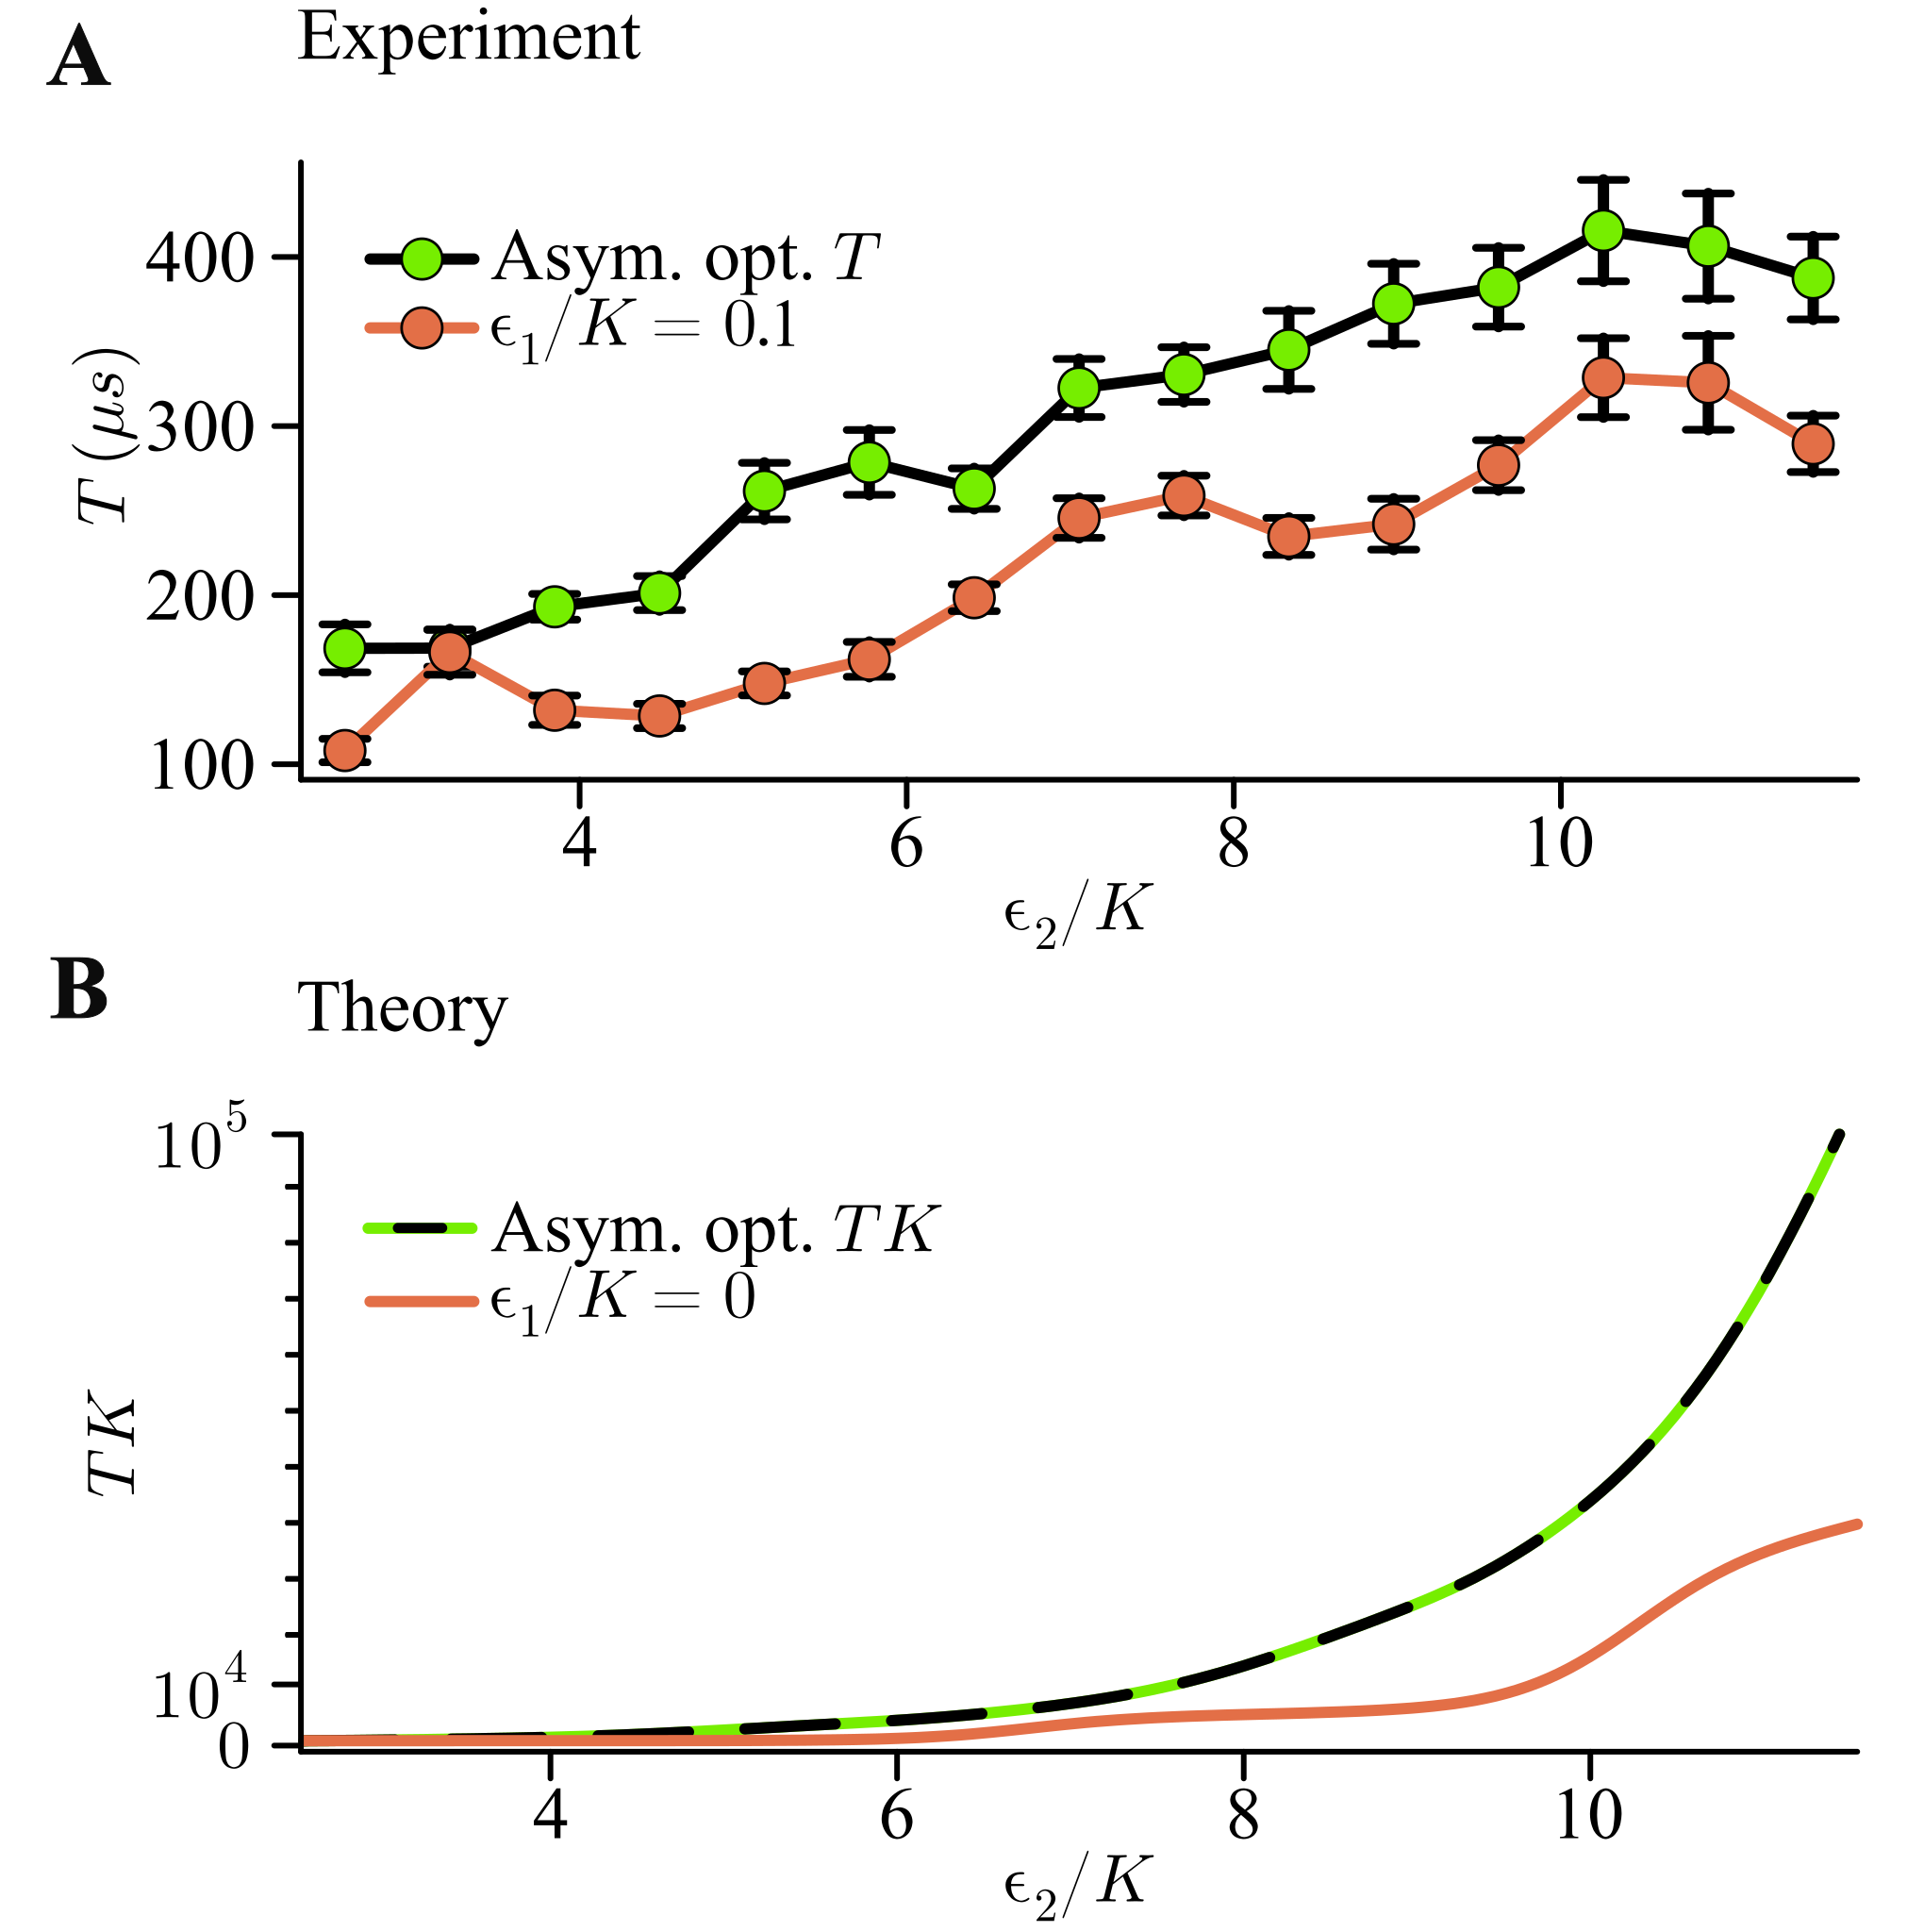
In Fig. 5, we show the increase of with the asymmetry. To provide physical insight into this effect, we note that for the symmetric case (), is modulated in a step-like fashion by the orbits falling under the barrier [15]. The linear drive can be exploited to break the (parity) symmetry of these orbits as shown in Fig. 2 and therefore avoid altogether the resonant saturation seen for in Fig. 5 A, B. This observation explains the trajectory of the green-black curve in Fig. 4 A, B which snakes around, avoiding the new resonance conditions marked by the red circles. In other words, quantum tunneling produces a hybridization of the classically decoupled orbits right under the barrier, so the asymmetry parameter can be used to minimize that hybridization, reducing the tunneling rate via the excited states, and avoid the plateaus in Fig. 5 almost completely.
IV Relevance for chemistry
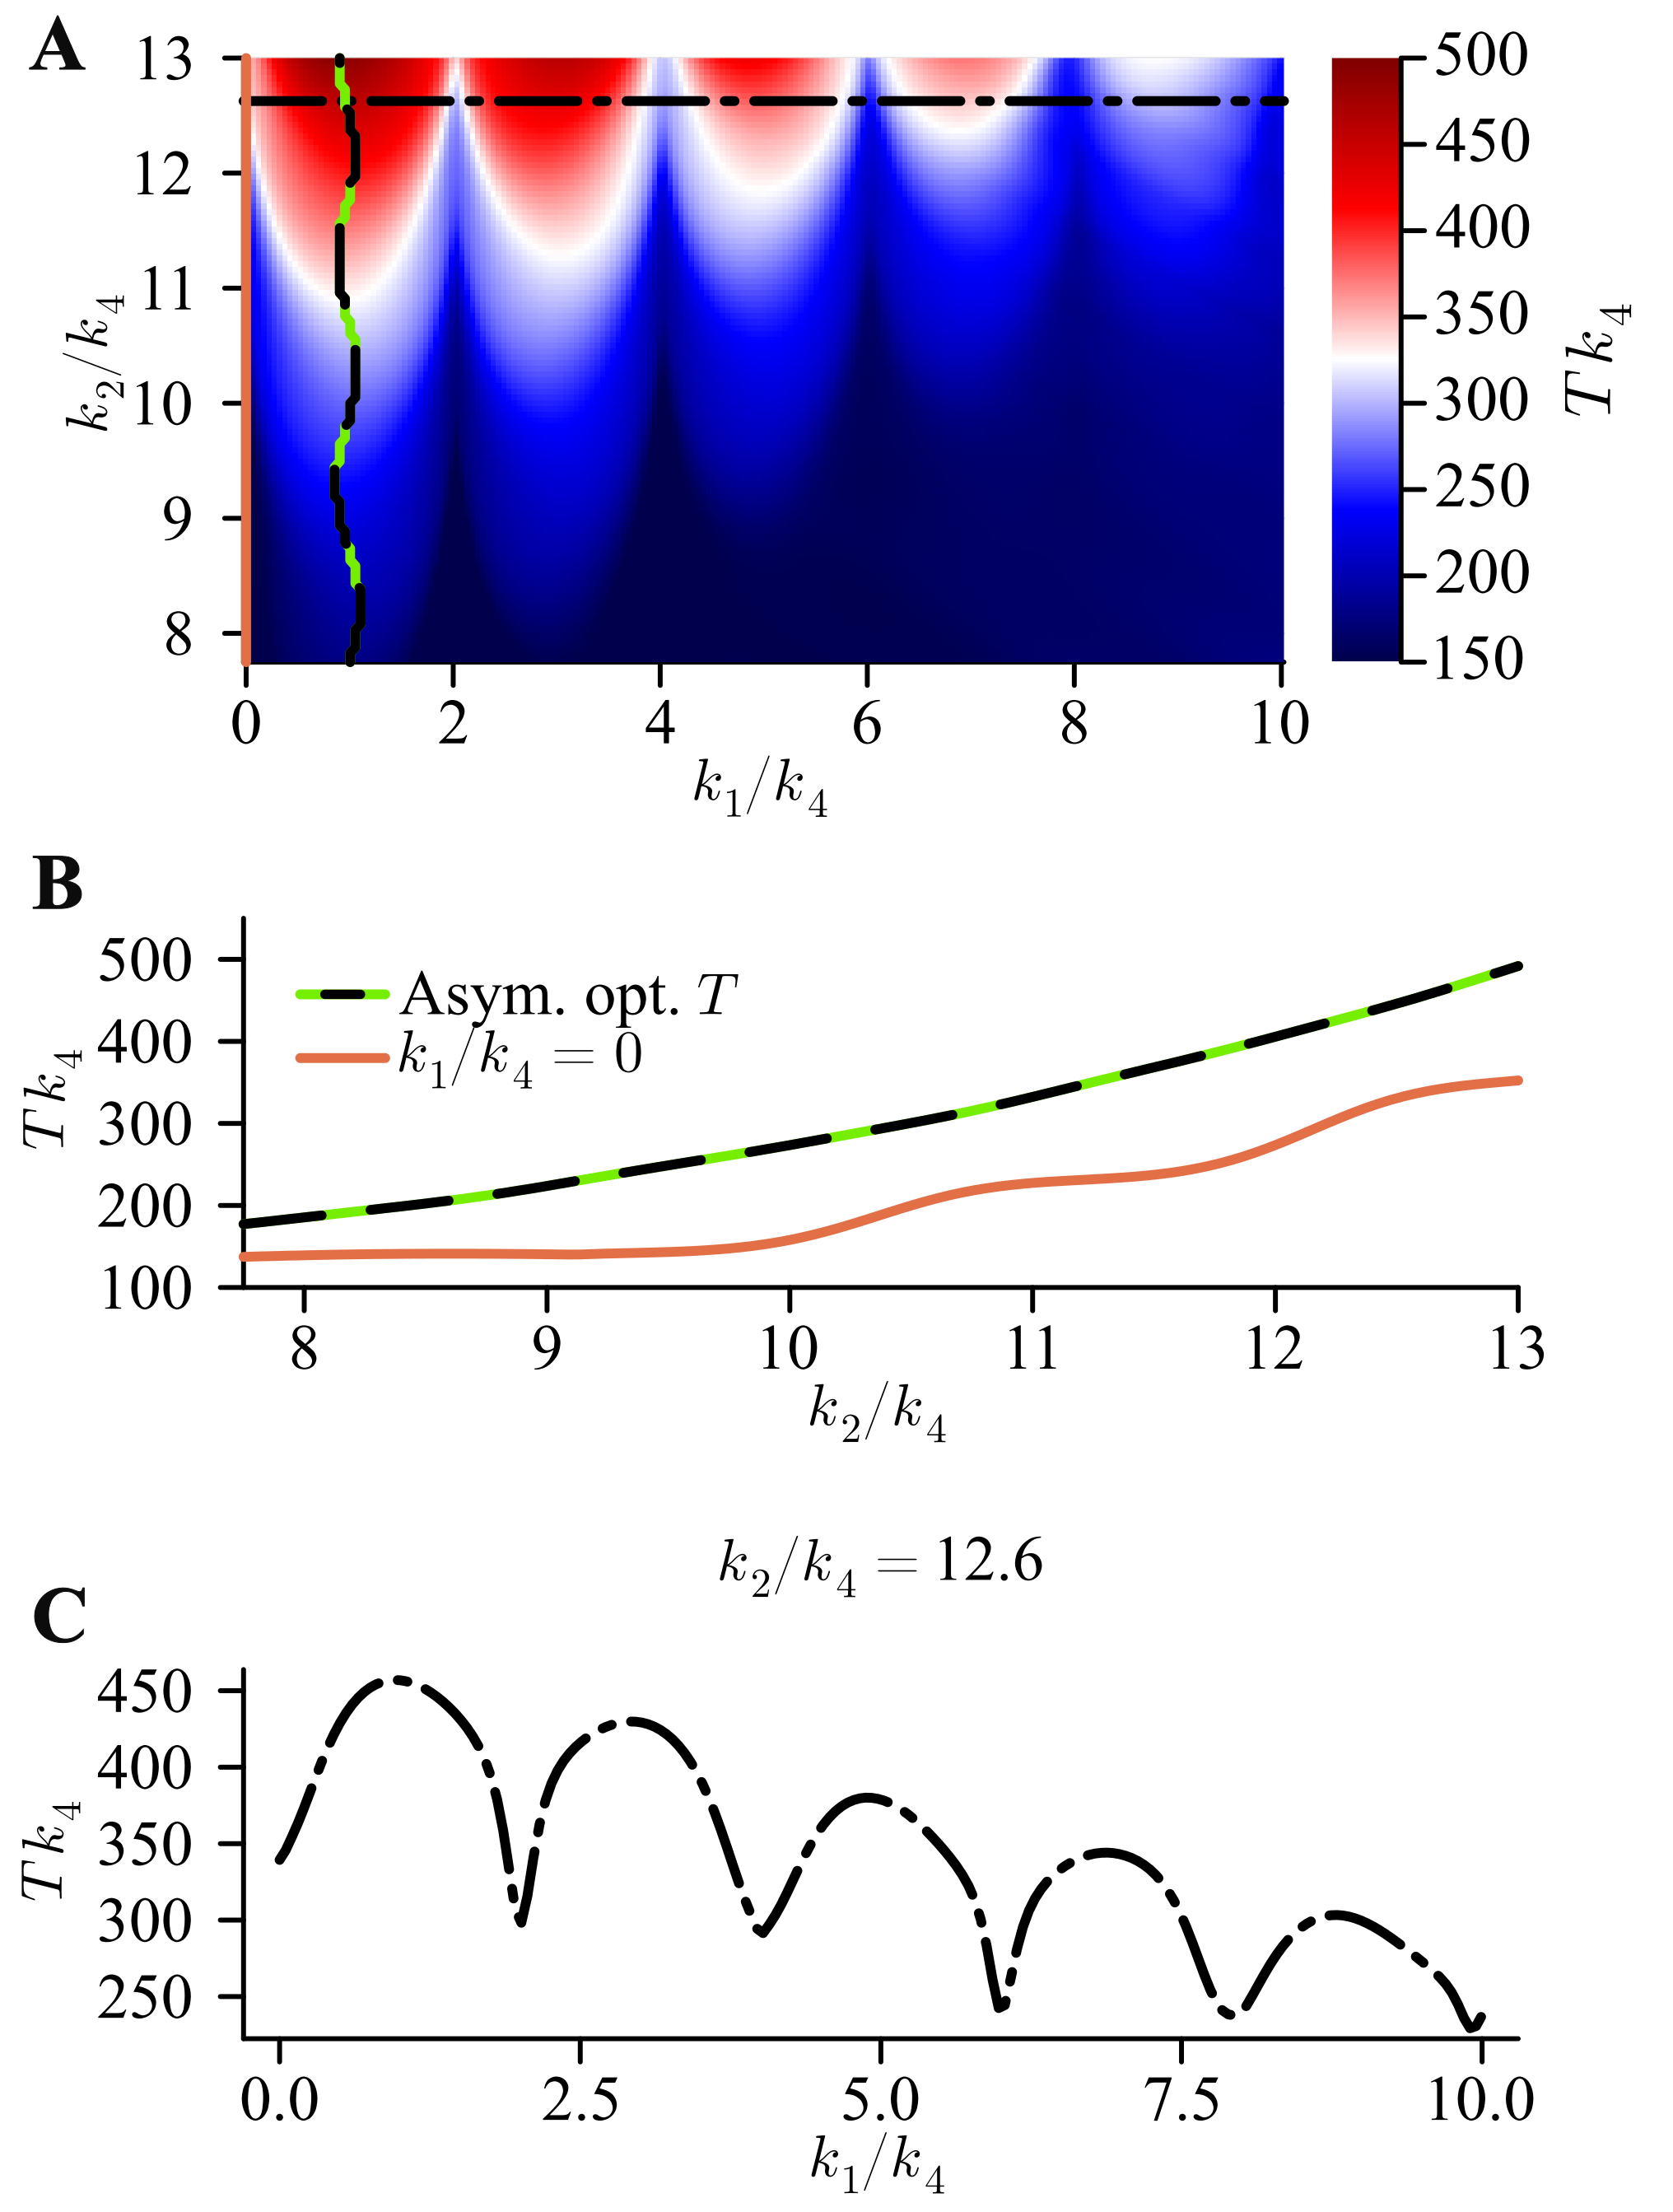
The experimental observations presented here raise the question of whether they are present in other double-well systems, like the type of double-well used to describe chemical reactions. This may prove useful for investigations of problems relevant to chemistry (see, for example, [5] and references therein). To investigate this, we run a Lindbladian simulation for the chemical system with Hamiltonian and including single photon loss and gain with rate and at temperature (parameters that correspond to the ranges accessible by our system). Note that the dissipation model is still that of a high-quality factor linear oscillator, and we work under the hypothesis that this dissipation model captures the relevant phenomenology for applications in chemistry. With this, we answer our question affirmatively. On the one hand, the green-black line in Fig. 6 A depicts the maximum lifetime as a function of well-asymmetry and well-depth, showing that - just like in our experiment (Fig. 4 A, B) - a small asymmetry increases the lifetime significantly (see also Fig. 5 A, B and Fig. 6 B). On the other hand, Fig. 6 C depicts a horizontal linecut of Fig. 6 A and clearly reveals the same width alternation (broad-narrow-broad) as discovered and explained in our experiment (see Fig. 3). The finding of these two unexpected effects shows that our asymmetric Kerr parametric oscillator setup is already able to produce meaningful predictions for chemical quantum rate theory.
Double-well systems have been extensively studied in various contexts [32, 33], including in superconducting circuits [34, 35, 36, 37]. However, we speculate that the unique combination of precise real-time microwave control, complete tunability over Hamiltonian parameters, experimental stability, fast repetition rates, and high-fidelity readout in our setup is the reason why we observed effects not previously reported.
Based on these results, we will propose in a forthcoming paper [38] a hardware modification to our setup that implements a one-to-one single-transmon quantum simulation of tautomerization reactions in Malonaldehyde (cis-cis) and proton transfer reactions between the DNA base pairs Guanine-Cytosine. The key to this simulator is that, for realistic circuit parameters, the Hamiltonian cross terms and the relativistic-like term become irrelevant perturbations [these arise from the Kerr term , which in turn arises from the term as perturbations, see Eq. 1]. Also, our system allows for a clean microwave control of effective temperature [39] and dissipation [15], allowing us to experimentally explore chemical dynamics across a wide range of parameter spaces [40, 5] in this new type of single-transmon parametric quantum simulator.
V Conclusion
We reported the measurement of the activation rate in a continuously tunable asymmetric Kerr parametric oscillator with dissipation and observed a fine structure that, to the best of our knowledge, was unknown in the literature. Our experiment shows that the activation rate displays resonances whenever a level close to the barrier top aligns with one in the other well. We derive an analytical formula that predicts the occurrence of these resonances as a function of asymmetry and well depth. Furthermore, we discover that these tunneling resonances alternate in width between narrow and broad lines as the asymmetry and well depth are changed. We trace this effect back to the alternating strengths of level anticrossings in the spectrum close to the barrier top. This shows that the activation is of over-the-barrier type (i.e., not via direct quantum tunneling by the low-lying states), as predicted [41, 13, 20]. We are thus able to learn the level structure near the barrier top without having to prepare these excited states.
We also note the importance of this system for quantum computation since qubits can be encoded in the well state manifold [22, 18]. In this regard, two contributions of the present work deserve to be highlighted. The first one is the increase of the activation timescale by a fine control of the asymmetry. This directly leads to a reduction of bit-flip errors [42] with no extra hardware requirements. The second one is that we demonstrated the operation of a highly asymmetric parametric oscillator in the quantum regime. We provide direct evidence that the static effective description is not compromised under strong linear drives, which are required for fast gates [22] and new implementations of hardware efficient readout schemes [43].
Our control over the well-asymmetry opens the path for quantum simulation of chemical reaction dynamics with a parametric oscillator [38]. The herein shown controllable asymmetry and well depth, in conjunction with adjustable detunings [24], allows for the emulation of chemical double well potential energy surfaces [38]. This in turn allows for the analog simulation of proton tunneling, and e.g. the study of transfer reactions between the Guanine-Cytosine DNA base pairs appears within reach of current Kerr parametric oscillator technology [38].
After writing this manuscript, we were made aware of a similar experiment at Rice University using trapped-ions to create an asymmetric double-well to simulate electron transfer [32].
Author contributions
ACCdA, RGC, and MS analyzed the data, modeled the experiment, and wrote the manuscript. PEV supported the data analysis. All authors contributed to the manuscript. RGC and MS conceptualized the experiment and collected data. NEF fabricated the device. BA, DGAC, PK, EG, and VSB validated the relevance and utility to chemistry and provided theory support. MHD and RGC supervised the research.
Acknowledgements
We acknowledge discussions with Q. Su, A. Ding, B. Brock and M. Dykman. This research was sponsored by the Army Research Office (ARO) under award number W911NF-23-1-0051. The views and conclusions contained in this document are those of the authors and should not be interpreted as representing the official policies, either expressed or implied, of the Army Research Office (ARO), or the U.S. Government. The U.S. Government is authorized to reproduce and distribute reprints for Government purposes notwithstanding any copyright notation herein. VSB, EG and MHD acknowledge partial support from the National Science Foundation Center for Quantum Dynamics on Modular Quantum Devices (CQD-MQD) under Award Number 2124511.
Supplementary Material
V.1 Calibrations of experimental parameters
V.1.1 Measurement of Kerr coefficient and frequency
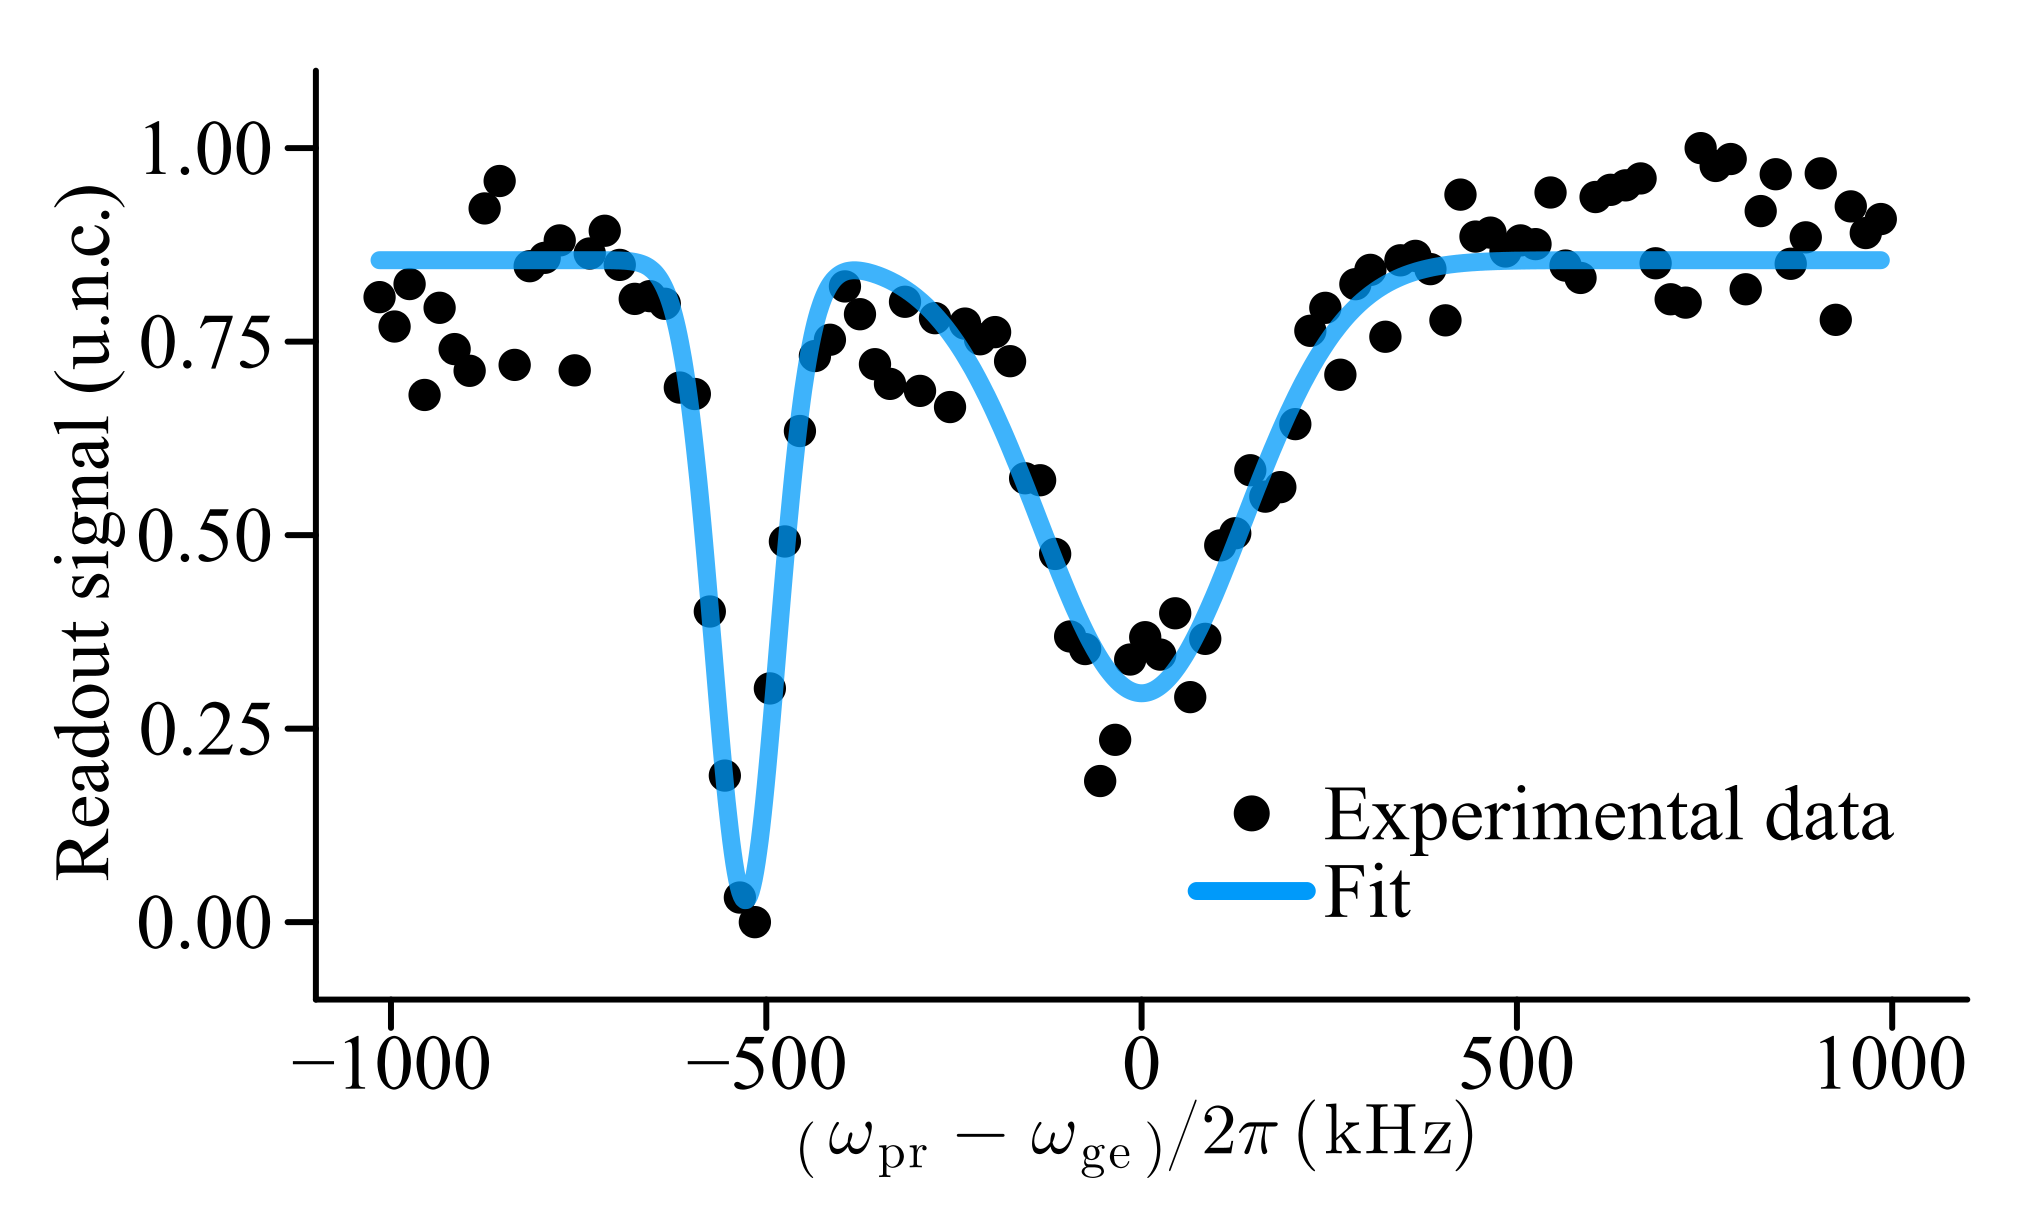
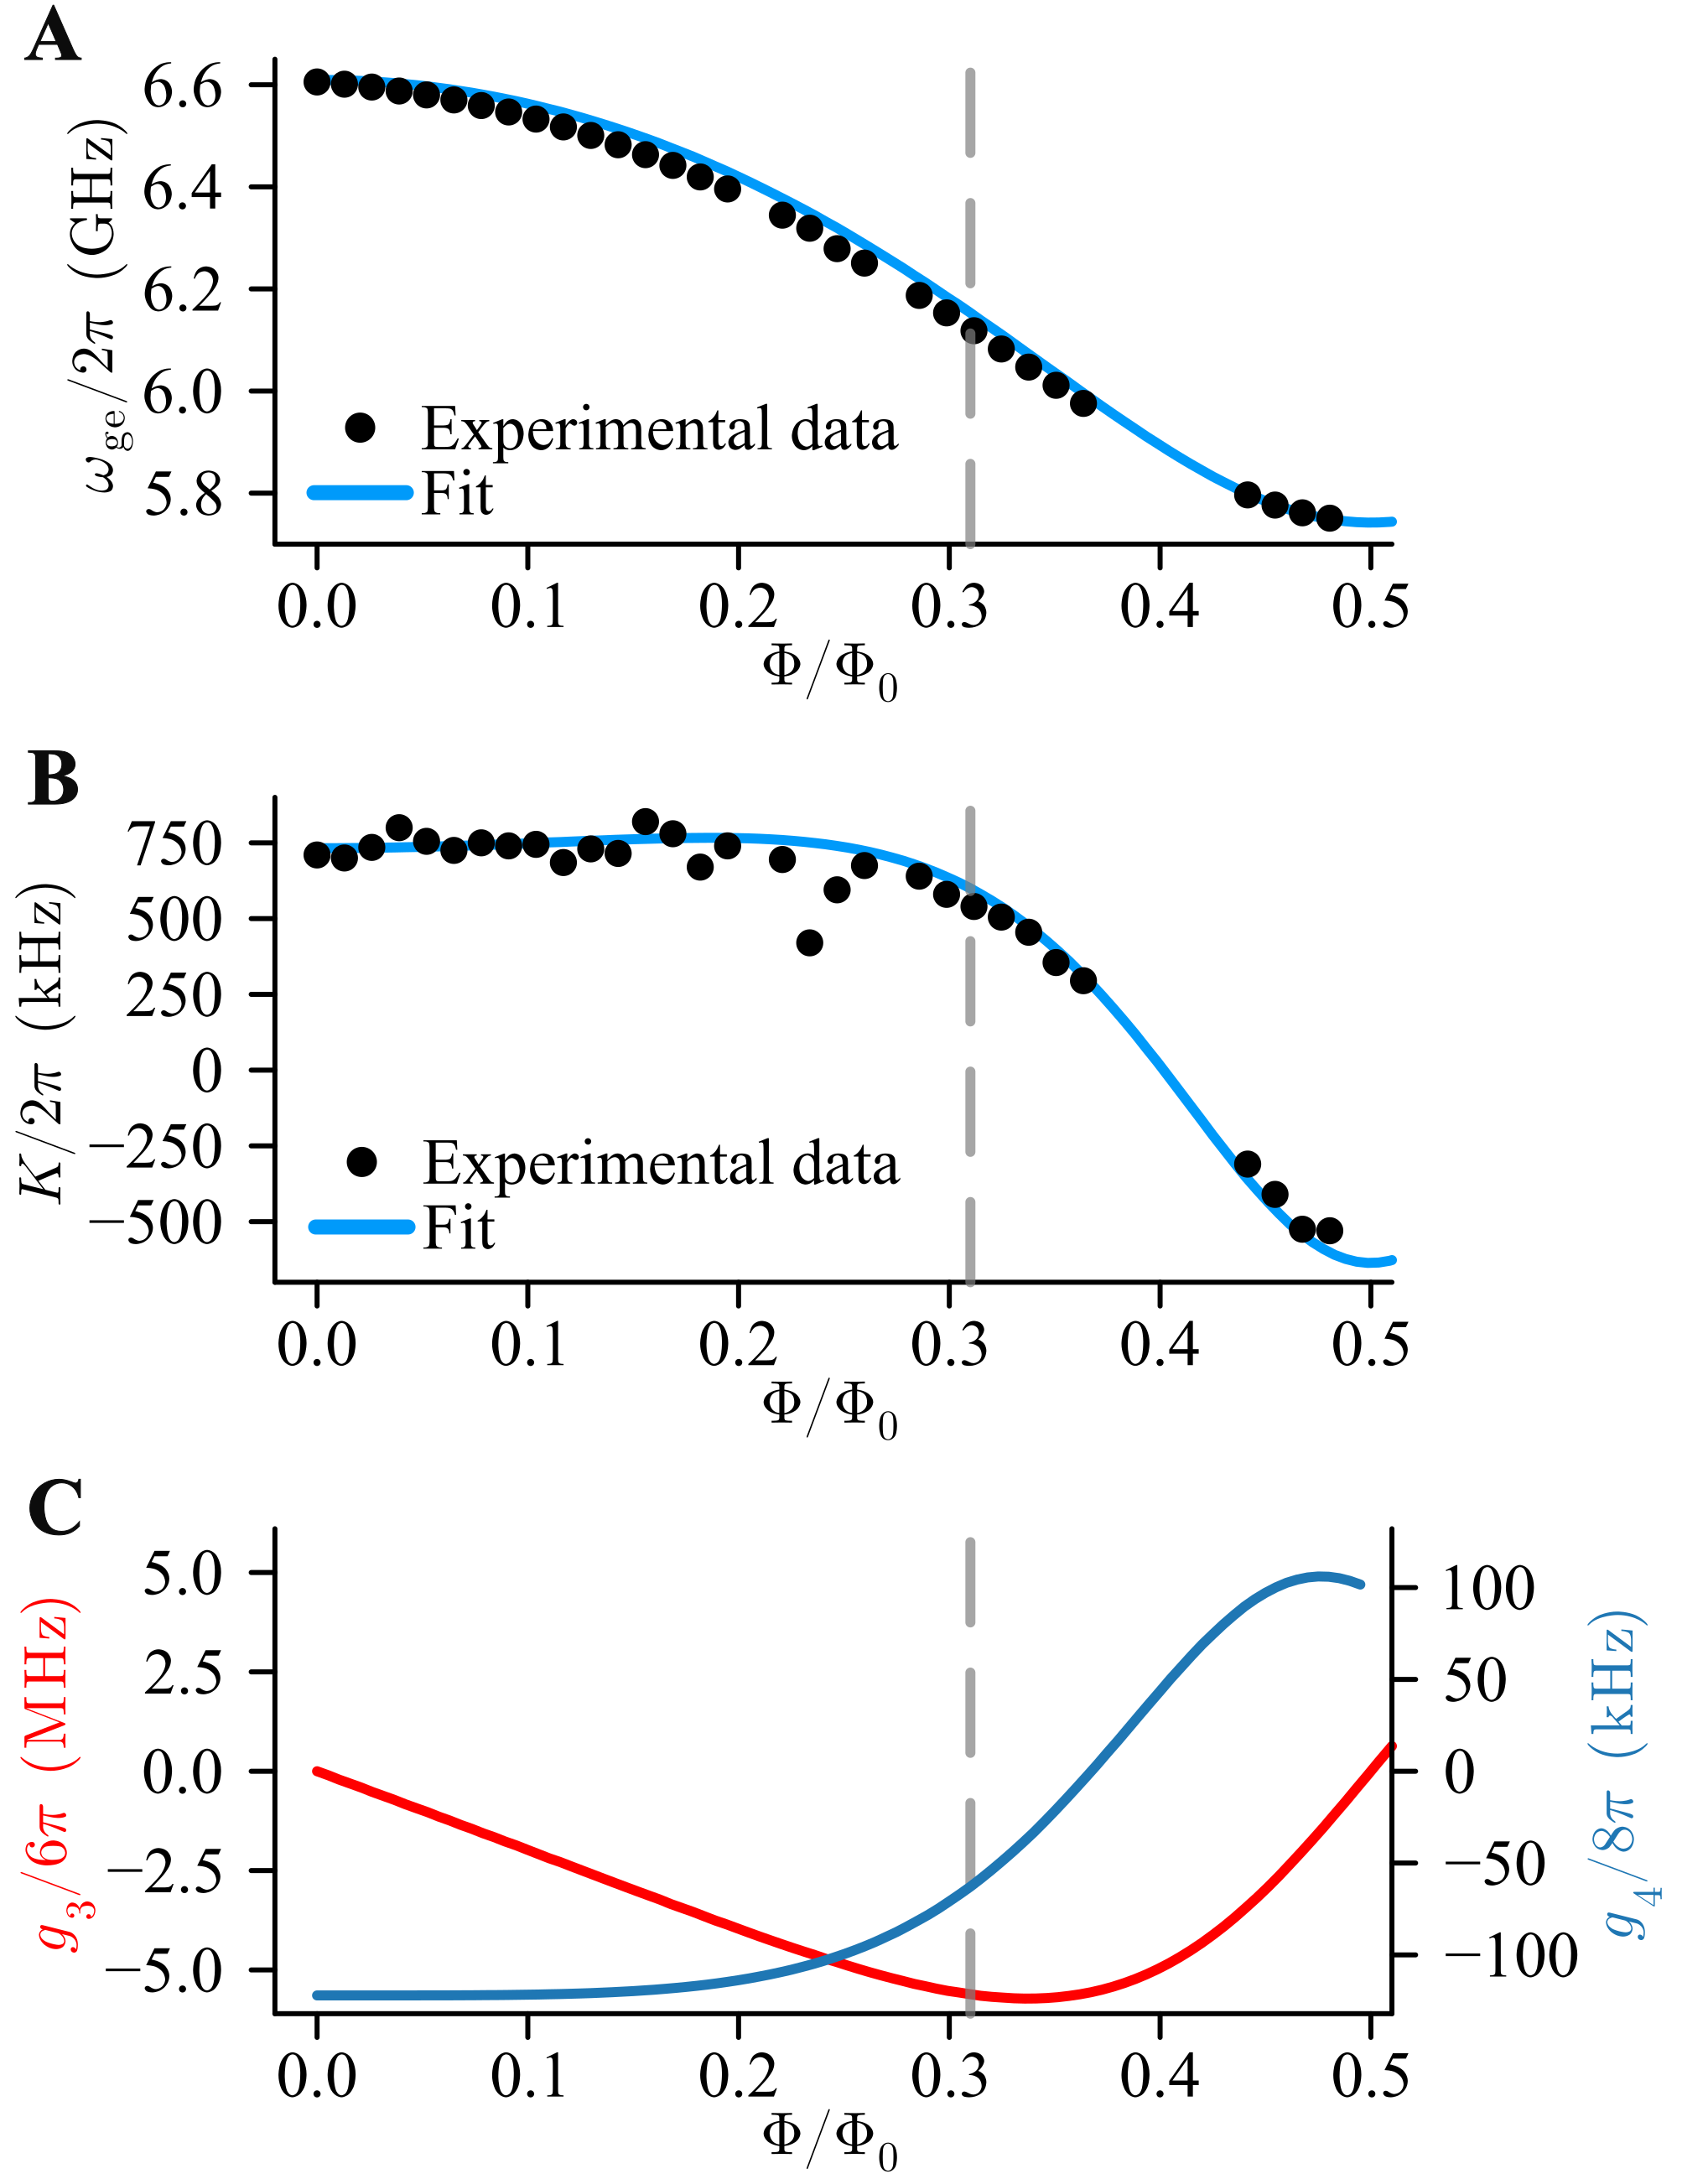
The Kerr coefficient , as used in the parametric oscillator Hamiltonian Eq. 2, is extracted by spectroscopy. A saturating probe drive is applied to the SNAIL transmon operated with . Varying the probe drive frequency and measuring the response via dispersive readout, results in the data shown in Fig. 7. The spectrum shows two clear dips, which correspond, from lower frequency to higher frequency, to the two-photon transition and the transition (the SNAIL levels are labeled following the atomic physics convention in increasing energy order ). Note that the measured is a good approximation for used in the main text (Eq. 2). We then extract Kerr by using the relation . Fitting two Gaussian peaks to the spectrum in Fig. 7, we find kHz. These measurements, when taken as a function of the biasing flux of the superconducting loops, allow for a calibration of the SNAIL non-linear parameters . In Fig. 8 we show a flux scan of our sample with measured frequencies, Kerr nonlinearities, and the fit by the model presented in [17].
V.1.2 Calibration of relative phase between squeezing drive and linear drive
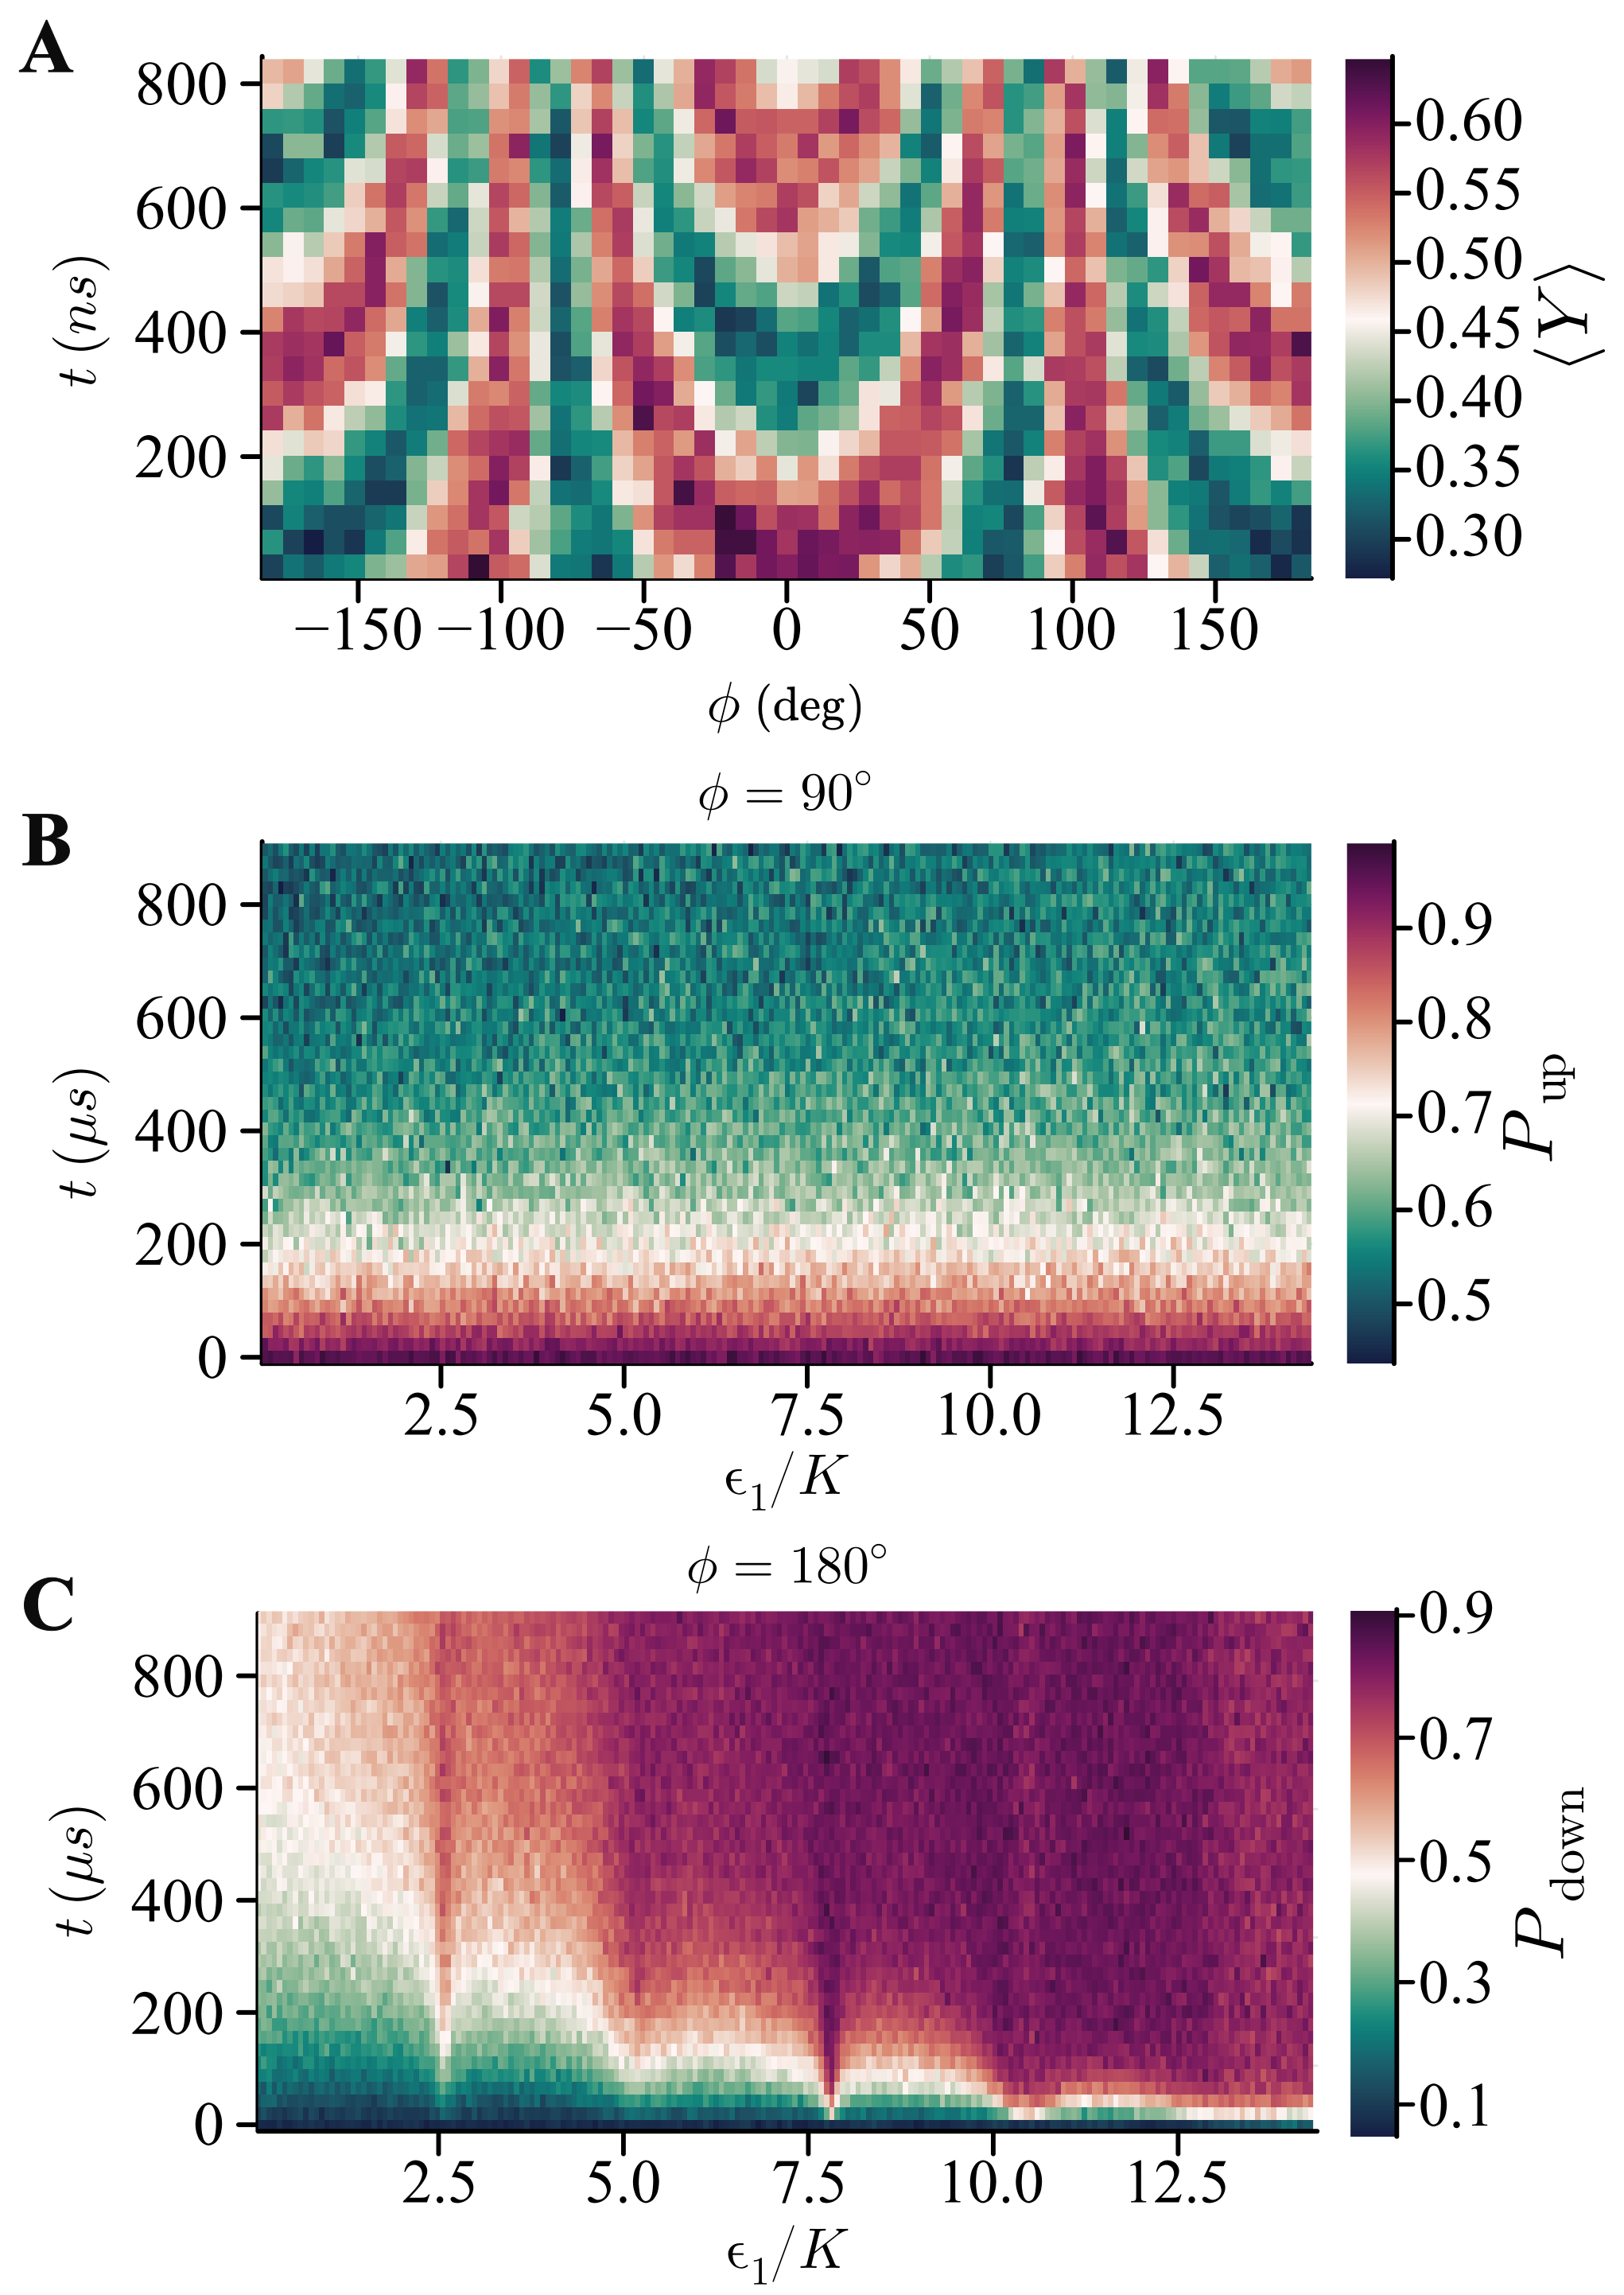
Quantum coherent Rabi-like oscillations as a function of this phase are shown in Fig. 9 A [18]. For , this drive is position-like and lifts the degeneracy between the two wells (see Fig. 2 C and Fig. 20 A). This energy difference induces the Rabi-like oscillation. For (Fig. 9 A), the linear drive is momentum-like (the Hamiltonian term is ), thus not breaking the symmetry of the double-well (see Fig. 20 D).
V.1.3 Calibration of squeezing (parametric) drive amplitude and linear drive amplitude
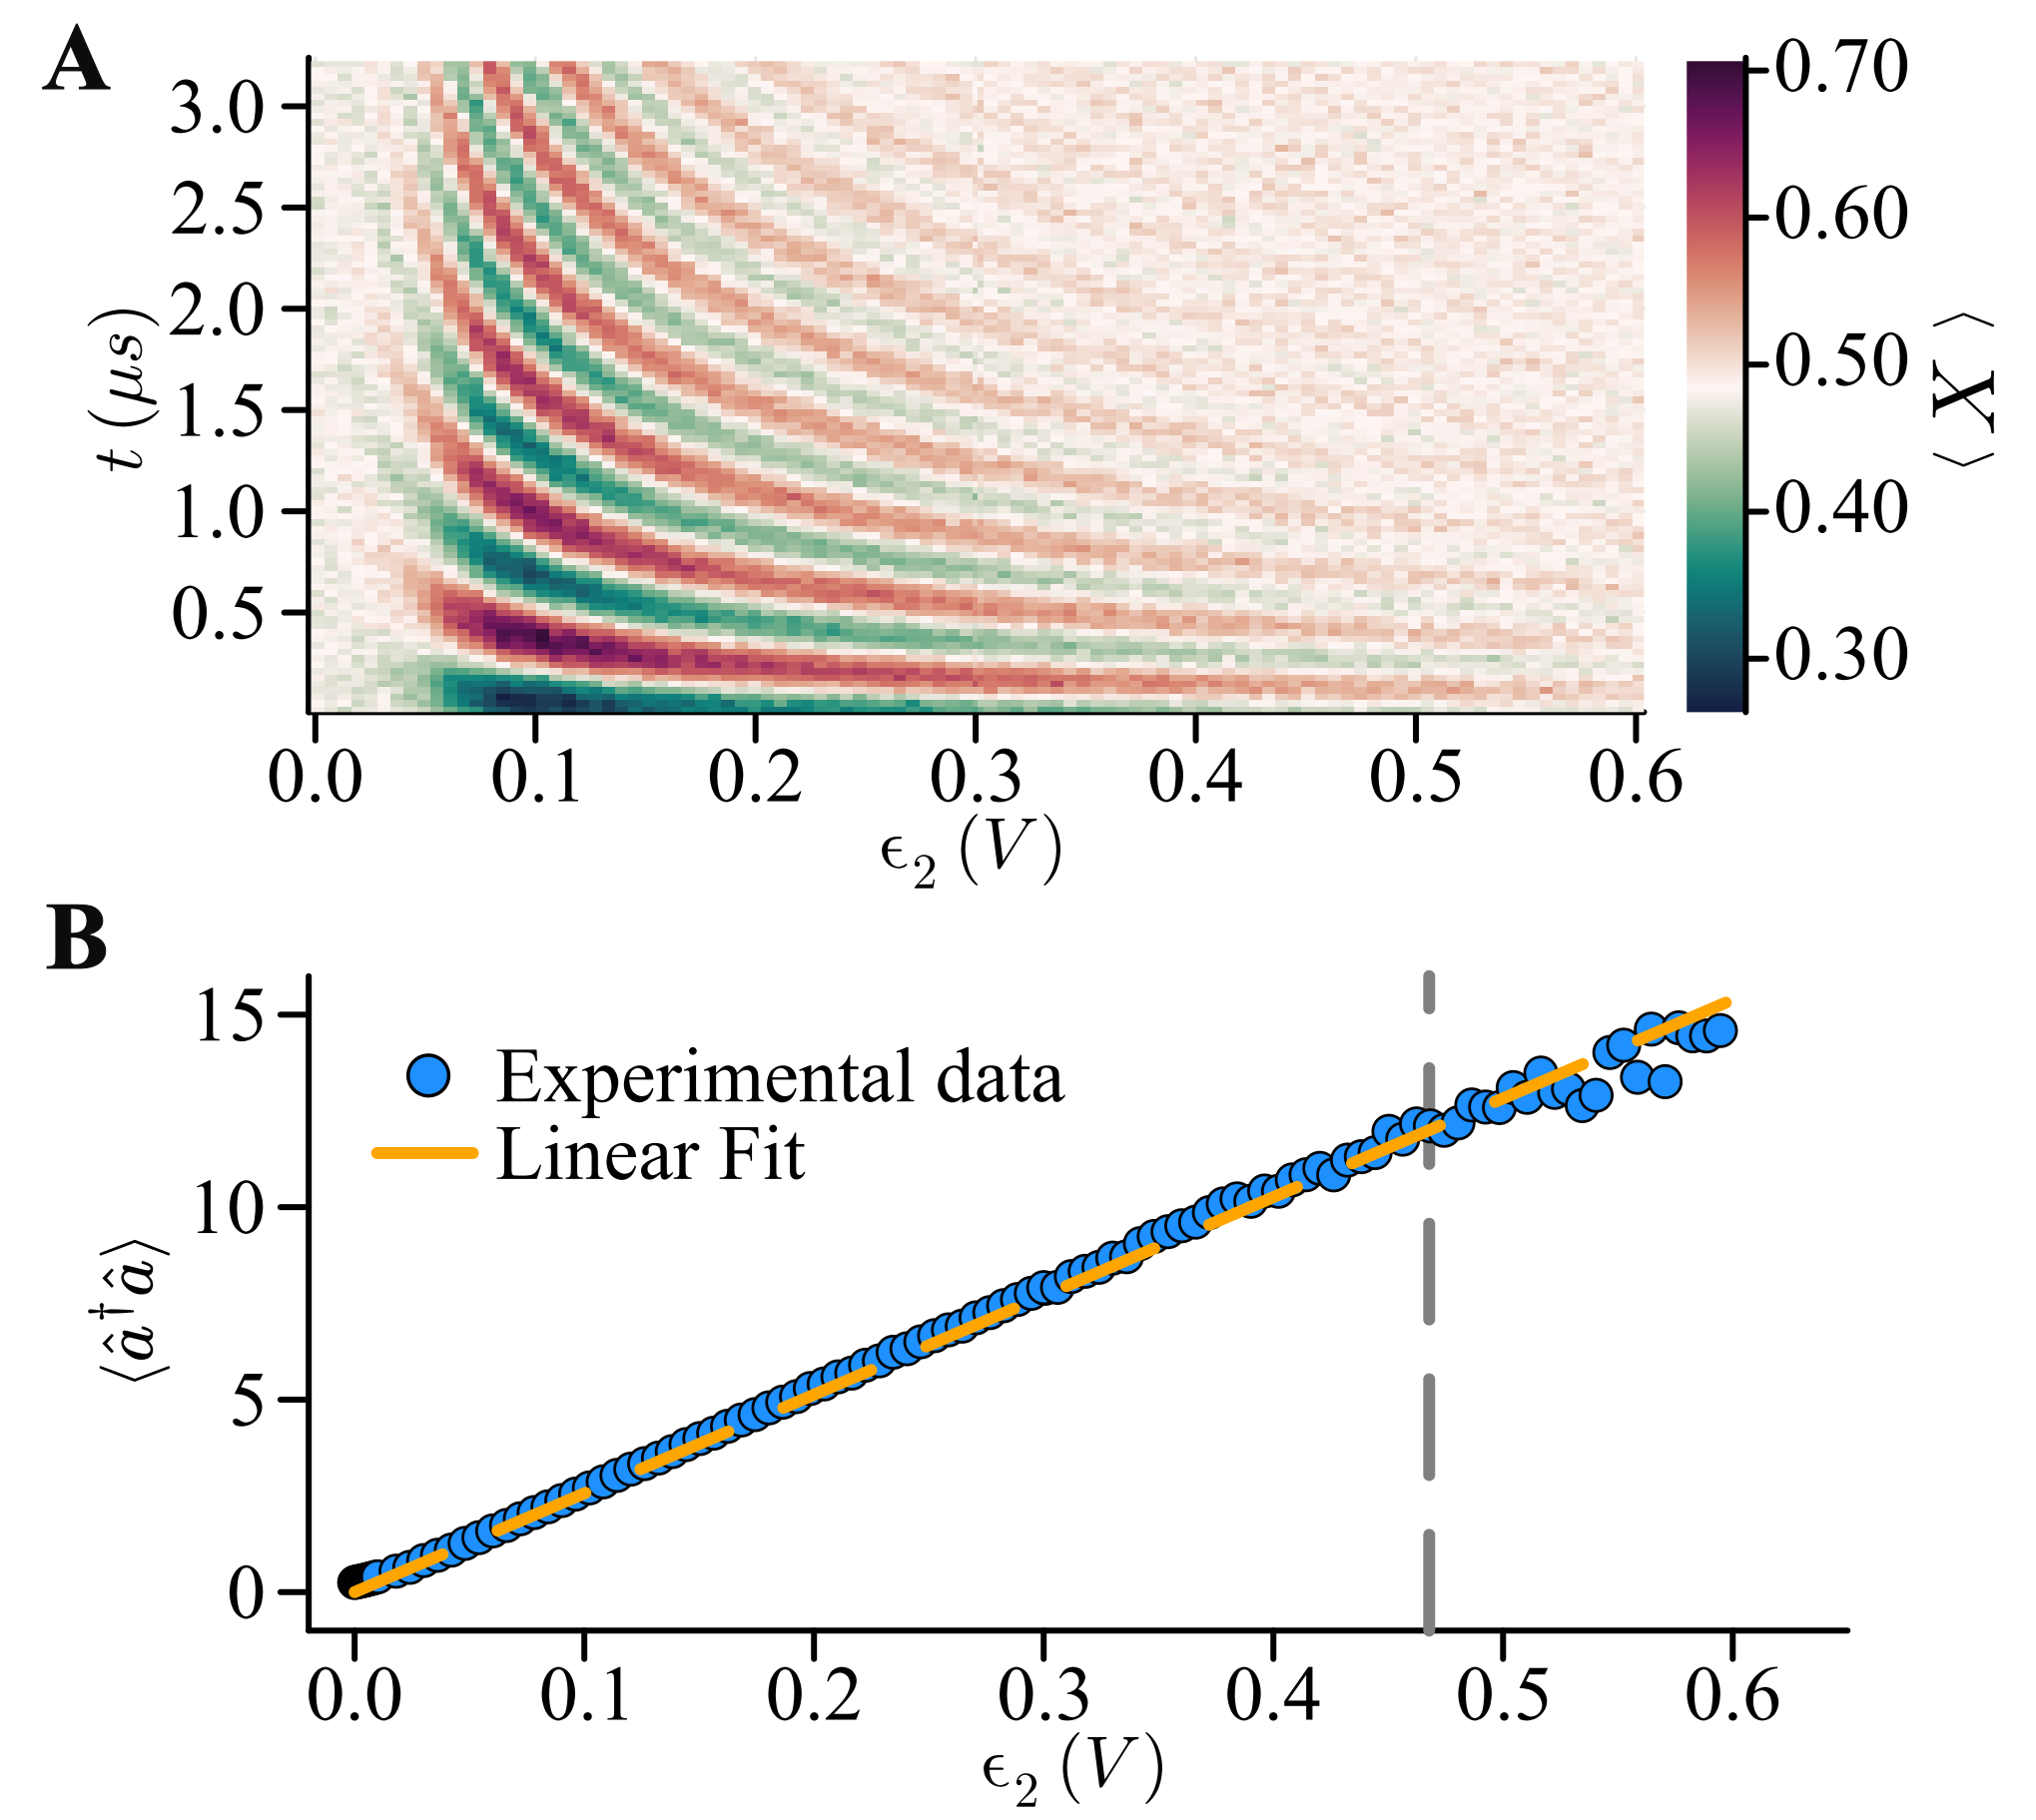
In the experimental setup, the drive amplitudes are directly controlled by a digital to analog voltage converter. To calibrate the strength of the drive in MHz we measure time-resolved Rabi oscillations as a function of the digital control of the squeezing drive . The experimental data is shown in Fig. 10 A. The oscillations of the observable occur at a rate where and the approximation is valid for . Using, also, that for the oscillation has a frequency of [18], just like for an ordinary transmon, we obtain in MHz completing the calibration of the drive amplitudes. To be clear, we can rewrite this relation as , where is the average photon number of the coherent states. By extracting the Rabi rate for each voltage of the digital control of and using the previously determined value of , we find as a function of the digital control of . The data is shown in Fig. 10 B and shows a clear linear relationship between the applied voltage for the drive and the average photon number. The slope of the linear fit (together with the previously extracted value of Kerr) determines the proportionality constant between the digital to analog converter in volts and the drive amplitude in MHz as required by the Hamiltonian description.
V.2 Complementary analysis
V.2.1 Exponential decay
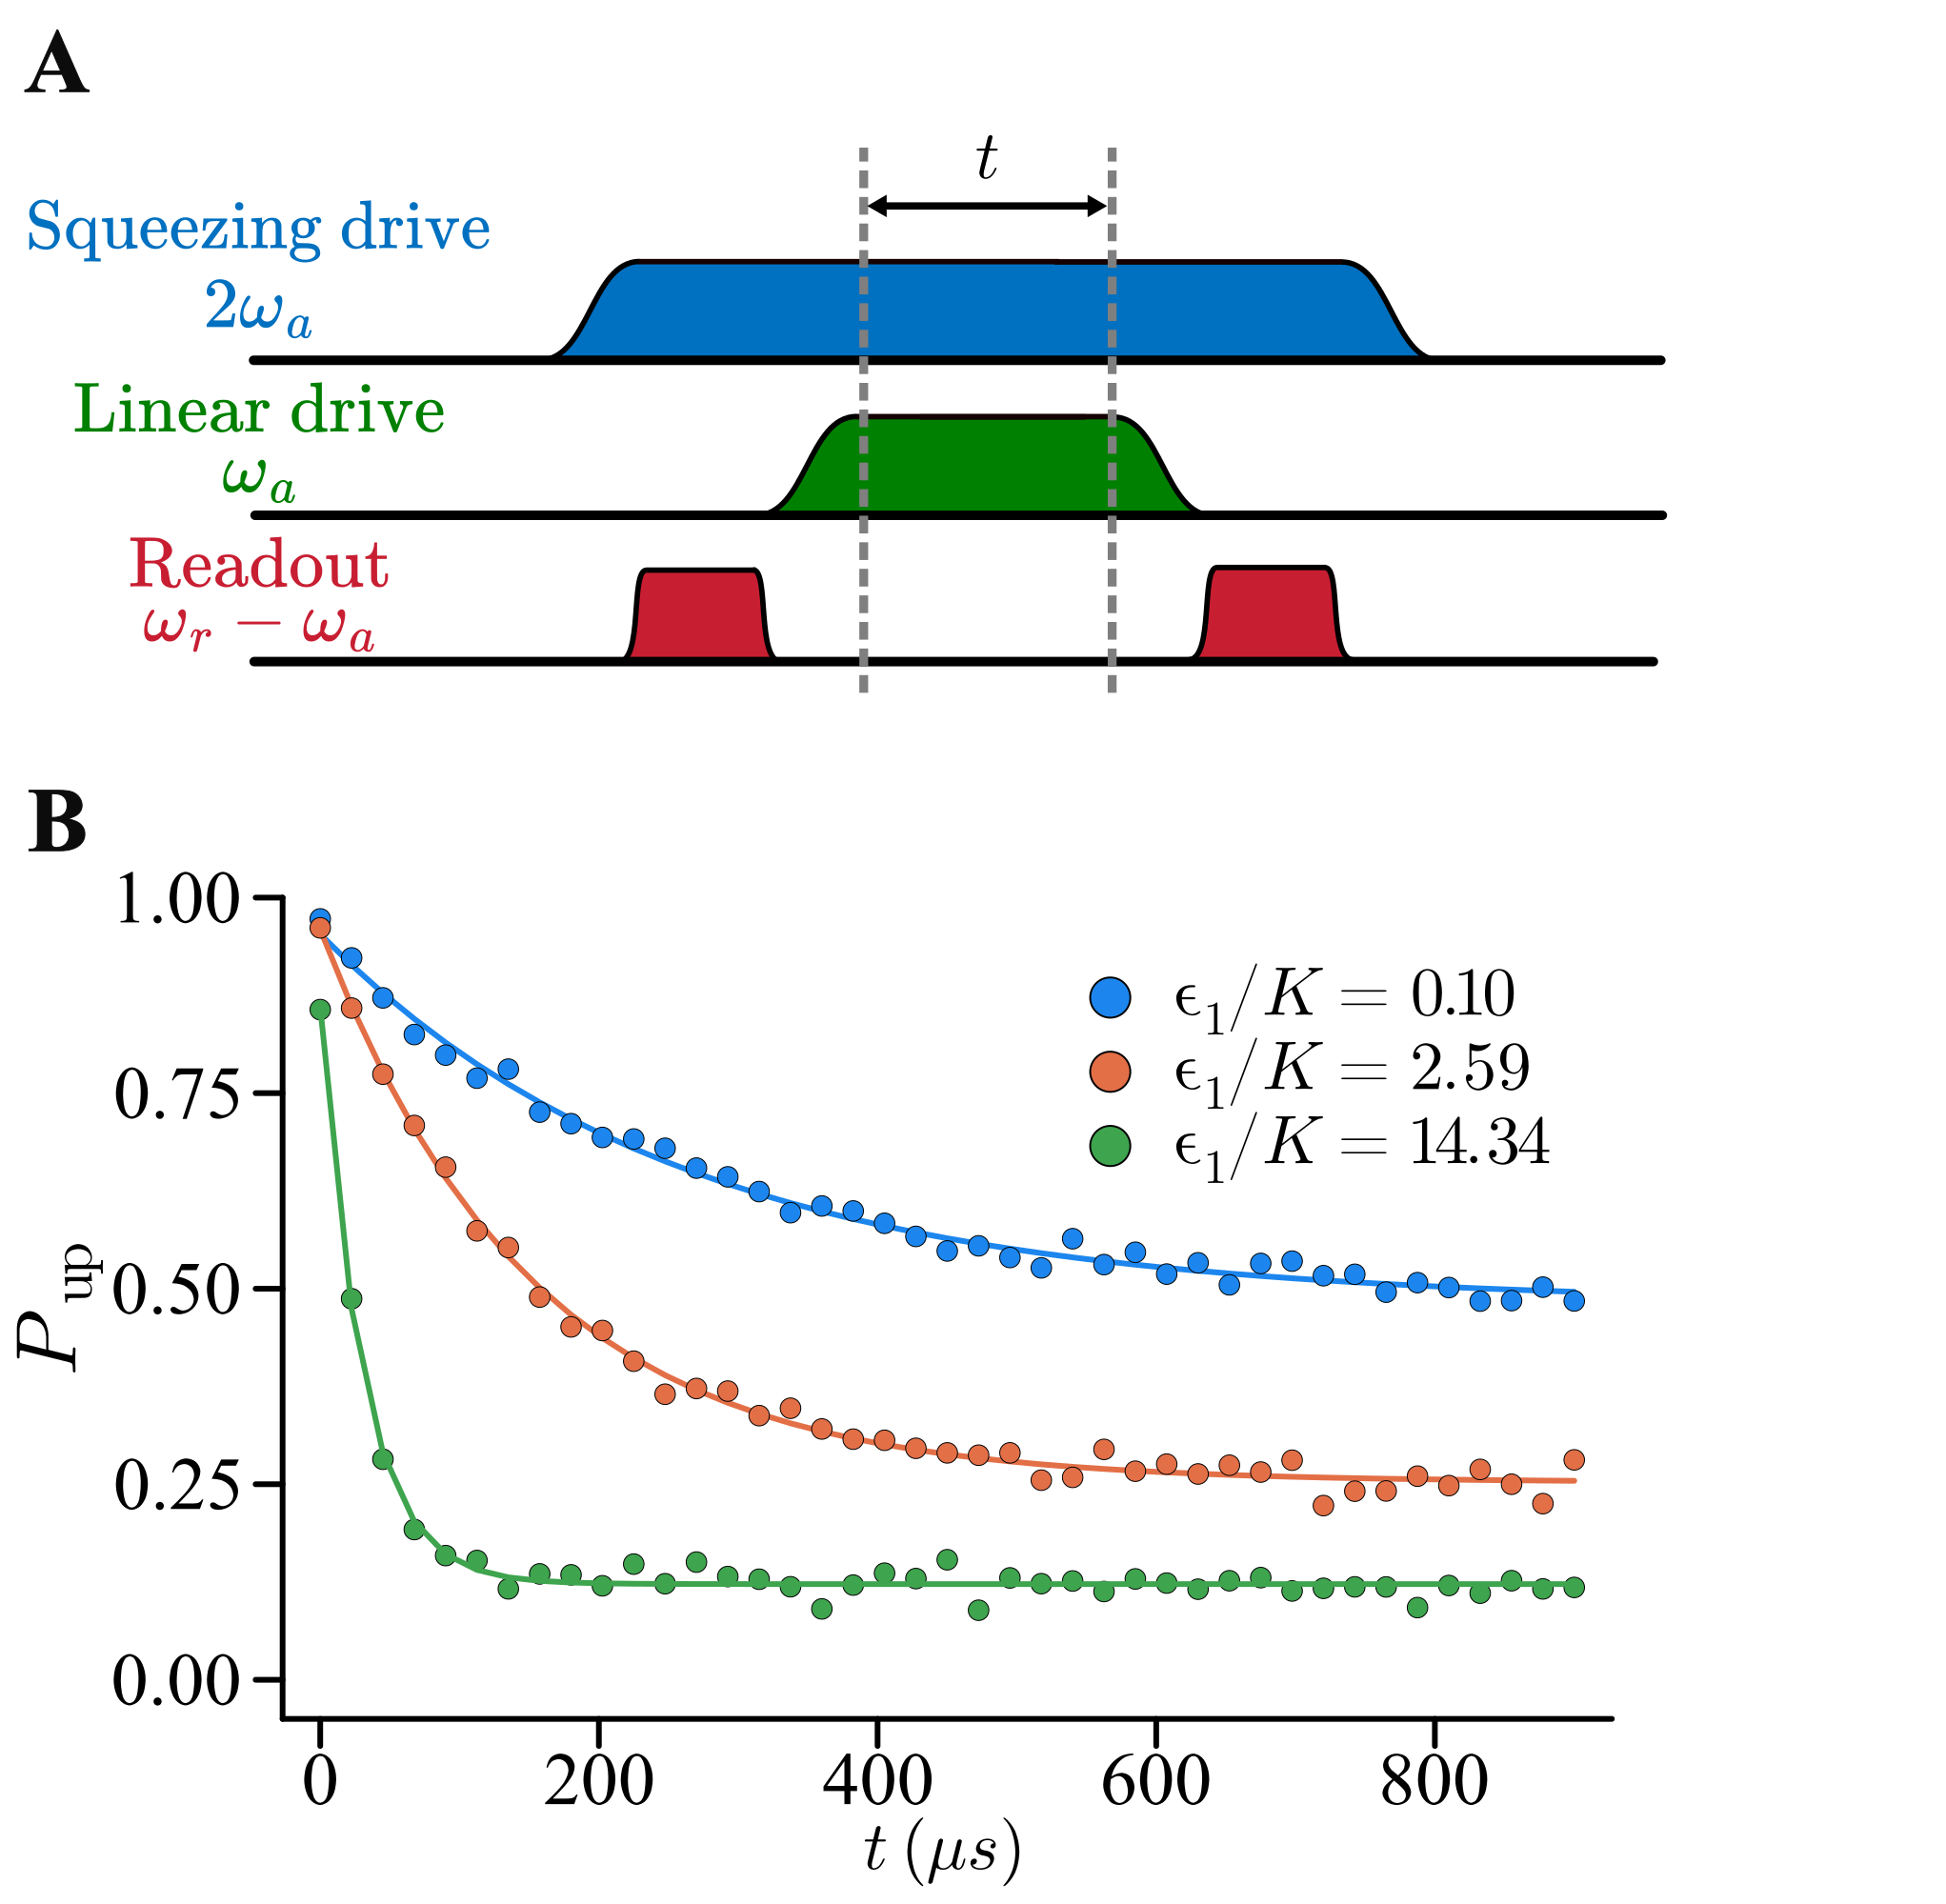
A crucial step in our data processing relies on fitting the activation dynamics with exponential decays. The experimental sequence is shown in Fig. 11 A and three exemplary decay curves for different values of the asymmetry are shown in Fig. 11 B. The data with the corresponding exponential fits is shown in Fig. 3 A. We remark that each of the curves is well described by an exponential decay. Next, we notice that for small asymmetry the steady state population of the shallower well is around 50%. This is because for a symmetric double-well the probability of being in either well is identical by construction, thus leading to equal steady-state populations. On the other hand, with increasing asymmetry, the tunneling rates from one well to the other become asymmetric, leading to a bias towards the deeper well. This is represented in our data, where for increasingly large asymmetries, the steady-state population of the shallower well is reduced.
V.2.2 Steady state population
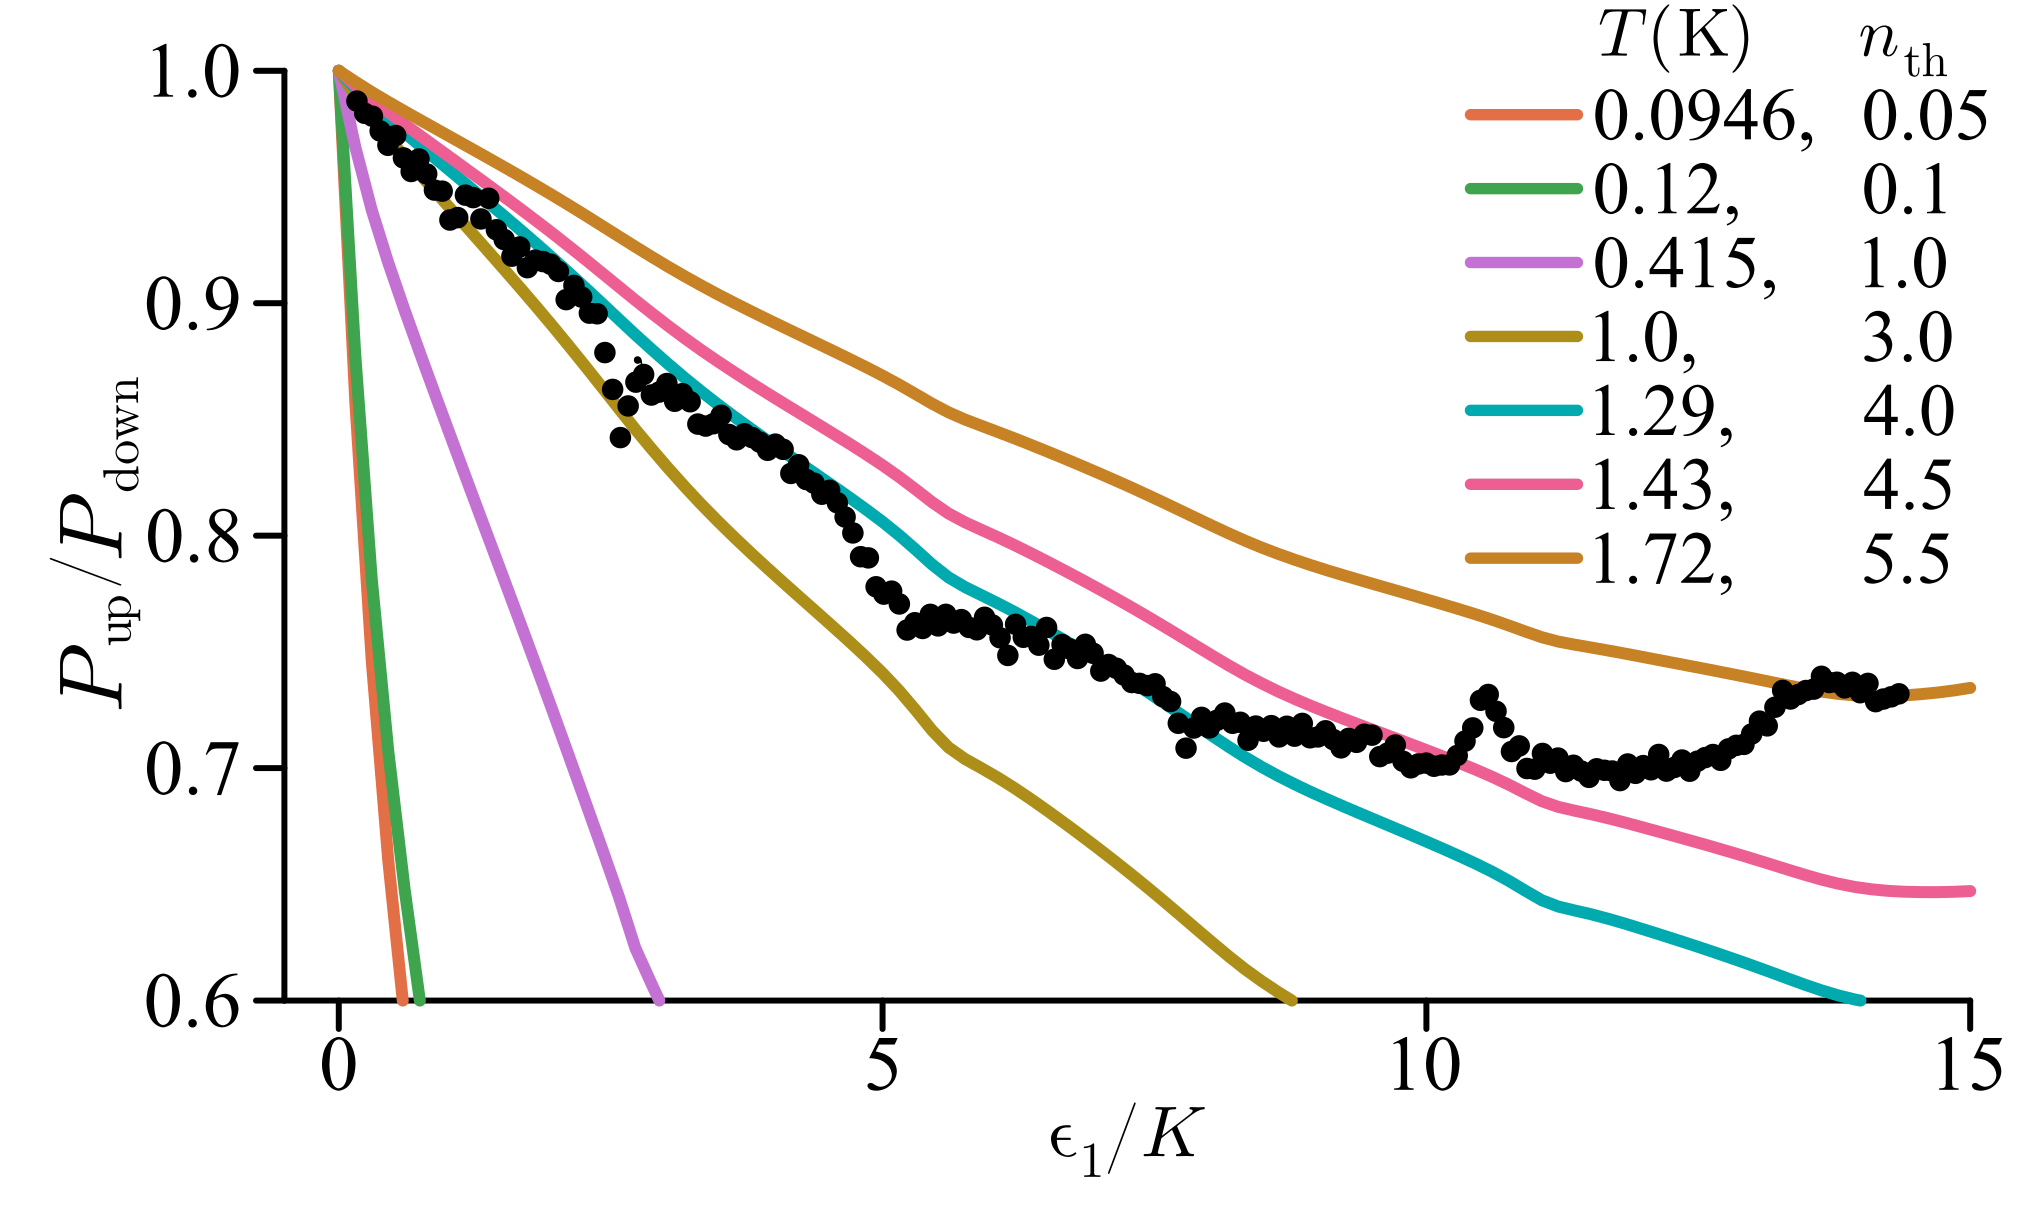
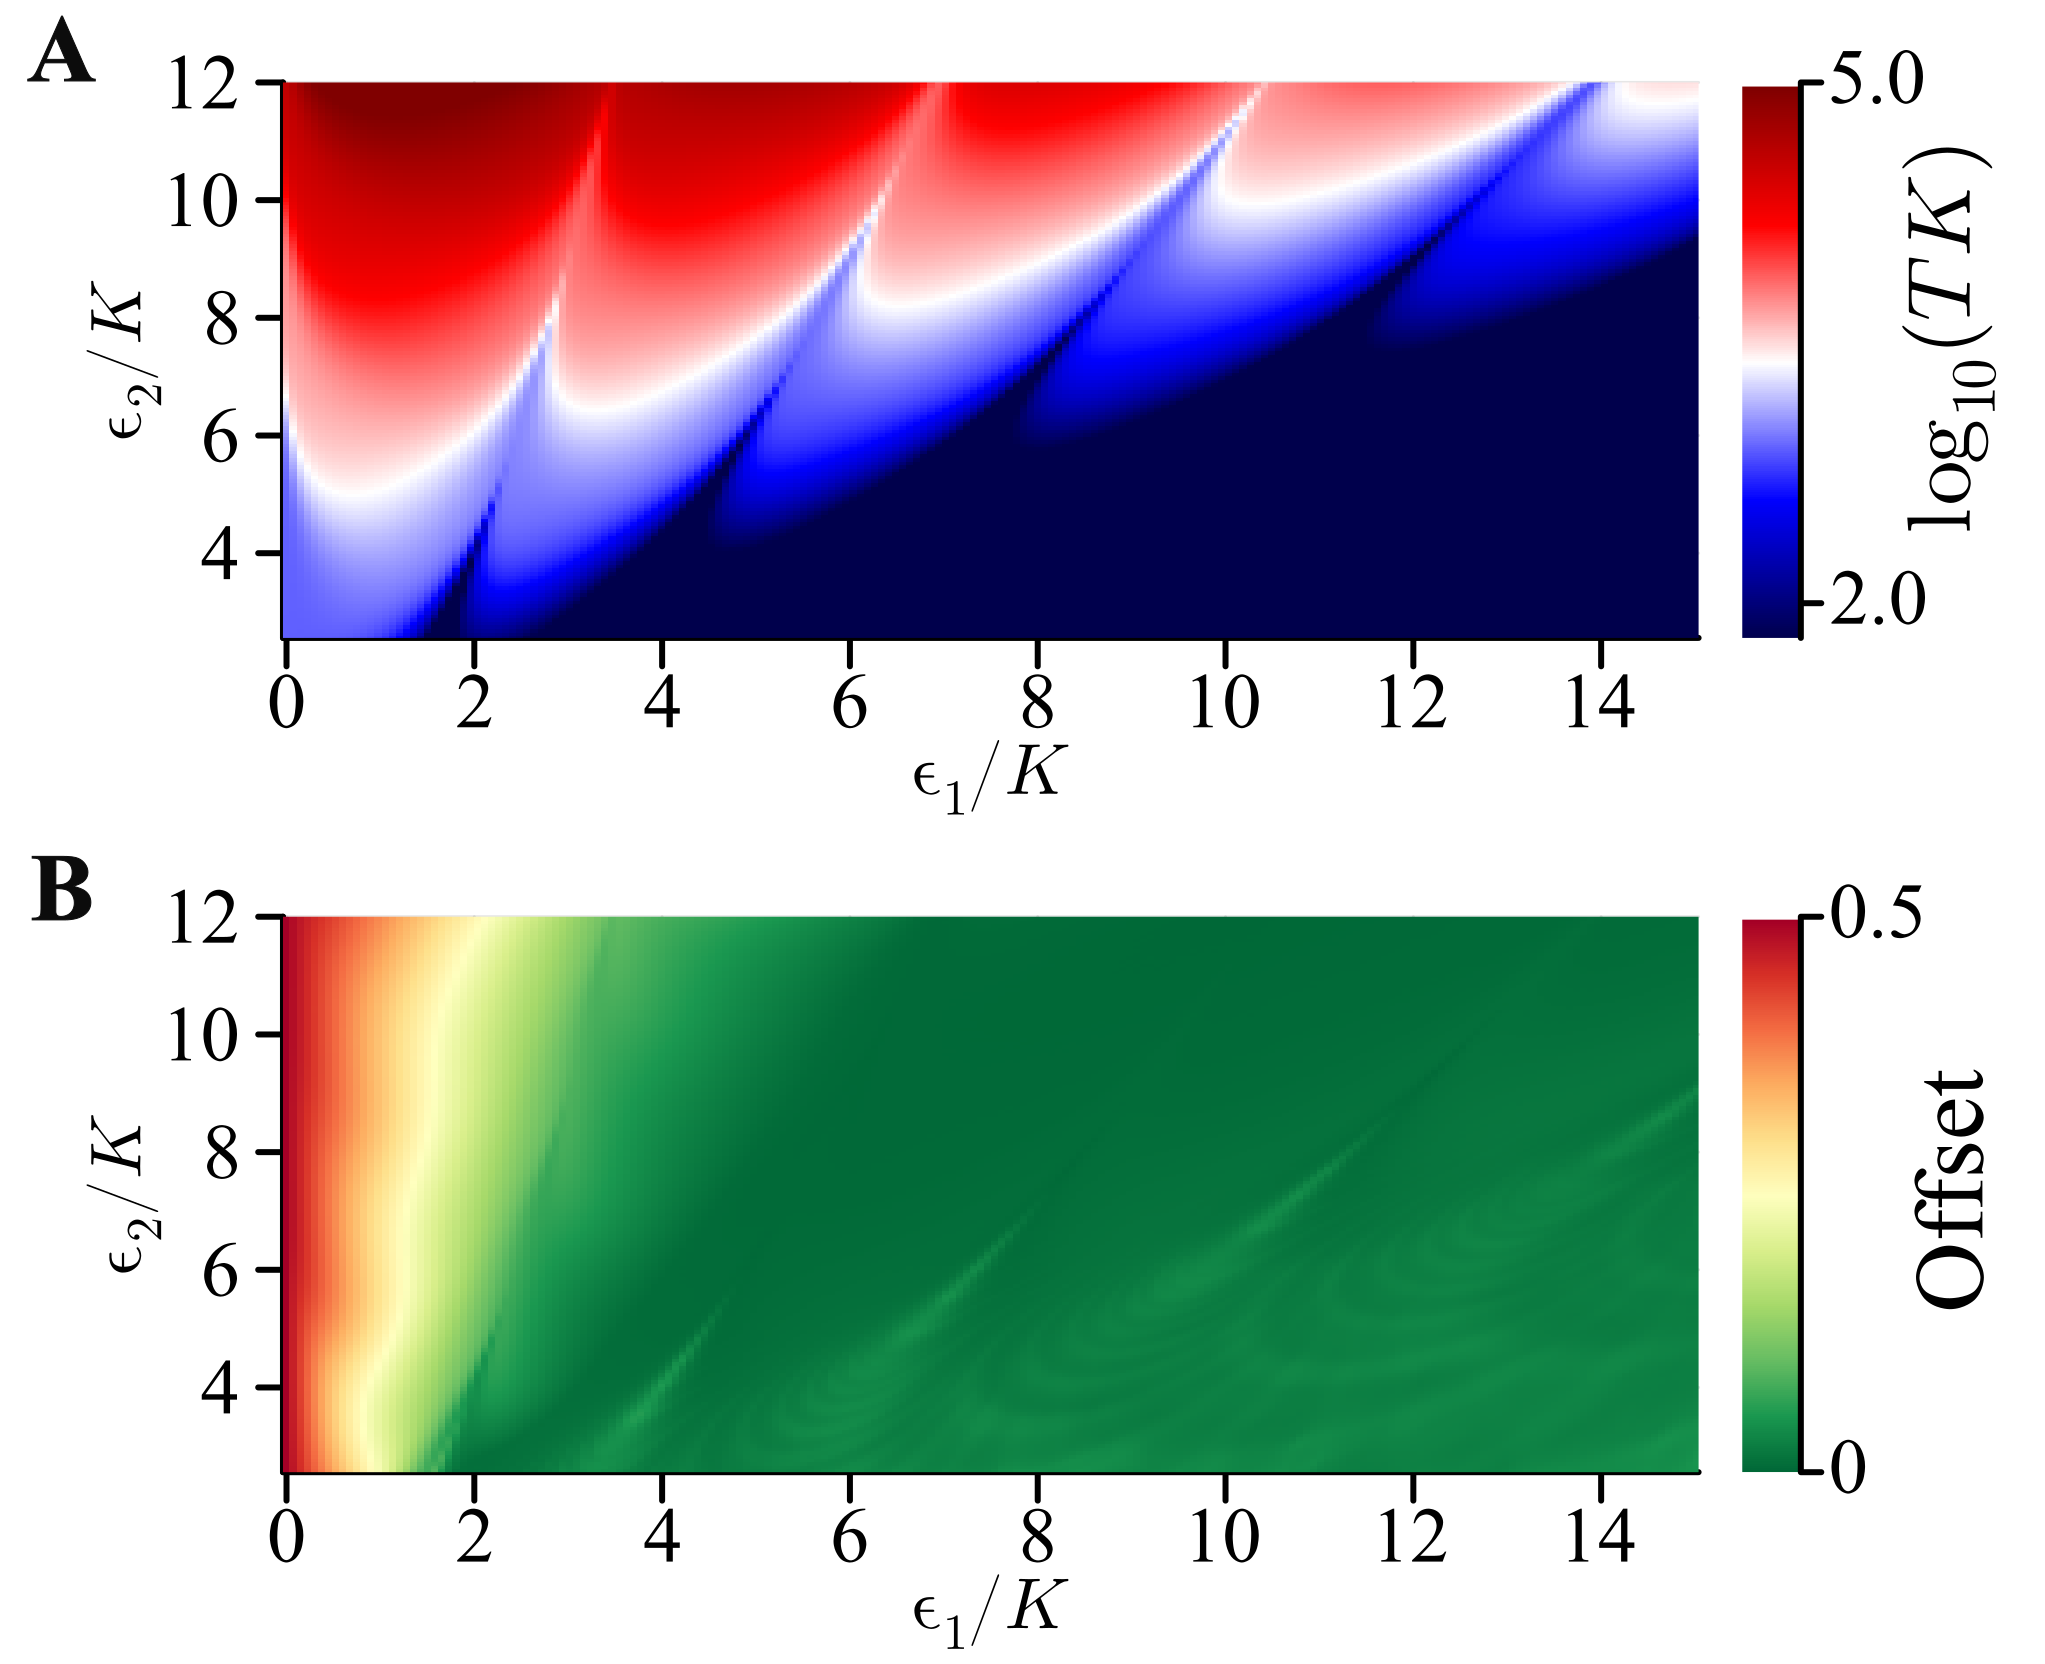
In Fig. 12 we show experimental data of the ratio of upper to lower well populations as a function of asymmetry at . The color lines are full Lindbladian simulations with single-photon dissipation () for different values of . These involve dynamically obtaining the steady state population rate given by the offset by fitting the simulation data to (refer to Fig. 14 B). The Lindbladian steady-state population tends toward zero rapidly as a function of asymmetry, much faster than observed experimentally (compare the experimental data with the theory line). Notably, the base temperature of the dilution refrigerator is approximately 30 mK, indicating again inadequacies in the dissipation modeling.
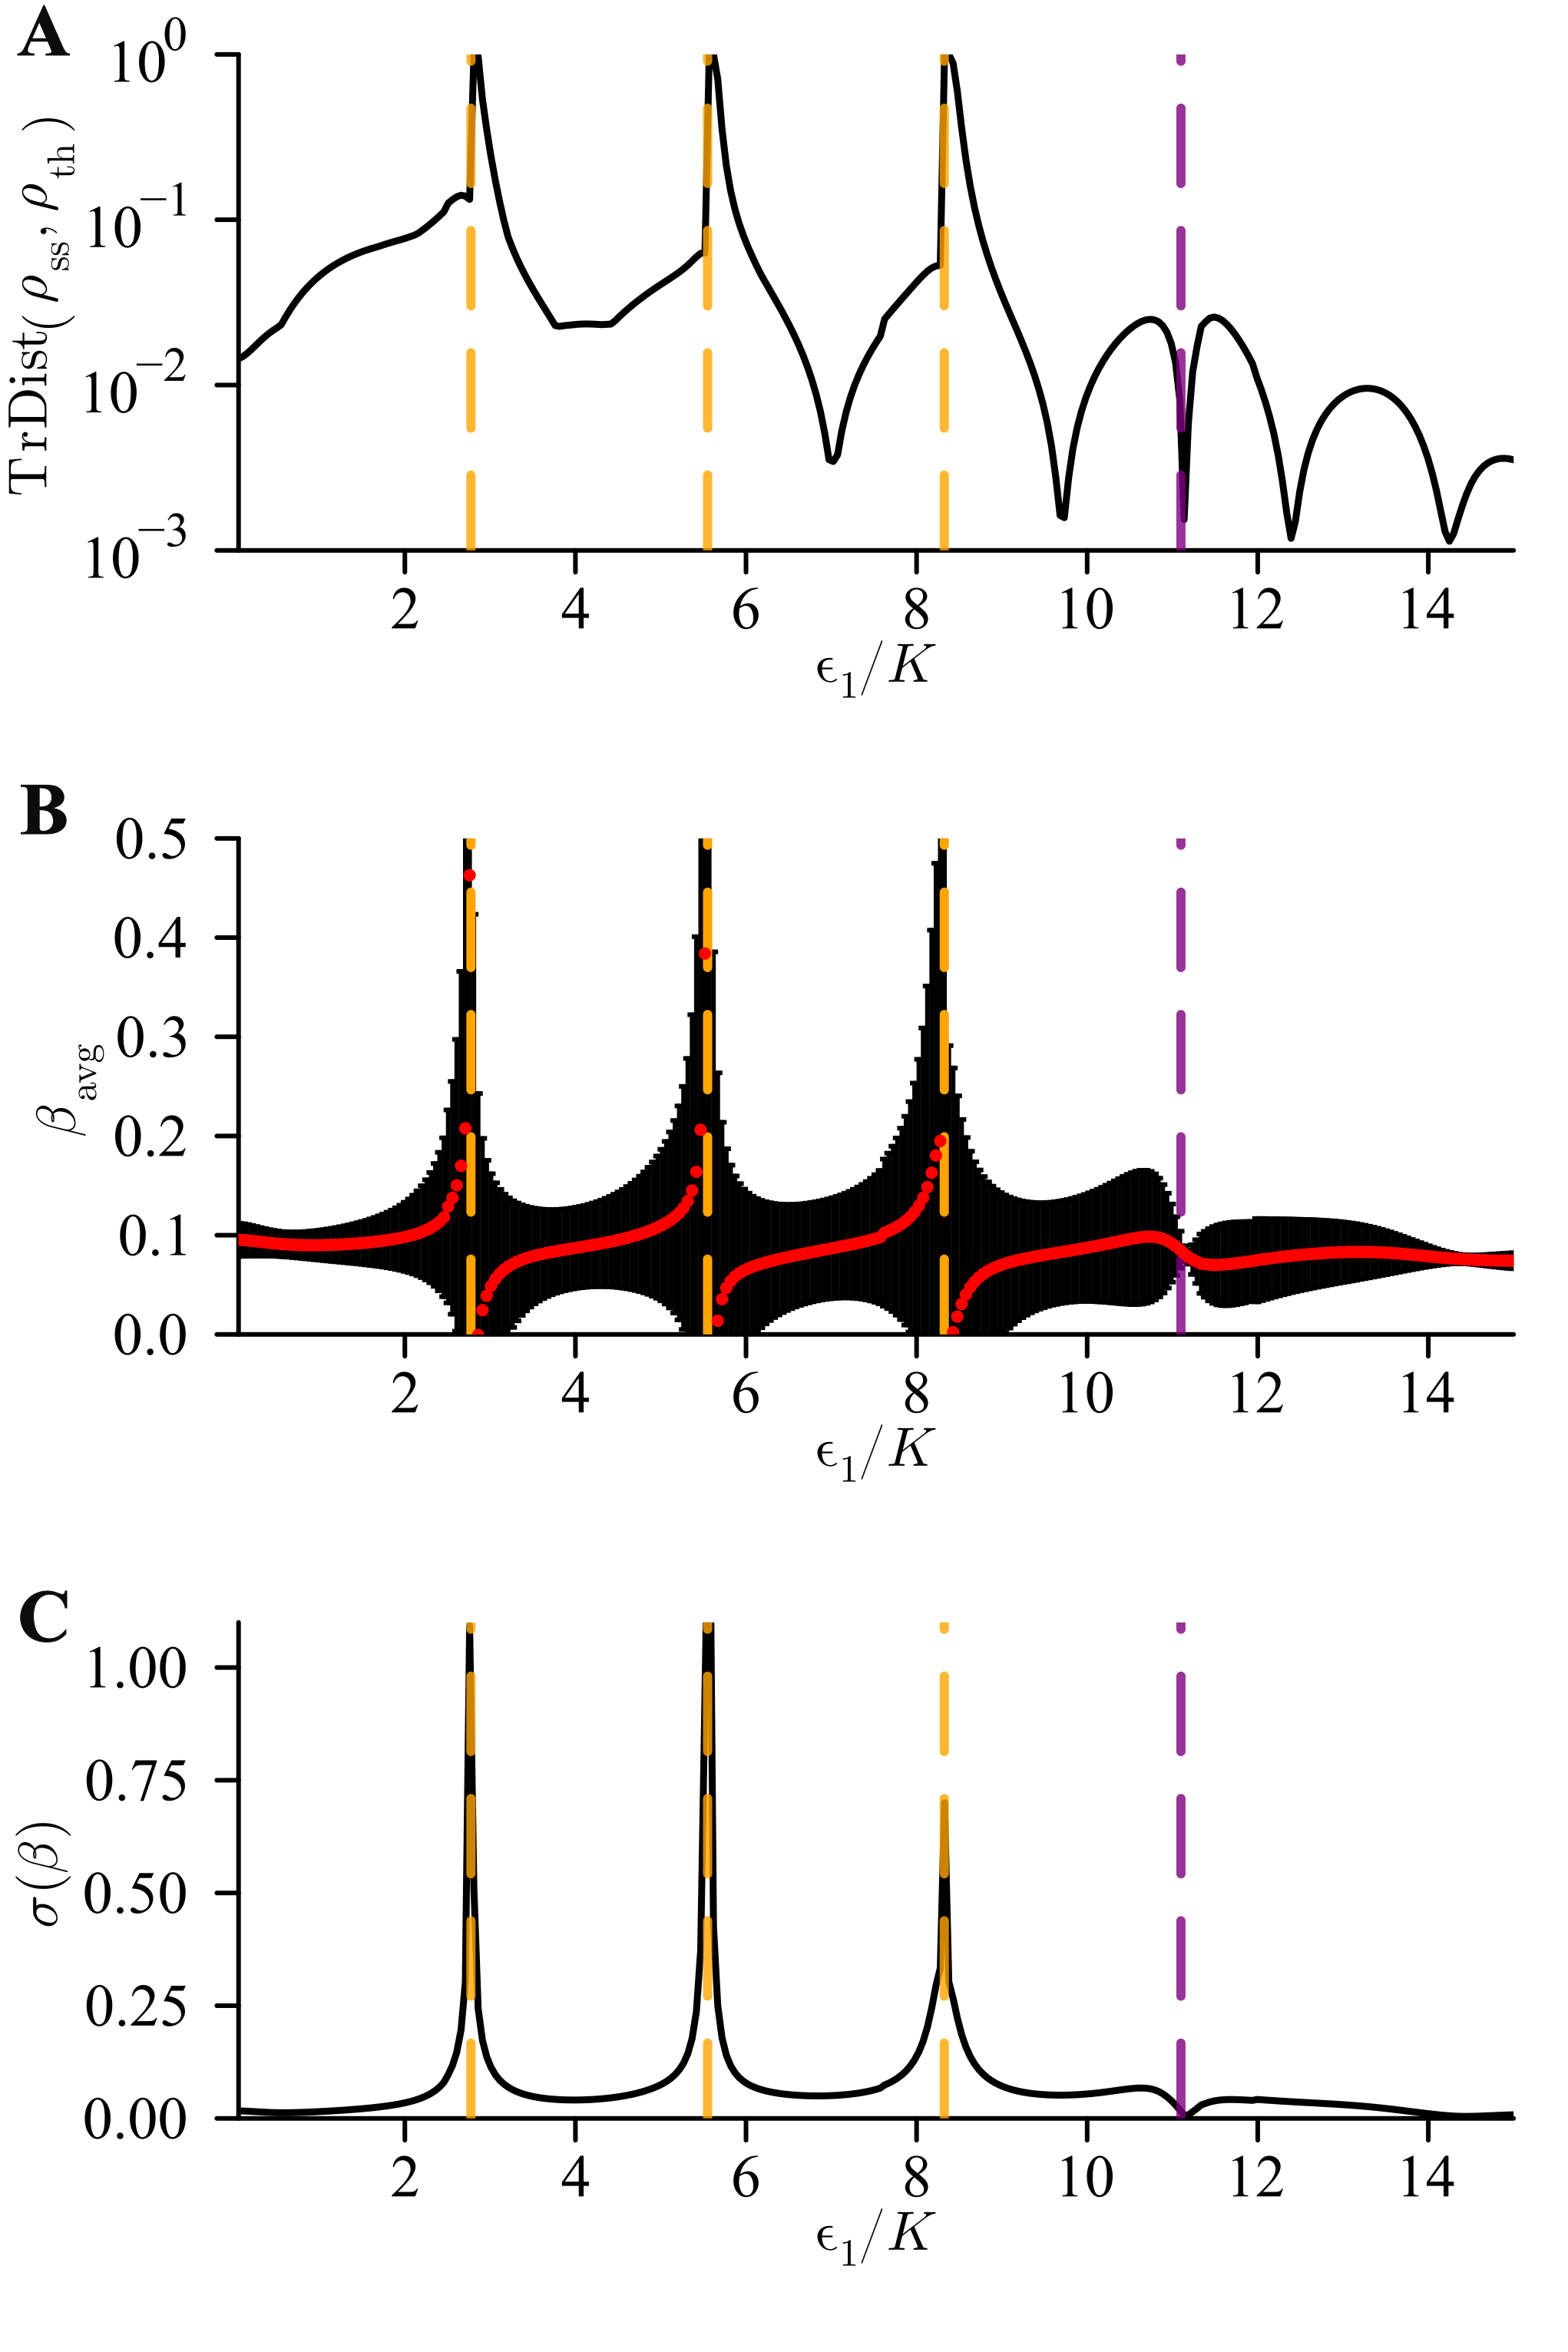
To investigate further the thermal properties of the system, we analysed the Lindbladian steady state in greater detail. To determine how well is described by a Boltzmann thermal state, we computed a collection of values using the detailed balance condition , where are the eigenvalues of with eigenvectors closest to the eigenvectors of . We focused on pairs of neighbouring and values exceeding a small threshold () and examined the distribution of values, as shown in Fig. 13 B and C. Additionally, we calculated the trace distance between and , where is the average of all computed values. This is shown in Fig. 13 A. Overall, we found that the detailed balance condition is not well-satisfied for , especially at the to resonances (indicated by yellow lines), where the standard deviation of values is large, and their average appears to diverge. Notably, however, the condition holds moderately well between resonances and exceptionally well at the resonance, where the trace distance is approximately and the standard deviation is around .
V.2.3 Control experiment for the relative phase dependence of the linear drive
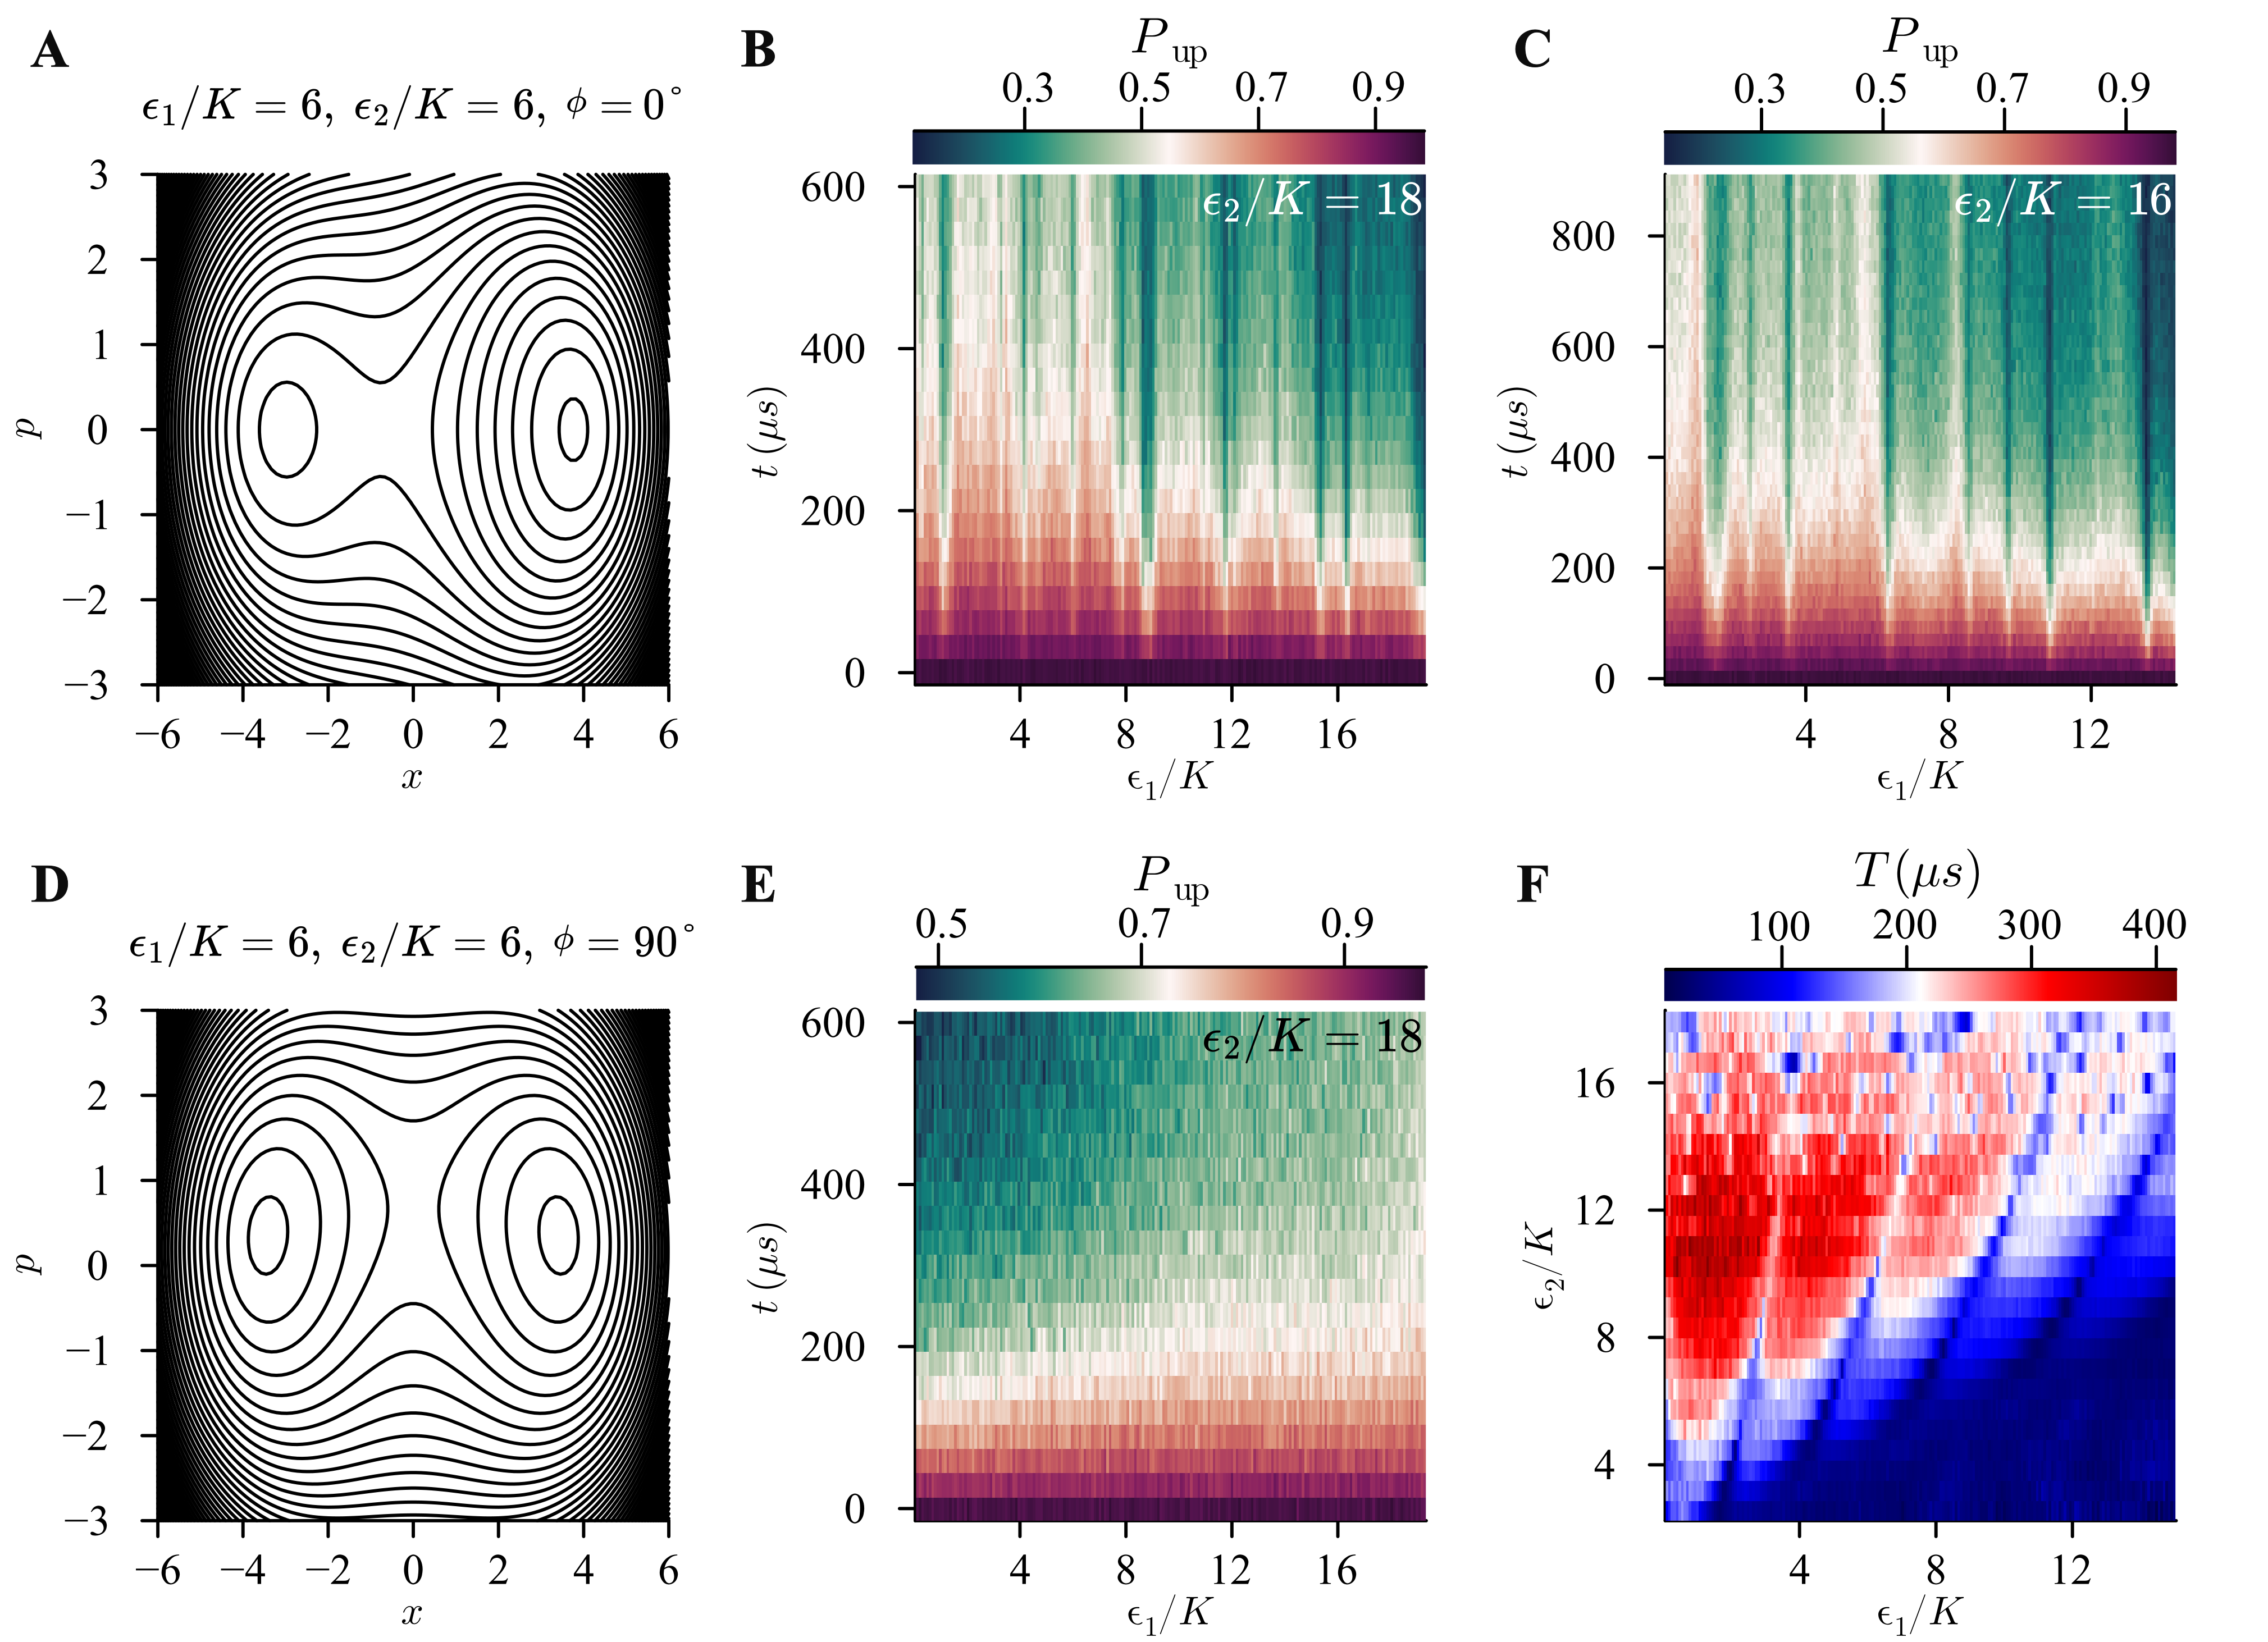
The relative phase between the squeezing drive and linear drive is determined by searching for the phase of maximum Rabi rate, which occurs at . The calibration measurement is shown in Fig. 9 A. This additional degree of freedom allows for several control experiments. To confirm that the resonant features we see are actually caused by the controlled symmetry breaking, and are not for example just power-dependent non-linear resonances [44, 45] or Stark shifting into resonance with spurious modes [46, 47], we repeat the experiment of Fig. 3 A for a symmetric double-well under an equally strong linear drive. To achieve this, we set the linear drive phase . The resulting measurement is shown in Fig. 9 B (see also Fig. 20 E). We note that the resonances are not present here, thereby proving that they are indeed a controlled effect from the symmetry breaking in the parametric oscilator.
As discussed in the Sec. III, we have full control over the Rabi phase (see Fig. 9 A) which controls how the symmetric double-well is perturbed. A phase of applies a drive that lifts the left well (see Fig. 20 A) and a phase of does not break the -symmetry (see Fig. 20 D). If a Rabi phase of is applied, then the definitions of left and right well swap, meaning the right well becomes the shallower well and the left well becomes the deeper well. We can then run the same experiment again as in Fig. 3 A, meaning we initialize the system in the shallower (now right) well and then measure the population of the left well as a function of time and asymmetry. The resulting data (Fig. 9 C) shows the same increase in tunneling rate with larger asymmetry and resonances at specific values. The observation of the same physical phenomena confirms our understanding of the system and validates our explanations of the observed effects.
V.2.4 Adjusted Kerr
Upon close inspection of Fig. 3, a slight deviation between the theoretical location of the resonances and the experimental observations comes to light. This deviation seems to increase with , suggesting there could be a constant scaling factor between the independently calibrated and the actual value. Indeed, allowing for a small rescaling by gives great agreement between theory and experiment, as demonstrated in Fig. 15. While this is not within the calibration uncertainties (Fig. 7), past experiments have shown that the driven Kerr under the squeezing drive can be slightly renormalized compared to the spectroscopic measurement of Kerr [15, 24]. In Fig. 16 B, we show the Kerr adjusted experimental data from Fig. 4 B.
V.2.5 Lifetime along resonances
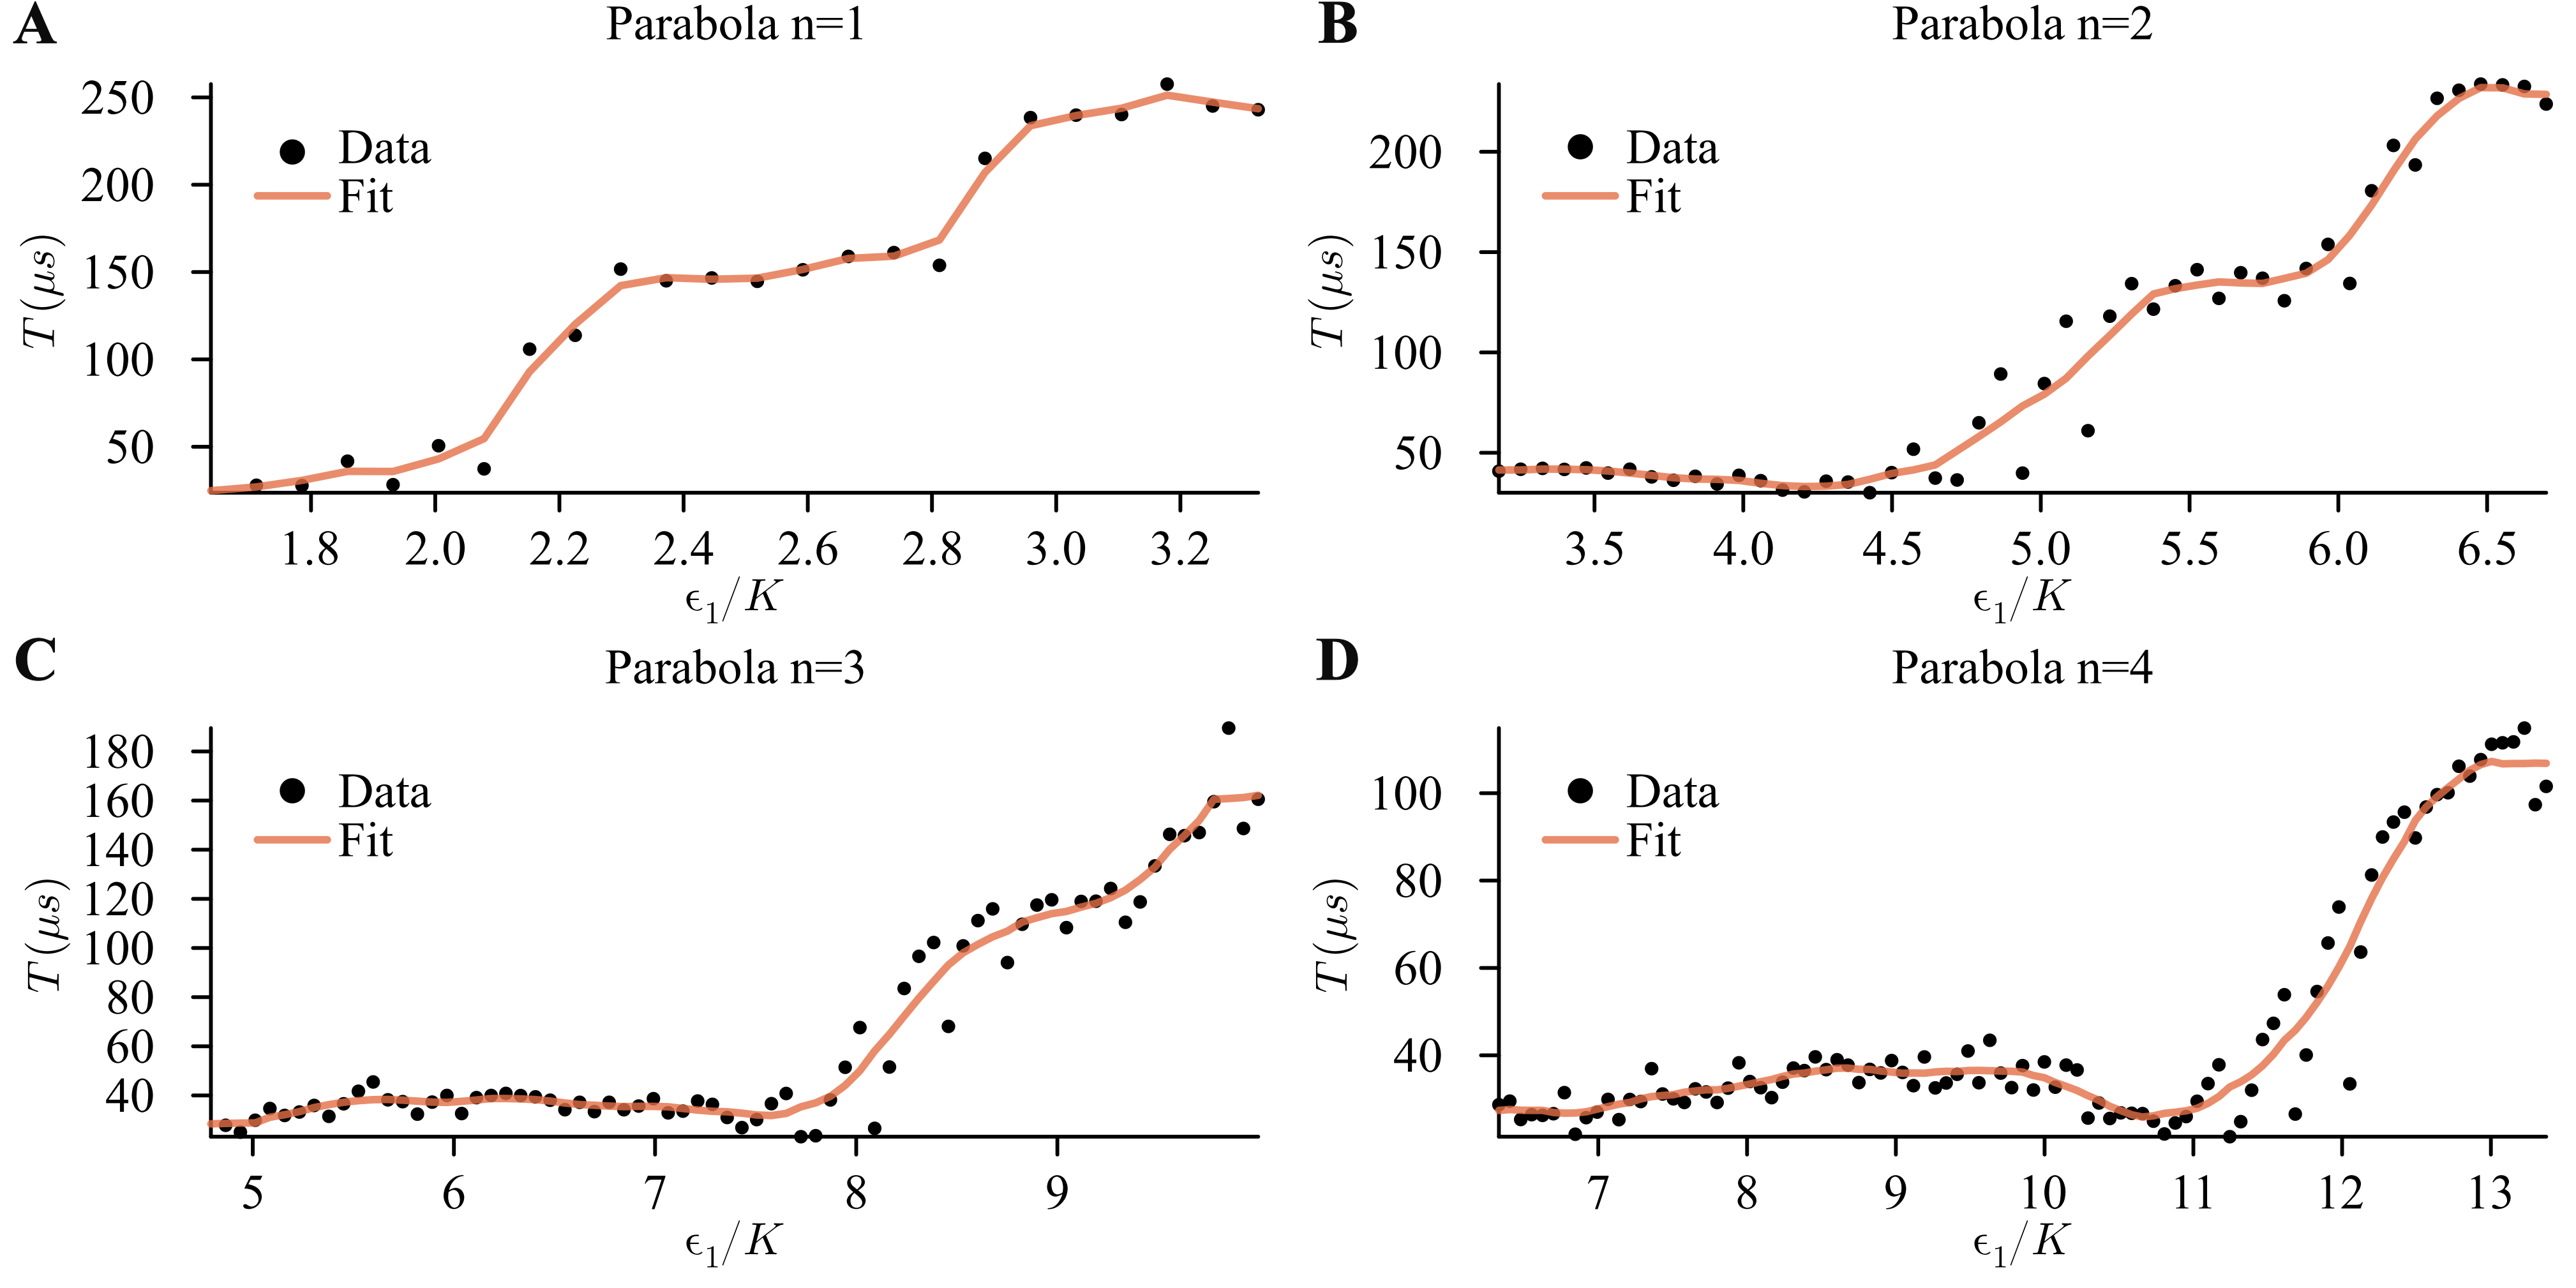
In Fig. 18 we display the lifetime along the first four resonances/parabolas in Fig. 4 B. As per resonance condition Eq. 4, an increase in corresponds to an increase in when following the parabolas. Therefore, we expect the lifetime to increase along the parabolas, which is what we observe in Fig. 18. The step like behaviour is a consequence of activation assisted tunneling close to the separatrix between the wells (see [15]).
Full quantum Hamiltonian treatment
In this section, we show that the physics captured by the semiclassical analysis used to explain the data is identically captured by a full numerical quantum treatment. For this, we introduce the inverse logarithmic anti-cross space (ILAS), denoted by and defined as
| (6) |
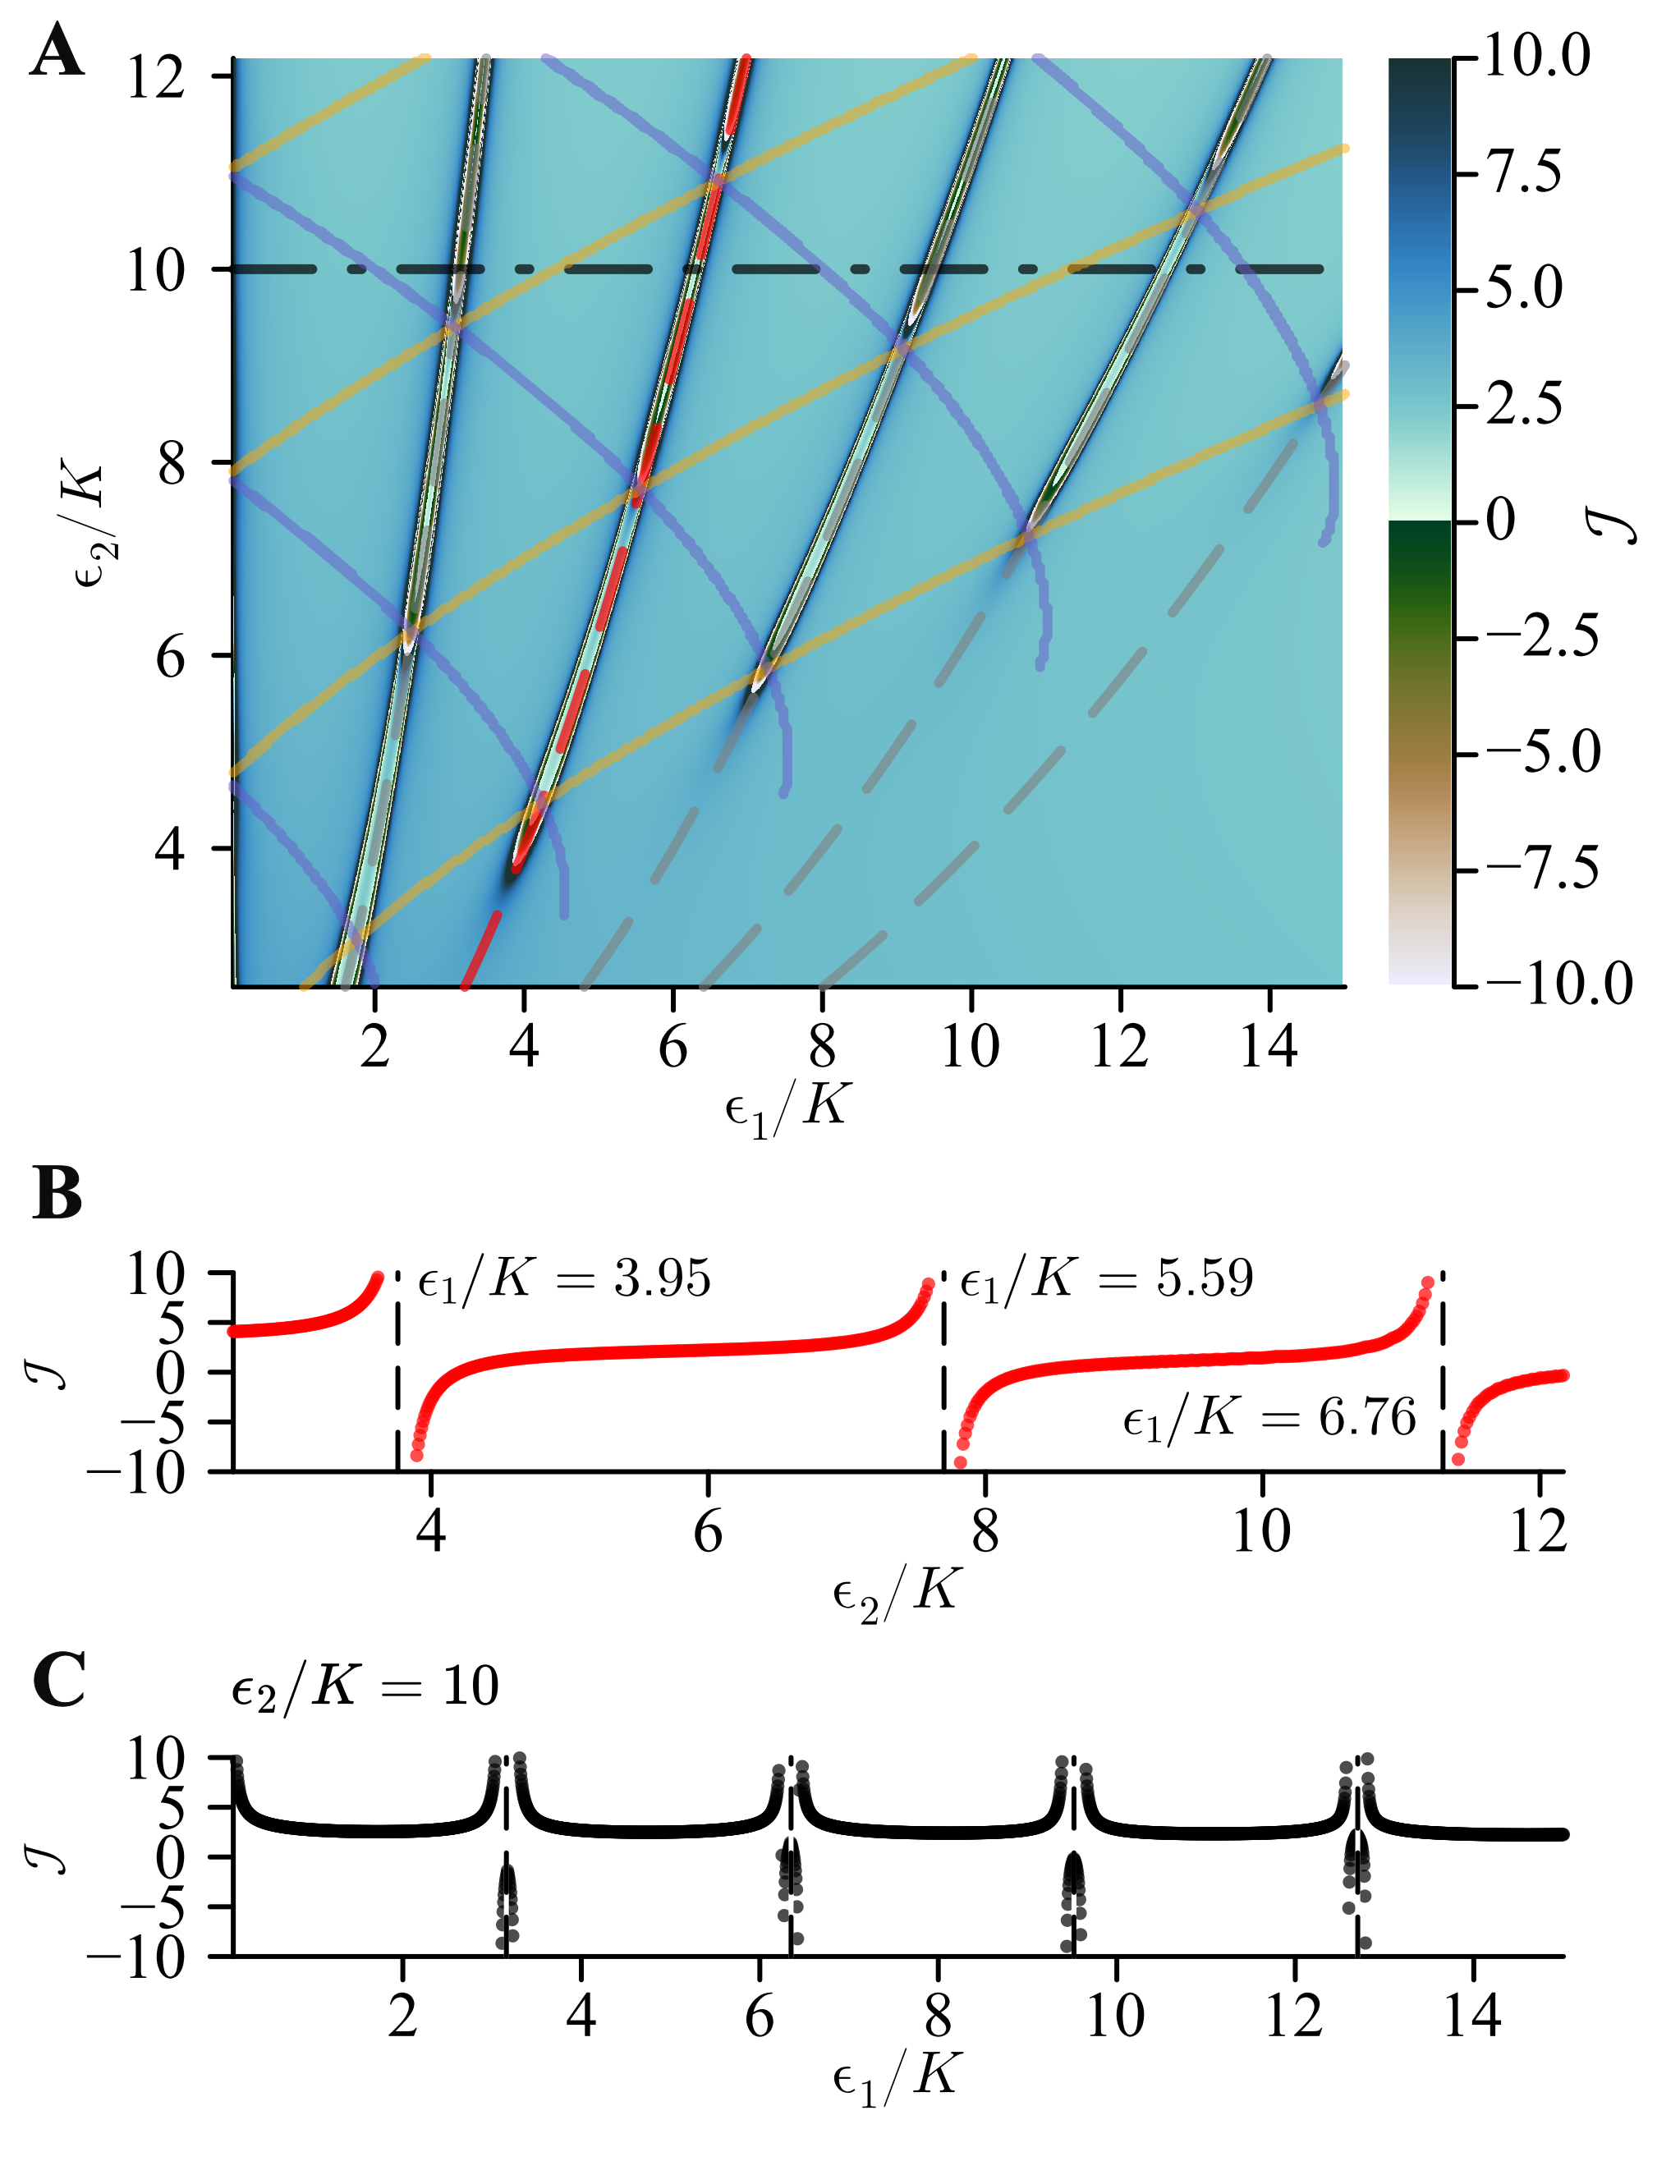
where are the eigenenergies of Eq. 2 at a particular and and is a numerical cutoff. We plotted a colour-map as a function of and , along with two different cuts in Fig. 17.
By construction, diverges when a new pair of levels in are closing. To see this, consider the scenario where the gap between the pair and and the gap between the pair and are closed, and the rest of the levels are not anti-crossing. In this situation, is roughly constant since is zero for the two closed pairs and finite for and the rest of the levels. Consider now that and are interacting, starting to close their gap as in Fig. 2 D. These interacting levels will close fast and at some point have an energy difference where will diverge. Also, this approach to happens differently depending on how one approaches the resonance in parameter space, approaching from the left or from the right in makes abruptly change sign near a new anti-crossing. Observe the close agreement between the semiclassical treatment, the resonance condition Eq. 4, and .
V.3 Effects beyond the RWA model
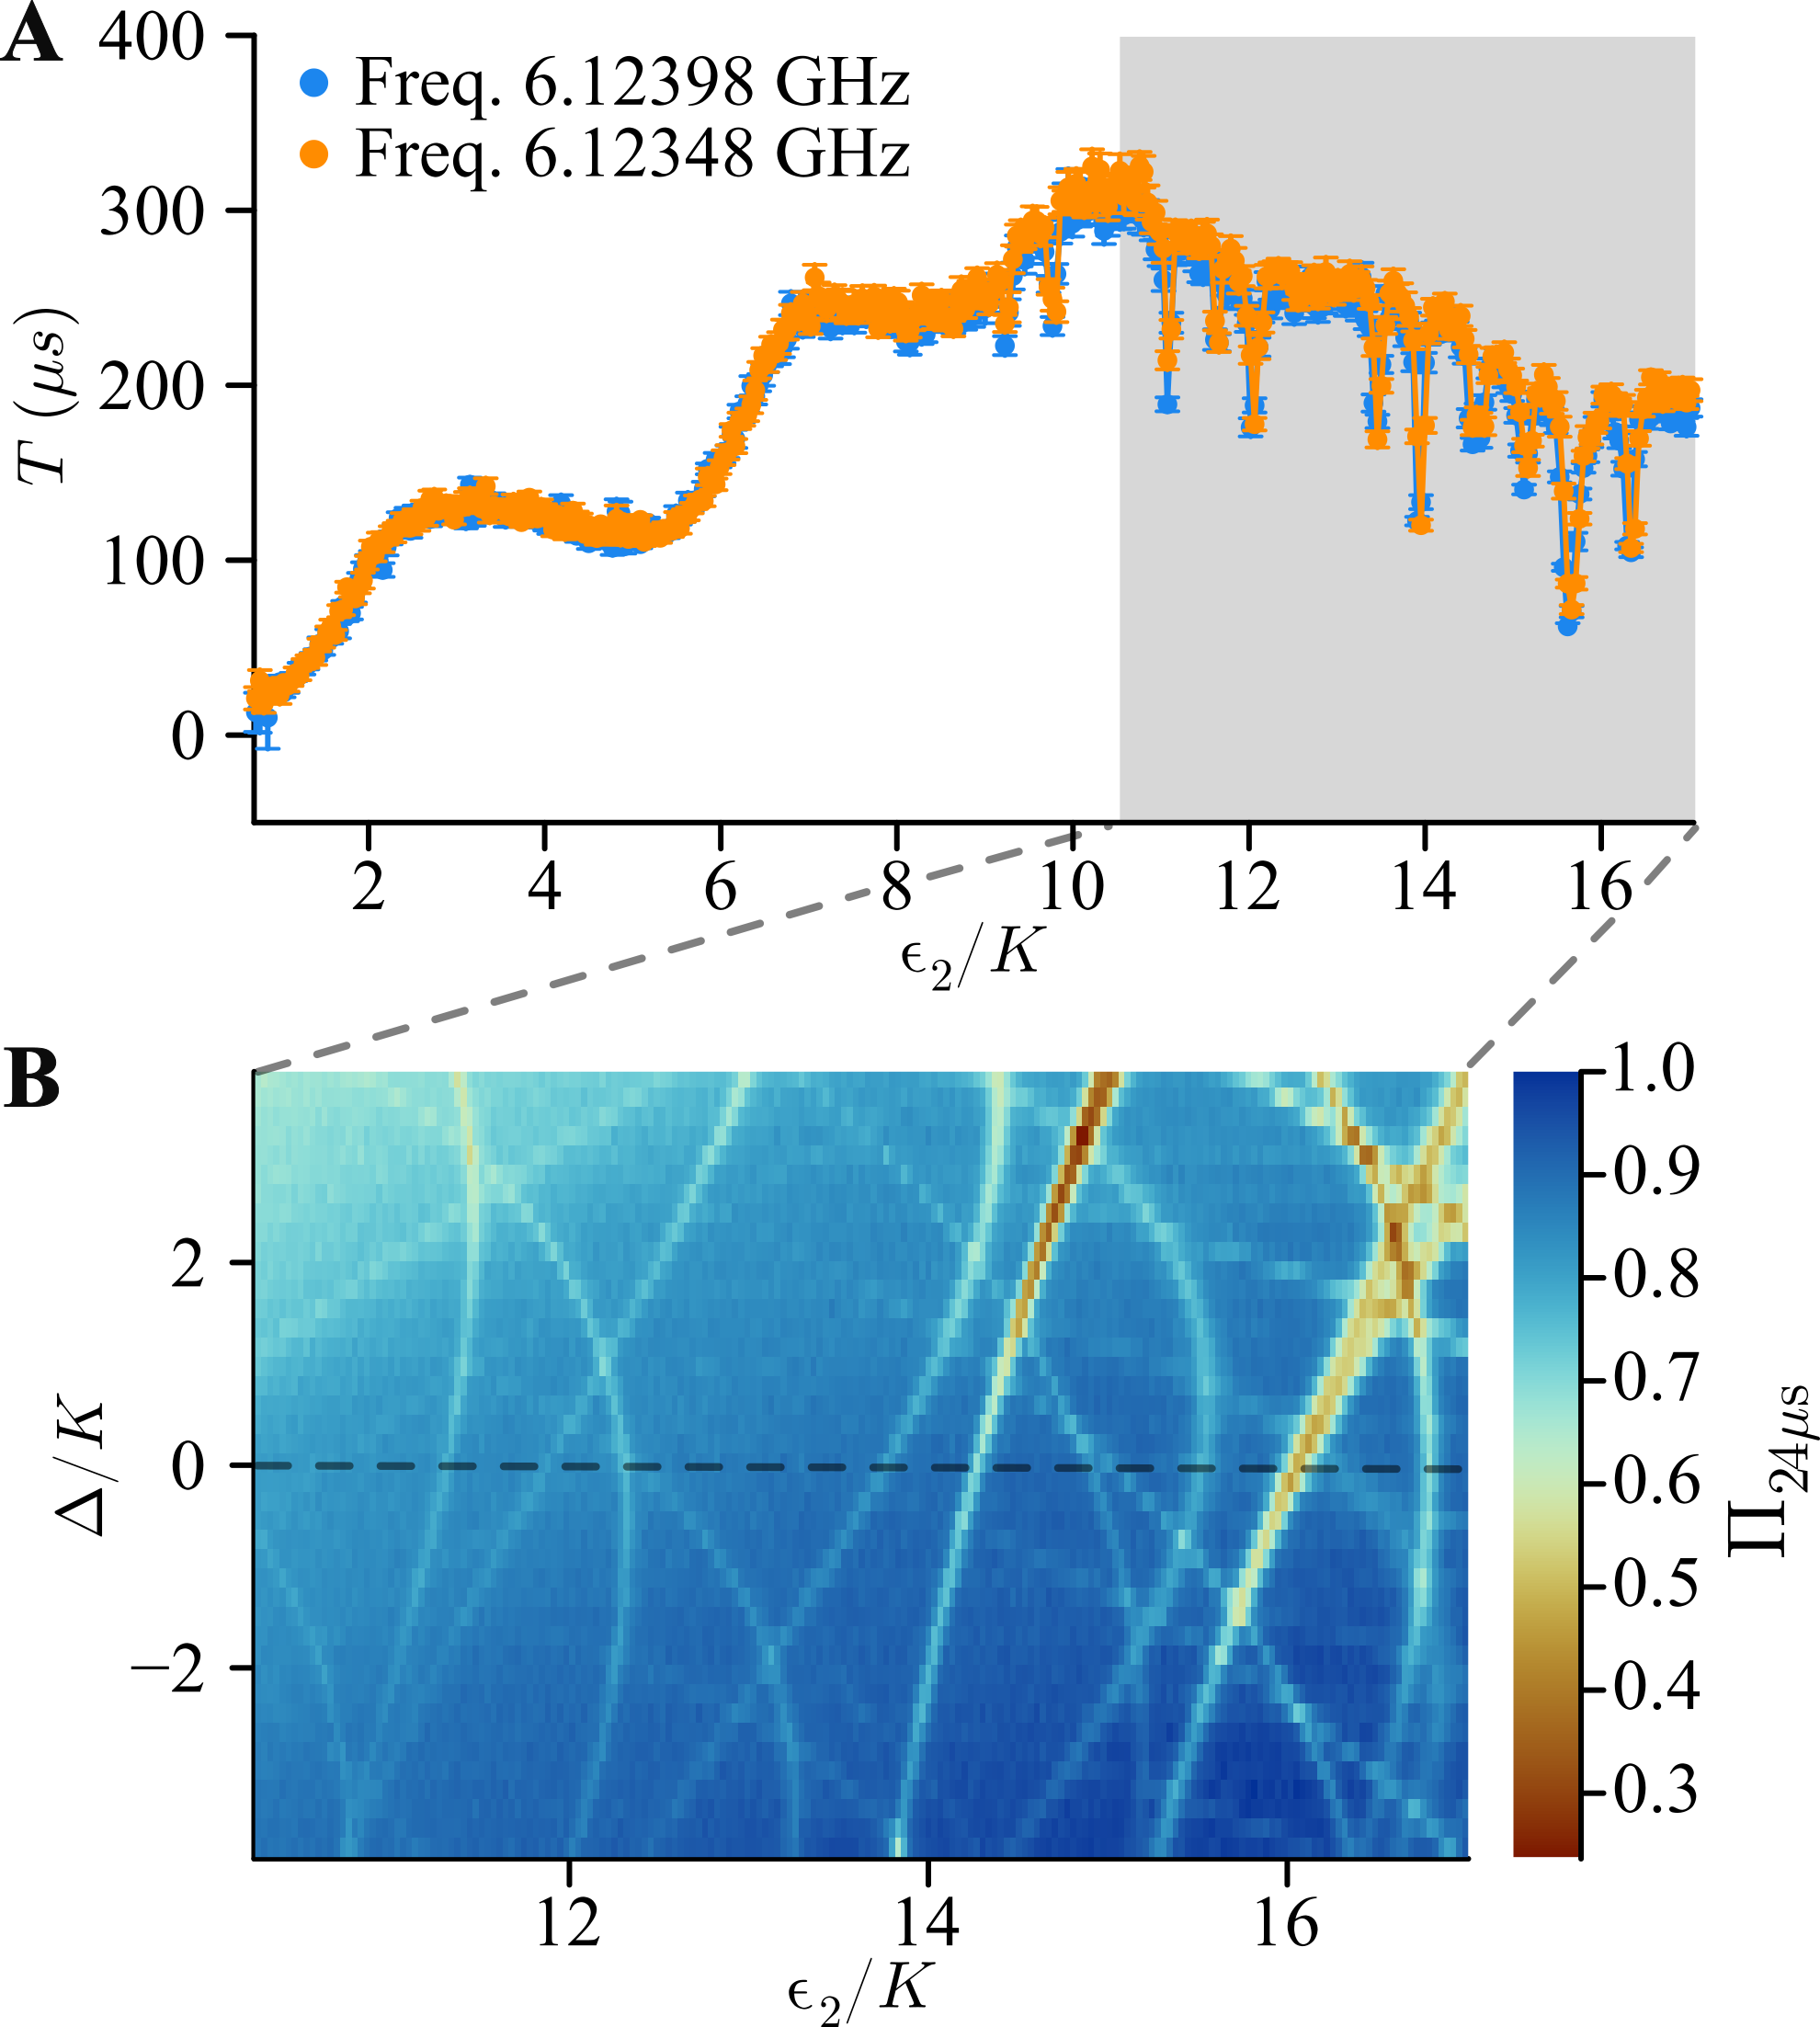
In this section, we present novel experimental data taken for where the static effective description used fails, qualitatively, to describe experiment. In Fig. 19 A, we present the coherent state lifetime up to , for . The lifetime increases in a step-like fashion, as predicted by the static effective model [29, 28] until it starts decreasing. This decrease may be captured by a more elaborated static effective treatment [30]. However, resonant-like drops of the lifetime appear too, which challenge the static effective treatment, even if they can also be captured in principle [44]. Time-dependent Floquet simulation of the driven system (not shown, see [21]) suggest that these resonances may be contained within a single-mode treatment of the nonlinear transmon oscillator. Note that, since these experiments were conducted with , these resonances are of a different yet similar nature from the ones presented in the main text. Below, we present and discuss control experiments supporting the viewpoint that these effects belong to the nonlinear physics of single-mode driven systems.
As a control experiment to learn more about these resonances, we measure their temporal stability by repeating the same measurement again after 24h (see orange and blue graphs in Fig. 19 A). This provides important information since the parameters of spurious two-level-systems (TLS) [48, 49, 50] coupled to transmons are known to fluctuate in time, and TLS are a plausible candidate for this resonant-like lifetime drops at strong drives. We re-calibrated the qubit frequency and observed good agreement between the two measurements, with the resonances being located at the same positions. This data suggests that the resonances are stable in time and are therefore likely associated to stable electromagnetic transitions and not fluctuating TLSs.
To learn more, we study these resonances as a function of the detuning between the squeezing drive and the resonance frequency of the SNAIL transmon. The system is initialized in one well and after 24 µs the remaining population is measured. This is a proxy for the coherent states lifetime and thus resonances show up through low remaining population. Fig. 19 B depicts this lifetime proxy as function of detuning and photon number. This data contains resonances moving in different directions. Other features can be seen, for example, around and : here two resonances cross (i.e., no avoided crossing), which could provides a bound to the possible coupling between the involved modes. Lastly, we point out a feature around and , where one of the resonances seems to split up into two.
Moving beyond the case of , we now study the impact of an additional drive on the resonances. In Fig. 20 A, we show the equienergy contours of the effective Hamiltonian for and , which creates an asymmetry between the two wells (see also Fig. 2 C). This picture is valid under the RWA, and we have observed its conspicuous failure for . In Fig. 20 B, for we observe a “forest” of resonances, very different from the case of smaller (see Fig. 3). These resonances are not explained by resonant tunneling in the RWA potential and described by Eq. 4, but are instead reminiscent to the onset of chaotic behavior [51, 21]. Changing the photon number (see Fig. 20 C) leads to a change in the forest of resonances. Similar resonances have been observed during readout of transmon qubits. Here a possible explanation is that the AC Stark shift, induced by the strong readout drive, tunes the qubit into resonance with lossy modes like TLS [47, 52, 46]. To test this hypothesis, we change the phase of our strong linear drive. For , the RWA double-well stays symmetric (Fig. 20 D). In Fig. 20 E, we show the same measurement as in Fig. 20 B, (same value of ), but with a different relative phase between the drives. The absence of resonances in Fig. 20 E suggests that the effect is beyond a Stark shift into lossy modes. This phase dependence of the spurious resonances has not been observed before. Finally, Fig. 20 F shows an extended data set (compare to Fig. 4), where the breakdown of the RWA description is self-evident for .
While this spurious resonances have not been reported before, the large discrepancy in between static-effective open quantum system description of our strongly driven nonlinear system and experimental observations is common to all parametric oscillator experiments in the quantum regime reported in the literature [18, 15, 24, 53, 25, 26, 54, 26], etc. We believe this discrepancy runs deep into our understanding of quantum physics [31] and is intimately related to the problem of the quantum to classical transition and quantum chaos [51]. We also believe it can be avoided once it is understood, by means as simple as filtering the lines at the relevant frequencies, for example.
Our data set, presenting resonances at different locations in parameter space and of different widths, as well as their dependence on the parametric drive frequency, the parametric drive amplitude, the linear drive amplitude, the relative phase between the linear drive and the parametric drive, and their stability over a period of 24 hs, will guide research and lead to better theoretical tools to understand and design parametric processes. We also expect that this data will unlock new tools and proposals to study nonlinear driven quantum systems and quantum chaos in unexplored regimes [55, 56, 57].
References
- Choi et al. [2020] J. Choi, H. Zhou, H. S. Knowles, R. Landig, S. Choi, and M. D. Lukin, Robust Dynamic Hamiltonian Engineering of Many-Body Spin Systems, Physical Review X 10, 031002 (2020), publisher: American Physical Society.
- Sun et al. [2024] J. Sun, L. Cheng, and W. Li, Toward Chemical Accuracy with Shallow Quantum Circuits: A Clifford-Based Hamiltonian Engineering Approach, Journal of Chemical Theory and Computation 20, 695 (2024), publisher: American Chemical Society.
- Lyu et al. [2023] N. Lyu, A. Miano, I. Tsioutsios, R. G. Cortiñas, K. Jung, Y. Wang, Z. Hu, E. Geva, S. Kais, and V. S. Batista, Mapping Molecular Hamiltonians into Hamiltonians of Modular cQED Processors, Journal of Chemical Theory and Computation 19, 6564 (2023), publisher: American Chemical Society.
- Guo and Peano [2024] L. Guo and V. Peano, Engineering Arbitrary Hamiltonians in Phase Space, Physical Review Letters 132, 023602 (2024), publisher: American Physical Society.
- Schlawin et al. [2021] F. Schlawin, M. Gessner, A. Buchleitner, T. Schätz, and S. S. Skourtis, Continuously Parametrized Quantum Simulation of Molecular Electron-Transfer Reactions, PRX Quantum 2, 010314 (2021).
- Anderson et al. [1972] P. w. Anderson, B. I. Halperin, and c. M. Varma, Anomalous low-temperature thermal properties of glasses and spin glasses, The Philosophical Magazine: A Journal of Theoretical Experimental and Applied Physics 25, 1 (1972), publisher: Taylor & Francis _eprint: https://doi.org/10.1080/14786437208229210.
- Phillips [1972] W. A. Phillips, Tunneling states in amorphous solids, Journal of Low Temperature Physics 7, 351 (1972).
- Merzbacher [2002] E. Merzbacher, The Early History of Quantum Tunneling, Physics Today 55, 44 (2002).
- Hund [1927] F. Hund, Zur Deutung der Molekelspektren. I, Zeitschrift für Physik 40, 742 (1927).
- Bellonzi et al. [2024] N. Bellonzi, A. Kunitsa, J. T. Cantin, J. A. Campos-Gonzalez-Angulo, M. D. Radin, Y. Zhou, P. D. Johnson, L. A. Martínez-Martínez, M. R. Jangrouei, A. S. Brahmachari, L. Wang, S. Patel, M. Kodrycka, I. Loaiza, R. A. Lang, A. Aspuru-Guzik, A. F. Izmaylov, J. R. Fontalvo, and Y. Cao, Feasibility of accelerating homogeneous catalyst discovery with fault-tolerant quantum computers (2024), arXiv:2406.06335 [quant-ph].
- Simm and Reiher [2016] G. N. Simm and M. Reiher, Systematic Error Estimation for Chemical Reaction Energies, Journal of Chemical Theory and Computation 12, 2762 (2016), publisher: American Chemical Society.
- Hänggi et al. [1990] P. Hänggi, P. Talkner, and M. Borkovec, Reaction-rate theory: fifty years after Kramers, Reviews of Modern Physics 62, 251 (1990), publisher: American Physical Society.
- Marthaler and Dykman [2006] M. Marthaler and M. I. Dykman, Switching via quantum activation: A parametrically modulated oscillator, Physical Review A 73, 042108 (2006), publisher: American Physical Society.
- Dykman et al. [2011] M. I. Dykman, M. Marthaler, and V. Peano, Quantum heating of a parametrically modulated oscillator: Spectral signatures, Physical Review A 83, 052115 (2011), publisher: American Physical Society.
- Frattini et al. [2024] N. E. Frattini, R. G. Cortiñas, J. Venkatraman, X. Xiao, Q. Su, C. U. Lei, B. J. Chapman, V. R. Joshi, S. Girvin, R. J. Schoelkopf, S. Puri, and M. H. Devoret, Observation of Pairwise Level Degeneracies and the Quantum Regime of the Arrhenius Law in a Double-Well Parametric Oscillator, Physical Review X 14, 031040 (2024), publisher: American Physical Society.
- Frattini et al. [2017] N. E. Frattini, U. Vool, S. Shankar, A. Narla, K. M. Sliwa, and M. H. Devoret, 3-wave mixing Josephson dipole element, Applied Physics Letters 110, 222603 (2017).
- Frattini [2021] N. Frattini, Three-wave Mixing in Superconducting Circuits: Stabilizing Cats with SNAILs, Yale Graduate School of Arts and Sciences Dissertations (2021).
- Grimm et al. [2020] A. Grimm, N. E. Frattini, S. Puri, S. O. Mundhada, S. Touzard, M. Mirrahimi, S. M. Girvin, S. Shankar, and M. H. Devoret, Stabilization and operation of a Kerr-cat qubit, Nature 584, 205 (2020), publisher: Nature Publishing Group.
- Ryvkine and Dykman [2006] D. Ryvkine and M. I. Dykman, Resonant symmetry lifting in a parametrically modulated oscillator, Physical Review E 74, 061118 (2006).
- Boneß et al. [2024] D. K. J. Boneß, W. Belzig, and M. I. Dykman, Resonant-force induced symmetry breaking in a quantum parametric oscillator (2024), arXiv:2405.02706 [cond-mat, physics:quant-ph].
- García-Mata et al. [2024] I. García-Mata, R. G. Cortiñas, X. Xiao, J. Chávez-Carlos, V. S. Batista, L. F. Santos, and D. A. Wisniacki, Effective versus Floquet theory for the Kerr parametric oscillator, Quantum 8, 1298 (2024), publisher: Verein zur Förderung des Open Access Publizierens in den Quantenwissenschaften.
- Puri et al. [2017] S. Puri, S. Boutin, and A. Blais, Engineering the quantum states of light in a Kerr-nonlinear resonator by two-photon driving, npj Quantum Information 3, 1 (2017), publisher: Nature Publishing Group.
- Marthaler and Dykman [2007] M. Marthaler and M. I. Dykman, Quantum interference in the classically forbidden region: A parametric oscillator, Physical Review A 76, 010102 (2007), publisher: American Physical Society.
- Venkatraman et al. [2023] J. Venkatraman, R. G. Cortinas, N. E. Frattini, X. Xiao, and M. H. Devoret, A driven quantum superconducting circuit with multiple tunable degeneracies (2023), arXiv:2211.04605 [cond-mat, physics:physics, physics:quant-ph].
- Iyama et al. [2024] D. Iyama, T. Kamiya, S. Fujii, H. Mukai, Y. Zhou, T. Nagase, A. Tomonaga, R. Wang, J.-J. Xue, S. Watabe, S. Kwon, and J.-S. Tsai, Observation and manipulation of quantum interference in a superconducting Kerr parametric oscillator, Nature Communications 15, 86 (2024), publisher: Nature Publishing Group.
- Hajr et al. [2024] A. Hajr, B. Qing, K. Wang, G. Koolstra, Z. Pedramrazi, Z. Kang, L. Chen, L. B. Nguyen, C. Junger, N. Goss, I. Huang, B. Bhandari, N. E. Frattini, S. Puri, J. Dressel, A. Jordan, D. Santiago, and I. Siddiqi, High-Coherence Kerr-cat qubit in 2D architecture (2024).
- Dykman [2012] M. Dykman, Fluctuating Nonlinear Oscillators: From Nanomechanics to Quantum Superconducting Circuits (Oxford University Press, 2012).
- Gautier et al. [2022] R. Gautier, A. Sarlette, and M. Mirrahimi, Combined Dissipative and Hamiltonian Confinement of Cat Qubits, PRX Quantum 3, 020339 (2022), publisher: American Physical Society.
- Putterman et al. [2022] H. Putterman, J. Iverson, Q. Xu, L. Jiang, O. Painter, F. G. Brandão, and K. Noh, Stabilizing a Bosonic Qubit Using Colored Dissipation, Physical Review Letters 128, 110502 (2022), publisher: American Physical Society.
- Venkatraman et al. [2022] J. Venkatraman, X. Xiao, R. G. Cortiñas, and M. H. Devoret, On the static effective Lindbladian of the squeezed Kerr oscillator (2022), arXiv:2209.11193 [cond-mat, physics:physics, physics:quant-ph].
- [31] Einstein’s Unknown Insight and the Problem of Quantizing Chaos | Physics Today | AIP Publishing.
- So et al. [2024] V. So, M. D. Suganthi, A. Menon, M. Zhu, R. Zhuravel, H. Pu, P. G. Wolynes, J. N. Onuchic, and G. Pagano, Trapped-Ion Quantum Simulation of Electron Transfer Models with Tunable Dissipation (2024), arXiv:2405.10368 [cond-mat, physics:physics, physics:quant-ph].
- Sias et al. [2007] C. Sias, A. Zenesini, H. Lignier, S. Wimberger, D. Ciampini, O. Morsch, and E. Arimondo, Resonantly Enhanced Tunneling of Bose-Einstein Condensates in Periodic Potentials, Physical Review Letters 98, 120403 (2007), publisher: American Physical Society.
- Devoret et al. [1984] M. H. Devoret, J. M. Martinis, D. Esteve, and J. Clarke, Resonant Activation from the Zero-Voltage State of a Current-Biased Josephson Junction, Physical Review Letters 53, 1260 (1984), publisher: American Physical Society.
- Yu et al. [2004] Y. Yu, D. Nakada, J. C. Lee, B. Singh, D. S. Crankshaw, T. P. Orlando, K. K. Berggren, and W. D. Oliver, Energy Relaxation Time between Macroscopic Quantum Levels in a Superconducting Persistent-Current Qubit, Physical Review Letters 92, 117904 (2004), publisher: American Physical Society.
- Dutton et al. [2006] Z. Dutton, K. V. R. M. Murali, W. D. Oliver, and T. P. Orlando, Electromagnetically induced transparency in superconducting quantum circuits: Effects of decoherence, tunneling, and multilevel crosstalk, Physical Review B 73, 104516 (2006), publisher: American Physical Society.
- Yu et al. [2005] Y. Yu, W. D. Oliver, J. C. Lee, K. K. Berggren, L. S. Levitov, and T. P. Orlando, Multi-Photon, Multi-Level Dynamics in a Superconducting Persistent-Current Qubit (2005), arXiv:cond-mat/0508587.
- [38] D. G. A. Cabral, P. Khazaei, B. C. Allen, P. E. Videla, M. Schäfer, R. G. Cortiñas, A. C. C. d. Albornoz, J. Chávez-Carlos, L. F. Santos, E. Geva, and V. S. Batista, A Roadmap for Simulating Chemical Dynamics on a Parametrically Driven Bosonic Quantum Device. (In preparation).
- Slichter et al. [2012] D. H. Slichter, R. Vijay, S. J. Weber, S. Boutin, M. Boissonneault, J. M. Gambetta, A. Blais, and I. Siddiqi, Measurement-Induced Qubit State Mixing in Circuit QED from Up-Converted Dephasing Noise, Physical Review Letters 109, 153601 (2012), publisher: American Physical Society.
- Friedman [1998] J. R. Friedman, Quantum tunneling and classical barrier reduction for a mesoscopic spin, Physical Review B 57, 10291 (1998), publisher: American Physical Society.
- Dykman and Smelyanskiy [1988] M. I. Dykman and V. N. Smelyanskiy, Quantum theory of transitions between stable states of a nonlinear oscillator interacting with a medium in a resonant field, Zh. Eksp. Teor. Fiz 94, 61 (1988).
- Darmawan et al. [2021] A. S. Darmawan, B. J. Brown, A. L. Grimsmo, D. K. Tuckett, and S. Puri, Practical Quantum Error Correction with the XZZX Code and Kerr-Cat Qubits, PRX Quantum 2, 030345 (2021), publisher: American Physical Society.
- Suzuki et al. [2023] Y. Suzuki, S. Kawabata, T. Yamamoto, and S. Masuda, Quantum State Tomography for Kerr Parametric Oscillators, Physical Review Applied 20, 034031 (2023), publisher: American Physical Society.
- Xiao et al. [2023] X. Xiao, J. Venkatraman, R. G. Cortiñas, S. Chowdhury, and M. H. Devoret, A diagrammatic method to compute the effective Hamiltonian of driven nonlinear oscillators (2023), arXiv:2304.13656 [quant-ph].
- Dumas et al. [2024] M. F. Dumas, B. Groleau-Paré, A. McDonald, M. H. Muñoz-Arias, C. Lledó, B. D’Anjou, and A. Blais, Unified picture of measurement-induced ionization in the transmon (2024), arXiv:2402.06615 [quant-ph].
- Thorbeck et al. [2023a] T. Thorbeck, Z. Xiao, A. Kamal, and L. C. G. Govia, Readout-induced suppression and enhancement of superconducting qubit lifetimes (2023a), arXiv:2305.10508 [quant-ph].
- Sivak et al. [2023] V. V. Sivak, A. Eickbusch, B. Royer, S. Singh, I. Tsioutsios, S. Ganjam, A. Miano, B. L. Brock, A. Z. Ding, L. Frunzio, S. M. Girvin, R. J. Schoelkopf, and M. H. Devoret, Real-time quantum error correction beyond break-even, Nature 616, 50 (2023), publisher: Nature Publishing Group.
- Klimov et al. [2018] P. Klimov, J. Kelly, Z. Chen, M. Neeley, A. Megrant, B. Burkett, R. Barends, K. Arya, B. Chiaro, Y. Chen, A. Dunsworth, A. Fowler, B. Foxen, C. Gidney, M. Giustina, R. Graff, T. Huang, E. Jeffrey, E. Lucero, J. Mutus, O. Naaman, C. Neill, C. Quintana, P. Roushan, D. Sank, A. Vainsencher, J. Wenner, T. White, S. Boixo, R. Babbush, V. Smelyanskiy, H. Neven, and J. Martinis, Fluctuations of Energy-Relaxation Times in Superconducting Qubits, Physical Review Letters 121, 090502 (2018), publisher: American Physical Society.
- Chen et al. [2023] M. Chen, J. C. Owens, H. Putterman, M. Schäfer, and O. Painter, Phonon engineering of atomic-scale defects in superconducting quantum circuits (2023), arXiv:2310.03929 [cond-mat, physics:quant-ph].
- Thorbeck et al. [2023b] T. Thorbeck, A. Eddins, I. Lauer, D. T. McClure, and M. Carroll, Two-Level-System Dynamics in a Superconducting Qubit Due to Background Ionizing Radiation, PRX Quantum 4, 020356 (2023b), publisher: American Physical Society.
- Chávez-Carlos et al. [2024] J. Chávez-Carlos, M. A. P. Reynoso, I. García-Mata, V. S. Batista, F. Pérez-Bernal, D. A. Wisniacki, and L. F. Santos, Driving superconducting qubits into chaos (2024), arXiv:2310.17698 [cond-mat, physics:quant-ph].
- Sank et al. [2016] D. Sank, Z. Chen, M. Khezri, J. Kelly, R. Barends, B. Campbell, Y. Chen, B. Chiaro, A. Dunsworth, A. Fowler, E. Jeffrey, E. Lucero, A. Megrant, J. Mutus, M. Neeley, C. Neill, P. O’Malley, C. Quintana, P. Roushan, A. Vainsencher, T. White, J. Wenner, A. N. Korotkov, and J. M. Martinis, Measurement-Induced State Transitions in a Superconducting Qubit: Beyond the Rotating Wave Approximation, Physical Review Letters 117, 190503 (2016), publisher: American Physical Society.
- Wang et al. [2023] C. S. Wang, N. E. Frattini, B. J. Chapman, S. Puri, S. Girvin, M. H. Devoret, and R. J. Schoelkopf, Observation of Wave-Packet Branching through an Engineered Conical Intersection, Physical Review X 13, 011008 (2023), publisher: American Physical Society.
- Yamaguchi et al. [2024] A. Yamaguchi, S. Masuda, Y. Matsuzaki, T. Yamaji, T. Satoh, A. Morioka, Y. Kawakami, Y. Igarashi, M. Shirane, and T. Yamamoto, Spectroscopy of flux-driven Kerr parametric oscillators by reflection coefficient measurement, New Journal of Physics 26, 043019 (2024), publisher: IOP Publishing.
- Habib et al. [1998] S. Habib, K. Shizume, and W. H. Zurek, Decoherence, Chaos, and the Correspondence Principle, Physical Review Letters 80, 4361 (1998), publisher: American Physical Society.
- Zurek and Paz [1994] W. H. Zurek and J. P. Paz, Decoherence, chaos, and the second law, Physical Review Letters 72, 2508 (1994), publisher: American Physical Society.
- [57] W. H. Zurek and J. P. Paz, Why We Don’t Need Quantum Planetary Dynamics: Decoherence and the Correspondence Principle for Chaotic Systems, Greenberger, D., Reiter, W.L., Zeilinger, A. (eds) Epistemological and Experimental Perspectives on Quantum Physics, 1999 Springer Science+Business Media Dordrecht, 167.