Contribution of the light-collection non-uniformity to the energy resolution for the spaghetti-type calorimeter modules
Abstract
Spaghetti-type calorimeters (SpaCal) are being considered as a potential solution for experiments at the High-Luminosity Large Hadron Collider (HL-LHC), particularly for the LHCb ECAL Upgrade 2 project where the expected instantaneous intensity and radiation dose in the central area of the ECAL significantly exceed the limits tolerable by the current Shashlik-type modules. SpaCal modules consist of an absorber block containing a matrix of holes filled with scintillating fibres, offering flexible granularity. However, the total number of scintillating fibres exceeds the available photocathode surface area, necessitating the use of a light guide to efficiently collect and register the light from the scintillating fibres to a single photomultiplier. This introduces non-uniformity in the light collection, which adversely impacts energy resolution.
In this study, we explored various geometries of light guides with the optical ray-tracing simulations in order to collect scintillating light from a mm2 surface to the photocathode of photomultipliers with the following entrance window: mm2 (e.g. R7600), mm2 (multi-anode version, e.g. R7600-M4), and round photocathode mm (e.g. R9880). The light collection non-uniformity impact on the energy resolution is estimated.
1 Introduction
Spaghetti-type (SpaCal) calorimeters are well-known since the early 1990s [1] and have impressive results in terms of energy resolution obtained [2]. The flexibility of defining and changing the existing detector granularity and reducing shower transverse size by using dense materials as an absorber are the main advantages. Nevertheless, there is an open question of the uniformity of the light collection and how it affects energy resolution. The LHCb Upgrade phase 2 [3] is aimed to fully exploit the flavour-physics opportunities of the HL-LHC by allowing experiment running at a maximum luminosity of cm2s-1, with the aim of collecting integrating fb-1 by the end of Run 6. The SpaCal technology is considered as a baseline option for the inner part of the LHCb electromagnetic calorimeter (ECAL) (see Table 1) [4], where an expected accumulated dose exceeds 40 kGy - the limit for the current modules made by a shashlik technology.
| Region | Cell size [mm2] | Module type | #modules | #cells |
|---|---|---|---|---|
| 1 | SPACAL W + crystal fibre (up to 1 MGy) | 40 | 2560 | |
| 2 | SPACAL Pb + plastic fibre (up to 200 kGy) | 136 | 2176 | |
| 3 | New + refurbished Shashlik (up to 40 kGy) | 448 | 4032 | |
| 4 | Refurbished and rebuilt Shasklik | 1344 | 5376 | |
| 5 | Refurbished Shaslik | 1344 | 1344 | |
| Total | 3312 | 15488 |
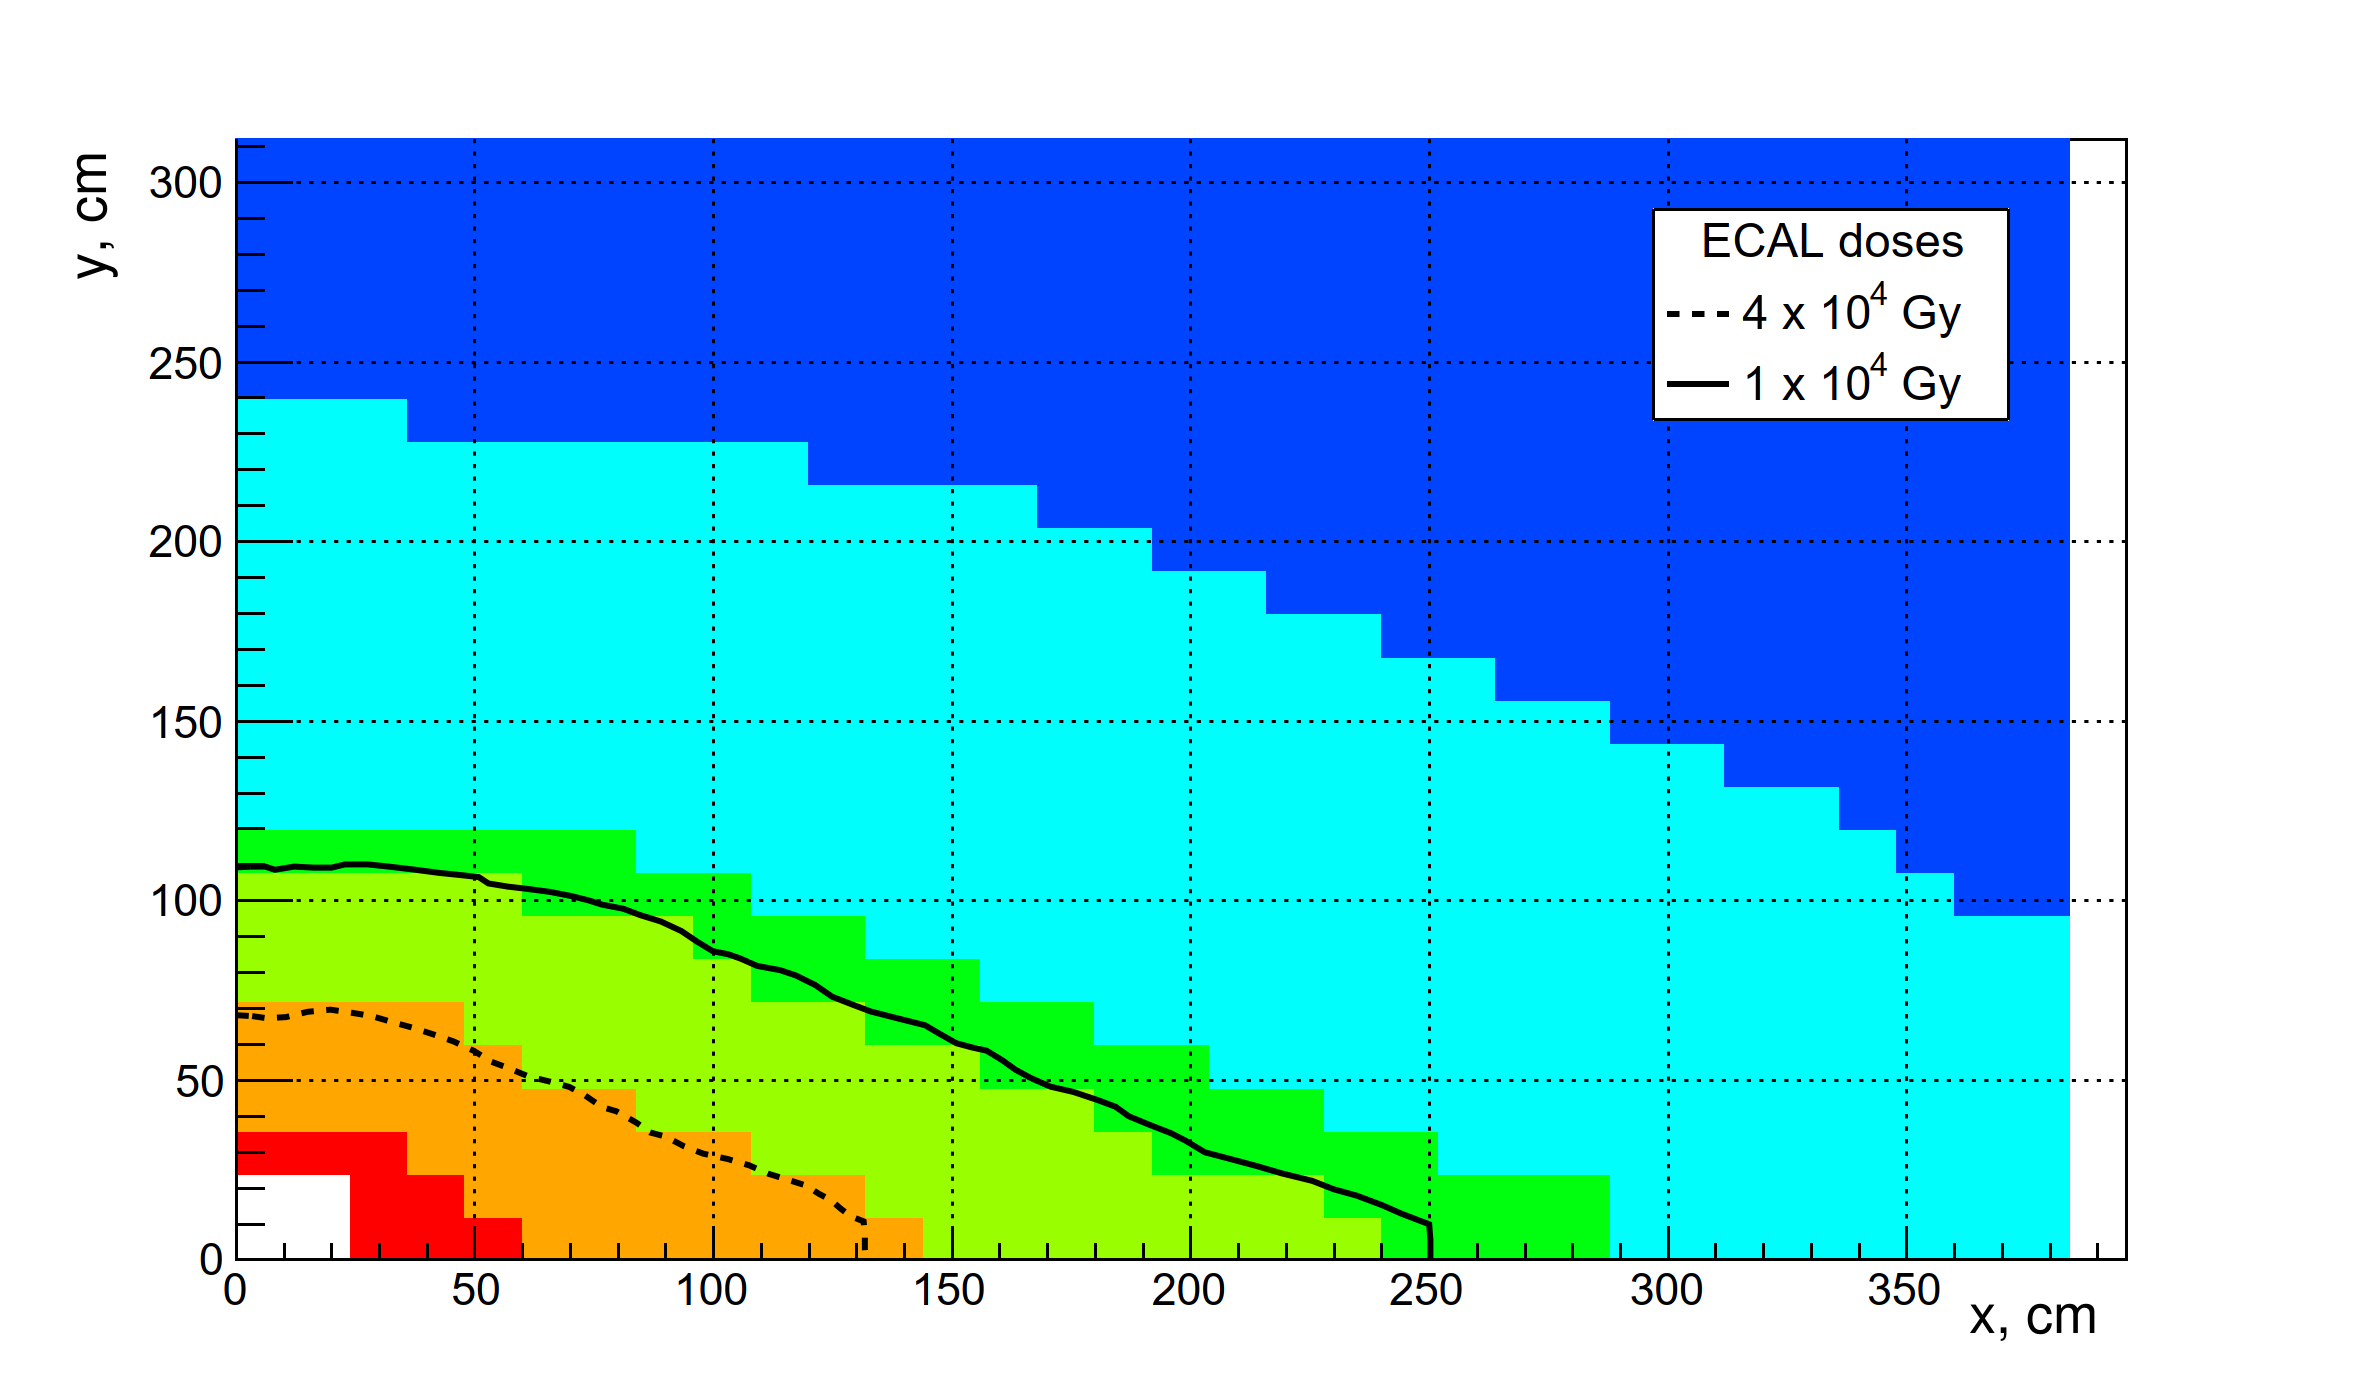
The baseline Upgrade 2 layout is present in Figure 1 and contains five regions in granularity: mm2 (red), mm2 (orange), mm2 (green), mm2 (cyan) and mm2 (blue). The two innermost regions are made of SpaCal technology with radiation hard crystals and 3D printed W-absorber (red) and cast lead-based absorber with plastic SCSF-3HF fibres (orange).
Simulation of spaghetti modules for inner regions was carried out in paper [5]. An optimization of the lead-plastic modules was performed in paper [6], it includes choosing of fibers’ size, distance between them and dimensions of holes in absorber for fibers to regulate needed amount of air between fibers and absorber walls.
This work discusses the additional term to the energy resolution induced by the light collection non-uniformity from the SpaCal modules. Standalone optical simulation performed to estimate weight coefficient for the each fibre. The amount of energy deposited in each scintillating fibre is weighted by a parameter that either is distributed by a Gaussian or obtained with the simulation performance of different light guide geometries.
2 Simulation description
The simulation was performed using the GEANT4 toolkit to analyze the impact of different light guide (LG) geometries on light collection uniformity [7, 8, 9]. GEANT4 11.1 version is used with FTFP_BERT physics list including Optical class (G4OpticalPhysics) to model the generation and propagation of optical photons in materials.
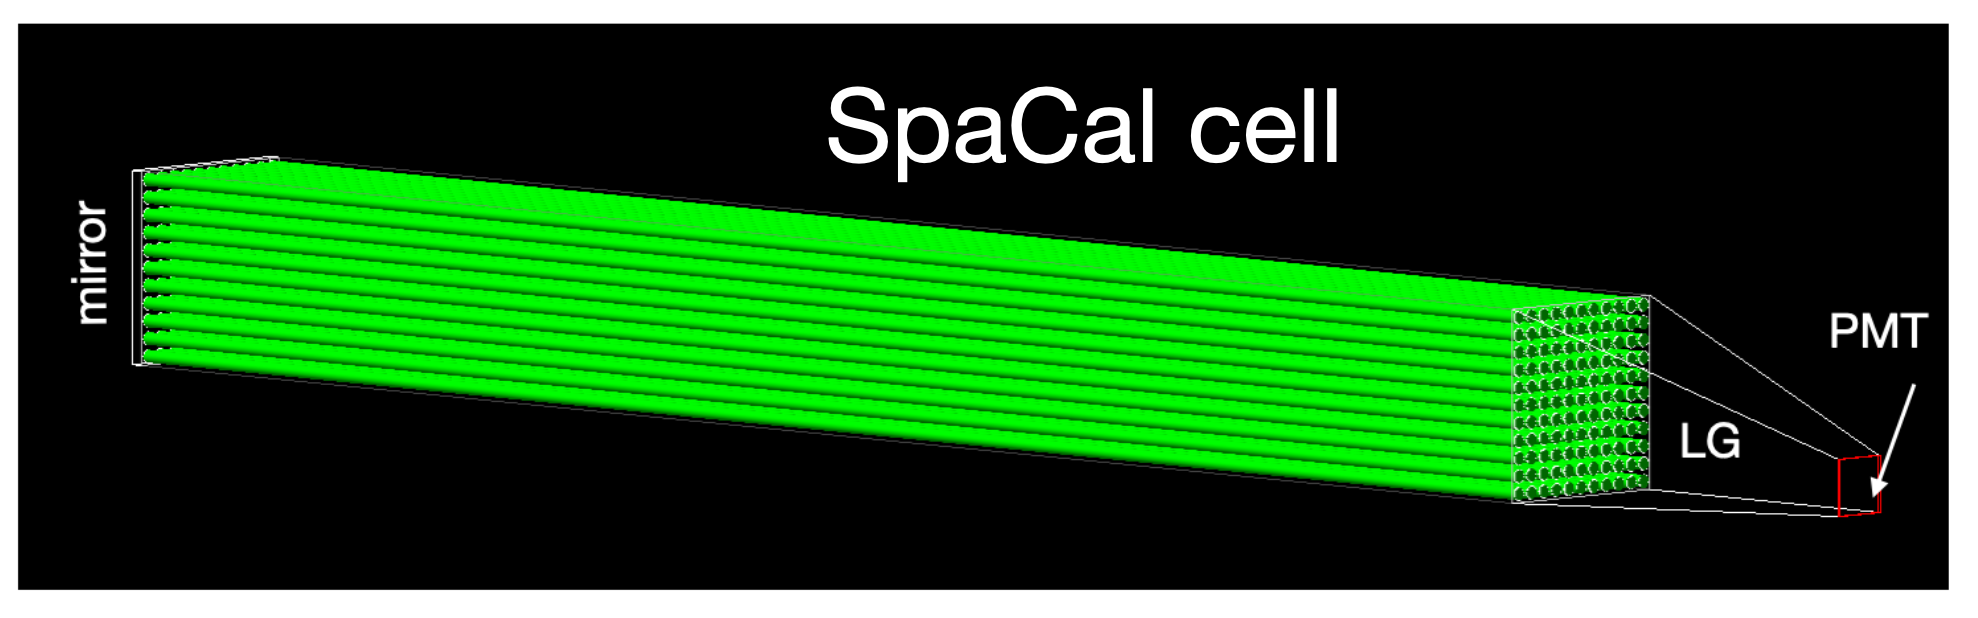
The single-cell prototype of the SpaCal module with the transverse size of mm2 and a length of 300 mm was modeled, as shown in Figure 2. The model comprises a lead absorber block with a matrix of holes, into which steel tubes and scintillating fibers were inserted. The steel tubes provide structural support and housing for the fibers. Each tube had an inner diameter of 2.2 mm and an outer diameter of 2.4 mm with a step size of 2.75 mm between the centers of adjacent tubes. The scintillating fibers are made of polystyrene (C8H8) with a diameter of 2.0 mm and light yield of 10 photons / keV.
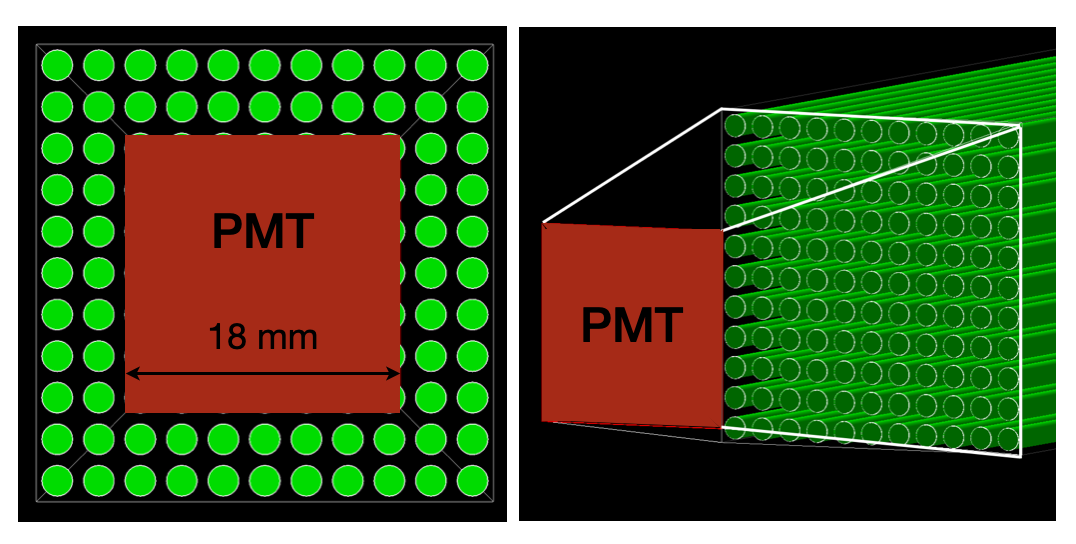
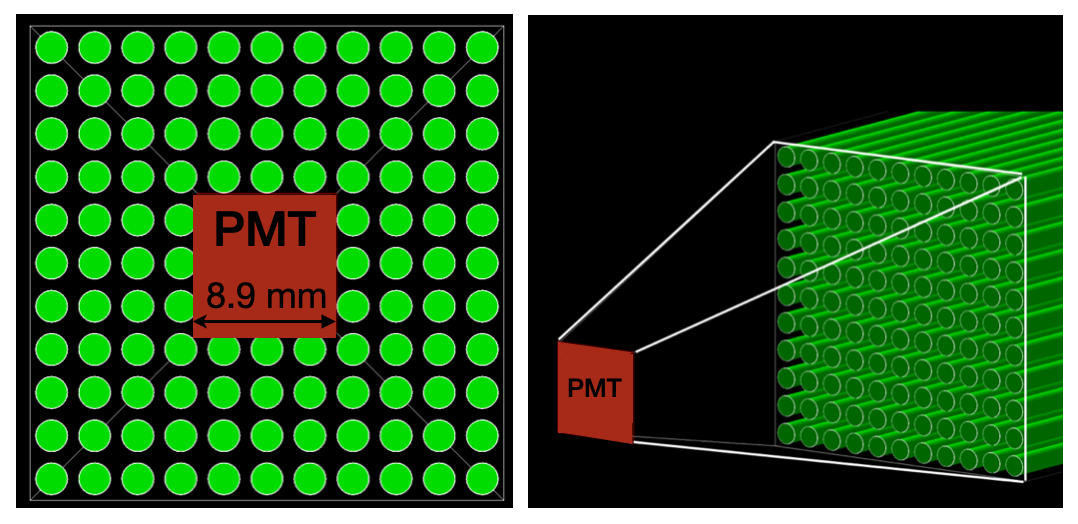
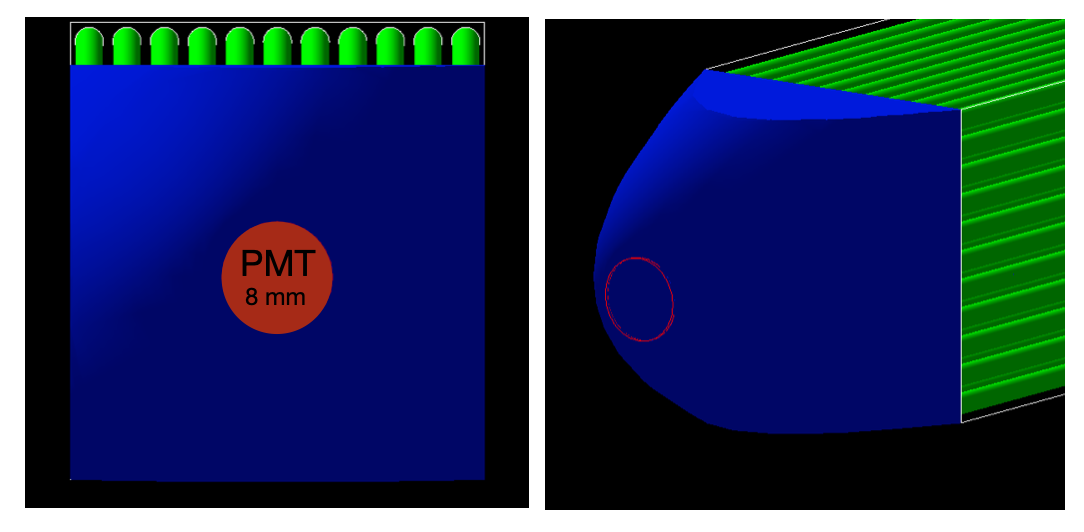
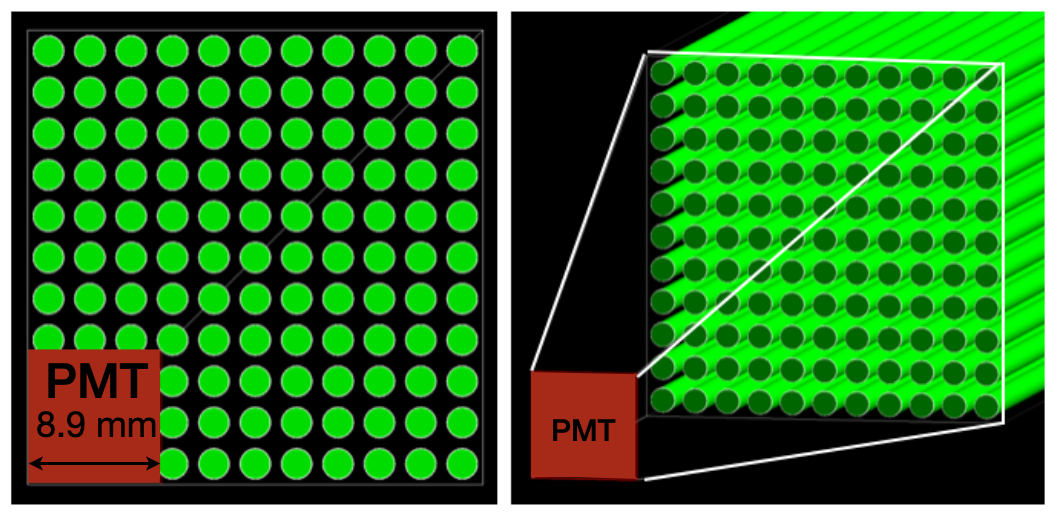
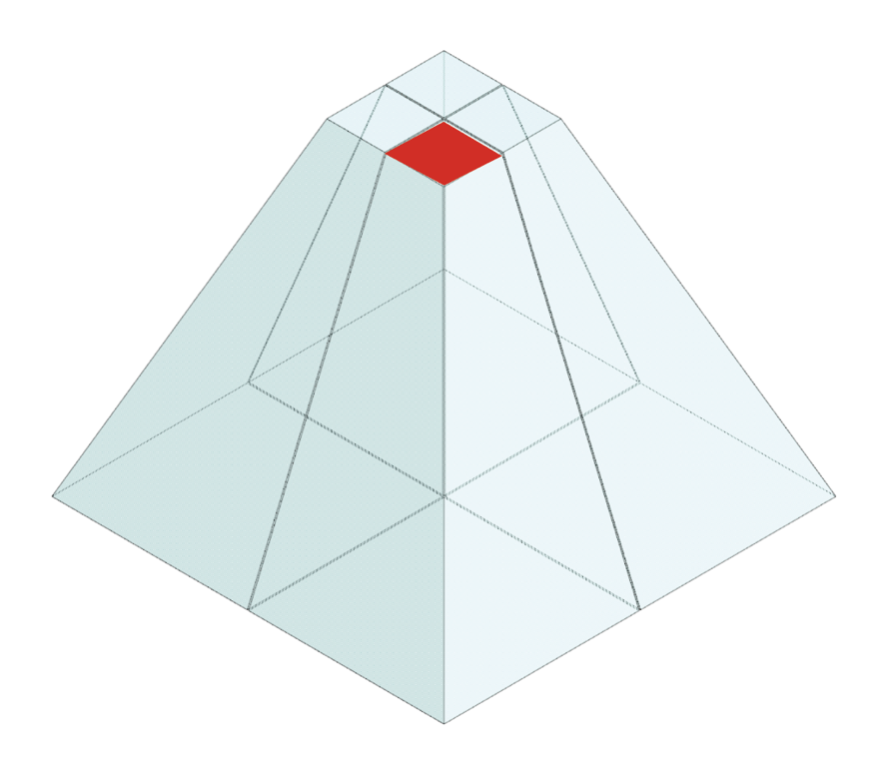
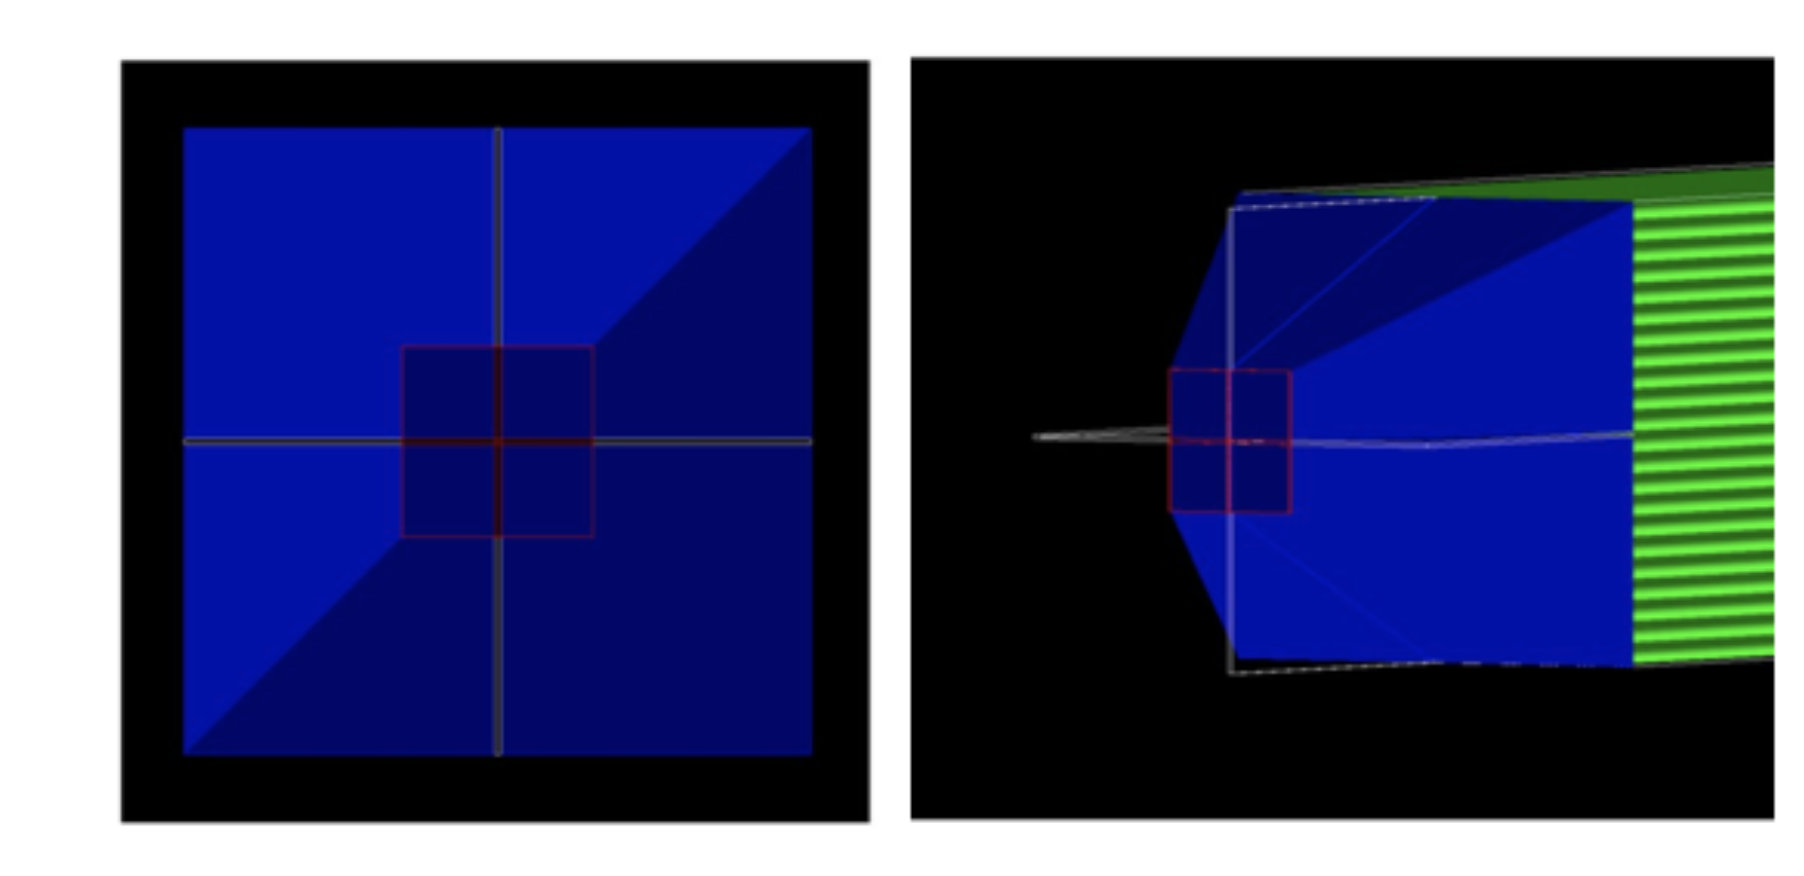
Several geometrical LG configurations were studied, including symmetrical and asymmetrical trapezoidal guides, parabolic guides with square and round bases, commonly referred to as Winston-cone, as illustrated in Figure 3. The LG is defined by the cell size, which is fixed to mm2, the sensitive area of the photomultiplier: mm2 (e.g. R7600), mm2 (multi-anode version, e.g. R7600-M4, Figure 4), or round photocathode 8 mm (e.g. R9880) and variable length from 20 mm to 60 mm with 10 mm step.
To recreate a single read-out scenario and take into account all scintillation photons a reflective mirror was installed at the back of single SpaCal cell.
3 Gaussian approximation for the light collection efficiency
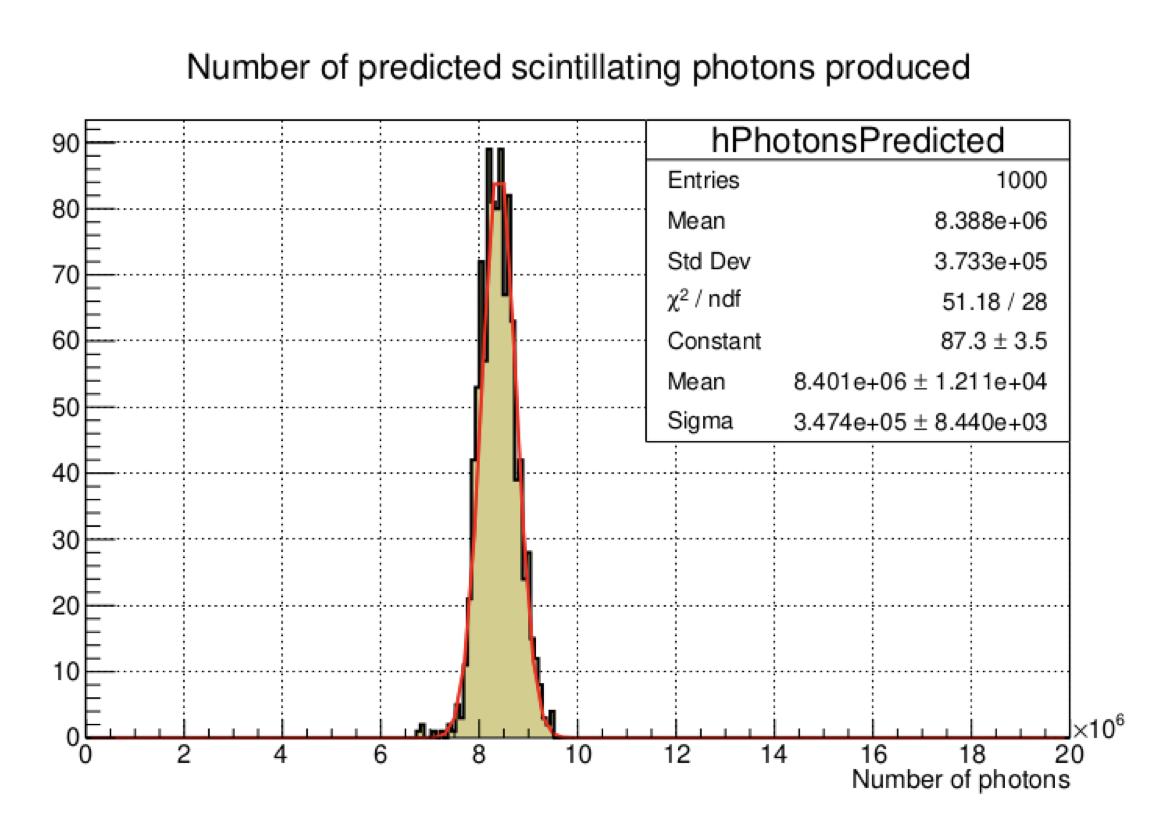
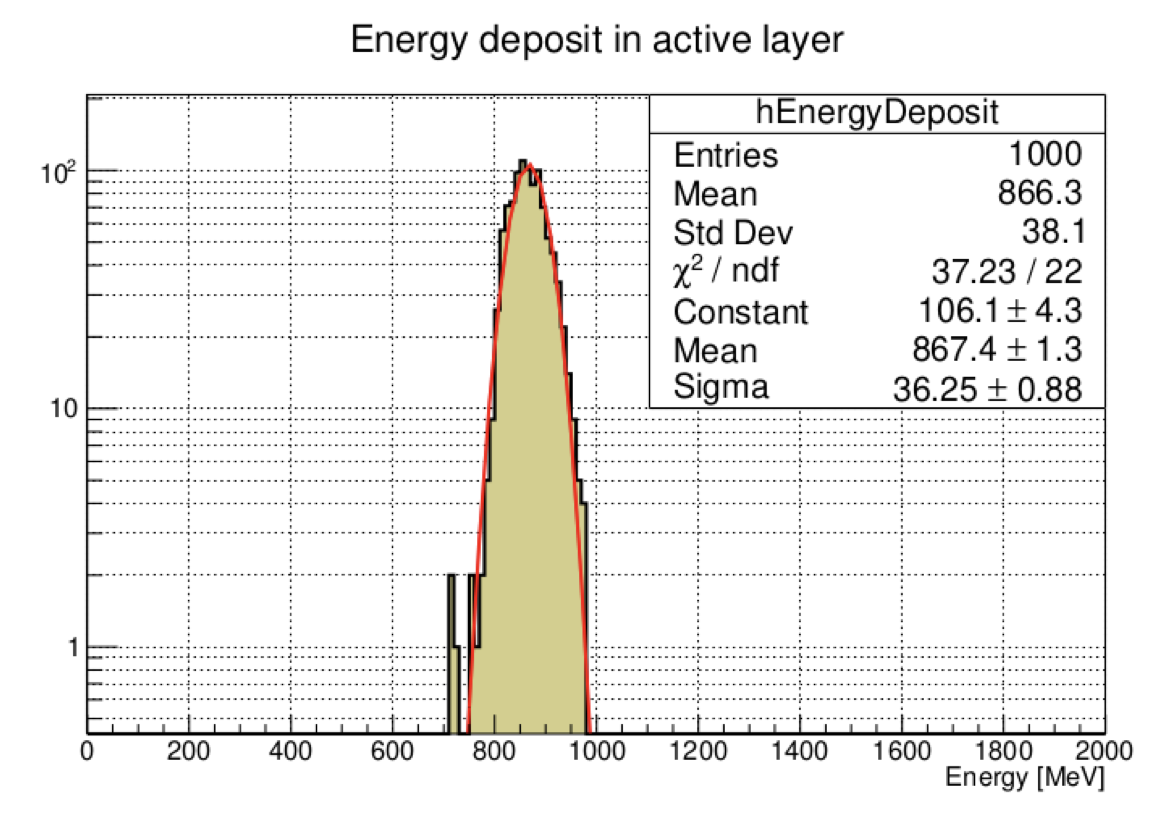
To estimate the contribution of the LG to the non-uniformity of light collection and, consequently, to the energy resolution, the electron showers in the calorimeter were first simulated. The energy deposits from showers were converted into a signal in terms of the number of scintillating photons using Birk’s law, as shown in Figure 5.
The deposited energies in both the scintillator and absorber layers follow a Gaussian distribution. The number of predicted scintillating photons produced was calculated.
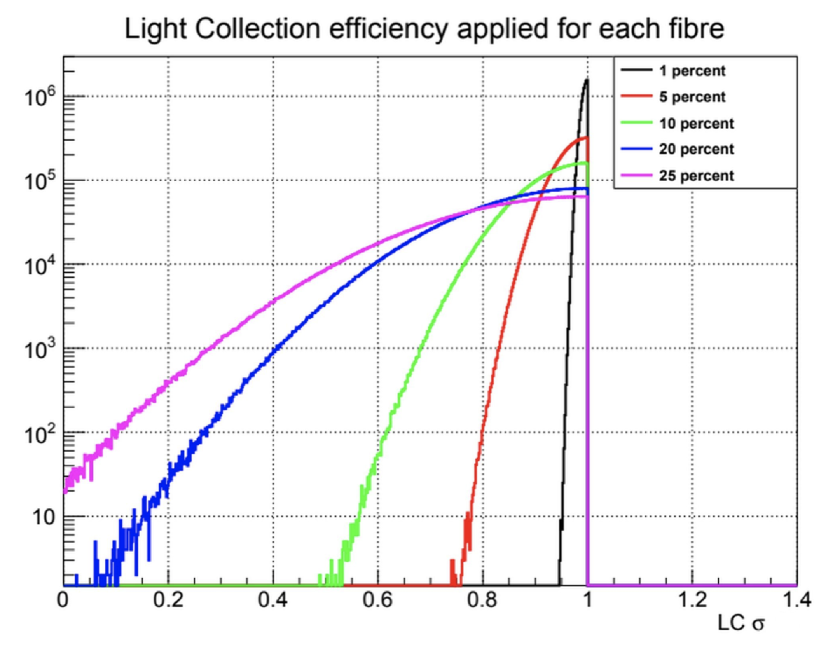
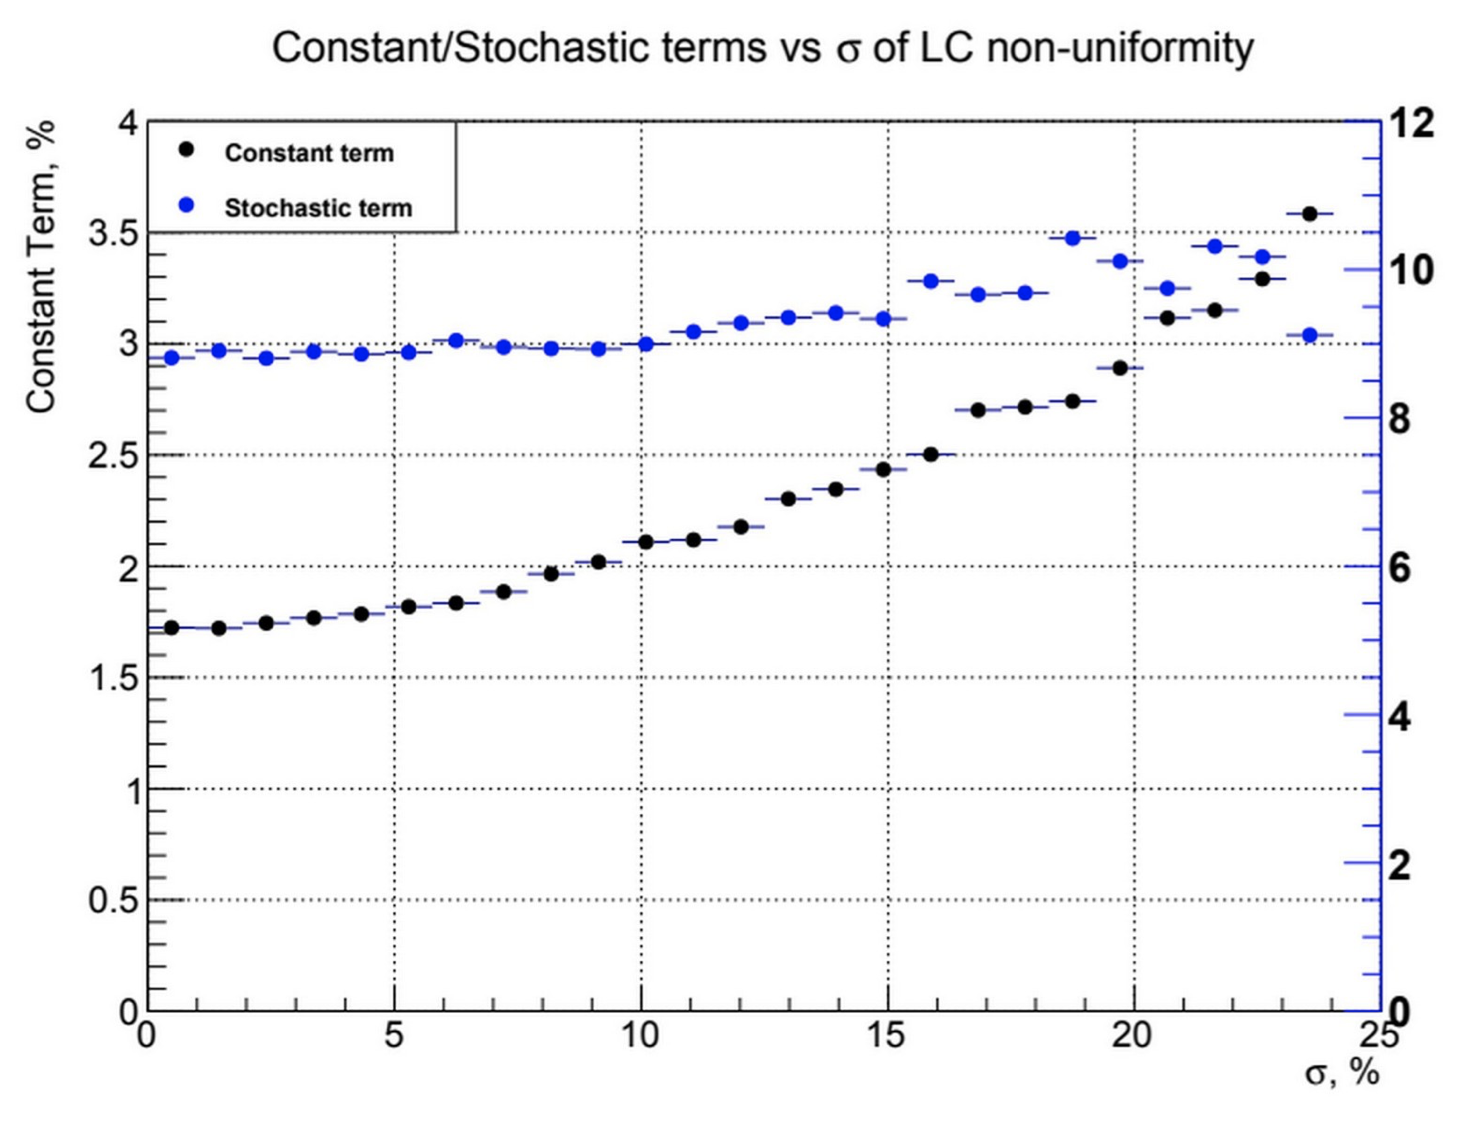
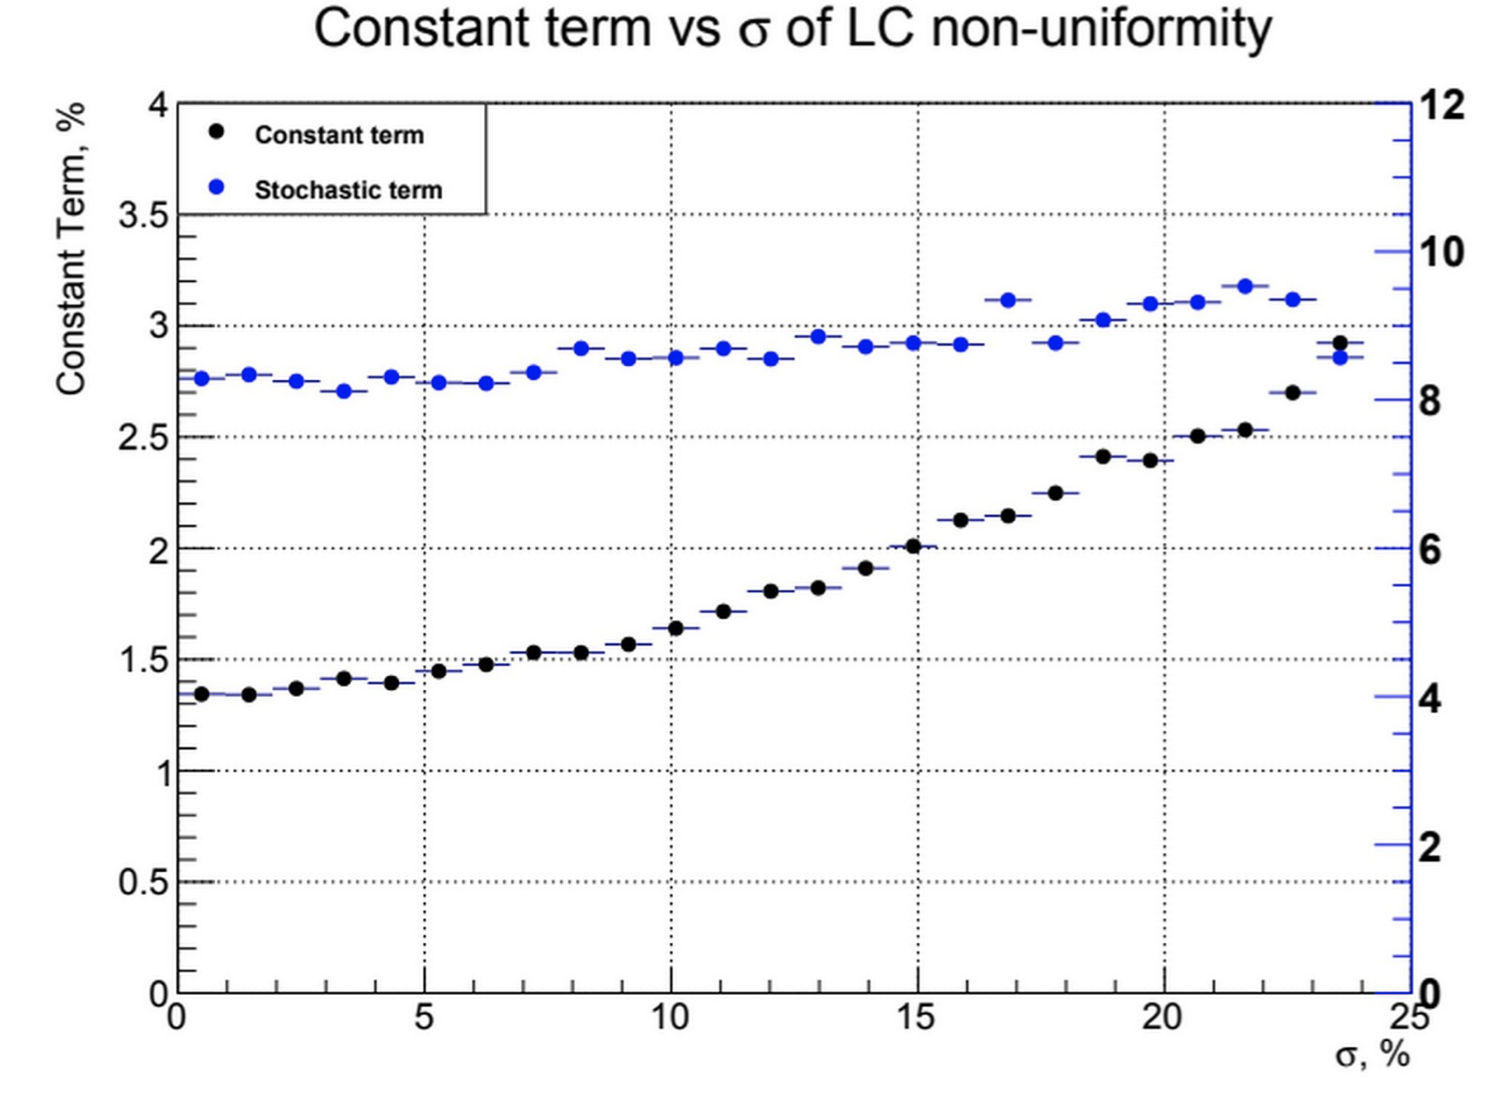
In order to assess the impact of light collection non-uniformity on the energy resolution, the individual fiber efficiencies were modeled using a Half-normal distribution with varying degrees of dispersion (or values) (left Figure 6). This approach systematically explored how variations in light collection efficiency influence the energy resolution (right Figure 6). By varying the sigma values, we observe how the non-uniformity of the light collection process translates into changes in the energy resolution across different beam energies. The energy resolution was determined by fitting the distribution of energy deposits with a Gaussian.
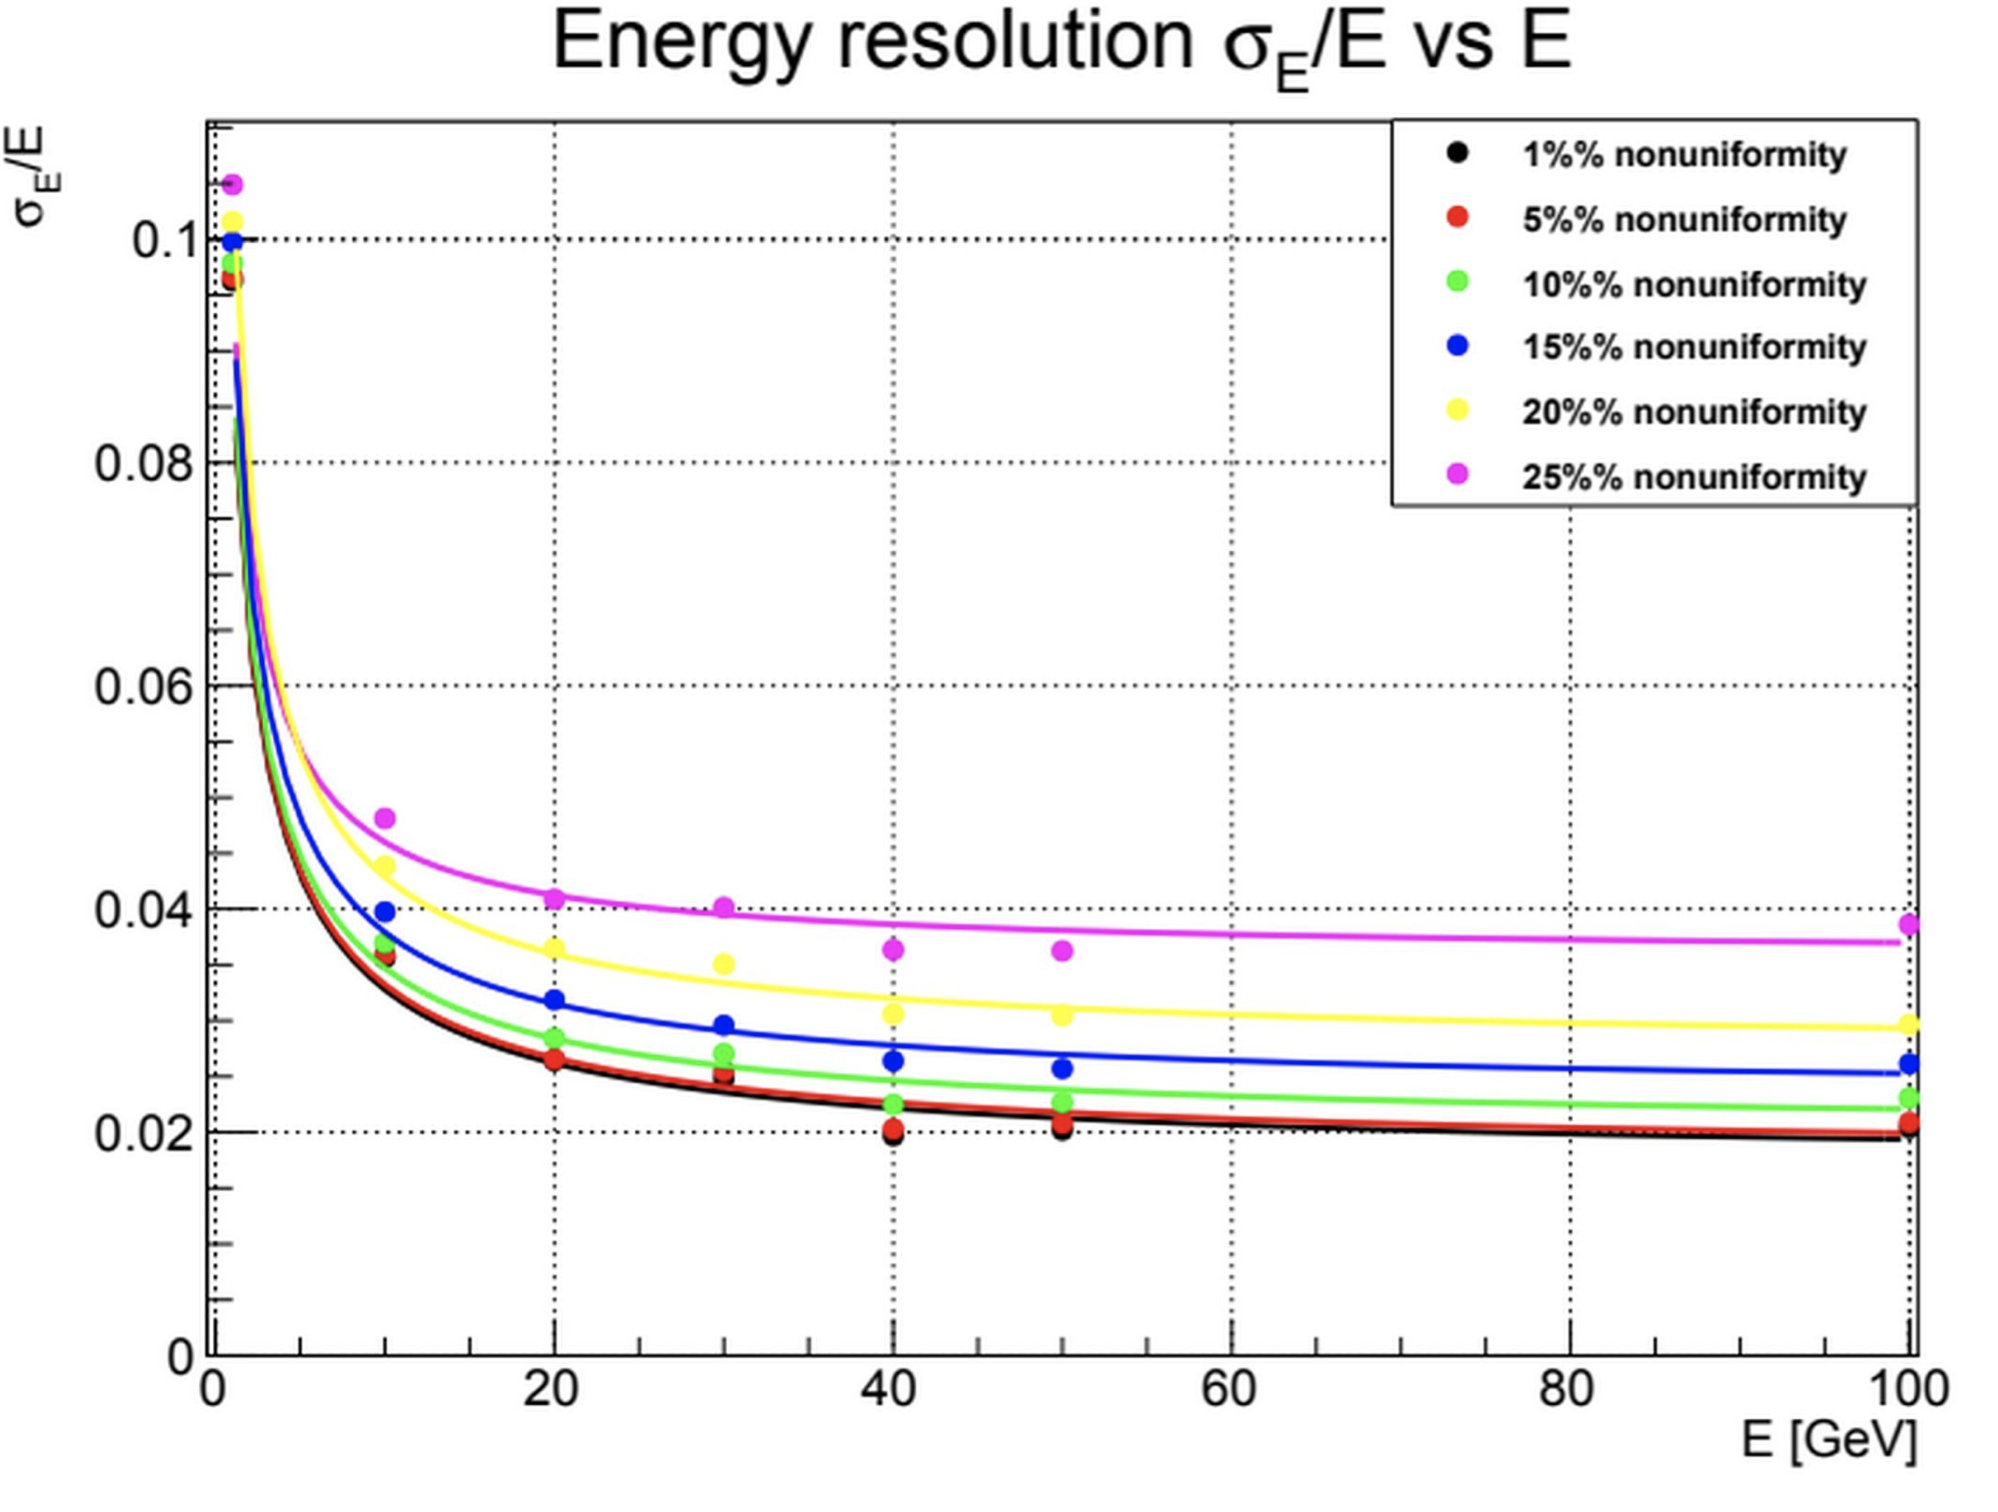
Applying the Gaussian approximation as LG non-uniformity, we estimated its contribution to the stochastic and constant terms of the energy resolution. As shown in Figure 7, different levels of non-uniformity influenced both the stochastic and constant terms, reflecting the impact of LG geometry on the overall energy resolution.
4 Estimation of the efficiency of the light guide
To accurately evaluate the LG performance efficiency, muons with momentum of 1 GeV/ impinging the center of test module perpendicular to the fibre direction are used. This setup minimizes variations caused by electromagnetic showers. The efficiency of the individual fibre is estimated as a fraction of scintillating photons reaching the photocathode from the selected fibre.
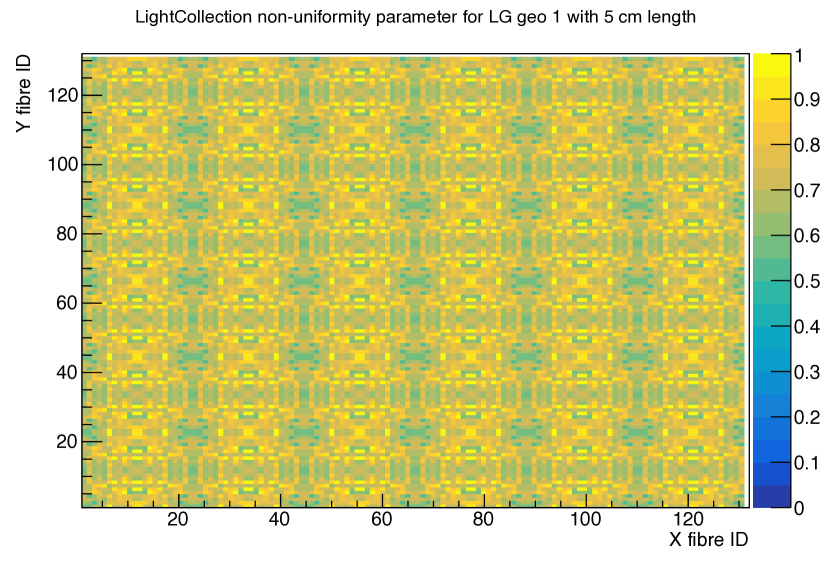
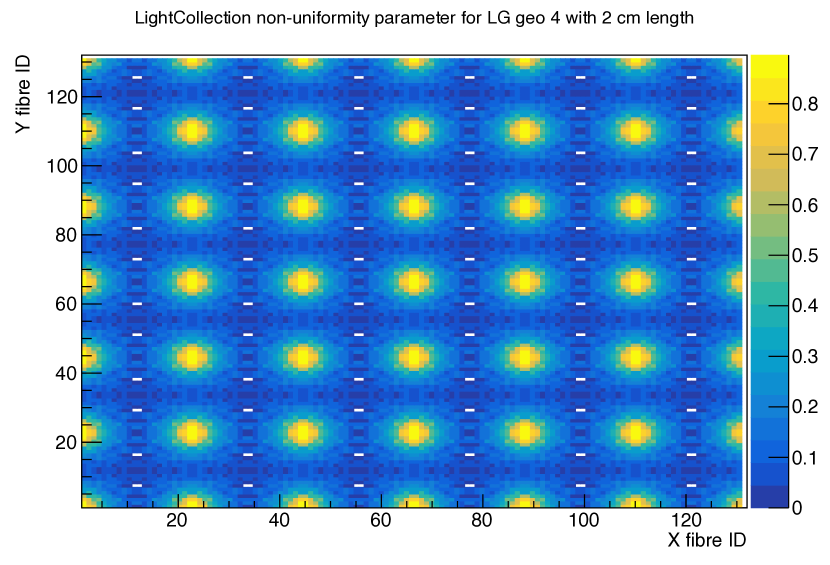
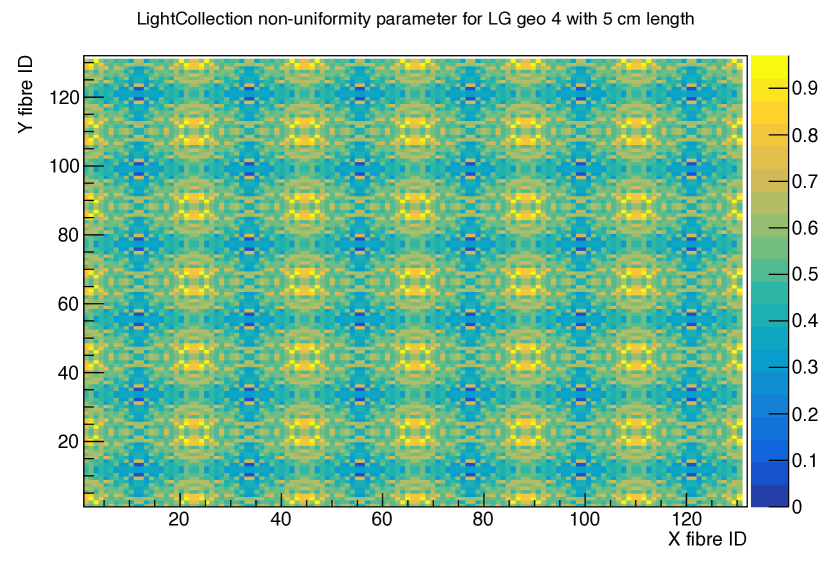
Efficiency maps were generated for various LG geometries, providing insights into the spatial distribution of light collection non-uniformities within SpaCal modules, as illustrated by the examples for multi-anode LG configurations in Figure 8. The efficiency was studied for different LG lengths and materials, with the goal of achieving uniform signal collection across all fibers. The non-uniformity factor maps are normalized with respect to efficiency to the highest fiber response value.
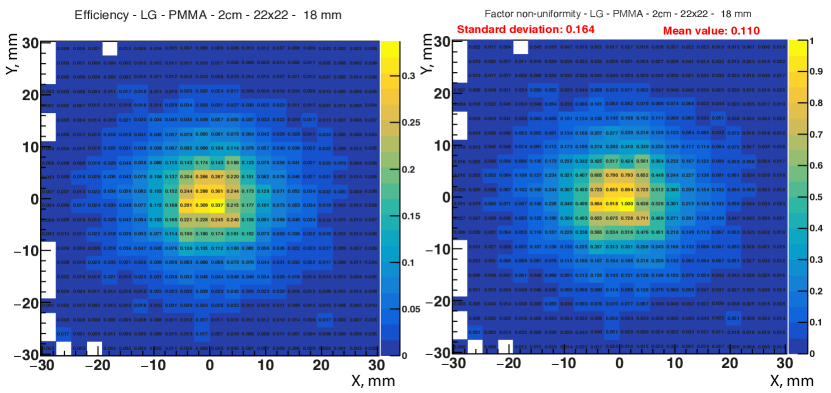
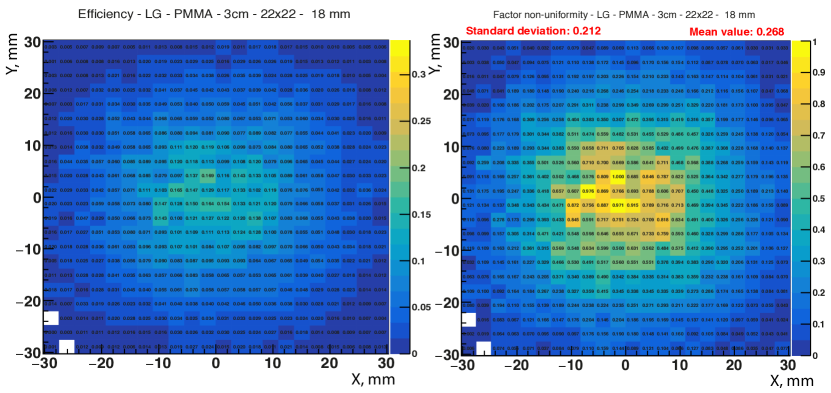
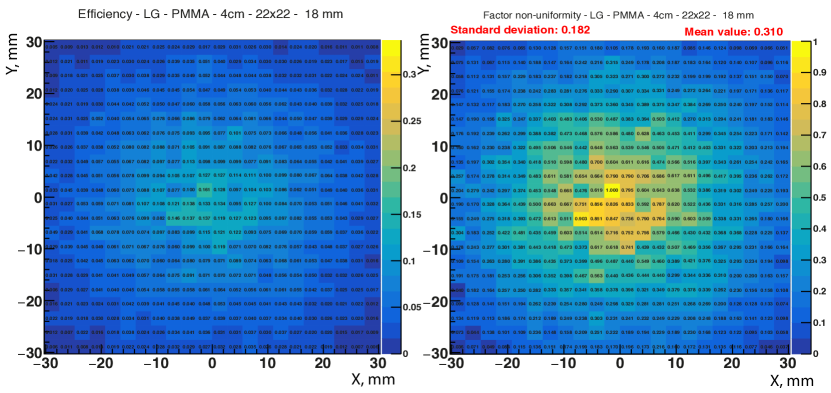
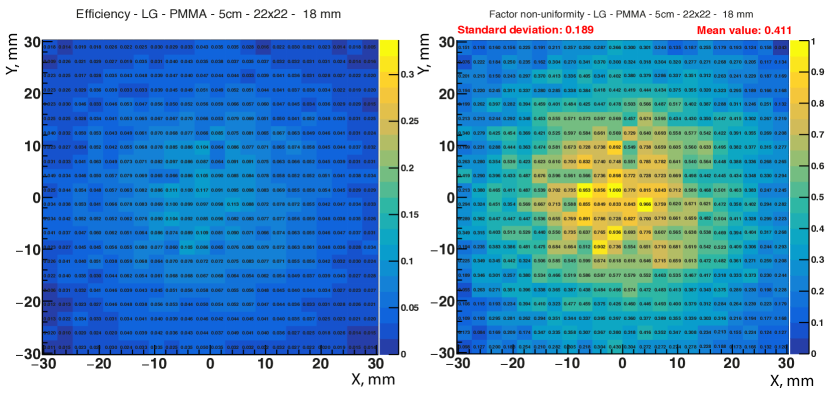
As the length of the LG increases, the distribution of scintillation light collection across the fibers becomes more uniform. Longer LG allows photons to mix more thoroughly before reaching the photodetector, reducing variations between fibers.
5 Energy resolution for whole SpaCal module
Expanding from the single cell, the entire calorimeter module was constructed by arranging 12 12 cells in the X and Y projections, forming a 363 363 mm2 transverse section and maintaining the same length of 300 mm (see Figure 9). The module’s overall dimensions were 363 363 300 mm3.
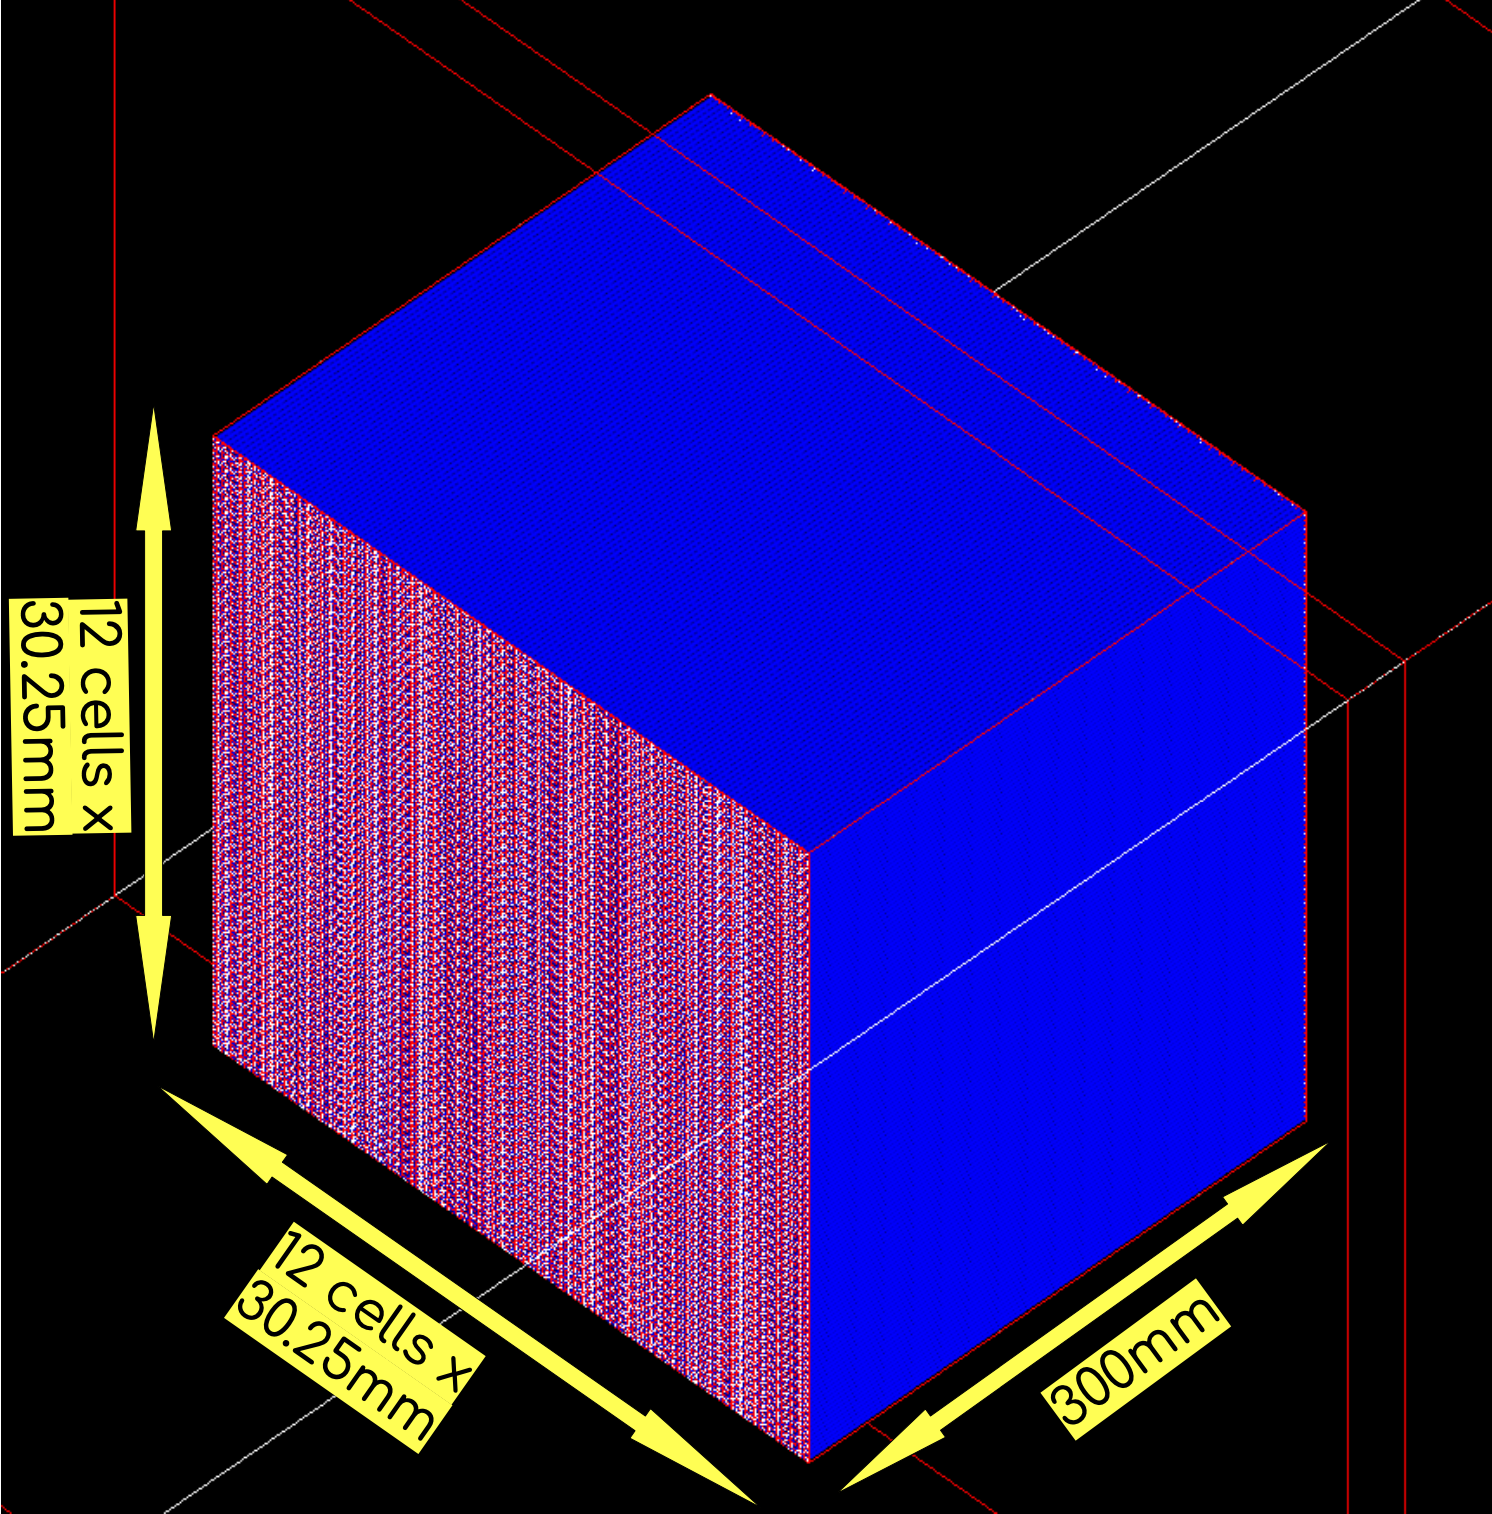
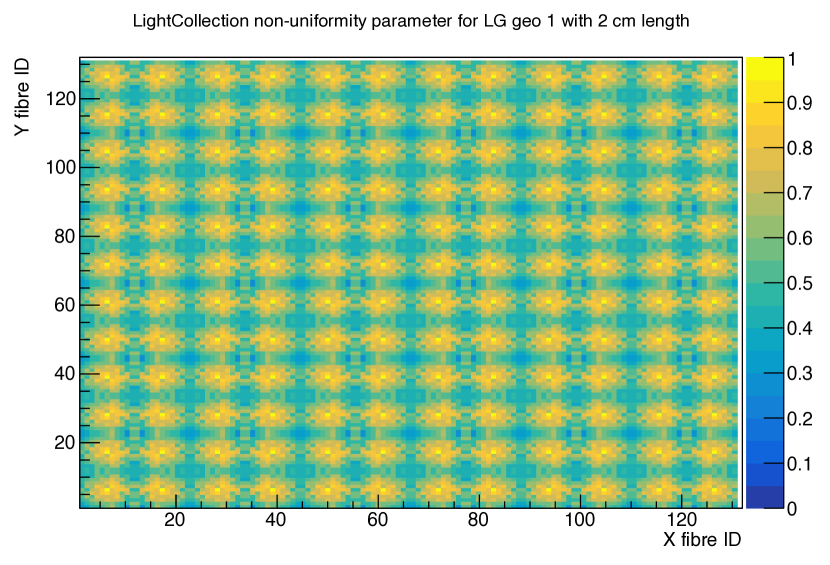
The performance of the entire module was simulated based on the efficiency and non-uniformity factors calculated for a single cell, incorporating various LG geometries. This approach allowed the assessment of the effects of non-uniformity across the entire calorimeter module on energy resolution. Non-uniformity factors observed in the single-cell simulations were applied to each fiber in the module to create the calorimeter’s performance (see Figure 10).
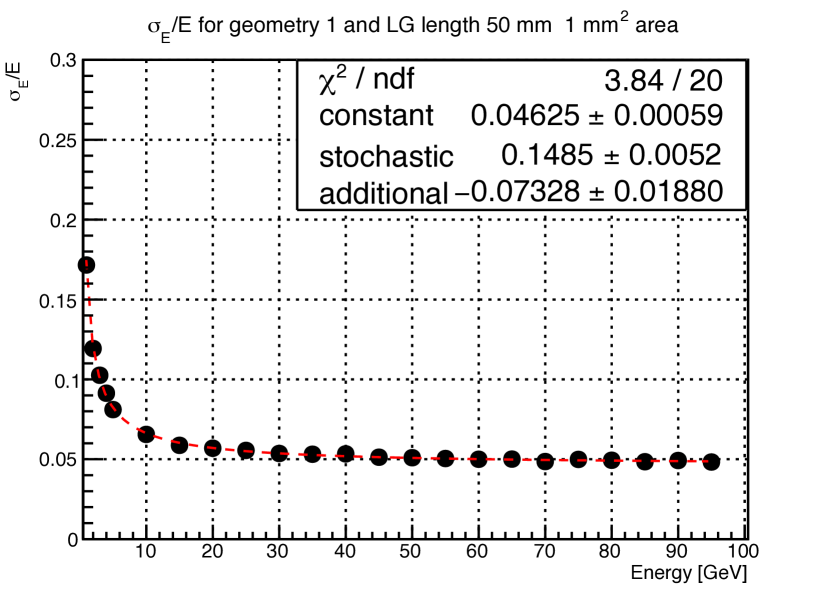
Energy resolution was calculated for electrons of 1 to 100 GeV at 3∘+3∘ incidence angle. The measured resolutions against the beam energy were described by a stochastic , a constant , and an additional (noise) term:
| (5.1) |
where is a quadratic sum and is the beam energy in GeV. The data were fitted with Eq. 5.1 employing one stochastic and one constant term per incidence angle.
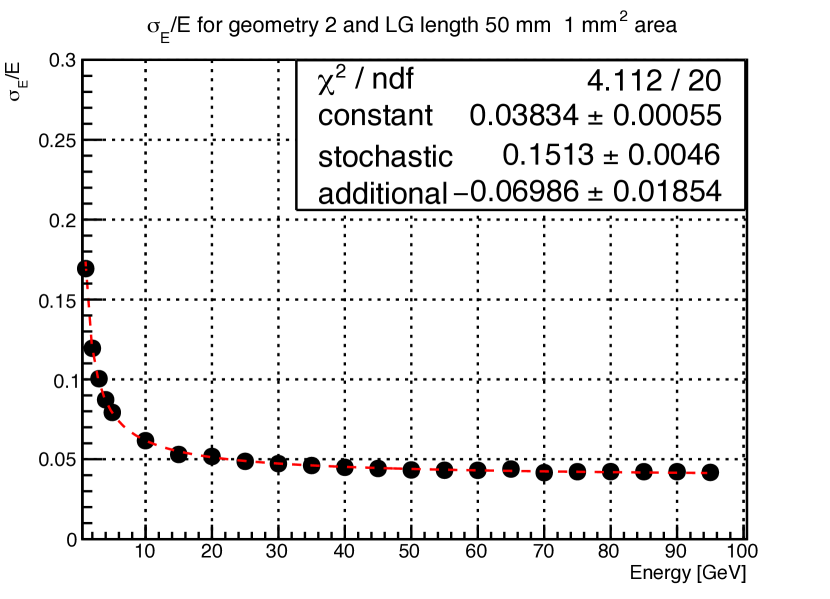
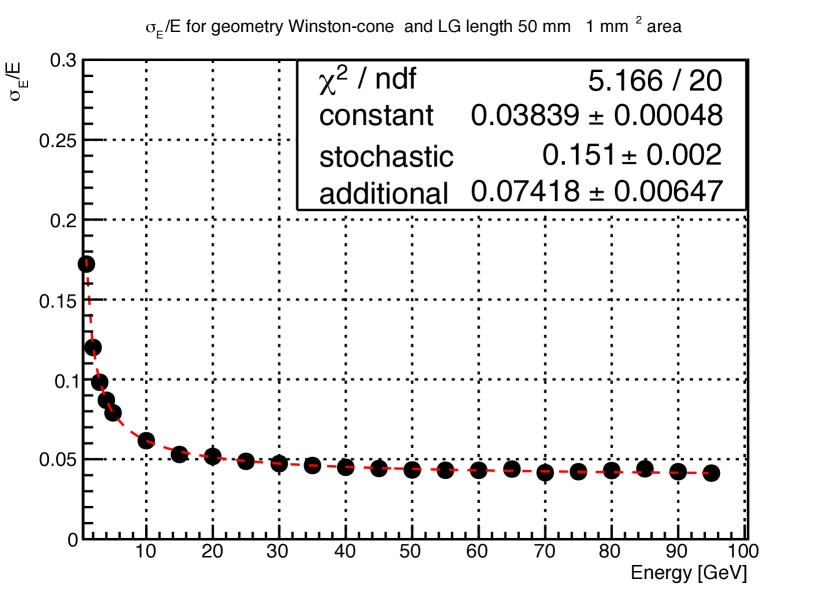
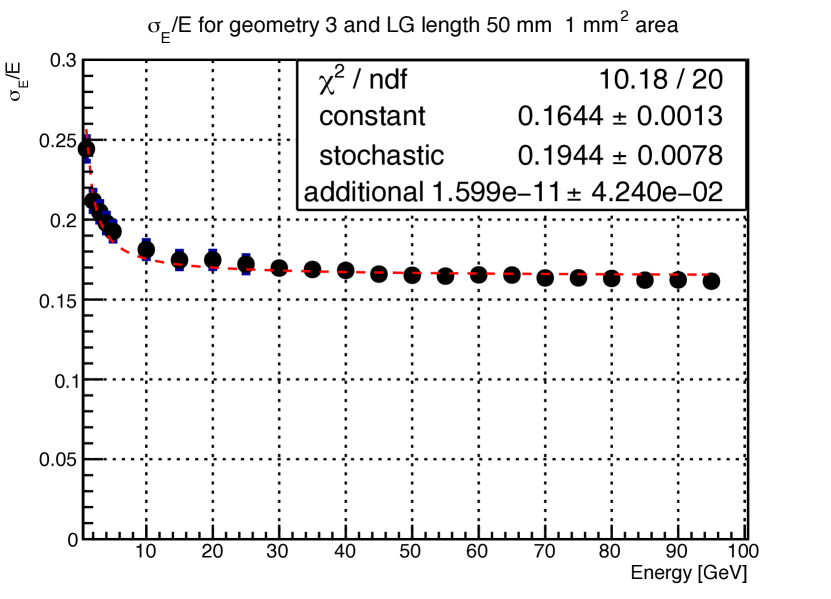
Figure 11 shows the energy resolution across various LG geometries and lengths ranging from 20 mm to 50 mm. Asymmetrical geometries exhibited worse energy resolution due to increased non-uniformity in light collection. Symmetric and parabolic geometries, such as the Winston-cone, performed better by providing more uniform light distribution across the module, thus improving energy resolution.
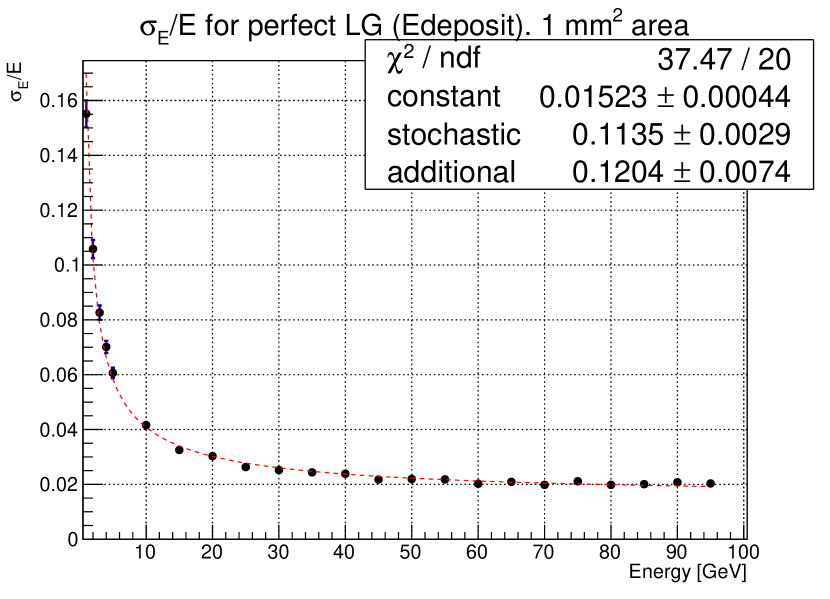
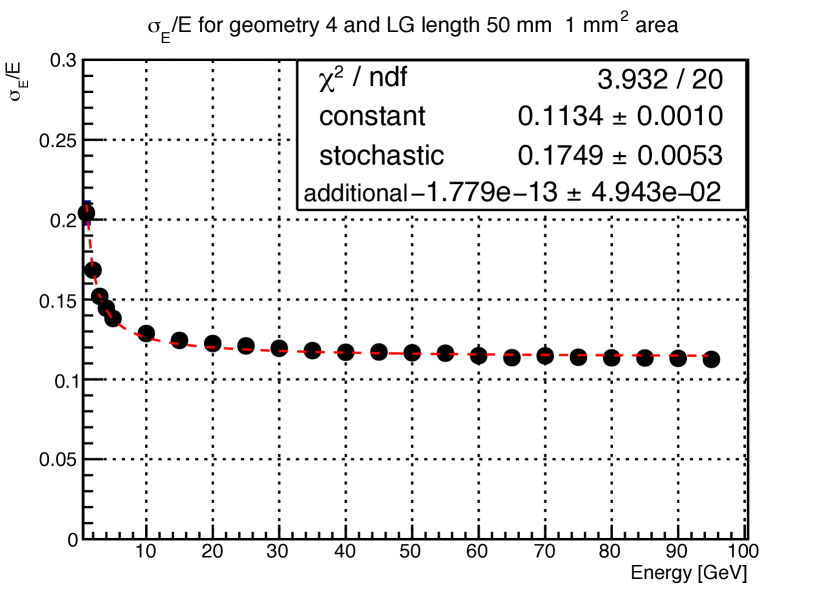
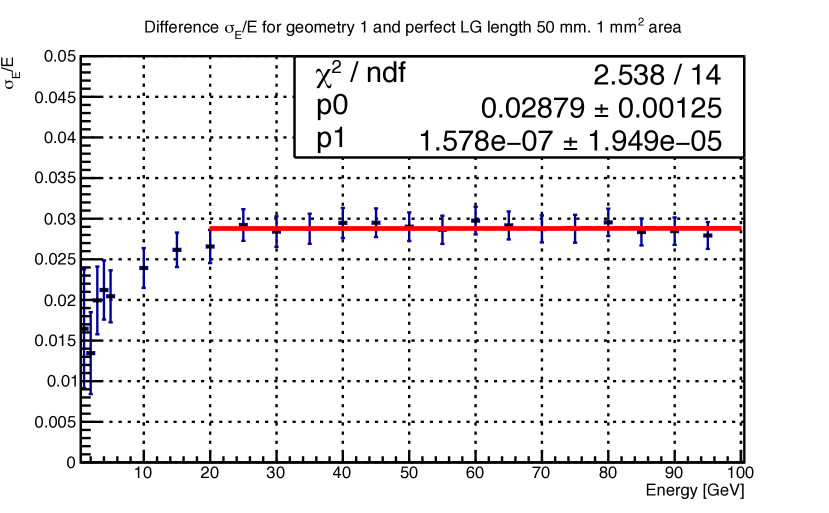
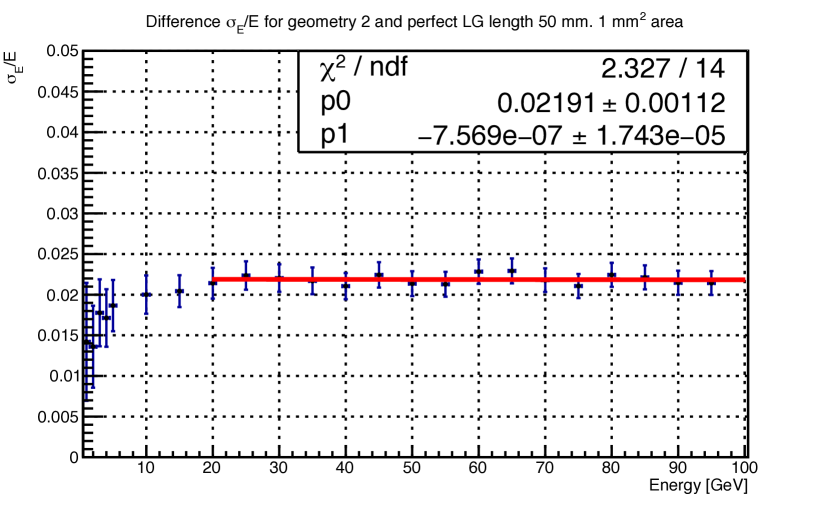
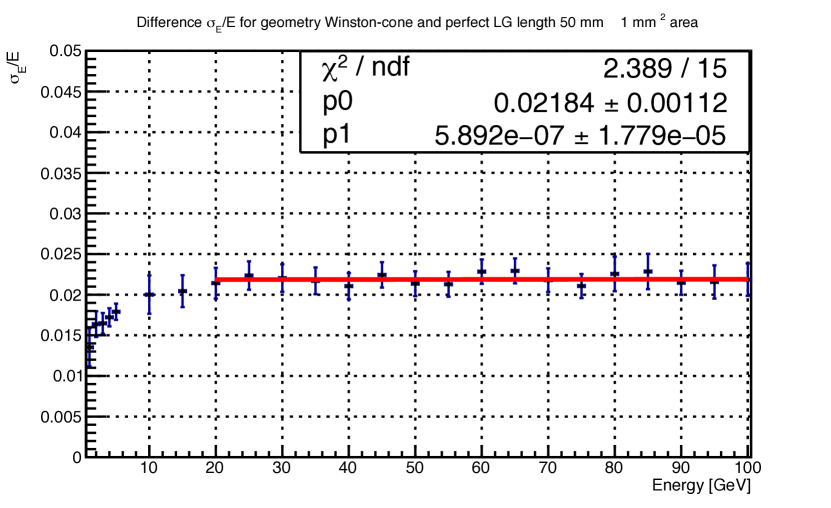
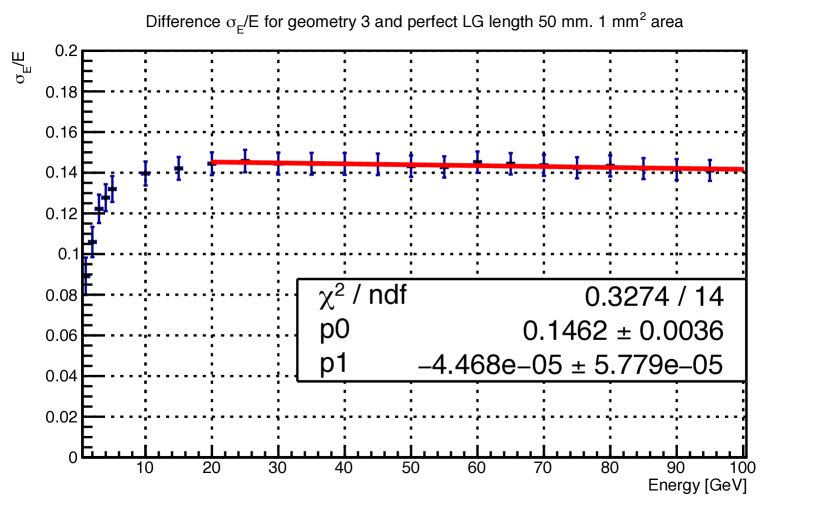
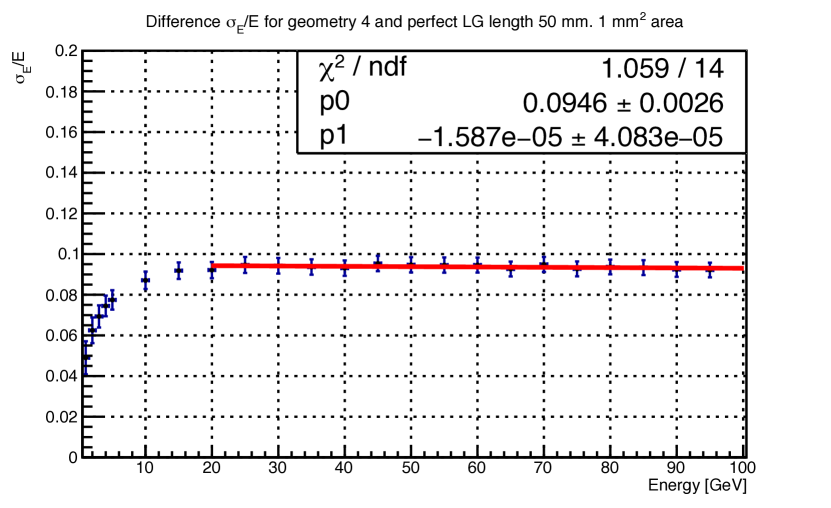
For an ideal LG, with uniform collection from each fiber, energy resolution improves significantly (Figure 11(a)). Figure 12 compares the variation ( in energy resolution between different LG geometries and the perfect LG configuration, it quantifies the impact of non-uniformity on performance. Reducing non-uniformity in light collection across the module can significantly improve energy resolution.
6 Conclusion
By combining the performance of individual cells to assess the whole module, the simulation results showed that deviations from the ideal light guide have an impact on the module’s energy resolution. Table 2 summarizes the energy resolution metrics for various configurations and light guide lengths, reinforcing that uniform light collection is critical to minimizing stochastic and constant terms in the energy resolution.
| Geometry 1 | 20 mm | 30 mm | 40 mm | 50 mm |
|---|---|---|---|---|
| Const term | 0.106 0.001 | 0.073 0.001 | 0.050 0.001 | 0.046 0.001 |
| Stoch term | 0.202 0.005 | 0.175 0.004 | 0.162 0.003 | 0.149 0.005 |
| Geometry 2 | 20 mm | 30 mm | 40 mm | 50 mm |
| Const term | 0.151 0.001 | 0.064 0.001 | 0.039 0.001 | 0.038 0.001 |
| Stoch term | 0.248 0.007 | 0.173 0.003 | 0.160 0.003 | 0.151 0.005 |
| Geometry WC | 20 mm | 30 mm | 40 mm | 50 mm |
| Const term | 0.157 0.001 | 0.064 0.001 | 0.039 0.001 | 0.038 0.001 |
| Stoch term | 0.231 0.002 | 0.172 0.001 | 0.151 0.002 | 0.151 0.002 |
| Geometry 3 | 20 mm | 30 mm | 40 mm | 50 mm |
| Const term | 0.768 0.006 | 0.334 0.003 | 0.216 0.002 | 0.164 0.001 |
| Stoch term | 0.495 0.045 | 0.279 0.017 | 0.220 0.010 | 0.194 0.008 |
| Geometry 4 | 20 mm | 30 mm | 40 mm | 50 mm |
| Const term | 0.674 0.005 | 0.307 0.002 | 0.180 0.001 | 0.113 0.001 |
| Stoch term | 0.511 0.036 | 0.260 0.016 | 0.203 0.009 | 0.175 0.005 |
This study highlights the importance of understanding impact of light guide geometry on non-uniformity in energy reaolution of SpaCal. Even minor improvements in light guide uniformity can lead to significant enhancements in energy resolution. Symmetric designs and longer light guide help achieve near-ideal performance.
Acknowledgments
We thank our colleagues from the LHCb collaboration for their valuable feedback.
References
- [1] Scheel, C.V. (Dec 1994). The spaghetti calorimeter. Research, development, application. http://inis.iaea.org/search/search.aspx?orig_q=RN:27032174
- [2] T. A. Armstrong, K. Barish, S. J. Bennett, T. M. Cormier, R. Cernej, A. Chikanian, S. D. Coe, R. Davies, P. R. Dee and G. E. Diebold, et al. “The E864 lead-scintillating fiber hadronic calorimeter,” Nucl. Instrum. Meth. A 406 (1998), 227-258 doi:10.1016/S0168-9002(98)91984-2
- [3] [LHCb], “Framework TDR for the LHCb Upgrade II: Opportunities in flavour physics, and beyond, in the HL-LHC era,” CERN-LHCC-2021-012.
- [4] S. Kholodenko [LHCb ECAL UII working group], “LHCb ECAL upgrade II,” PoS PANIC2021 (2022), 100 doi:10.22323/1.380.0100
- [5] E. Shmanin, “GEANT4 simulation of energy resolution of the SPACAL electromagnetic calorimeter,” Journal of Physics: Conference Series 1439 no.1 012007 (2020), IOP Publishing
- [6] E. Shmanin, “Simulation Studies of the Lead-Polystyrene SPACAL Prototype for the LHCb ECAL Upgrade II,” Phys. Atom. Nucl. 86 (2023) n o.6, 1444-1449 doi:10.1134/S1063778824010496
- [7] S. Agostinelli et al. [GEANT4], Nucl. Instrum. Meth. A 506 (2003), 250-303 doi:10.1016/S0168-9002(03)01368-8
- [8] J. Allison, K. Amako, J. Apostolakis, H. Araujo, P. A. Dubois, M. Asai, G. Barrand, R. Capra, S. Chauvie and R. Chytracek, et al. IEEE Trans. Nucl. Sci. 53 (2006), 270 doi:10.1109/TNS.2006.869826
- [9] J. Allison, J. Apostolakis, S. B. Lee, K. Amako, S. Chauvie, A. Mantero, J. I. Shin, T. Toshito, P. R. Truscott and T. Yamashita, et al. Nucl. Instrum. Meth. A 835 (2016), 186-225 doi:10.1016/j.nima.2016.06.125