On the Computation of BD-Rate over a Set of Videos
for Fair Assessment of Performance of Learned Video Codecs
Abstract
The Bjøntegaard Delta (BD) measure is widely employed to evaluate and quantify the variations in the rate-distortion (RD) performance across different codecs. Many researchers report the average BD value over multiple videos within a dataset for different codecs. We claim that the current practice in the learned video compression community of computing the average BD value over a dataset based on the average RD curve of multiple videos can lead to misleading conclusions. We show both by analysis of a simplistic case of linear RD curves and experimental results with two recent learned video codecs that averaging RD curves can lead to a single video to disproportionately influence the average BD value especially when the operating bitrate range of different codecs do not exactly match. Instead, we advocate for calculating the BD measure per-video basis, as commonly done by the traditional video compression community, followed by averaging the individual BD values over videos, to provide a fair comparison of learned video codecs. Our experimental results demonstrate that the comparison of two recent learned video codecs is affected by how we evaluate the average BD measure.
Index Terms— rate-distortion performance over a dataset, average bjøntegaard delta metric, learned video compression.
1 Introduction
Comparing performances of different video codecs is a critical yet challenging task. A widely used measure for this purpose is the Bjøntegaard Delta (BD)[1] measure, which calculates the average difference between the rate-distortion (RD) curves of codecs, where the distortion is typically quantified by the peak signal-to noise ratio (PSNR) [2]).
In the classic video compression community, the RD curve and BD metric is typically computed per video. When we compare different codecs over a dataset, we compute the average of the BD rates over individual videos in the dataset. However, in the learned video compression community, a common practice among researchers is to average the RD curves over all videos in a dataset before calculating the BD metric. This approach, while seemingly straightforward, can lead to significant inaccuracies. When RD curves are averaged across videos, even a single video can skew the average RD curve, leading to misleading average BD values. Consequently, a model that performs well on most videos might appear less effective when evaluated on the average RD curve. This issue becomes more prominent when the operating bitrate range of different codecs do not exactly match as we show by the analysis of a simple case in Section 3.
A more accurate and fair assessment can be achieved by calculating the RD curve and the BD metric for each video individually and then averaging BD values, which is a common practice in the classic video compression community. This method ensures that the performance differences are measured consistently across all videos, providing a more reliable comparison of codecs. Furthermore, reporting individual video results avoids the pitfalls associated with averaging RD curves, offering a clearer insight into codec performance.
In the following, after a brief overview of related work in Section 2, we analyze the impact of averaging RD curves on the BD metric in a simplistic case in Section 3. We then provide experimental results to compare two recent learned video codecs in Section 4 showing how averaging RD curves can mislead performance comparisons. We hope that this paper helps improving evaluation practices in the learned video compression community, promoting more accurate and fair comparison of different video compression models by averaging per-video BD values instead of averaging RD curves.
2 Related work and Contributions
Traditional video codecs, such as those described by the High Efficiency Video Coding (HEVC) [3] and the Versatile Video Coding (VVC) [4] standards, have long been the cornerstone of video compression technology. These conventional codecs employ human-engineered algorithms and heuristics to achieve efficient compression by leveraging sophisticated temporal and spatial prediction methods.
In contrast, recent advancements in deep learning lead to learned video compression, which learn the best transform and statistics of the latent variables from large video collections by end-to-end optimization of neural networks. These models have successfully integrated motion compensation and temporal context exploitation, significantly enhancing compression performance[5, 6, 7, 8]. Researchers have introduced innovative concepts, such as conditional coding[9] and advanced entropy modeling[10, 11, 12, 13] to further optimize compression efficiency, while others have explored bi-directional coding strategies that leverage both forward and backward motion compensation[14, 15, 16, 17, 18, 19]. The continuous evolution of these methods reflects a growing interest in achieving greater adaptability and performance, ultimately aiming to surpass the limitations of traditional video coding standards.
Both communities compare performances of different codecs using BD values, but they employ different practices in the computation of BD values over a dataset. Notably, the traditional video coding community compute RD curves and BD values per video and then average the BD values, while the learned video compression community often compute the average of RD curves over the dataset, and then compute a BD value based on the average RD curve.
The main contribution of this paper is to show that computing the average of RD curves is not a reliable method to compare video codecs, and the learned video compression community should also compute RD curves and BD values per video and then average BD values for a fair comparison of learned video codecs. More specifically,
-
•
We provide an analysis of a simplistic scenario of two codecs with linear RD curves in Section 3 to show that averaging RD curves yield inconsistent results when the bitrate ranges of two codecs do not exactly align.
-
•
We provide experimental results in Section 4 to show that computing RD curves and BD values per video and then averaging BD values results in more reliable and fair comparison of two recent learned video codecs.
3 Analysis for a Simple Scenario
We provide analysis for the simple scenario with two hypothetical codecs, codec-1 and codec-2, whose RD curves are linear over the bitrate range of interest for two videos, video-1 and video-2. We assume that the bitrate ranges for both codecs to encode video-1 fully overlap, and both codecs give exactly the same RD points for video-1 with rate and PSNR for . For video-2, let the RD points for codec-1 be , and RD points of codec-2 be for . Here, we assume that the rate points for codec-2 are shifted up by one rate point compared to codec-1. Suppose that the following relationships hold:
| for | ||||
| for | ||||
| for | ||||
| for |
which ensure that the RD curves for both codecs on each video are linear.
The BD-rate for the first video is since RD curves are exactly the same, and for video-2, points overlap making the RD curves on this range the same, thus, resulting in BD-rate on this range. Although the two codecs can be assessed as equivalent in this particular case according to the BD-rates on individual videos, the result can be different when the average RD curve is considered. Since each video has a linear RD curve, the average RD curve is also linear, which can be represented by the equation .
For the first codec, the first two points on the average RD curve are
and
Hence, the slope is .
Similarly, for the second codec, the first two points on the average RD curve are
and
Again, the slope is .
In order to obtain the same BD-rate performance for both codecs, the average RD curves of two codecs must overlap. Therefore, the equation of the lines should be the same. So, if we substitute the first points of the RD curves into the equations for each codec, we have
which implies
| (1) |
and
which implies
| (2) |
If we equate and , we have
| (3) |
Even in this simple case, if a certain condition as in Eq. (3) is not satisfied, then the average of BD-rate for individual videos is not equal to BD-rate calculated from the average RD curves.
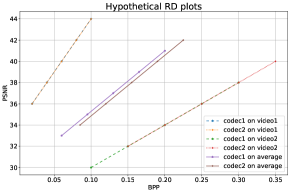
We illustrate the simplistic scenario in the case of hypothetical codecs with linear RD curves in Fig. 1. We depict the RD curves for video-1 on the left, video-2 on the right, and the average RD curves in the middle. These plots illustrate how, even when the codecs exhibit equal performance for each individual video, a violation of the condition stated in Eq. (3) can lead to a misleading conclusion that the average RD curve of one codec to outperform the other.
| Beauty | Bosphorus | Honeybee | Jockey | ReadySetGo | ShakeNDry | YachtRide |
|
|
||||
|---|---|---|---|---|---|---|---|---|---|---|---|---|
| -5.43 | -25.16 | -23.19 | -5.27 | 16.80 | -4.77 | -2.22 | -7.03 | 3.56 |
4 Experiments: Comparison of
Two Learned Video Codecs
4.1 Experimental Setup
We evaluate computing the BD rate over a dataset by averaging per-video BD rates vs. BD rate from the average RD curve to compare two recent learned video compression models: DCVC-DC[13], which performs sequential coding and learned bidirectional coding[19]. We have chosen these two models because, as shown by our results, one model [19] clearly outperforms the other by averaging per-video BD rates, while the average RD curve suggests otherwise.
Test Dataset We benchmarked the models using the UVG dataset[20], which contains seven videos with different characteristics at 1920 1080 resolution and is commonly used for benchmarking video codecs.
4.2 Results
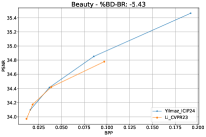
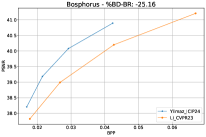
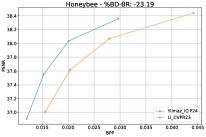
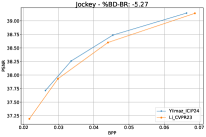
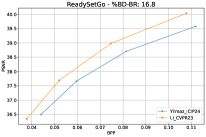
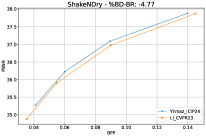
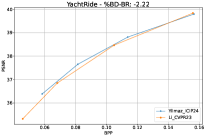
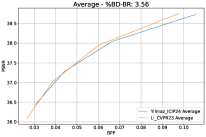
Fig. 2 presents RD curves plotted for four different RD points across two different models, where x and y axes represent bits-per-pixel (bpp) and the PSNR, respectively. The first seven figures display per-video results, while the final figure shows the averaged plot over the UVG dataset, using the four-point averages, as commonly presented in the literature. In these results, the %BD-BR in the headings indicates the percentage rate gain of the Yilmaz_ICIP2024[19] model compared to the Li_CVPR2023[13] model. It is important to note that each video exhibits different bitrate (bpp) and PSNR ranges. For instance, the Beauty sequence, which contains complex and challenging motion patterns, tends to saturate quickly in quality, with limited PSNR improvements at high bitrates. In fact, the maximum PSNR value for the Beauty sequence can be lower than the minimum PSNR value when observed on the average RD curve, despite the sequence having much higher bitrates. This Beauty sequence effectively pulls down the average RD curve. On the other hand, sequences with less motion, such as Bosphorus and Honeybee, are able to achieve high PSNR values even at lower bitrates, and thus have a positive, upward-shifting effect on the average RD curve.
We observe in Fig.2 that Yilmaz_ICIP2024 outperforms Li_CVPR2023 for all sequences except ReadySetGo. When looking at the average Bjøntegaard Delta bitrate (BD-BR) gain across all videos, Yilmaz_ICIP2024 model shows a superior performance of -7.03%. However, if we calculate the BD metric based on the average bpp and PSNR values without accounting for the per-video differences, we may mistakenly conclude that the Yilmaz_ICIP2024 model is 3.56% inferior, as observed in the average RD curve plot. The reason for Yilmaz_ICIP2024 appearing inferior at high bitrates on the average RD curve is twofold: the downward-pull effect of the Beauty sequence, and the fact that the Li_CVPR2023 method has a higher endpoint at 0.1 bpp, 34.75 dB, compared to the Yilmaz_ICIP2024 method endpoint at 0.2 bpp, 35.50 dB.
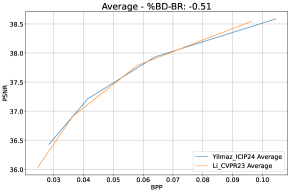
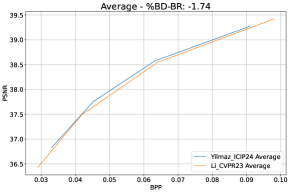
In order to show that computing the average of RD curves leads to inconsistent results, we present Figs. 3 and 4, where the average RD curve is calculated after excluding one sequence from the video set. In Fig. 3, we exclude ReadySetGo sequence, which is the only sequence where Yilmaz_ICIP2024 model is inferior to Li_CVPR2023 model. Despite Yilmaz_ICIP2024 model demonstrates superior performance over Li_CVPR2023 model for each individual sequence used to compute the average curve, the average RD curve for Li_CVPR2023 appears on top at high bitrates, which is clearly an inconsistent result. In Fig. 4, we exclude Beauty sequence. Despite the fact that Yilmaz_2024 model is superior in that sequence, exclusion of the Beauty sequence, which had a downward pull on the average curve, reveals that the Yilmaz_2024 model, which initially appeared inferior in terms of BD-BR (3.56%) when all sequences were included, actually demonstrates superior BD-BR (-1.74%) after exclusion. This result also demonstrates potential misleading nature of averaging RD curves, as it highlights how certain sequences can skew overall performance assessment.
5 Conclusion
This paper shows how using average RD curves can be misleading for the computation of BD-rate over a test set when comparing learned video compression models. To illustrate this more concretely, we analyzed a hypothetical case for two codecs with linear RD curves as well as conducted experiments to compare averaging per-video BD values vs. computing a BD value from the average RD curve for two recent learned codec models on the UVG dataset. Our results revealed that a model that appears inferior when looking at the average RD curve can actually be superior when the per-video results are computed and then averaged. We showed both in the analysis of a simplistic setting and in the experiments with real codecs that averaging RD curves can yield inconsistent and unreliable results. Therefore, we conclude that averaging per-video BD values provides a more fair comparison of learned video codecs, while the performance derived from average RD curves may be misleading. We argue that researchers should carefully consider the findings in this paper as the current practice in the learned video compression community to compute BD rate over a set of videos can lead to misleading conclusions about the relative strengths of different learned video compression models.
References
- [1] G. Bjøntegaard, “Improvements of the BD-PSNR model,” Technical Report, VCEG-AI11, ITU-T SG16/Q6, Berlin, Germany, 2008.
- [2] O. Keleş, M. A. Yilmaz, A. M. Tekalp, C. Korkmaz, and Z. Doğan, “On the computation of PSNR for a set of images or video,” Picture Coding Symposium (PCS), pp. 1–5, 2021.
- [3] G. J. Sullivan, J.-R. Ohm, W.-J. Han, and T. Wiegand, “Overview of the high efficiency video coding (hevc) standard,” IEEE Transactions on Circuits and Systems for Video Technology, vol. 22, no. 12, pp. 1649–1668, 2012.
- [4] B. Bross, Y.-K. Wang, Y. Ye, S. Liu, J. Chen, G. J. Sullivan, and J.-R. Ohm, “Overview of the versatile video coding (vvc) standard and its applications,” IEEE Transactions on Circuits and Systems for Video Technology, vol. 31, no. 10, pp. 3736–3764, 2021.
- [5] E. Agustsson, D. Minnen, N. Johnston, J. Ballé, S. J. Hwang, and G. Toderici, “Scale-space flow for end-to-end optimized video compression,” in IEEE/CVF Conf. Comp. Vis. Patt. Recog. (CVPR), 2020, pp. 8500–8509.
- [6] R. Yang, F. Mentzer, L. Van Gool, and R. Timofte, “Learning for video compression with recurrent auto-encoder and recurrent probability model,” IEEE Jour. of Selected Topics in Signal Processing, vol. 15, no. 2, pp. 388–401, 2021.
- [7] O. Rippel, A. G. Anderson, K. Tatwawadi, S. Nair, C. Lytle, and L. Bourdev, “Elf-vc: Efficient learned flexible-rate video coding,” IEEE/CVF Int. Conf. on Computer Vision (ICCV), 2021.
- [8] Z. Hu, D. Xu, G. Lu, W. Jiang, W. Wang, and S. Liu, “Fvc: An end-to-end framework towards deep video compression in feature space,” IEEE Trans. on Pattern Analysis and Machine Intelligence, pp. 1–17, 2022.
- [9] T. Ladune, P. Philippe, W. Hamidouche, L. Zhang, and O. Déforges, “Conditional coding for flexible learned video compression,” in Neural Compression: From Info. Theory to Applications, ICLR Workshop, 2021.
- [10] J. Li, B. Li, and Y. Lu, “Deep contextual video compression,” Advances in Neural Information Processing Systems, vol. 34, 2021.
- [11] ——, “Hybrid spatial-temporal entropy modelling for neural video compression,” in Proc. of the 30th ACM Int. Conf. on Multimedia, 2022.
- [12] X. Sheng, J. Li, B. Li, L. Li, D. Liu, and Y. Lu, “Temporal context mining for learned video compression,” IEEE Transactions on Multimedia, 2022.
- [13] J. Li, B. Li, and Y. Lu, “Neural video compression with diverse contexts,” in IEEE/CVF Conf. on Comp. Vis. and Patt. Recog. CVPR, Vancouver, Canada, 2023, 2023.
- [14] M. A. Yilmaz and A. M. Tekalp, “End-to-end rate-distortion optimization for bi-directional learned video compression,” in IEEE Int. Conf. on Image Processing (ICIP), 2020, pp. 1311–1315.
- [15] R. Yang, F. Mentzer, L. Van Gool, and R. Timofte, “Learning for video compression with hierarchical quality and recurrent enhancement,” in IEEE/CVF Conf. on Computer Vision and Patt. Recog. (CVPR), 2020.
- [16] M. A. Yılmaz and A. M. Tekalp, “End-to-end rate-distortion optimized learned hierarchical bi-directional video compression,” IEEE Transactions on Image Processing, vol. 31, pp. 974–983, 2022.
- [17] E. Çetin, M. A. Yılmaz, and A. M. Tekalp, “Flexible-rate learned hierarchical bi-directional video compression with motion refinement and frame-level bit allocation,” in IEEE Int. Conf. on Image Processing (ICIP), 2022, pp. 1206–1210.
- [18] M. A. Yılmaz, O. Ugur Ulas, and A. M. Tekalp, “Multi-scale deformable alignment and content-adaptive inference for flexible-rate bi-directional video compression,” in IEEE Int. Conf. on Image Processing (ICIP), 2023, pp. 2475–2479.
- [19] M. A. Yilmaz, O. U. Ulas, A. Bilican, and A. M. Tekalp, “Motion-adaptive inference for flexible learned b-frame compression,” in IEEE Int. Conf. Image Processing (ICIP), 2024. [Online]. Available: https://arxiv.org/abs/2402.08550
- [20] A. Mercat, M. Viitanen, and J. Vanne, “UVG dataset: 50/120fps 4k sequences for video codec analysis and development,” in ACM Multimedia Systems Conference, ser. MMSys ’20, 2020, p. 297–302.