Extremely Dense Gas around Little Red Dots and High-redshift AGNs:
A Non-stellar Origin of the Balmer Break and Absorption Features
Abstract
The James Webb Space Telescope (JWST) has uncovered low-luminosity active galactic nuclei (AGNs) at high redshifts of , powered by accreting black holes (BHs) with masses of . These AGN populations are considered crucial for understanding early BH assembly and coevolution with their host galaxies. One remarkable distinction of these JWST-identified AGNs, compared to their low-redshift counterparts, is that at least of them present H and/or H absorption, which must be associated with extremely dense () gas along the line of sight. These Balmer absorption features unavoidably imply the presence of a Balmer break caused by the same dense gas. In this Letter, we quantitatively demonstrate that a Balmer-break feature can form in AGN spectra without stellar components, when the accretion disk is heavily embedded in dense neutral gas clumps with densities of , where hydrogen atoms are collisionally excited to the states and effectively absorb the AGN continuum at the bluer side of the Balmer limit. The non-stellar origin of a Balmer break offers a potential solution to the large stellar masses and densities inferred for little red dots (LRDs) when assuming that their continuum is primarily due to stellar light. Our calculations of hydrogen-level populations indicate that the observed Balmer absorption blueshifted by a few hundreds suggests the presence of dense outflows at parsec scales in the nucleus. The outflow rate likely exceeds the Eddington accretion rate, driven by powerful radiation from a super-Eddington accretion disk. Other spectral features such as higher equivalent widths of broad H emission and presence of O I lines observed in high-redshift AGNs including LRDs align with the predicted signatures of a dense super-Eddington accretion disk.
1 introduction
The James Webb Space Telescope (JWST) is rapidly advancing our exploration of the high-redshift universe. With its exceptional sensitivity, JWST has uncovered numerous intermediate/low-luminosity active galactic nuclei (AGNs), enabling us to study the representative population of accreting black holes (BHs) at cosmic dawn (e.g., Onoue et al., 2023; Kocevski et al., 2023; Harikane et al., 2023; Maiolino et al., 2023, 2024a).
Among the most intriguing discoveries are very compact, red-colored sources with broad-emission line (FWHM ) features in their spectra (e.g., Labbe et al., 2023; Barro et al., 2024; Matthee et al., 2024; Greene et al., 2024). These so-called “little red dots” (LRDs) are considered to be dust-reddened AGNs at , with bolometric luminosities of powered by massive BHs with , if dust-attenuation correction derived from the red continua in the rest-frame optical bands is applied. Remarkably, the cosmic abundance of these LRDs is one order (or two orders, if the whole AGN population is accounted for) of magnitude higher than what was expected from previous quasar surveys (e.g., Kokorev et al., 2024a; Akins et al., 2024; Kocevski et al., 2024). If all these bright LRDs are indeed AGNs, this would imply that their radiative efficiency is approaching the theoretical limit, requiring a potential re-evaluation of current observations or theoretical models (Inayoshi & Ichikawa, 2024).
Despite their significance, the properties of the newly identified LRDs remain puzzling, particularly regarding the origin of their characteristic v-shaped spectral energy distribution (SED) in the rest-frame UV-to-optical bands (Labbe et al., 2023; Greene et al., 2024; Wang et al., 2024a). Possible explanations for this feature include contributions from galaxies, AGNs, or a combination of both. Recently, deep spectroscopic observations have revealed a prominent drop near the Balmer limit in the continuum spectra of some LRDs (Greene et al., 2024; Furtak et al., 2024; Wang et al., 2024a, b; Baggen et al., 2024; Kokorev et al., 2024b), suggesting a potential contribution from the host galaxy stellar light. This finding is crucial for understanding the energy source of LRDs. If LRDs are powered by dusty starburst galaxies alone, the inferred stellar mass would exceed a few times , and in some cases reach up to , which would conflict with the standard structure formation framework if such huge masses were formed at (Wang et al., 2024b; Akins et al., 2024; Inayoshi & Ichikawa, 2024). Additionally, when combined with the extremely compact sizes, the stellar densities would be so high that velocity dispersions could reach thousands of , a phenomenon never observed in local or lower-redshift galaxies (Baggen et al. 2024; see also Hopkins et al. 2010). Alternatively, if the light redward of the Balmer break originates from a non-stellar source (with stellar light dominating only at shorter wavelengths), the inferred stellar mass could be significantly lowered, on the order of , aligning with structure formation models. However, this scenario would still need an AGN contribution at longer wavelengths to explain the continuum with a steep red color and broad Balmer emission lines. Another interpretation suggests that the UV component of the SED could be influenced by a gray dust attenuation curve, resulting from the deficit of small-size dust grains, which might explain the observed v-shaped SED of LRDs (Li et al., 2024).
Moreover, an independent line of evidence comes from the detailed analysis of broad hydrogen emission lines in AGNs observed by JWST, not only in LRDs but also in unobscured sources (Matthee et al., 2024; Maiolino et al., 2023; Kocevski et al., 2024; Juodžbalis et al., 2024; Lin et al., 2024). These observations reveal slightly blueshifted and narrow absorption on the broad Balmer lines (). The detection of H and H in absorption is remarkable, as the states of atomic hydrogen are very short lived and not metastable. To make such absorption features visible against the Balmer emission profile, extremely high gas densities are required to populate hydrogen atoms into the states. In particular, Juodžbalis et al. (2024) proposed that dense gas clumps with are located in the outer part of the broad-line region with a high covering fraction. In nearby AGNs, Balmer absorption lines are rarely observed with a detection rate of . However, Balmer absorption has been found in at least of broad-line AGNs observed by JWST (see Figure 12 of Lin et al., 2024). Since higher-resolution spectroscopy is required to detect these absorption lines, the fraction of is likely a lower limit, and thus a larger fraction of AGNs are probably buried in dense gas distributed over a wide solid angle.
In this Letter, we demonstrate that a Balmer break feature can form in AGN spectra without stellar components, when the accretion disk is heavily embedded in dense neutral gas clumps with densities of , where hydrogen atoms are collisionally excited to the states and effectively absorb the AGN continuum at the bluer side of the Balmer limit. Under these circumstances, the dense gas clump naturally leads to deep absorption on top of the broad Balmer emission lines as observed in JWST AGNs. We further discuss the physical mechanism of launching dense outflows imprinted in the blueshifted Balmer absorption, and other spectral features of accreting BHs embedded in dense environments.
2 Balmer break
To quantify the SED shape of an attenuated incident flux from the galactic nucleus, we make use of CLOUDY (C17, Ferland et al., 2017) to perform line transfer calculations along with hydrogen level population modeling simultaneously. In our calculation, the incident radiation source is an AGN (an accretion disk and non-thermal radiation) and its spectral shape is assumed to be
| (1) |
where we set the temperature of the big blue bump to 111The characteristic temperature corresponds to the value measured at in an accretion disk around a BH with accreting at the Eddington rate, where is the Schwarzschild radius. Note that the surface temperature profile saturates within and declines toward the inner-most stable circular orbit, where the torque-free boundary conditions are imposed (Novikov & Thorne, 1973). , the UV and X-ray spectral indices to and , and the normalization of is adjusted so that the spectral slope between and keV becomes . The value of is consistent with that of the low-redshift composite quasar SED (Vanden Berk et al., 2001). The X-ray spectral index would be steeper as observed in bright quasars at high redshifts (; Zappacosta et al. 2023), however our results are unaffected by the specific value of the index. The flux density normalization is determined such that the ionization parameter, , falls within , where is the ionizing photon number flux, is the number density of hydrogen nuclei, and is the speed of light. In this study, we adopt as the fiducial choice. Note that the Balmer-break strength varies by depending on the ionization parameter within the range. The distance of the gas absorber derived using is consistent with the cloud kinematics, as discussed in Section 4.1. Furthermore, we assume a visual extinction of mag to reproduce the redness observed in the rest-optical continua for LRDs (Matthee et al., 2024; Greene et al., 2024). With a metallicity of , the column density is set to . We vary the gas density over a broad range of , adjusting the slab thickness (), keeping the column density fixed.
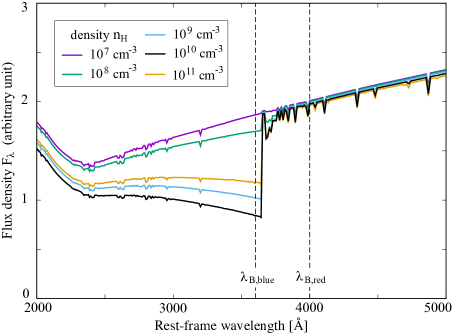
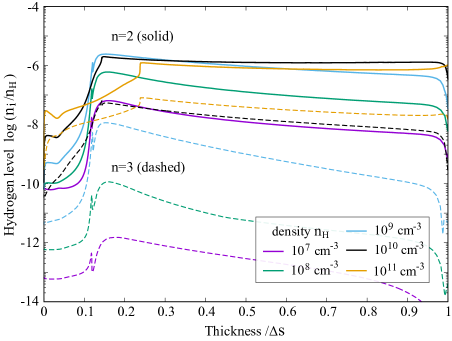
Figure 1 presents the SEDs of an attenuated AGN for various densities of . The case for is not shown, as it is nearly identical to the case for . When the density is or lower, the SED maintains a smooth red continuum at and a slightly blue one at the shorter wavelengths. The bending of the SED at is attributed to the gray dust attenuation curve, though variations in the curve model can lead to different results (Li et al., 2024), which we do not explore in detail here. As the density increases to , the continuum component at wavelengths shorter than the Balmer limit () becomes steeper, and the discontinuity across the Balmer limit reaches its peak around . However, as the density further increases to , the discontinuity weakens but converges in the higher density regime (see below).
Figure 2 shows the number-density ratio of atomic hydrogen in excited states ( with solid and with dashed curves) to the total density of hydrogen nuclei including neutral and ionized states, as a function of slab thickness. At low densities (), the number ratios of excited states in both and increase proportionally with the density, indicating that atomic hydrogen has not reached a local thermodynamic equilibrium state for a given temperature. However, as the density reaches , the ratio of states begins to saturate, approaching the collisional equilibrium value of for . When the density further increases to , the ratio of the state atomic hydrogen also starts to saturate.
Figure 3 presents the Balmer break strength (solid) and the ratio of averaged over thickness (dashed)222Here, we exclude the slab at , where the gas is ionized and the ratio drops substantially. Instead, we calculate the average value for the region at . for each gas density. We here measure the Balmer break strength using the ratio of the fluxes on the blue () and red sides () of the Balmer limit. To compare our result with LRDs that show both broad Balmer lines and a Balmer break in the spectrum reported by Wang et al. (2024b), we adopt and . The flux ratio between the two wavelengths is in the low-density limit (). For , the Balmer break strength reaches values of (shaded region), consistent with the measured strengths for RUBIES-EGS-49140, 55604, and 966323 (Wang et al., 2024b), A2744-QSO1 (Furtak et al., 2024), and GN-72127 (Kokorev et al., 2024b). In the high-density limit of , the Balmer-break strength weakens and approaches a constant value of . This occurs primarily due to a slight temperature decrease in the slab from to as a result of radiative/collisional processes when the density increases. This modest temperature drop (a few percents) reduces the hydrogen population by a factor of 1.5.
This figure also shows that the Balmer break strength has a tight correlation with the hydrogen population. As atomic hydrogen in the gas absorber is effectively populated in the states due to frequent particle collisions in such a dense medium, the attenuated AGN flux naturally produces a Balmer break, analogous to the Lyman break created by neutral atomic hydrogen in the ground state () against ionizing radiation.

3 Balmer absorption
In this section, we examine how H absorption modulates the line profile under the conditions that satisfy the criteria for producing a Balmer break, as discussed in Section 2. The optical depth of a bound-bound transition between two (upper and lower ) energy states of atomic hydrogen is given by
| (2) |
(Draine, 2011), where is the elementary charge, the electron mass, the oscillation strength between the two states, and the wavelength of a photon emitted in the transition. For H ( and ), and (e.g., Drawin, 1969). The optical depth at a frequency near the line center is approximated as , with and , where is the one-dimensional velocity dispersion. Following Juodžbalis et al. (2024), the absorption feature at a wavelength is modeled using the attenuation formula,
| (3) |
where
| (4) |
with representing the velocity shift, where a negative value indicates a blueshift.
We apply the attenuation feature to the broad-line component of the H emission, while excluding the narrow-line component. This approach is based the idea that dense gas clumps are located between the broad-line regions and narrow-line regions (see also Section 4.1), and thus absorb only the broad-line emission component. The H line profile is modeled as
| (5) |
where is a Gaussian function with a mean and dispersion . The parameters and represent the one-dimensional velocity dispersion for the broad and narrow components, respectively, and is the relative ratio between the narrow and broad components before accounting for absorption. In this analysis, we do not consider the continuum flux, for which the same level of attenuation should be applied. In this case, the apparent absorption feature becomes deeper as the unattenuated flux is higher, i.e., .
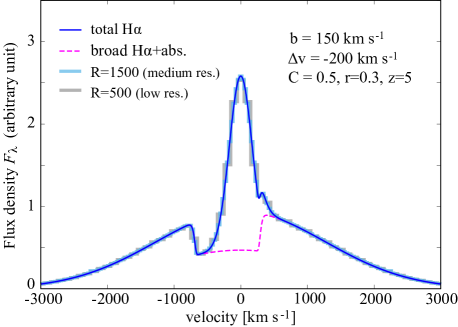
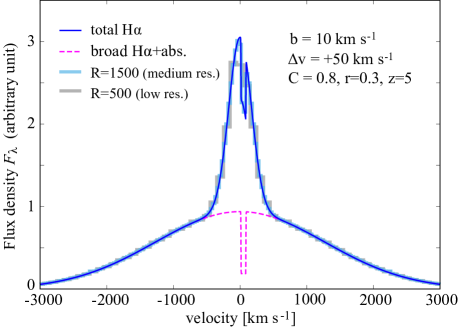
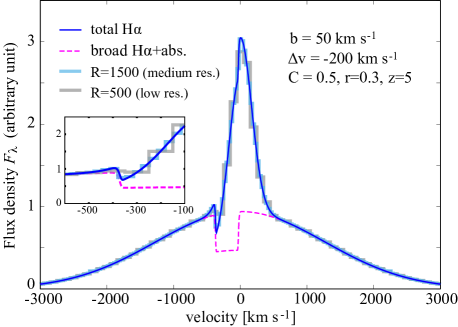
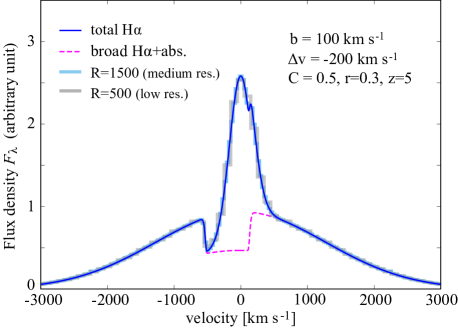
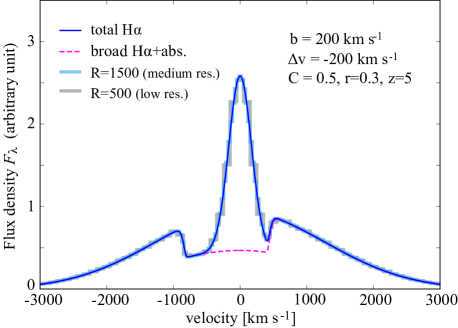
In Figure 4, we present the H line profile with FWHM, FWHM, and . The choice of the FWHM values aligns with the average ones for broad H emission of LRD samples in Matthee et al. (2024). We explore two cases: (1) , , and and (2) , , and . In the first case, the broad emission line shows a saturated, box-shaped absorption profile. Due to the blueshift of the absorption line center, the absorption appears just to the blue side of the line center when combined with the narrow emission line component. In the second case, the absorption depth is more profound because of the narrower absorption width and larger covering fraction. Since the absorption is slightly redshifted, the absorption feature are present on top of the narrow-line emission profile. Those profiles resemble the spectral shapes seen in GOODS-N-9771 and J1148-18404, two LRD samples reported in Matthee et al. (2024), respectively. To explain the line profile of J1148-18404 in our model, a substantially high covering fraction () is needed. Along with the slightly redshifted center (), the absorption may trace dense inflowing gas into the nucleus.
Figure 5 illustrates how the spectral shape changes with different widths of the absorption feature, varying from to . For the case of , the absorption feature is narrow and thus can be resolved with a spectral resolution of (medium resolution). As the width increases and approaches the velocity shift (), absorption begins to affect the redder side of the emission line. In the most extreme case, where the absorption width is significantly large, the absorption profile becomes saturated and box-shaped troughs are imprinted on both blue and red side of the narrow-line emission.
4 Discussion
4.1 Inflow, outflow, and BH feeding rates
Using the properties of dense gas clumps measured from spectral line analyses, one can estimate the mass inflow, outflow, and BH feeding rate. The detection of Balmer absorption blueshifted by suggests the presence of dense neutral outflows in the nucleus. Estimating the maximum outflow velocity as , the outflow condition yields , where is the distance of the dense gas from the central BH with a mass of ,
| (6) |
where and . We note that this distance estimate agrees to that derived from (see Section 2), assuming and the bolometric luminosity to be the Eddington value for .
The mass outflow rate is calculated by
| (7) |
where is the mean molecular weight, and and are set. This outflow rate is times higher than the Eddington accretion rate, . The ratio of is independent of the BH mass. In a steady state, mass conservation gives the BH feeding rate as . When the gas supplying rate from larger radii exceeds the Eddington rate, i.e., , radiation-driven outflows carry the inflowing mass away and decreases the BH feeding rate from the original inflow rate (e.g., Jiang et al., 2014; Yuan & Narayan, 2014). Adopting a mechanical feedback model obtained in radiation hydrodynamic simulations of gas accretion at a vicinity of a BH, the BH feeding rate is given by a scaling relationship of (Hu et al., 2022). Given the formula, the inflow and BH feeding rates can be derived as
| (8) |
for . Thus, the BH in this system grows in mass at a moderately super-Eddington rate.
4.2 Radiative signatures of rapidly growing BHs embedded in dense environments
We have shown that dense circum-nuclear gas can produce a Balmer break in the AGN continuum spectrum and cause absorption in the H and H emission line. Here, we discuss additional features of the spectrum under these circumstances. In conditions of , where H absorption () arises from hydrogen gas in the first-excited states, the Ly-line transition () also occurs frequently but these photons are effectively trapped within such a dense medium. Resonance fluorescence by Ly leads to excitation of neutral oxygen and produces three O I emission lines (1304, 8446, and 11287), owing to a coincidence of energy levels between neutral oxygen and hydrogen (Kwan & Krolik, 1981). The usefulness of these O I emission lines have been noted in Inayoshi et al. (2022b), who studied the accretion process of seed BHs in early protogalaxies by performing radiation hydrodynamic simulations. Their work has claimed that JWST NIRSpec observations of low-ionization O I emission lines can test whether the BH is fed via a dense accretion disk at super-Eddington rates.
Intriguingly, two of the O I emission lines (8446, 11287) have been detected in some JWST-identified AGNs; GN-28074 at (Juodžbalis et al., 2024) and RUBIES-BLAGN-1 at (Wang et al., 2024a)333 GN-28074 shows clear blueshifted absorption features on the H, H, and He I emission lines (Juodžbalis et al., 2024). RUBIES-BLAGN-1 exhibits a strong blueshifted absorption feature in He I , within a wavelength coverage of the G395M spectra. However, The presence of the Balmer absorption in this object remains unclear because of the lower spectral resolution of the PRISM data (Wang et al., 2024a). . For GN-28074, the flux ratio of the O I emission lines is close to unity, indicating that they are likely produced by Ly fluorescense. However, constraints on O I 1304 line are required to establish the Ly pumping scenario in a robust way (Rodríguez-Ardila et al., 2002), while this line is not covered by the wavelength range of the NIRSpec spectrum of GN-28074. Despite the difficulty of confirmation, the Ly fluorescense scenario is consistent with the presence of dense gas optically thick to Balmer lines and photons with shorter wavelengths from the Balmer limit. Similarly, Wang et al. (2024a) also reported the spectrum of an AGN that exhibits both O I 8446 and 11287 lines, though the detailed analysis has not been performed for the O I lines.
Another radiative signature of rapidly accreting BHs is a prominent H emission line with a large equivalent width (EW), which is predicted to be EW due to efficient collisional excitation to states in a dense super-Eddington accretion disk (Inayoshi et al., 2022b). This prediction aligns with observations of JWST-identified AGNs at , which typically show EWs approximately three times higher than those of quasars at lower redshifts of (Maiolino et al., 2024b). The higher EW suggests that the JWST AGN population is embedded by dense gas with a high covering fraction, enhancing the reprocess efficiency of H emission. In addition, super-Eddington accreting (seed) BHs at are expected to be detectable through a unique color excess in the JWST NIRCam/MIRI bands the redshifted H line enters (Inayoshi et al., 2022b). A larger samples of broad-H emitters will bring insights on the properties of JWST-identified AGNs (e.g., H EWs, Eddington ratios, and BH masses; see a recent work by Lin et al. 2024).
4.3 Steepness and depth of a Balmer break
In our model, where JWST AGNs are embedded in very dense gas clumps, the Balmer break-like spectral features observed in some LRDs are attributed to absorption at wavelengths shorter than the Balmer limit by these dense gas clouds. However, the discontinuity in the spectrum near the Balmer limit, as shown in Figure 1, appears more abrupt than what is observed in the PRISM data for these LRDs. This difference arises because our model employs a simplified absorber with a uniform density slab, leading to a nearly isothermal temperature structure () in the neutral region. For comparison, individual stellar spectra with surface temperatures of show a profound and steep Balmer break (Kurucz, 1979; Poggianti & Barbaro, 1997). In contrast, spectra near the Balmer limit in cooler, lower-mass stars are substantially smoother, creating a gradual Balmer break in galaxies where long-lived, low-mass stars dominate the light (e.g., Worthey, 1994). By this analogy, a smooth Balmer break could also be produced in our model if the density structure of absorbers were non-uniform and multi-phased (e.g., Wada et al., 2016), including cooler region. While a detailed analysis of this effect is beyond the scope of our work, future observations that measure the continuum shapes of JWST AGNs in larger samples could potentially constrain the density and temperature structure of the absorbing gas.
4.4 Implications of stellar populations in LRDs and ultra-massive quiescent galaxies at high redshifts
Thus far, we have observed several LRDs that show continuum spectra with a Balmer break. If these LRDs are powered by starbursts alone, an extremely massive stellar mass comparable to that of the Milky Way () would be derived (Furtak et al., 2024; Wang et al., 2024b; Baggen et al., 2024). Considering their high abundance within a cosmic volume (), the inferred stellar mass density would exceed the theoretical upper bound in a flat cold-dark-matter (CDM) universe, with a baryon-to-star conversion factor or (Wang et al., 2024b; Akins et al., 2024). Additionally, in this stellar-origin hypothesis, the very compact nature of LRDs suggests the presence of unrealistically dense stellar clusters in these LRDs, with surface density above (e.g., Baggen et al., 2024), which is one order of magnitude higher than the densest star clusters or the densest elliptical galaxy progenitors (Hopkins et al., 2010; Baggen et al., 2023). If this scenario is true, a large number () of tidal disruption events (TDEs) would be observed even within a small area () of deep JWST surveys (Inayoshi et al., 2024)444Inayoshi et al. (2024) estimated the stellar mass density as , based on the dust mass required to achieve an extinction level of mag, which explains the red continua observed in LRDs. Thus, the predicted TDE detection number is as low as for the JADES-Medium (and COSMOS-Web, respectively)..
In contrast, under the scenario where the Balmer break is caused by gas absorption surrounding the AGN, the stellar mass inferred from SED fitting can be dramatically reduced, thereby resolving the tension with the CDM framework. This interpretation also aligns with the observation that LRD are extremely compact, possibly dominated by an unresolved source in most cases. Moreover, this supports an idea that the BH population at the early epochs tends to be overmassive relative to the mass correlation with their host mass observed in the local universe (e.g., Maiolino et al., 2023; Harikane et al., 2023), as suggested by numerical simulations that sufficiently resolve the galactic nuclear scales at (e.g., Inayoshi et al., 2022a, b).
Additionally, recent JWST observations have revealed very massive quiescent galaxies in the distant universe that have already quenched star formation at (Carnall et al., 2023, 2024; de Graaff et al., 2024; Weibel et al., 2024). Some of these galaxies also show broad H emission, indicating the presence of AGNs (and in others the presence of an AGN cannot be easily excluded). Similar to LRDs, these massive galaxies face the same issue of exceeding the CDM stellar-mass density limit. However, if the Balmer break and absorption features in their spectra are partly due to dense gas absorption, and their continua are contributed by an AGN, this could help alleviate some of the inferred cosmological tensions.
4.5 He I absorption and emission
Similar to Balmer lines, a blueshifted absorption feature is also observed in the He I emission line for the two JWST-identified AGNs, which simultaneously show Balmer absorption (Wang et al., 2024a; Juodžbalis et al., 2024, see discussion in Section 4.2). For the two objects, the velocity shift tends to be larger than that of the Balmer lines. This absorption is caused by the metastable triplet state (or ) for helium with a column density of . Based on photoionization models, He I absorption features consistent with the observations can be reproduced under the conditions where Balmer absorption becomes prominent (Juodžbalis et al., 2024).
We also note that collisional excitation from the metastable state to higher excitation levels can enhance the intensity of three emission lines of He I , , and (corresponding to transitions from the , , states of triplet helium to the lower energy states; see Figure 14.3 and Table 14.5 of Draine 2011). The latter two emission lines are indeed observed in the spectra of the two sources mentioned above, although detailed analyses have not been conducted for the He I emission lines (see Figure 2 of Wang et al. 2024a and Figure 1 of Juodžbalis et al. 2024). Further explorations of the extremely dense interstellar medium within high-redshift AGNs, particularly those identified through JWST observations, will provide deeper insights into the physics of early BH assembly.
References
- Akins et al. (2024) Akins, H. B., Casey, C. M., Lambrides, E., et al. 2024, arXiv e-prints, arXiv:2406.10341, doi: 10.48550/arXiv.2406.10341
- Baggen et al. (2023) Baggen, J. F. W., van Dokkum, P., Labbé, I., et al. 2023, ApJ, 955, L12, doi: 10.3847/2041-8213/acf5ef
- Baggen et al. (2024) Baggen, J. F. W., van Dokkum, P., Brammer, G., et al. 2024, arXiv e-prints, arXiv:2408.07745, doi: 10.48550/arXiv.2408.07745
- Barro et al. (2024) Barro, G., Pérez-González, P. G., Kocevski, D. D., et al. 2024, ApJ, 963, 128, doi: 10.3847/1538-4357/ad167e
- Carnall et al. (2023) Carnall, A. C., McLure, R. J., Dunlop, J. S., et al. 2023, Nature, 619, 716, doi: 10.1038/s41586-023-06158-6
- Carnall et al. (2024) Carnall, A. C., Cullen, F., McLure, R. J., et al. 2024, arXiv e-prints, arXiv:2405.02242, doi: 10.48550/arXiv.2405.02242
- de Graaff et al. (2024) de Graaff, A., Setton, D. J., Brammer, G., et al. 2024, arXiv e-prints, arXiv:2404.05683, doi: 10.48550/arXiv.2404.05683
- Draine (2011) Draine, B. T. 2011, Physics of the Interstellar and Intergalactic Medium
- Drawin (1969) Drawin, H. W. 1969, Zeitschrift fur Physik, 225, 483, doi: 10.1007/BF01392775
- Ferland et al. (2017) Ferland, G. J., Chatzikos, M., Guzmán, F., et al. 2017, Rev. Mexicana Astron. Astrofis., 53, 385. https://arxiv.org/abs/1705.10877
- Furtak et al. (2024) Furtak, L. J., Labbé, I., Zitrin, A., et al. 2024, Nature, 628, 57, doi: 10.1038/s41586-024-07184-8
- Greene et al. (2024) Greene, J. E., Labbe, I., Goulding, A. D., et al. 2024, ApJ, 964, 39, doi: 10.3847/1538-4357/ad1e5f
- Harikane et al. (2023) Harikane, Y., Zhang, Y., Nakajima, K., et al. 2023, ApJ, 959, 39, doi: 10.3847/1538-4357/ad029e
- Hopkins et al. (2010) Hopkins, P. F., Murray, N., Quataert, E., & Thompson, T. A. 2010, MNRAS, 401, L19, doi: 10.1111/j.1745-3933.2009.00777.x
- Hu et al. (2022) Hu, H., Inayoshi, K., Haiman, Z., Quataert, E., & Kuiper, R. 2022, ApJ, 934, 132, doi: 10.3847/1538-4357/ac75d8
- Inayoshi & Ichikawa (2024) Inayoshi, K., & Ichikawa, K. 2024, arXiv e-prints, arXiv:2402.14706, doi: 10.48550/arXiv.2402.14706
- Inayoshi et al. (2024) Inayoshi, K., Kashiyama, K., Li, W., et al. 2024, ApJ, 966, 164, doi: 10.3847/1538-4357/ad344c
- Inayoshi et al. (2022a) Inayoshi, K., Nakatani, R., Toyouchi, D., et al. 2022a, ApJ, 927, 237, doi: 10.3847/1538-4357/ac4751
- Inayoshi et al. (2022b) Inayoshi, K., Onoue, M., Sugahara, Y., Inoue, A. K., & Ho, L. C. 2022b, ApJ, 931, L25, doi: 10.3847/2041-8213/ac6f01
- Jiang et al. (2014) Jiang, Y.-F., Stone, J. M., & Davis, S. W. 2014, ApJ, 796, 106, doi: 10.1088/0004-637X/796/2/106
- Juodžbalis et al. (2024) Juodžbalis, I., Ji, X., Maiolino, R., et al. 2024, arXiv e-prints, arXiv:2407.08643, doi: 10.48550/arXiv.2407.08643
- Kocevski et al. (2023) Kocevski, D. D., Onoue, M., Inayoshi, K., et al. 2023, ApJ, 954, L4, doi: 10.3847/2041-8213/ace5a0
- Kocevski et al. (2024) Kocevski, D. D., Finkelstein, S. L., Barro, G., et al. 2024, arXiv e-prints, arXiv:2404.03576, doi: 10.48550/arXiv.2404.03576
- Kokorev et al. (2024a) Kokorev, V., Caputi, K. I., Greene, J. E., et al. 2024a, ApJ, 968, 38, doi: 10.3847/1538-4357/ad4265
- Kokorev et al. (2024b) Kokorev, V., Chisholm, J., Endsley, R., et al. 2024b, arXiv e-prints, arXiv:2407.20320, doi: 10.48550/arXiv.2407.20320
- Kurucz (1979) Kurucz, R. L. 1979, ApJS, 40, 1, doi: 10.1086/190589
- Kwan & Krolik (1981) Kwan, J., & Krolik, J. H. 1981, ApJ, 250, 478, doi: 10.1086/159395
- Labbe et al. (2023) Labbe, I., Greene, J. E., Bezanson, R., et al. 2023, arXiv e-prints, arXiv:2306.07320, doi: 10.48550/arXiv.2306.07320
- Li et al. (2024) Li, Z., Inayoshi, K., Chen, K., Ichikawa, K., & Ho, L. C. 2024, arXiv e-prints, arXiv:2407.10760, doi: 10.48550/arXiv.2407.10760
- Lin et al. (2024) Lin, X., Wang, F., Fan, X., et al. 2024, arXiv e-prints, arXiv:2407.17570, doi: 10.48550/arXiv.2407.17570
- Maiolino et al. (2023) Maiolino, R., Scholtz, J., Curtis-Lake, E., et al. 2023, arXiv e-prints, arXiv:2308.01230, doi: 10.48550/arXiv.2308.01230
- Maiolino et al. (2024a) Maiolino, R., Scholtz, J., Witstok, J., et al. 2024a, Nature, 627, 59, doi: 10.1038/s41586-024-07052-5
- Maiolino et al. (2024b) Maiolino, R., Risaliti, G., Signorini, M., et al. 2024b, arXiv e-prints, arXiv:2405.00504, doi: 10.48550/arXiv.2405.00504
- Matthee et al. (2024) Matthee, J., Naidu, R. P., Brammer, G., et al. 2024, ApJ, 963, 129, doi: 10.3847/1538-4357/ad2345
- Novikov & Thorne (1973) Novikov, I. D., & Thorne, K. S. 1973, in Black Holes (Les Astres Occlus), 343–450
- Onoue et al. (2023) Onoue, M., Inayoshi, K., Ding, X., et al. 2023, ApJ, 942, L17, doi: 10.3847/2041-8213/aca9d3
- Poggianti & Barbaro (1997) Poggianti, B. M., & Barbaro, G. 1997, A&A, 325, 1025, doi: 10.48550/arXiv.astro-ph/9703067
- Rodríguez-Ardila et al. (2002) Rodríguez-Ardila, A., Viegas, S. M., Pastoriza, M. G., Prato, L., & Donzelli, C. J. 2002, ApJ, 572, 94, doi: 10.1086/340192
- Vanden Berk et al. (2001) Vanden Berk, D. E., Richards, G. T., Bauer, A., et al. 2001, AJ, 122, 549, doi: 10.1086/321167
- Wada et al. (2016) Wada, K., Schartmann, M., & Meijerink, R. 2016, ApJ, 828, L19, doi: 10.3847/2041-8205/828/2/L19
- Wang et al. (2024a) Wang, B., de Graaff, A., Davies, R. L., et al. 2024a, arXiv e-prints, arXiv:2403.02304, doi: 10.48550/arXiv.2403.02304
- Wang et al. (2024b) Wang, B., Leja, J., de Graaff, A., et al. 2024b, ApJ, 969, L13, doi: 10.3847/2041-8213/ad55f7
- Weibel et al. (2024) Weibel, A., de Graaff, A., Setton, D. J., et al. 2024, arXiv e-prints, arXiv:2409.03829, doi: 10.48550/arXiv.2409.03829
- Worthey (1994) Worthey, G. 1994, ApJS, 95, 107, doi: 10.1086/192096
- Yuan & Narayan (2014) Yuan, F., & Narayan, R. 2014, ARA&A, 52, 529, doi: 10.1146/annurev-astro-082812-141003
- Zappacosta et al. (2023) Zappacosta, L., Piconcelli, E., Fiore, F., et al. 2023, A&A, 678, A201, doi: 10.1051/0004-6361/202346795