GeoBEV: Learning Geometric BEV Representation
for Multi-view 3D Object Detection
Abstract
Bird’s-Eye-View (BEV) representation has emerged as a mainstream paradigm for multi-view 3D object detection, demonstrating impressive perceptual capabilities. However, existing methods overlook the geometric quality of BEV representation, leaving it in a low-resolution state and failing to restore the authentic geometric information of the scene. In this paper, we identify the reasons why previous approaches are constrained by low BEV representation resolution and propose Radial-Cartesian BEV Sampling (RC-Sampling), enabling efficient generation of high-resolution dense BEV representations without the need for complex operators. Additionally, we design a novel In-Box Label to substitute the traditional depth label generated from the LiDAR points. This label reflects the actual geometric structure of objects rather than just their surfaces, injecting real-world geometric information into the BEV representation. Furthermore, in conjunction with the In-Box Label, a Centroid-Aware Inner Loss (CAI Loss) is developed to capture the fine-grained inner geometric structure of objects. Finally, we integrate the aforementioned modules into a novel multi-view 3D object detection framework, dubbed GeoBEV. Extensive experiments on the nuScenes dataset exhibit that GeoBEV achieves state-of-the-art performance, highlighting its effectiveness.
1 Introduction
Multi-view 3D object detection stands as a prominent perception paradigm for cost-effective autonomous driving. Presently, many camera-only detectors (Huang et al. 2021; Huang and Huang 2022a; Li et al. 2023c, 2022, b; Yang et al. 2023) transform image features into Bird’s-Eye-View (BEV) space and directly perform detection on the BEV features, demonstrating competitive performance. This illustrates the substantial advantages of BEV representation in preserving comprehensive scene information, making it more adept for vision-centric autonomous driving perception than isolated image features in perspective space (Park et al. 2021; Wang et al. 2021, 2022b, 2022a).
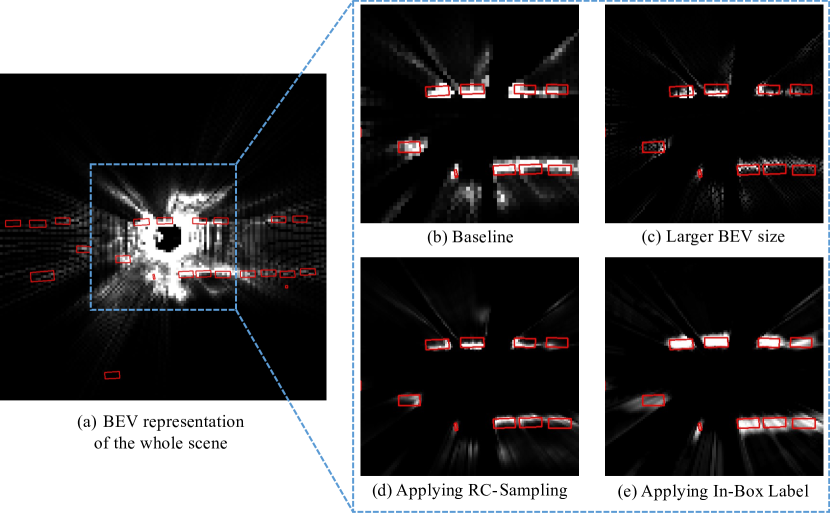
As the cornerstone of BEV-based approaches, the BEV representation embodies both contextual semantic information and depth geometric information. The former is derived from transformed image features, while the latter originates from the correlation between image features and BEV features, calculated using camera parameters. Both types of information are indispensable for precise 3D object detection. However, the geometric quality of BEV representation has never received sufficient attention, and the limitations of low-resolution representations always arise: (1) For LSS-based methods that transform pseudo-points into BEV representation (Xie et al. 2022; Philion and Fidler 2020; Huang et al. 2021; Huang and Huang 2022a), the density imbalance of pseudo-points results in many positions within the BEV representation having vacant features, as depicted in the peripheral areas of Fig. 1(a). Furthermore, the sparsity will further increase along with the resolution of the BEV representation, as shown in Fig. 1(c). (2) For Transformer-based methods that employ cross-attention to retrieve image features (Li et al. 2022; Yang et al. 2023; Jiang et al. 2023; Li et al. 2023a), the elevated resolution of the BEV representation leads to a rapid escalation in computational costs. The lack of explicit depth distribution also limits their ability to restore accurate geometric information. Overall, regardless of the type of method, their respective shortcomings restrict the generation of high-resolution BEV representations, thus compromising the ability to accurately depict objects.
To solve the drawbacks of the existing feature transformation mechanisms, we propose Radial-Cartesian BEV Sampling (RC-Sampling) to efficiently generate dense BEV representation with high resolution. Initially, Radial BEV features are obtained through high-dimensional matrix multiplication between the transposed image features and depth scores. Subsequently, bilinear sampling is employed to retrieve the corresponding Radial BEV features for populating the BEV features in Cartesian coordinates. The sampling procedure mitigates the sparsity of the BEV representation and incurs minimal computational cost even with increased resolution. As shown in Fig. 1(d), applying RC-Sampling effectively avoids the vacant features that appear in Fig. 1(c), enhancing the geometric quality of BEV representations. RC-Sampling outperforms state-of-the-art feature transformation approaches on both precision and efficiency without using complex operators.
Enhancing the accuracy of geometric information is equally crucial for BEV-based approaches. Some methods attempt to supervise predicted depth scores by utilizing the depth values of LiDAR points as depth labels (Reading et al. 2021; Li et al. 2023c, b; Wang et al. 2022c; Zhang et al. 2023a). However, the LiDAR labels only record the depth of object surfaces near the camera, failing to represent the actual geometric structure of objects in the real-world space. We propose In-Box Label that can significantly enhance the geometric quality of BEV representations without adopting extra modules. We first check whether the generated pseudo-points are within the GT boxes to obtain binary labels. These labels, called vanilla In-Box Label, can effectively incentivize the network to assign high depth scores to where the objects are actually located. Nonetheless, they may lead to feature confusion caused by object occlusion or background pseudo-points being wrongly boxed. We ameliorate those issues to enhance its accuracy in reflecting the geometric structure of the scene. In conjunction with the utilization of In-Box Labels, Centroid-Aware Inner Loss is also proposed to capture the fine-grained inner geometric structure of objects. After applying the In-Box Label, the authentic geometric structures of objects are clearly presented as shown in Fig. 1(e), and more precise detection is facilitated.
We integrate the aforementioned modules into a novel multi-view 3D object detector, dubbed GeoBEV, and carry out extensive experiments on the nuScenes dataset. The major contributions of this paper can be summarized as:
-
•
We propose Radial-Cartesian BEV Sampling to conveniently acquire Cartesian BEV features by bilinearly sampling Radial BEV features, which enables the efficient generation of high-resolution dense BEV representations, facilitating the recovery of fine-grained geometric details within the scene.
-
•
We design a novel In-Box Label to supervise the predicted depth score, which better reflects the actual geometric structure of the object than the LiDAR label, injecting authentic geometric information into the BEV representation.
-
•
Extensive experiments are conducted on the nuScenes Dataset, and GeoBEV reaches newly state-of-the-art results for multi-view 3D object detection, highlighting its effectiveness.
2 Related Work
2.1 Depth Prediction Based BEV Representation
Due to the inherent limitations of the image modality in providing the indispensable explicit depth information required for 3D object detection, predicting the depth distribution of image elements becomes a natural choice. Early methods like OFT (Roddick, Kendall, and Cipolla 2018) assume that the depth distribution of image elements is uniform and all voxels along the ray starting from the camera share the same features. Lately, LSS (Philion and Fidler 2020) enables networks to adaptively predict depth distributions and weight image features to generate pseudo-points at corresponding depth values, which are then accumulated into BEV representations. BEVDet (Philion and Fidler 2020) employs LSS to construct the detection framework and proposes a data augmentation strategy on BEV features. BEVDet4D (Huang and Huang 2022a) integrates the BEV features from past frames to assist in predicting the velocity of the objects in the current frame.
In order to obtain more accurate depth information, CaDDN (Reading et al. 2021) projects the LiDAR points onto the image to provide supervision on the predicted depth distribution. BEVDepth (Li et al. 2023c) also considers the influence of the camera’s internal and external parameters and further optimizes the depth distribution after the supervised prediction. BEVStereo (Li et al. 2023b) utilizes the structure of multi-view stereo to obtain more reliable depth distributions and performs some optimizations to minimize memory usage. TiG-BEV (Huang et al. 2022) sets several key points to learn the local depth structure of the scene better. SA-BEV (Zhang et al. 2023a) segments the images to get the foreground-only BEV features and improves depth distribution via multi-task learning. BEV-IO (Zhang et al. 2023b) adopts instance occupancy prediction modules as a complement to depth prediction. FB-BEV (Li et al. 2023d) combines forward and backward projection, compensating for the deficiencies in both existing methods. However, these attempts to optimize depth prediction fail to avoid geometrical fallacies. In this paper, we propose In-Box Labels that contain comprehensive geometric information, significantly enhancing the geometric perception of BEV representation.
2.2 Transformer Based BEV Representation
With the help of the attention mechanism, Transformer-based detectors can adaptively retrieve and combine image features to obtain dense BEV representation. BEVFormer (Li et al. 2022) uses deformable attention to find the corresponding image features, and additionally fuses the BEV representation from previous frames. BEVFormerV2 (Yang et al. 2023) introduces a detection head in perspective view to make the image features that will be retrieved more suitable for 3D detection. PolarFormer (Jiang et al. 2023) argues that polar coordinates are more competent for ego car perception and designs a polar detection head to deal with the irregular polar grids. DFA3D (Li et al. 2023a) utilizes the explicit depth distribution when doing the cross attention from image to BEV and simplifies the 3D Transformer into the 2D Transformer equivalently.
Several Transformer-based detectors regard the objects as queries and do not generate explicit BEV representation. DETR3D (Wang et al. 2022b) follows DETR (Carion et al. 2020; Zhu et al. 2020) series detectors and interacts object queries with multi-view image features to complete the object information for detection. PETR (Liu et al. 2022) embeds 3D position information into the image features, making the object queries easier to obtain spatial information. PETRv2 (Liu et al. 2023a) extends PETR for temporal modeling and adds map queries for other perception tasks. StreamPETR (Wang et al. 2023) propagates long-term historical information and achieves comparable accuracy to classical LiDAR based detectors. Sparse4D (Lin et al. 2022) assigns multiple 4D key points to aggregate multi-view/scale/timestamp image features. Sparse4Dv2 (Lin et al. 2023) uses the recurrent method to realize the transmission of temporal information, avoiding multiple sampling to improve efficiency. Nevertheless, the existing Transformer-based BEV representation methods involve complex computation processes and high latency, making it difficult to generalize to high-resolution BEV feature situations. In this paper, we propose Radial-Cartesian BEV Sampling to efficiently generate high-resolution dense BEV representations, facilitating the recovery of fine-grained geometric details within the scene.
3 Method
3.1 Overall Architecture
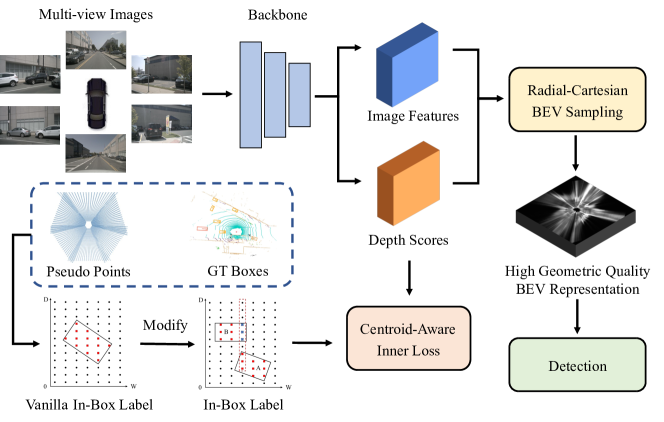
The overall architecture of our proposed GeoBEV is shown in Fig. 2. Firstly, the multi-view images are processed to provide the image features that will be transformed into BEV features and their corresponding depth scores. Then the In-Box Label is created and utilized to supervise the depth scores to restore the actual distribution of the objects in BEV space. The Centroid-Aware Inner Loss is adopted during the depth supervision to let the model learn the inner structure of the objects. Finally, Radial-Cartesian BEV Sampling is proposed to conveniently generate dense BEV representation with high resolution, which effectively saves the fine-grained geometric information of the scene.
3.2 Radial-Cartesian BEV Sampling
Increasing the resolution of BEV features can significantly enhance its detail and make it easier for perception modules to extract fine-grained geometric information. However, the drawbacks of current methods limit the resolution of BEV representations. For LSS-based methods (Li et al. 2023c, b; Zhang et al. 2023a; Li et al. 2023d), the density imbalance of pseudo-points makes the signal strength of BEV features decays from the center to the periphery, and some places even have the vacant features. The sparsity will be further increased for BEV features in high resolution. FB-BEV (Li et al. 2023d) applies backward projection to fill these vacant features but relies on precisely predicting RoI from the sparse BEV features. Transformer-based methods(Li et al. 2022; Yang et al. 2023; Jiang et al. 2023; Qin et al. 2023) can create dense BEV features, but the computational cost increases rapidly when the resolution of BEV features increases.
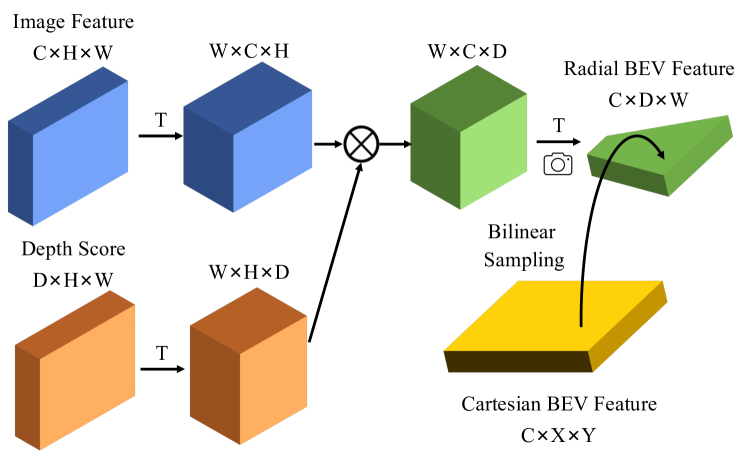
Here, we propose Radial-Cartesian BEV Sampling (RC-Sampling) to conveniently generate dense BEV features with high resolution. The radial BEV features are first obtained by high-dimensional matrix multiplication between transposed image features and the predicted depth scores as shown in Fig. 3. Regardless of batch size, the image features can be denoted as , where represent the channel number, height and weight of the image features. The depth scores can be denoted as , where represents the number of discrete depth values. To get the radial BEV features, the dimension should be squeezed, so that the image features and depth scores are transposed to and respectively. The high-dimensional matrix multiplication is then applied to the last two dimensions of and and a new matrix is created by:
| (1) |
where . After transposing into , the radial BEV features are obtained.
The needs to be transformed into Cartesian coordinates for subsequent detection. We pre-define the coordinates of Cartesian BEV features , where denote the required resolution, and simply project them on the . The bilinear sampling is utilized to retrieve the corresponding features, which can be represented by :
| (2) |
where denotes the coordinates of the projected point on . Using bilinear sampling instead of pooling the sparse pseudo-points guarantees that each position in the BEV representation has valid information. The sampled can represent the geometric information of the scenes well because the explicit depth distribution has already been incorporated into the . When with high resolution are used for perception, the and with high resolution are also required to provide fine-grained geometric information of the scene. In practice, several convolutions are utilized to increase and of and .
Compared with other feature transformation methods, RC-Sampling does not require the generation of memory-expensive 4D frustum features (Reading et al. 2021; Philion and Fidler 2020; Huang et al. 2021), the utilization of deployment-unfriendly custom operators (Li et al. 2023c; Huang and Huang 2022b; Liu et al. 2023b) or the computation-expensive cross-attention mechanism (Li et al. 2022; Yang et al. 2023; Li et al. 2023a). It is entirely the combination of the most basic official operators. RC-Sampling not only shows the advantage of generating high-resolution BEV representation, but also outperforms the state-of-the-art feature transformation methods, such as BEVPoolv2 (Huang and Huang 2022b) and DFA3D (Li et al. 2023a), on both precision and efficiency.
3.3 In-Box Label
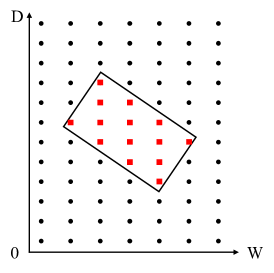
Current LSS-based detectors (Li et al. 2023c, b, d; Zhang et al. 2023a) utilize the depth of LiDAR points as the label to supervise the depth score of each pseudo-point and thus attach the geometric information of the scene to the BEV representation. However, as shown in Fig. 4(a), the LiDAR label only records the depth of the object surfaces closer to the camera, instead of the actual geometric structure of the objects. The lack of objects’ complete geometric information hinders the subsequent BEV encoder and detection head from precisely recognizing their size and orientation. Besides, the LiDAR points do not exactly match pseudo-points in space and will introduce errors that can not be eliminated. To overcome the drawbacks of the LiDAR label, we propose the In-Box Label that can be easily obtained from the 3D coordinate of pseudo-points and the GT boxes.
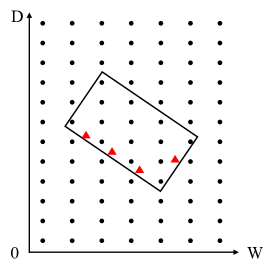
Denote the 3D coordinate of a pseudo-point generated from image features as and the space within a GT box as , then the vanilla In-Box Label of can be formulated as:
| (3) |
where is the total number of GT boxes. It means is regarded as positive if it is within any GT boxes. From Fig. 4(b), it can be found that the In-Box Label describes the actual geometric structure of objects well and can lead the network to fill the GT boxes with valid features in BEV space as shown in Fig. 1(e).
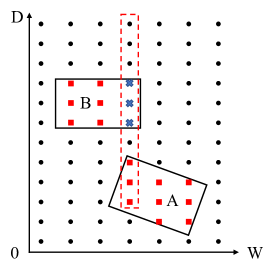
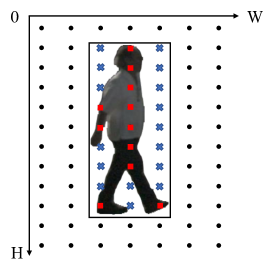
Although the vanilla In-Box Label reflects the actual geometric structure of objects well, it may cause mismatches between image features and BEV representation of objects. For instance, since Object A in Fig. 4(c) is closer to the camera than Object B, the image records the information of Object A when occlusion occurred (occlusion region is shown by red dotted box). If the blue crosses are regarded as positive, the network will be encouraged to give a high depth score there and mix the information of Object A and Object B, which is harmful for precise detection. A better way is not to supervise the pseudo-points within the occluded region and let the network learn to give a proper depth score by itself. A similar situation happens when objects have irregular shapes, as shown in Fig. 4(d). Not all pseudo-points within the box record the information object and they should also be ignored during training. We use the HTC (Chen et al. 2019) pre-trained on nuImages (Caesar et al. 2020) to provide the mask of objects and filter out the background pseudo-points within GT boxes.
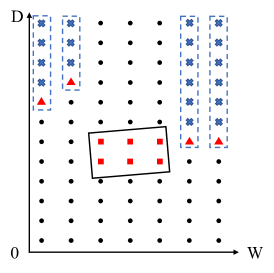
As for the background regions where no GT boxes are available, the LiDAR label is still utilized to supervise the depth scores. It is to make the network learn the whole depth distribution of the scene and locate objects more precisely. Since the LiDAR label reflects the depth of the surfaces while In-Box Label records the actual spatial distribution, we modify the LiDAR label to resolve this divergence between the optimization direction of foreground and background. As shown in Fig. 4(e), we also ignore the pseudo-points behind the background surface, which are used to be regarded as negative. It lets the network adaptively predict how “thick” is the ground and the surrounding buildings and also alleviates the imbalance between the scale of positive and negative.
| Method | Backbone | Image Size | Frames | mAP | NDS | mATE | mASE | mAOE | mAVE | mAAE |
| BEVDet (Huang et al. 2021) | ResNet50 | 256704 | 1 | 0.298 | 0.379 | 0.725 | 0.279 | 0.589 | 0.860 | 0.245 |
| BEVDet4D (Huang and Huang 2022a) | ResNet50 | 256704 | 2‡ | 0.322 | 0.457 | 0.703 | 0.278 | 0.495 | 0.354 | 0.206 |
| PETRv2 (Liu et al. 2023a) | ResNet50 | 256704 | 2 | 0.349 | 0.456 | 0.700 | 0.275 | 0.580 | 0.437 | 0.187 |
| BEVDepth (Li et al. 2023c) | ResNet50 | 256704 | 2 | 0.351 | 0.475 | 0.639 | 0.267 | 0.479 | 0.428 | 0.198 |
| BEVStereo (Li et al. 2023b) | ResNet50 | 256704 | 2 | 0.372 | 0.500 | 0.598 | 0.270 | 0.438 | 0.367 | 0.190 |
| STS (Wang et al. 2022c) | ResNet50 | 256704 | 2 | 0.377 | 0.489 | 0.601 | 0.275 | 0.450 | 0.446 | 0.212 |
| FB-BEV (Li et al. 2023d) | ResNet50 | 256704 | 3 | 0.378 | 0.498 | 0.620 | 0.273 | 0.444 | 0.374 | 0.200 |
| SA-BEV (Zhang et al. 2023a) | ResNet50 | 256704 | 2 | 0.387 | 0.512 | 0.613 | 0.266 | 0.352 | 0.382 | 0.199 |
| GeoBEV | ResNet50 | 256704 | 2 | 0.415 | 0.535 | 0.533 | 0.265 | 0.419 | 0.298 | 0.214 |
| DETR3D (Wang et al. 2022b) | ResNet101 | 9001600 | 1 | 0.349 | 0.434 | 0.716 | 0.268 | 0.379 | 0.842 | 0.200 |
| PETR (Liu et al. 2022) | ResNet101 | 5121408 | 1 | 0.366 | 0.441 | 0.717 | 0.267 | 0.412 | 0.834 | 0.190 |
| PETRv2 (Liu et al. 2023a) | ResNet101 | 900 1600 | 2 | 0.421 | 0.524 | 0.681 | 0.267 | 0.357 | 0.377 | 0.186 |
| BEVDepth (Li et al. 2023c) | ResNet101 | 5121408 | 2 | 0.412 | 0.535 | 0.565 | 0.266 | 0.358 | 0.331 | 0.190 |
| CAPE (Xiong et al. 2023) | ResNet101 | 5121408 | 2‡ | 0.431 | 0.533 | - | - | - | - | - |
| STS (Wang et al. 2022c) | ResNet101 | 5121408 | 2 | 0.431 | 0.542 | 0.525 | 0.262 | 0.380 | 0.369 | 0.204 |
| SA-BEV (Zhang et al. 2023a) | ResNet101 | 5121408 | 2 | 0.441 | 0.549 | - | - | - | - | - |
| GeoBEV | ResNet101 | 5121408 | 2 | 0.479 | 0.582 | 0.498 | 0.254 | 0.335 | 0.285 | 0.204 |
3.4 Centroid-Aware Inner Loss
When replacing the LiDAR label with the In-Box Label, the former depth loss should also be changed. We propose Centroid-Aware Inner Loss (CAI Loss) to cooperate with the characteristics of the In-Box Label, which also encourages the model to learn the inner structure of the objects.
First of all, the activation function of the depth scores is changed. The former methods use softmax as the activation function to match the one-hot LiDAR label. It centralizes the depth score on one specific value by:
| (4) |
where is the raw depth score and is the activated one. When the In-Box Label is utilized, the network should give all the pseudo-points within the GT boxes high depth scores. We choose sigmoid as the activation function to independently normalize the depth scores of each pseudo-point within by:
| (5) |
The type of depth loss is also changed. When using the LiDAR label to supervise the depth scores, the discrete depth values are regarded as different classes and the depth loss is the mean cross entropy loss of every element of image features. But when using the In-Box Label, it turns into a binary classification of every pseudo-points and severe category imbalance occurs. As a result, focal loss (Lin et al. 2017) is adopted to balance the loss of the different classes to achieve better accuracy. The loss can be calculated by:
| (6) |
where and represent the label and the predicted score, and are the adjustable parameters.
Besides the spatial distribution of objects, their inner geometric information can also benefit the detection result. Inspired by Centroid-Aware Sampling (Zhang et al. 2022), we give positive pseudo-points different loss weights according to their relative position in the GT boxes. The Centroid-Aware Inner Weight is calculated by:
| (7) |
where represent the distance of a pseudo-point to the front, back, left, right, up and down surfaces of the GT box, respectively. Only the weight of positive pseudo-points needs to be calculated and the pseudo-point closer to the centroid of an object will have a higher weight as shown in Fig. 4(f). The weights are directly multiplied over the focal loss of positive pseudo-points and the CAI Loss is calculated by:
| (8) |
Using the weighted loss will encourage the pseudo-points near the object centroids to have higher depth scores than the ones near the GT box surfaces. The inner geometric information is thus represented by the depth score differences.
4 Experiments
4.1 Dataset and Metrics
We evaluate our proposed method on the nuScenes (Caesar et al. 2020) dataset, a commonly used large-scale autonomous driving benchmark. It contains diverse 1000 scenarios collected from the real world, each lasting for around 20 seconds. The key samples are annotated at 2Hz and each sample is provided with the data collected from six cameras around the car, one LiDAR on the top of the car and five radars. The 1000 scenarios are split into training set (750 scenarios), validation (150 scenarios) and test set (150 scenarios). The main metric of the nuScenes dataset for 3D object detection is the nuScenes Detection Score (NDS). Except for the commonly used mean average precision (mAP), NDS is also related to five metrics that only take true positive objects into account, including mean Average Translation Error (mATE), mean Average Scale Error (mASE), mean Average Orientation Error (mAOE), mean Average Velocity Error (mAVE), mean Average Attribute Error (mAAE).
| Method | Backbone | Image Size | Frames | mAP | NDS | mATE | mASE | mAOE | mAVE | mAAE |
|---|---|---|---|---|---|---|---|---|---|---|
| FCOS3D (Wang et al. 2021) | ResNet101 | 9001600 | 1 | 0.358 | 0.428 | 0.690 | 0.249 | 0.452 | 1.434 | 0.124 |
| DETR3D (Wang et al. 2022b) | VoVNet-99 | 9001600 | 1 | 0.412 | 0.479 | 0.641 | 0.255 | 0.394 | 0.845 | 0.133 |
| BEVDet (Huang et al. 2021) | Swin-B | 9001600 | 1 | 0.424 | 0.488 | 0.524 | 0.242 | 0.373 | 0.950 | 0.148 |
| PETR (Liu et al. 2022) | VoVNet-99 | 9001600 | 1 | 0.441 | 0.504 | 0.593 | 0.249 | 0.383 | 0.808 | 0.132 |
| BEVFormer (Li et al. 2022) | VoVNet-99 | 9001600 | 4 | 0.481 | 0.569 | 0.582 | 0.256 | 0.375 | 0.378 | 0.126 |
| BEVDet4D (Huang and Huang 2022a) | Swin-B | 6401600 | 2‡ | 0.451 | 0.569 | 0.511 | 0.241 | 0.386 | 0.301 | 0.121 |
| PolarFormer (Jiang et al. 2023) | VoVNet-99 | 9001600 | 2 | 0.493 | 0.572 | 0.556 | 0.256 | 0.364 | 0.440 | 0.127 |
| PETRv2 (Liu et al. 2023a) | VoVNet-99 | 6401600 | 2 | 0.490 | 0.582 | 0.561 | 0.243 | 0.361 | 0.343 | 0.120 |
| BEVDepth (Li et al. 2023c) | VoVNet-99 | 6401600 | 2 | 0.503 | 0.600 | 0.445 | 0.245 | 0.378 | 0.320 | 0.126 |
| BEVStereo (Li et al. 2023b) | VoVNet-99 | 6401600 | 2 | 0.525 | 0.610 | 0.431 | 0.246 | 0.358 | 0.357 | 0.138 |
| CAPE (Xiong et al. 2023) | VoVNet-99 | 6401600 | 2‡ | 0.525 | 0.610 | 0.503 | 0.242 | 0.361 | 0.306 | 0.114 |
| FB-BEV (Li et al. 2023d) | VoVNet-99 | 6401600 | 10 | 0.537 | 0.624 | 0.439 | 0.250 | 0.358 | 0.270 | 0.128 |
| SA-BEV (Zhang et al. 2023a) | VoVNet-99 | 6401600 | 2 | 0.533 | 0.624 | 0.430 | 0.241 | 0.338 | 0.282 | 0.139 |
| GeoBEV | VoVNet-99 | 6401600 | 2 | 0.543 | 0.635 | 0.409 | 0.234 | 0.317 | 0.284 | 0.122 |
| Method | Backbone | Image Size | Frames | mAP | NDS | mATE | mASE | mAOE | mAVE | mAAE |
|---|---|---|---|---|---|---|---|---|---|---|
| BEVFormerv2⋆ (Yang et al. 2023) | ResNet50 | - | - | 0.423 | 0.529 | 0.618 | 0.273 | 0.413 | 0.333 | 0.188 |
| SOLOFusion (Park et al. 2022) | ResNet50 | 256704 | 17 | 0.427 | 0.534 | 0.567 | 0.274 | 0.511 | 0.252 | 0.181 |
| BEVPoolv2 (Huang and Huang 2022b) | ResNet50 | 256704 | 9 | 0.406 | 0.526 | 0.572 | 0.275 | 0.463 | 0.275 | 0.188 |
| VideoBEV (Han et al. 2023) | ResNet50 | 256704 | 8 | 0.422 | 0.535 | 0.564 | 0.276 | 0.440 | 0.286 | 0.198 |
| Sparse4Dv2 (Lin et al. 2023) | ResNet50 | 256704 | - | 0.439 | 0.539 | 0.598 | 0.270 | 0.475 | 0.282 | 0.179 |
| StreamPETR⋆ (Wang et al. 2023) | ResNet50 | 256704 | 8 | 0.450 | 0.550 | 0.613 | 0.267 | 0.413 | 0.265 | 0.196 |
| GeoBEV⋆ | ResNet50 | 256704 | 8 | 0.479 | 0.575 | 0.496 | 0.261 | 0.438 | 0.236 | 0.216 |
4.2 Implementation Details
We adopt the BEVDepth (Li et al. 2023c) as the baseline and add our proposed In-Box Label and Radial-Cartesian BEV Sampling to build GeoBEV. When comparing with state-of-the-art methods, we follow the commonly used configurations. For the experiments on the nuScenes validation set, the ResNet50 and ResNet101 are adopted as the backbone to process the multi-view image downsampled to 256704 and 5121408, respectively. When evaluating on the nuScenes test set, the VoVNet-99 (Lee et al. 2019) pre-trained by DD3D (Park et al. 2021) is adopted as the backbone to process the images cropped to 6401600. These models are trained for 20 epochs with CBGS strategy (Zhu et al. 2019). Except for regular data augmentation in the image and BEV space, the BEV-Paste strategy (Zhang et al. 2023a) is also used to alleviate overfitting during the long training process. For the ablation study, we use ResNet50 (He et al. 2016) as the image backbone and the image size is downsampled to 256704. The models are trained for 24 epochs without the CBGS strategy.
4.3 Main Results
We compare GeoBEV with previous state-of-the-art multi-view 3D detectors on the nuScenes val and test set. The experiment results in Tab. 1 show that GeoBEV achieves the best detection accuracy on nuScenes val set. When detecting from images in 256704 and using ResNet50 as the backbone, GeoBEV outperforms SA-BEV (Zhang et al. 2023a), the previous state-of-the-art, by a significant margin of 2.8% mAP and 2.3% NDS. When increasing image resolution to 5121408 and using ResNet101 as the backbone, GeoBEV stays ahead of the curve and outperforms SA-BEV by 3.8% mAP and 3.3% NDS.
The results of experiments made on the nuScenes test set are shown in Tab. 2. It can be found that GeoBEV also gets the best performance and outperforms SA-BEV by 1.0% mAP and 1.1% NDS. Those persuasive experiment results highlight the effectiveness of GeoBEV.
We also conduct experiments to figure out whether the BEV representations with high-quality geometric information can combine with the long-term temporal fusion strategy and show the results in Table 3. When using 7 past frames with an interval of 0.5 second to supplement the current scenes, GeoBEV exceeds state-of-the-art long-term temporal methods and outperforms StreamPETR (Wang et al. 2023) by 2.9% mAP and 2.5% NDS.
4.4 Ablation Study
Component Analysis
We evaluate the contributions of our proposed components and show the results in Tab. 4. It can be found that both RC-Sampling and In-Box Label effectively increase the detection accuracy. RC-Sampling increases 2.6% mAP and 3.3% NDS compared to the baseline. Applying In-Box Label and CAI Loss also boosts the performance by 2.2% mAP and 2.2% NDS. After combining the two components, the performance is increased by 4.4% mAP and 4.4% NDS in total.
| Baseline | RC-Sampling | In-Box | mAP | NDS |
|---|---|---|---|---|
| BEVDepth | 0.337 | 0.456 | ||
| ✓ | 0.363 | 0.489 | ||
| ✓ | 0.359 | 0.478 | ||
| ✓ | ✓ | 0.381 | 0.500 |
| Method | BEV Size | DS | mAP | NDS | FPS |
| BEVPoolv2 | 128128 | 16 | 0.337 | 0.456 | 22.7 |
| 256256 | 16 | 0.344 | 0.474 | 16.6 | |
| DFA3D | 128128 | 16 | 0.335 | 0.455 | 20.2 |
| 256256 | 16 | 0.344 | 0.469 | 11.7 | |
| RC-Sampling | 128128 | 16 | 0.344 | 0.465 | 24.8 |
| 256256 | 16 | 0.358 | 0.482 | 17.4 | |
| 256256 | 8 | 0.363 | 0.489 | 17.0 |
Radial-Cartesian BEV Sampling
To evaluate the capacity of RC-Sampling, we compare it with the most efficient LSS-based and Transformer-based feature transformation methods. BEVPoolv2 (Huang and Huang 2022b) and DFA3D (Li et al. 2023a) are chosen as the representatives respectively. From the experiment results in Tab. 5, it can be found the detection accuracy of RC-Sampling outperforms both BEVPoolv2 and DFA3D in generating BEV representations with different resolutions. Besides, RC-Sampling exhibits better real-time performance and achieves the best FPS under the same configuration as other methods. The resolution of depth scores also influences the geometric quality of BEV representations, so we upsample the size of depth scores by utilizing several convolutions to provide fine-grained geometry information to RC-Sampling, which further increases the performance by 0.5% mAP and 0.7% NDS without significantly affects its efficiency.
| Label | Sigmoid | Focal | CAI | mAP | NDS |
|---|---|---|---|---|---|
| LiDAR | 0.337 | 0.456 | |||
| Vanilla In-Box | 0.345 | 0.464 | |||
| ✓ | 0.347 | 0.466 | |||
| ✓ | ✓ | 0.351 | 0.470 | ||
| In-Box | ✓ | ✓ | 0.356 | 0.474 | |
| ✓ | ✓ | 0.359 | 0.478 |
In-Box Label
We conduct experiments to evaluate different configurations when applying the In-Box Label as in Tab. 6. When simply replacing the LiDAR label with the vanilla In-Box Label, the performance is increased by 0.8% mAP and 0.8% NDS. It is further improved by 0.2% mAP / 0.2% NDS and 0.4% mAP / 0.4% NDS after using sigmoid as the activation function and letting the depth scores supervised by focal loss. We also compare the performance between vanilla In-Box Label and complete In-Box Label, the results show that the In-Box Label is more in line with the real world and has an advantage of 0.5% mAP and 0.4% NDS. When replacing Focal Loss with Centroid-Aware Inner Loss, there is another 0.3% mAP and 0.4% NDS improvement, which illustrates that inner geometric structure is helpful for the detection.
5 Conclusion
In this paper, we propose a novel multi-view 3D object detector, namely GeoBEV, which generates BEV representation that restores authentic geometric information of the scene. The Radial-Cartesian BEV Sampling simply does high-dimensional matrix multiplication between transposed image features and depth scores to obtain Radial BEV features, which are then transformed into Cartesian BEV features by bilinear sampling. This approach can rapidly generate high-resolution BEV representations while effectively avoiding the presence of vacant feature values. Based on the physics of the real world, In-Box Label can reflect the actual geometric structure of objects, effectively improving the accuracy of the information carried by BEV representation. Centroid-Aware Inner Loss cooperates with In-Box Label to make full of its advantage and also encourages the network to learn the inner geometry of objects.
We conduct extensive experiments on nuScenes dataset and GeoBEV reaches a new state-of-the-art, highlighting the effectiveness of Radial-Cartesian BEV Sampling and In-Box Label. Theoretically, these components can be easily integrated into many existing BEV-based detectors, improving the geometry quality of BEV representation and increasing the detection performance.
References
- Caesar et al. (2020) Caesar, H.; Bankiti, V.; Lang, A. H.; Vora, S.; Liong, V. E.; Xu, Q.; Krishnan, A.; Pan, Y.; Baldan, G.; and Beijbom, O. 2020. nuscenes: A multimodal dataset for autonomous driving. In Proceedings of the IEEE/CVF conference on computer vision and pattern recognition, 11621–11631.
- Carion et al. (2020) Carion, N.; Massa, F.; Synnaeve, G.; Usunier, N.; Kirillov, A.; and Zagoruyko, S. 2020. End-to-end object detection with transformers. In European conference on computer vision, 213–229. Springer.
- Chen et al. (2019) Chen, K.; Pang, J.; Wang, J.; Xiong, Y.; Li, X.; Sun, S.; Feng, W.; Liu, Z.; Shi, J.; Ouyang, W.; et al. 2019. Hybrid task cascade for instance segmentation. In Proceedings of the IEEE/CVF conference on computer vision and pattern recognition, 4974–4983.
- Han et al. (2023) Han, C.; Sun, J.; Ge, Z.; Yang, J.; Dong, R.; Zhou, H.; Mao, W.; Peng, Y.; and Zhang, X. 2023. Exploring recurrent long-term temporal fusion for multi-view 3d perception. arXiv preprint arXiv:2303.05970.
- He et al. (2016) He, K.; Zhang, X.; Ren, S.; and Sun, J. 2016. Deep residual learning for image recognition. In Proceedings of the IEEE conference on computer vision and pattern recognition, 770–778.
- Huang and Huang (2022a) Huang, J.; and Huang, G. 2022a. Bevdet4d: Exploit temporal cues in multi-camera 3d object detection. arXiv preprint arXiv:2203.17054.
- Huang and Huang (2022b) Huang, J.; and Huang, G. 2022b. Bevpoolv2: A cutting-edge implementation of bevdet toward deployment. arXiv preprint arXiv:2211.17111.
- Huang et al. (2021) Huang, J.; Huang, G.; Zhu, Z.; Ye, Y.; and Du, D. 2021. Bevdet: High-performance multi-camera 3d object detection in bird-eye-view. arXiv preprint arXiv:2112.11790.
- Huang et al. (2022) Huang, P.; Liu, L.; Zhang, R.; Zhang, S.; Xu, X.; Wang, B.; and Liu, G. 2022. Tig-bev: Multi-view bev 3d object detection via target inner-geometry learning. arXiv preprint arXiv:2212.13979.
- Jiang et al. (2023) Jiang, Y.; Zhang, L.; Miao, Z.; Zhu, X.; Gao, J.; Hu, W.; and Jiang, Y.-G. 2023. Polarformer: Multi-camera 3d object detection with polar transformer. In Proceedings of the AAAI Conference on Artificial Intelligence, volume 37, 1042–1050.
- Lee et al. (2019) Lee, Y.; Hwang, J.-w.; Lee, S.; Bae, Y.; and Park, J. 2019. An energy and GPU-computation efficient backbone network for real-time object detection. In Proceedings of the IEEE/CVF conference on computer vision and pattern recognition workshops, 0–0.
- Li et al. (2023a) Li, H.; Zhang, H.; Zeng, Z.; Liu, S.; Li, F.; Ren, T.; and Zhang, L. 2023a. DFA3D: 3D Deformable Attention For 2D-to-3D Feature Lifting. In Proceedings of the IEEE/CVF International Conference on Computer Vision, 6684–6693.
- Li et al. (2023b) Li, Y.; Bao, H.; Ge, Z.; Yang, J.; Sun, J.; and Li, Z. 2023b. Bevstereo: Enhancing depth estimation in multi-view 3d object detection with temporal stereo. In Proceedings of the AAAI Conference on Artificial Intelligence, volume 37, 1486–1494.
- Li et al. (2023c) Li, Y.; Ge, Z.; Yu, G.; Yang, J.; Wang, Z.; Shi, Y.; Sun, J.; and Li, Z. 2023c. Bevdepth: Acquisition of reliable depth for multi-view 3d object detection. In Proceedings of the AAAI Conference on Artificial Intelligence, volume 37, 1477–1485.
- Li et al. (2022) Li, Z.; Wang, W.; Li, H.; Xie, E.; Sima, C.; Lu, T.; Qiao, Y.; and Dai, J. 2022. Bevformer: Learning bird’s-eye-view representation from multi-camera images via spatiotemporal transformers. In European conference on computer vision, 1–18. Springer.
- Li et al. (2023d) Li, Z.; Yu, Z.; Wang, W.; Anandkumar, A.; Lu, T.; and Alvarez, J. M. 2023d. Fb-bev: Bev representation from forward-backward view transformations. In Proceedings of the IEEE/CVF International Conference on Computer Vision, 6919–6928.
- Lin et al. (2017) Lin, T.-Y.; Goyal, P.; Girshick, R.; He, K.; and Dollár, P. 2017. Focal loss for dense object detection. In Proceedings of the IEEE international conference on computer vision, 2980–2988.
- Lin et al. (2022) Lin, X.; Lin, T.; Pei, Z.; Huang, L.; and Su, Z. 2022. Sparse4d: Multi-view 3d object detection with sparse spatial-temporal fusion. arXiv preprint arXiv:2211.10581.
- Lin et al. (2023) Lin, X.; Lin, T.; Pei, Z.; Huang, L.; and Su, Z. 2023. Sparse4D v2: Recurrent Temporal Fusion with Sparse Model. arXiv preprint arXiv:2305.14018.
- Liu et al. (2022) Liu, Y.; Wang, T.; Zhang, X.; and Sun, J. 2022. Petr: Position embedding transformation for multi-view 3d object detection. In European Conference on Computer Vision, 531–548. Springer.
- Liu et al. (2023a) Liu, Y.; Yan, J.; Jia, F.; Li, S.; Gao, A.; Wang, T.; and Zhang, X. 2023a. Petrv2: A unified framework for 3d perception from multi-camera images. In Proceedings of the IEEE/CVF International Conference on Computer Vision, 3262–3272.
- Liu et al. (2023b) Liu, Z.; Tang, H.; Amini, A.; Yang, X.; Mao, H.; Rus, D. L.; and Han, S. 2023b. Bevfusion: Multi-task multi-sensor fusion with unified bird’s-eye view representation. In 2023 IEEE international conference on robotics and automation (ICRA), 2774–2781. IEEE.
- Park et al. (2021) Park, D.; Ambrus, R.; Guizilini, V.; Li, J.; and Gaidon, A. 2021. Is pseudo-lidar needed for monocular 3d object detection? In Proceedings of the IEEE/CVF International Conference on Computer Vision, 3142–3152.
- Park et al. (2022) Park, J.; Xu, C.; Yang, S.; Keutzer, K.; Kitani, K.; Tomizuka, M.; and Zhan, W. 2022. Time will tell: New outlooks and a baseline for temporal multi-view 3d object detection. arXiv preprint arXiv:2210.02443.
- Philion and Fidler (2020) Philion, J.; and Fidler, S. 2020. Lift, splat, shoot: Encoding images from arbitrary camera rigs by implicitly unprojecting to 3d. In Computer Vision–ECCV 2020: 16th European Conference, Glasgow, UK, August 23–28, 2020, Proceedings, Part XIV 16, 194–210. Springer.
- Qin et al. (2023) Qin, Z.; Chen, J.; Chen, C.; Chen, X.; and Li, X. 2023. Unifusion: Unified multi-view fusion transformer for spatial-temporal representation in bird’s-eye-view. In Proceedings of the IEEE/CVF International Conference on Computer Vision, 8690–8699.
- Reading et al. (2021) Reading, C.; Harakeh, A.; Chae, J.; and Waslander, S. L. 2021. Categorical depth distribution network for monocular 3d object detection. In Proceedings of the IEEE/CVF Conference on Computer Vision and Pattern Recognition, 8555–8564.
- Roddick, Kendall, and Cipolla (2018) Roddick, T.; Kendall, A.; and Cipolla, R. 2018. Orthographic feature transform for monocular 3d object detection. arXiv preprint arXiv:1811.08188.
- Wang et al. (2023) Wang, S.; Liu, Y.; Wang, T.; Li, Y.; and Zhang, X. 2023. Exploring object-centric temporal modeling for efficient multi-view 3d object detection. In Proceedings of the IEEE/CVF International Conference on Computer Vision, 3621–3631.
- Wang et al. (2022a) Wang, T.; Xinge, Z.; Pang, J.; and Lin, D. 2022a. Probabilistic and geometric depth: Detecting objects in perspective. In Conference on Robot Learning, 1475–1485. PMLR.
- Wang et al. (2021) Wang, T.; Zhu, X.; Pang, J.; and Lin, D. 2021. Fcos3d: Fully convolutional one-stage monocular 3d object detection. In Proceedings of the IEEE/CVF International Conference on Computer Vision, 913–922.
- Wang et al. (2022b) Wang, Y.; Guizilini, V. C.; Zhang, T.; Wang, Y.; Zhao, H.; and Solomon, J. 2022b. Detr3d: 3d object detection from multi-view images via 3d-to-2d queries. In Conference on Robot Learning, 180–191. PMLR.
- Wang et al. (2022c) Wang, Z.; Min, C.; Ge, Z.; Li, Y.; Li, Z.; Yang, H.; and Huang, D. 2022c. Sts: Surround-view temporal stereo for multi-view 3d detection. arXiv preprint arXiv:2208.10145.
- Xie et al. (2022) Xie, E.; Yu, Z.; Zhou, D.; Philion, J.; Anandkumar, A.; Fidler, S.; Luo, P.; and Alvarez, J. M. 2022. M2BEV: Multi-Camera Joint 3D Detection and Segmentation with Unified Birds-Eye View Representation. arXiv preprint arXiv:2204.05088.
- Xiong et al. (2023) Xiong, K.; Gong, S.; Ye, X.; Tan, X.; Wan, J.; Ding, E.; Wang, J.; and Bai, X. 2023. Cape: Camera view position embedding for multi-view 3d object detection. In Proceedings of the IEEE/CVF Conference on Computer Vision and Pattern Recognition, 21570–21579.
- Yang et al. (2023) Yang, C.; Chen, Y.; Tian, H.; Tao, C.; Zhu, X.; Zhang, Z.; Huang, G.; Li, H.; Qiao, Y.; Lu, L.; et al. 2023. BEVFormer v2: Adapting Modern Image Backbones to Bird’s-Eye-View Recognition via Perspective Supervision. In Proceedings of the IEEE/CVF Conference on Computer Vision and Pattern Recognition, 17830–17839.
- Zhang et al. (2023a) Zhang, J.; Zhang, Y.; Liu, Q.; and Wang, Y. 2023a. SA-BEV: Generating Semantic-Aware Bird’s-Eye-View Feature for Multi-view 3D Object Detection. In Proceedings of the IEEE/CVF International Conference on Computer Vision, 3348–3357.
- Zhang et al. (2022) Zhang, Y.; Hu, Q.; Xu, G.; Ma, Y.; Wan, J.; and Guo, Y. 2022. Not all points are equal: Learning highly efficient point-based detectors for 3d lidar point clouds. In Proceedings of the IEEE/CVF Conference on Computer Vision and Pattern Recognition, 18953–18962.
- Zhang et al. (2023b) Zhang, Z.; Wang, L.; Wang, Y.; and Lu, H. 2023b. BEV-IO: Enhancing Bird’s-Eye-View 3D Detection with Instance Occupancy. arXiv preprint arXiv:2305.16829.
- Zhu et al. (2019) Zhu, B.; Jiang, Z.; Zhou, X.; Li, Z.; and Yu, G. 2019. Class-balanced grouping and sampling for point cloud 3d object detection. arXiv preprint arXiv:1908.09492.
- Zhu et al. (2020) Zhu, X.; Su, W.; Lu, L.; Li, B.; Wang, X.; and Dai, J. 2020. Deformable DETR: Deformable Transformers for End-to-End Object Detection. In International Conference on Learning Representations.