Revisiting collisional broadening of 85Rb Rydberg levels: conclusions for vapor cell manufacture
Abstract
Electrometry based on electromagnetically induced transparency (EIT) in alkali Rydberg vapor cells may suffer reduced sensitivity due to spurious line broadening effects, caused by surface charges, contaminant gases, or other manufacturing defects. In order to draw conclusions about the deleterious effects of potential contaminant gases inside Rydberg electrometry vapor cells, we revisit collisional broadening and shifts of both the D2 line and Rydberg levels of rubidium. Specifically, we measure the broadening and shifts of the (i.e., the D2 line) and transitions of 85Rb due to He, Ne, N2 and Ar. By combining these measurements with observations of velocity changing collisions in the sub-Doppler spectrum of the D2 line, we conclude the following: (1) that contaminant gases are most likely not the cause of irregular line shapes or shifts of Rydberg transitions due to the high pressures required, and (2) the sub-Doppler spectrum of the D2 line, through its accompanying loss of contrast at high pressures, can validate that a vapor cell is sufficiently free of contaminant gas for EIT electrometry. We use the theory of Omont, J. Phys. France 38, 1343 (1977), to extend our results to a wide variety of possible contaminant gases and further derive scaling laws applicable to all gases.
I Introduction
With the advent of Rydberg atom-based RF electrometry, much interest has been given to the need to create high-quality vapor cells that have unperturbed Rydberg spectral lines [1, 2, 3, 4, 5]. The high polarizability of Rydberg states enables exquisite RF electric field sensitivity [6], but also enhances the perturbations due to background electric fields, contaminant gases, and other systematics. Here we revisit the effect of contaminant gases on the quality of Rydberg spectral lines. We find: (1) contaminant gases are most likely not the cause of irregular electromagnetically induced transparency (EIT) line shapes in vapor cells, as roughly 0.02 mbar of contaminant gas would be required to add roughly 1 MHz of additional broadening. (2) if contaminant gases are to blame, then similar degradation of signal will occur in standard saturation-absorption spectroscopy at similar pressures when using millimeter-sized beams. We specifically investigated the four background gases N2, He, Ne, and Ar. We further generalize our results for all possible contaminant gases.
Collisional broadening and shifts of high-lying transitions in alkali atoms have been studied for almost a century. The first reported measurement by Amaldi and Sergè [7] observed the shift in Na transitions due to H2 gas. A series of measurements by Fuchtbauer et al. [8, 9, 10] used a heat pipe, a hydrogen lamp, and a spectrograph to measure the shift and broadening of Na, K, and Cs high-lying P states perturbed by He, Ne, N2, Ar, Kr, Xe, and Hg. As pointed out by Fermi [11], the shifts of high-lying Rydberg states should be independent of principal quantum number and even the alkali species. Rather, the shifts only depend on the s-wave scattering length of an electron from the perturber gas and the polarizability of the perturber. Fuchtbauer applied Fermi’s theory to estimate for He, Ne, Ar, and N2 and his results were found to be in good agreement with other estimates of [12]. With the advent of laser spectroscopy, more precise experimental work on pressure shifts of Rb Rydberg atoms includes He, Ne, Kr, Ar, and Xe [13]; He and Ar [14]; He, Ar, and Xe [15]; and Ne, Kr, and H2[16]. These works all used direct, two-photon excitation of the excited state.
Likewise, the effects of collisions on the transition (i.e., the D2 line) of Rb has been studied extensively. Shang-Yi [17] did the first measurements of the broadening and shift of the D2 line due to He, Ar, and H2 gases using a specially constructed vapor cell that could withstand up to 100 bar of the perturber gas. Absorption line centers, widths, and asymmetries were measured by illuminating the cell with a Ti filament lamp and measuring the absorption through the cell using a grating. Laser spectroscopy enabled further, higher precision investigations. Ottinger et al.[18] studied the effect of He, Ne, Ar, Kr, and Xe on both the D1 and D2 lines. This study was followed by several more including with Xe, N2 and CH4 [19]; He, Ne, Ar, Kr, and Xe [20]; He, Ne, Ar, Kr, and Xe looking at the wings of absorption profiles [21]; H2, D2, N2, CH4, and CF4 on both the D1 and D2 lines [22]; 3He, 4He, N2, and Xe on both the D1 and D2 lines [23]; 3He and N2 on both the D1 and D2 lines [24]; and Ne, Xe, N2 on the D1 line [25]. For all of the above studies, pressures of 1 bar to 100 bar were used, and no sub-Doppler features were resolved. Sargsyan et al. [26] measured collisional shifts due to Ne with EIT sub-Doppler effects. To the authors’ surprise, we could find no studies using the sub-Doppler features of standard saturated absorption spectroscopy [27] to measure the collisional broadening and shifts of either the D1 or D2 line.
Here, we fuse together knowledge of D2 collisional broadening and shifts, sub-Doppler spectroscopy, and Rydberg collisional broadening and shifts to draw conclusions for the manufacture and testing of vapor cells for Rydberg electrometry. We experimentally measure collisional shifts due to He, Ne, N2 and Ar on both the D2 line using sub-Doppler spectroscopy and select Rydberg states of 85Rb using EIT. We observe that the effect of velocity changing collisions [28, 29, 30, 31], which reduces the contrast of the sub-Doppler Lamb dips, appears at the same order of magnitude of pressure as Rydberg collisional broadening. Finally, we use theory to expand and scale our results to other gases and justify our conclusions.
II Experimental Apparatus
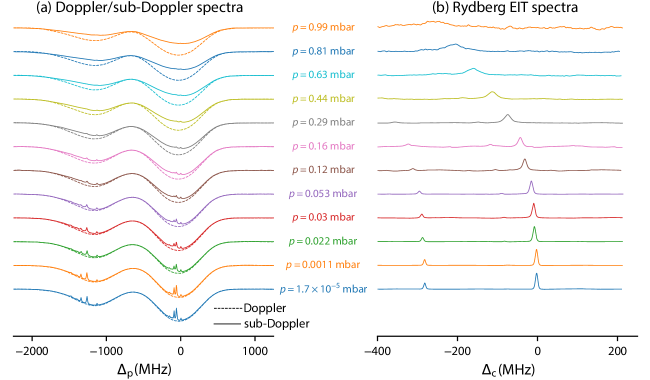
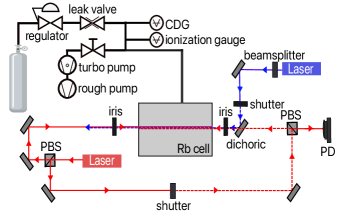
Figure 1 shows a schematic of the experiment. The experimental cell is composed of a 2.75 inch cube. An ampule containing roughly 1 g of Rb was placed in a flexible bellows attached to the cube and broken after the chamber was evacuated. Two viewports on the cell allow for probe, pump and coupling lasers to pass through the cell along the same axis. A gas handling system is attached to the cell to allow for the insertion and removal of perturbing gases.
The base pressure of the experimental cell is approximately mbar, consistent with the saturated vapor pressure of Rb at the bellows temperature of 291 K. We used ultrahigh purity grade (99.999 %) of all gases. The gas pressure was measured by a capacitance diaphragm gauge (CDG) and an ionization gauge. The relative accuracy of the CDG is specified to 0.15 % plus an additional uncertainty of mbar, although we take the relative uncertainty to be a more conservative 1 %. The ionization gauge is calibrated to the CDG for pressures up to a few mbar, and the extrapolated reading is used to record pressures below the usable range of the CDG.
The chamber is surrounded by a polystyrene foam board box to provide thermal insulation. The box is divided into two sections: one surrounding the cube and one surrounding the bellows. Each section is monitored by an array of platinum resistance thermometers and temperature stabilized by a forced-air Peltier element. For these experiments, the temperature of the chamber was stabilized to 304.0(5) K and the bellows was stabilized at 291.2(2) K 111Unless stated otherwise, all uncertainties herein are the combined statistical and systematic uncertainties.. With the temperature and pressure , we use the ideal gas law to predict the density of perturber gas , where is the Boltzmann constant. Corrections to the ideal gas law and pressure gradients due to thermal transpiration are negligible at these pressures given our level of uncertainty.
Our experimental sequence is composed of three measurements: Doppler spectroscopy, sub-Doppler spectroscopy, and Rydberg EIT. In the Doppler spectroscopy sequence, a “probe” laser is scanned over the 87Rb and 85Rb transitions, a scan of roughly 3.5 GHz width in roughly 50 ms. We fit the resulting Doppler profile to the model of Ref. [33] to extract the temperature indicated by the Doppler width , the density of 85Rb , and the density of 87Rb . The measured Doppler width corresponds to a temperature of K, significantly below the measured cell temperature of 304 K. This discrepancy is due to the probe laser beam power of 30 W (saturation parameter ) being set to optimize the Rydberg EIT signal described below. This probe power is excessive for accurate Doppler thermometry, as it induces a rather large shift in the measured due to hyperfine pumping effects [34]. The fitted densities cm-3 and cm-3 are within an order of magnitude of the predicted saturated density [35] of cm-3 for K.
In the sub-Doppler spectroscopy sequence, an additional counter-propagating 1.5 mW “pump” beam with the same frequency to create the well-known sub-Doppler Lamb dips when the both lasers resonantly interrogate the same velocity class. For both the Doppler and sub-Doppler scans, a frequency ruler is provided by a modulation transfer spectroscopy signal produced in a separate reference cell and the well-known splitting between the 87Rb and 85Rb transitions [36]. This allows us to deduce both the shift and broadening of the D2 line as a function of pressure.
For EIT measurements, a counter-propogating, 50 mW “coupling” laser is scanned over the transition from 85Rb to the target Rydberg level. During this scan, the the probe laser is locked to the 85Rb transition using the modulation transfer spectroscopy signal in the reference cell. For Rydberg S states, the coupling laser is scanned over a range that includes the Doppler crossover resonances with the states. For Rydberg D states, the coupling laser is scanned over a range that includes the and levels, along with the Doppler crossover resonances of the respective states. These known splittings act as a the frequency ruler for the EIT measurements. Comparison of the EIT measurements in the experimental cell to a synchronous measurement of EIT in the reference vapor cell determines the frequency shift.
III Discussion
Typical data as a function of pressure is shown in Fig. 2, which shows both the Doppler and sub-Doppler spectroscopy sequence and the Rydberg EIT signal perturbed by Ar gas. At the lowest pressures shown, the large-scale shape of the sub-Doppler and Doppler transmission curves are basically identical, showing the standard Doppler (Gaussian) absorption profile. The primary difference is Lamb dips that appear in the sub-Doppler spectrum. As the pressure increases, the sub-Doppler profile and the Doppler profiles begin to diverge, with the Lorentzian peaks becoming smaller and the large-scale Doppler profile of the sub-Doppler Gaussian being reduced. For the EIT spectrum, there is a clear shift and broadening as a the pressure increases. The pressures at which both effects become apparent is of the order of 0.1 mbar, which is a rather high pressure when one considers that most vapor cells are evacuated to well below mbar before sealing.
Let us now consider the Doppler and sub-Doppler spectra in detail. The divergence between the sub-Doppler and Doppler signals at mbar is caused by velocity changing collisions (VCCs) first recognized in Ne/He mixtures by Smith and Hänsch [28]. VCCs redistribute the velocities of atoms while they interact with lasers over the whole Doppler velocity distribution; causing the broad Doppler background to reappear in the sub-Doppler spectrum. Ref. [28] employed a hard-collision model, which assumes one collision is sufficient to re-distribute the velocities over the whole of the Doppler profile, to derive a sub-Doppler signal for a two-state system of the form
| (1) |
where is the rate of VCCs, is the relaxation rate of the ground state, , is the mass of a rubidium atom, and is the homogeneous linewidth measured in Hz, and is the detuning measured in Hz. Here, we have ignored cross-relaxation effects in the excited state. The lineshape (1) is a sum of an (area-normalized) Lorentzian and an (area-normalized) Gaussian, and the parameter smoothly transitions between the two.
We fit for the sub-Doppler component of the spectrum by first subtracting the sub-Doppler spectrum from the Doppler spectrum, accounting for approximately 2 % differences in probe laser intensity and photodiode signal baseline between the two scans. We then fit the sub-Doppler spectrum to a sum of (1) for all six Lamb dips. In total, there are 18 fit parameters per spectrum: 12 amplitudes for all the peaks, three parameters to parameterize the frequency axis shift and non-linearity, , , and the product .
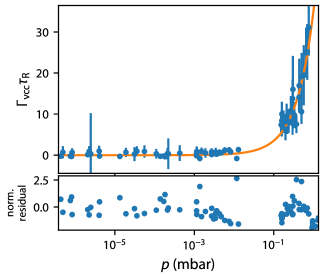
The fitted parameter follows a linear relationship with pressure, as shown in Fig. 3. Indeed, one expects that , where is the cross section for collision with the perturber atom or molecules, is their relative velocity, denotes thermal averaging, and denotes the density of the perturber gas. Semi-classically, has been derived in the context of the cold atom vacuum standard [37, 38, 39] and is
| (2) |
where , , is the reduced mass of the collision pair, and is the Van der Waals coefficient. Table 1 shows estimates of using (2) and coefficients from Klos et al. [39].
We use our fitted slope for N2 and the semiclassical estimate shown in Table 1 to extract s. This value of is significantly smaller than the expected value due to transit broadening of s. Moreover, it is smaller than values measured directly in similar experiments by modulating the pump beam at different frequencies [31, 40]. It is unclear what might be causing the discrepancy in expected ; however, it is unimportant for the present discussion.
| He | Ne | N2 | Ar | |
|---|---|---|---|---|
| This work | ||||
| — | — | — | [40] | |
| Eq. (2) |
Our resulting values of for He, Ne, and Ar are shown in Table 1. Of these three, Ne and Ar agree with the semi-classical prediction within their uncertainties, whereas He does not. Our value for Rb-Ar does not agree with the only other measurement of , Ref. [40]. This discrepancy is due to the wildly different estimates of .
| 4He | Ne | N2 | Ar | ||||||
| Transition | Shift | Broadening | Shift | Broadening | Shift | Broadening | Shift | Broadening | Ref. |
| (D2) | This work | ||||||||
| — | — | — | — | — | — | [26] | |||
| — | — | — | — | — | — | [24] | |||
| [22] | |||||||||
| — | — | — | — | [23] | |||||
| [19, 21] | |||||||||
| — | — | [20] | |||||||
| — | — | [18] | |||||||
| — | — | — | — | — | — | [17] | |||
| This work | |||||||||
| (2) | — | — | — | — | — | — | [16] | ||
| — | — | — | — | [15] | |||||
| — | — | — | — | — | [14] | ||||
| This work | |||||||||
| (2) | — | — | — | — | [15] | ||||
| This work | |||||||||
| (2) | — | — | — | — | — | — | [16] | ||
| — | — | — | — | [15] | |||||
| — | — | — | — | — | [14] | ||||
| This work | |||||||||
| (2) | — | — | — | — | — | — | [15] | ||
| This work | |||||||||
| This work | |||||||||
We also fit individual Lamb dips to a Lorenztian plus quadratic background to extract linewidth and frequency shift as a function of . Our values are shown in Table 2 and show reasonable agreement with prior work. All prior measurements stated in Table 2 with the exception of Ref. [26] were done in a similar experimental arrangement to our Doppler spectroscopy, except with gas densities to times larger than those investigated here. Our measurement and those of Ref. [26] are the only measurements we are aware of using sub-Doppler spectra.
Let us now consider the EIT spectra of Fig. 2 in detail, which shows a distinctly different quality. At the lowest pressures, peaks corresponding to the and are clearly visible for coupling laser detuning of MHz and MHz, respectively. Smaller peaks roughly MHz and MHz detuned from the large peaks are also visible; these are due to matching Doppler shifts in the probe and coupler beam with off-resonant hyperfine states of the 5P state (see Fig. 3 in Ref. [41]). As the pressure increases, all peaks shift and broaden equally.
We quantify the shift and broadening by fitting the observed lines in the EIT spectra to Lorentzians to estimate the line centers and full widths at half maximum (FWHM) at each pressure. Known hyperfine and Doppler frequency intervals were fixed in the fits. The Lorentzian lineshape was chosen because it most closely matches the spectrum over all pressures; using a Gaussian lineshape increases the observed FWHMs by roughly 10 %. No significant change was observed in the fitted line centers between Gaussian or Lorentzian lineshapes.
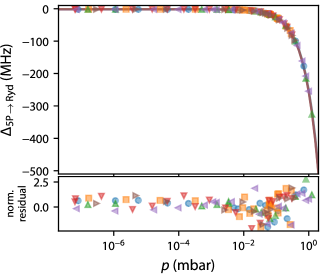
The observed shift in the the EIT line, , is shown in Fig. 4 as a function of for Ar perturbing gas and several different Rydberg states. All data of this type are fit to a line. The best fit slope determines the shift coefficient ; the best fit offset at quantifies the observed frequency offset between our reference cell and our experimental cell. The best fit offset is MHz; we shall return to this shift later.
Likewise, the FWHMs as a function of are fit to lines. The best fit slope determines the observed broadening coefficient ; the best fit offset at determines the linewidth. We find the linewidth at is 4.89(4) MHz, which is slightly larger than the expected Doppler-mismatch broadened linewidth of 3.6 MHz [42]. The discrepancy is probably due to power broadening with the probe laser.
Table 2 shows our observed shifts and broadening coefficients for various EIT Rydberg transitions in 85Rb, along with comparisons to other literature values. When comparing measurements, there are two important points to note. First, prior experiments [13, 15, 16] measuring Rydberg transitions were typically done using two-photon excitation (of the same frequency) through a virtual P state. As a result, the experiments required much higher Rb density, of the order of cm-3 in order to achieve signal to noise ratios greater than one. Thus, these experiments were typically carried out at much higher temperatures, typically around 200 ∘C.
Second, because we excite through 5P, the pressure broadening and shifts of the 5P state contribute to our observed and . Specifically, the probe laser, nominally resonant with when , addresses the velocity class , where is the probe laser wavevector. The coupling laser then becomes resonant when its detuning from resonance satisfies , where is the wavevector of the coupling laser and is the collisional shift of the Rydberg state. Thus, the observed shifts for the Rydberg levels shown in Table 2 are related to via
| (3) |
Likewise, will add in quadrature to the broadening of the Rydberg state , such that
| (4) |
The expected was first worked out by Fermi [11] and expanded by Omont [43]. It has two components, . The first is the scattering of the nearly-free electron off of the perturber gas and is given in atomic units [44] by
| (5) |
where is the -wave scattering length of the electron off of the perturber gas. The second contribution to the shift is due to the interaction of the atomic core with the polarizable perturber gas and is given in atomic units by
| (6) |
where is the polarizability of the perturber gas atom or molecule. Note that while is always negative, (and therefore ) can be either positive or negative, depending on the sign of .
Likewise, Omont [43] predicted that the broadening of states with principal quantum number larger than 10 is, in atomic units,
| (7) |
where the cross section is again the sum of two components: the cross section due to the polarization component of the interaction potential alone, , and the cross section due to the Fermi potential alone, . Expressions for and are given as (4.14)-(4.17) in Ref. [43] and shall be omitted here.
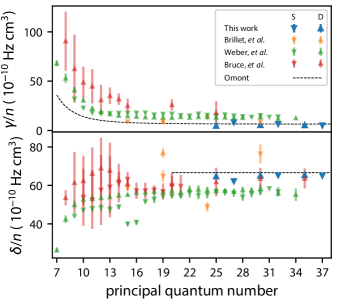
Figure 5 shows our measured and of 85Rb levels due to He perturber gas as a function of principal quantum number, together with prior measurements [13, 15, 16] and the prediction of Omont [43]. Interestingly, our values show better agreement with Omont’s predictions compared to other measurements.
| [45] | pred. | obs. | pred. | obs. | pred. | obs. | |||
| ( Hz cm3) | ( Hz cm3) | ||||||||
| H2 | [46] | — | — | — | |||||
| He | [12] | ||||||||
| Ne | [12] | ||||||||
| CH4 | [47] | — | — | — | |||||
| N2 | [48] | ||||||||
| CO | [49] | — | — | — | |||||
| O2 | [46] | — | — | — | |||||
| Ar | [12] | ||||||||
| C2H6 | [47] | — | — | — | |||||
| CO2 | [50] | — | — | — | |||||
| C3H8 | [47] | — | — | — | |||||
| Kr | [12] | — | — | — | |||||
| CF4 | [47] | — | — | — | |||||
| Xe | [12] | — | — | — | |||||
Table 3 shows the predicted and for high lying Rydberg states based on the theory of Omont [43] for a variety of possible contaminant gases in a vapor cell. For all gases in Table 3, we have used values of calculated by fitting very low-energy electron scattering data; is taken from a calculation [45]. While the predicted varies between roughly Hz cm3 and Hz cm3, it is important to understand the scale of this shift coefficient. At ∘C and mbar, an upper limit of what a vapor cell might be evacuated to prior to sealing, cm-3. A hypothetical, atypically large shift coefficient of Hz cm3 would result in kHz, which is much smaller than the expected residual Doppler linewidth of 3.6 MHz [42]. The predicted in Table 3 cluster between Hz cm3 and Hz cm3. At Hz cm3, to get an additional broadening of 1 MHz would require mbar at 30∘C. Such pressures are unlikely in vapor cell manufacture apart from a leak.
Together with the theoretical predictions, Table 3 also shows our observed and for He, Ne, N2, and Ar, which are determined by averaging together our results for all Rydberg transitions. Our values for and agree rather well with the theory of Omont, with a maximum discrepancy of about 25 % for Ne in both and .
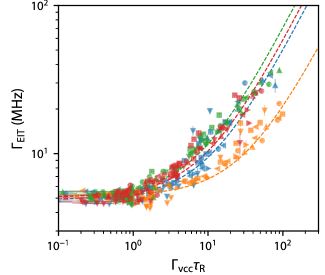
We now return to the correlation between Rydberg EIT shifts or broadening with that of velocity-changing collisions in sub-Doppler spectra of the D2 line. Figure 6 shows our observed FWHM as a function of . The data from all six Rydberg states studied are self-consistent. We fit all the data from a given perturber gas to a line. The slope of the best fit line gives us a measure of the ratio . For this discussion, we shall ignore the small contribution to the EIT linewdith from the collisional broadening of the 5P state, i.e., . The of the best fit line again gives us a measurement of the linewidth of the EIT line. Our observed ratios of do not vary dramatically over the four gases measured, the total variation is only about a factor of 5. Specifically, He, Ar, and N2 all have similar values of ; Ne is about a factor of 3-4 smaller.
Once again, we do not know , but we assume it is constant across gas species. Thus, we define the ratio between Rydberg broadening coefficient to the rate of velocity changing collisions normalized to N2,
| (8) |
where represents a particular gas species. Table 3 shows the predicted for the same contaminant gas species, together with the observed quantities from the fits of Fig. 6. To predict , we use the appropriate coefficient, if available in the literature [39], or scale the coefficient from N2 using the fact that the van der Waals coefficient roughly obeys [51, 37]. Once again, Ne stands apart as an outlier, while He, Ar, and N2 show reasonable agreement.
The calculated shown in Table 3 predict that all gases should exhibit similar ratios of Rydberg broadening to velocity changing collisions. This is because both Rydberg broadening and VCCs are fundamentally dependent on the polarizability of the perturber atom or molecule in roughly the same way. Specifically, . Likewise, the dominant contribution to the broadening of Rydberg states is due to the polarizability of the perturber atom or molecule and [43]. Thus, the ratio is extremely weakly dependent on both and . Thus, it is not unreasonable to expect that all possible perturber gases, even if they have wildly different , will have similar ratios between Rydberg broadening and velocity changing collisions. We thus conclude that simple measurement of VCCs in sub-Doppler spectrum could diagnose vapor cells intended for Rydberg electrometry that are suspected of having a leak, without the need for a second coupling laser to perform EIT.
IV Conclusion
We have revisited collisional broadening of both Rydberg states and the D2 line of 85Rb to draw conclusions regarding the potential effect of contaminant gases on vapor cells manufactured for Rydberg atom electrometry. Specifically, we investigated the changes in the Doppler, sub-Doppler, and EIT spectra as a function of He, Ne, N2, and Ar perturber gas pressure. We found that for all four of our gases, measurable effects appeared in both the sub-Doppler spectra and the EIT spectra at pressures of around 0.01 mbar. We compared our measurements of the shifts and broadening of Rydberg EIT lines to previous measurements reported in the literature [13, 15, 16] and to the theory of Omont [43], finding better agreement compared to previously reported results. We found that the ratio of the broadening of Rydberg EIT lines to the rate of velocity changing collisions is weakly dependent on perturber gas species. Finally, we generalized our results using Omont’s theory and literature reported values of electron scattering lengths and polarizabilities to extend our results to multiple gases.
For the testing and manufacture of vapor cells, our work allows us to draw two conclusions: (1) It is unlikely that contaminant gases are the sole cause of vapor cells with odd EIT lineshapes because the required pressures for measurable effects are large, on the order of 0.01 mbar, and vapor cells are generally evacuated to well below mbar prior to sealing. Outgassing of cell walls also is unlikely, because the total amount of trapped gases is generally well below 0.01 mbar. Atmospheric He is known to diffuse through glass vapor cells on a time scale of years; even well-aged vapor cells containing background He at atmospheric density (roughly cm-3 [52]), should exhibit insubstantial pressure broadening and minimal shifts. Only a leak can provide the necessary amount of gas to cause a ruinous perturbation. (2) Detecting velocity changing collisions in the sub-Doppler spectra is a sufficient test for detecting such a leak. Such a test would be easy to implement, and consist simply of repeatedly blocking and unblocking the pump beam and quantifying the difference in the Gaussian background. No complicated fitting of the individual Lorentzian sub-Doppler peaks would be required for a pass/fail test.
While the sub-Doppler signal may validate that the background gas pressure of a vapor cell is low enough for EIT applications, one must use caution in applying such a test to diagnose problematic vapor cells, as the root cause of defects in EIT or sub-Doppler spectra can have other potential causes. Take, for example, our reference vapor cell, which we reported has a very consistent MHz offset relative to our experimental cell when mbar. In addition to this shift, the cell showed VCCs with fit parameter and a extrapolated zero probe power EIT linewidth of 7.9(6) MHz. Taken together, these measurements seem to indicate the presence of about 100 mbar of N2 gas. First, the ratio of the measured shift of the EIT line to the FHWM of the EIT line is roughly the same as the ratio between the shift and broadening coefficients reported for N2 in Table 2. Second, the values of the EIT FWHM and fall on the N2 curve of Fig. 6.
To check if 100 mbar of N2 gas was present in our reference cell, we constructed a vacuum chamber wherein we could destroy the cell and capture the escaping gas. Specifically, our chamber measured the pressure rise due to the escaping gas using capacitance diaphragm and spinning rotor gauges. After the pressure rise was quantified, the gas could be gradually released into a second, lower pressure chamber where a residual gas analyzer could measure its content. A preliminary test was conducted by destroying a Rb cell known to be filled with 7 mbar of Ne; this test confirmed that the apparatus could measure the cell’s background gas pressure and molecular content. Upon destroying our reference cell, however, we measured that the initial pressure of the gas inside the cell was an order of magnitude lower than predicted, about mbar, and consisted mostly of He. We note that if the MHz shift were due to He, that would correspond to a pressure of mbar, remarkably close to the measured value. However, the He content would not be sufficient to explain the measured values of and the zero-probe-power EIT linewidth of 7.9(6) MHz. Thus we return to conclusion (1) of the paper: it is unlikely that residual gases alone are the cause of irregular EIT lineshapes. Indeed, it seems that multiple, competing effects were degrading the performance of our reference cell at the 1 MHz level. The leading candidate is background electric fields due to stray charges resulting of several potential sources: (1) vapor cell manufacturing defects, (2) charge build up of ionized Rydberg atoms, and (3) cell wall interactions with alkali atoms. Further multi-parameter studies would be required to truly understand and disentangle these competing effects, especially in the regime where residual gas pressures are below 0.1 mbar.
Acknowledgments
The authors thank David La Mantia, Nickolas Pilgram, and Daniel Barker for technical assistance. This work was supported by DARPA under the SAVaNT program. The views, opinions and/or findings expressed are those of the authors and should not be interpreted as representing the official views or policies of the Department of Defense or the U.S. Government. A contribution of the U.S. government, this work is not subject to copyright in the United States.
Conflict of Interest
The authors have no conflicts to disclose.
Data Availability Statement
All data presented in this review will be made available to the reader upon reasonable request to the authors.
References
- Gordon et al. [2010] J. A. Gordon, C. L. Holloway, S. Jefferts, and T. Heavner, Quantum-based SI traceable electric-field probe, in 2010 IEEE International Symposium on Electromagnetic Compatibility (2010) pp. 321–324.
- Sedlacek et al. [2012] J. A. Sedlacek, A. Schwettmann, H. Kübler, R. Löw, T. Pfau, and J. P. Shaffer, Microwave electrometry with Rydberg atoms in a vapour cell using bright atomic resonances, Nat. Phys. 9, 819 (2012).
- Holloway et al. [2014a] C. L. Holloway, J. A. Gordon, S. Jefferts, A. Schwarzkopf, D. A. Anderson, S. A. Miller, N. Thaicharoen, and G. Raithel, Broadband Rydberg atom-based electric-field probe for si-traceable, self-calibrated measurements, IEEE Trans. Antennas Propag. 62, 6169 (2014a).
- Artusio-Glimpse et al. [2022] A. Artusio-Glimpse, M. T. Simons, N. Prajapati, and C. L. Holloway, Modern rf measurements with hot atoms: A technology review of Rydberg atom-based radio frequency field sensors, IEEE Microw. Mag. 23, 44 (2022).
- Liu et al. [2023] B. Liu, L. Zhang, Z. Liu, Z. Deng, D. Ding, B. Shi, and G. Guo, Electric field measurement and application based on Rydberg atoms, Electromagnetic Science 1, 1 (2023).
- Gallagher [1994] T. F. Gallagher, Rydberg Atoms, Cambridge Monographs on Atomic, Molecular and Chemical Physics (Cambridge University Press, 1994).
- Amaldi and Segreé [1934] E. Amaldi and E. Segreé, Effect of pressure on high terms of alkaline spectra, Nature 133, 141 (1934).
- Füchtbauer et al. [1934] C. Füchtbauer, P. Schulz, and A. F. Brandt, Verschiebung von hohen serienlinien des natriums und kaliums durch fremdgase, berechnung der wirkungsquerschnitte von edelgasen gegen sehr langsame elektronen, Z. Phys. 90, 403 (1934).
- Füchtbauer and Gössler [1935] C. Füchtbauer and F. Gössler, Verschiebung und verbreiterung hoher serienglieder des cäsiums durch quecksilber und xenon, Z. Phys. 93, 648 (1935).
- Füchtbauer and Reimers [1935] C. Füchtbauer and H. J. Reimers, Verbreiterung und verschiebung der linien des cäsiumserienendes durch krypton, Z. Phys. 95, 1 (1935).
- Fermi [1934] E. Fermi, Sopra lo spostamento per pressione delle righe elevate delle serie spettrali, Il Nuovo Cimento (1924-1942) 11, 157 (1934).
- Massey et al. [1969] H. Massey, E. Burhop, and H. Gilbody, Electronic and Ionic Impact Phenomena: Collision of electrons with atoms, by H.S.W. Massey and E.H.S. Burhop, Electronic and Ionic Impact Phenomena (Clarendon P., 1969) pp. 554–556.
- Brillet and Gallagher [1980] W.-U. L. Brillet and A. Gallagher, Inert-gas collisional broadening and shifts of Rb Rydberg states, Phys. Rev. A 22, 1012 (1980).
- Bruce et al. [1982] D. Bruce, M. Mirza, and W. Duley, Collision broadening and shift of the S and D Rydberg levels of rubidium by He and Ar, Optics Communications 40, 347 (1982).
- Weber and Niemax [1982] K. H. Weber and K. Niemax, Impact broadening and shift of Rb S and D levels by noble gases, Z. Phys. A 307, 13 (1982).
- Thompson et al. [1987] D. C. Thompson, E. Kammermayer, B. P. Stoicheff, and E. Weinberger, Pressure shifts and broadenings of Rb Rydberg states by Ne, Kr, and , Phys. Rev. A 36, 2134 (1987).
- Shang-Yi [1940] C. Shang-Yi, Broadening, asymmetry and shift of rubidium resonance lines under different pressures of helium and argon up to 100 atmospheres, Phys. Rev. 58, 1051 (1940).
- Ottinger et al. [1975] C. Ottinger, R. Scheps, G. W. York, and A. Gallagher, Broadening of the Rb resonance lines by the noble gases, Phys. Rev. A 11, 1815 (1975).
- Belov [1981] V. N. Belov, Application of the magnetic-scanning method to the measurement of the broadening and shift constants of the rubidium D2 line (780.0 nm) by foreign gases, Opt. Spectrosc. 51, 22 (1981).
- Izotova et al. [1981] S. L. Izotova, A. I. Kantserov, , and M. S. Frish, Constants for broadening and shift of D1 and D2 rubidium-87 lines by inert gases, Opt. Spectrosc. 51, 107 (1981).
- Kantor and Shabanova [1985] P. Y. Kantor and L. N. Shabanova, Profiles of the Rb-I 794.7- and 780.0-nm line in the presence of inert gases; parameters of interatomic potentials, Opt. Spectrosc. 58, 614 (1985).
- Rotondaro and Perram [1997] M. D. Rotondaro and G. P. Perram, Collisional broadening and shift of the rubidium D1 and D2 lines (SPP3/2) by rare gases, H2, D2, N2, CH4 and CF4, J. Quant. Spectrosc. Radiat. Transf. 57, 497 (1997).
- Romalis et al. [1997] M. V. Romalis, E. Miron, and G. D. Cates, Pressure broadening of Rb D1 and D2 lines by 3He, 4He, N2, and Xe: Line cores and near wings, Phys. Rev. A 56, 4569 (1997).
- Kluttz et al. [2013] K. A. Kluttz, T. D. Averett, and B. A. Wolin, Pressure broadening and frequency shift of the D1 and D2 lines of Rb and K in the presence of 3He and N2, Phys. Rev. A 87, 032516 (2013).
- Ha et al. [2021] L.-C. Ha, X. Zhang, N. Dao, and K. R. Overstreet, line broadening and hyperfine frequency shift coefficients for and in Ne, Ar, and , Phys. Rev. A 103, 022826 (2021).
- Sargsyan et al. [2021] A. Sargsyan, T. A. Vartanyan, and D. Sarkisyan, Broadening and shift of the D1 and D2 lines of Rb atoms by neon: Resolving hyperfine components in a half-wave cell using double differentiation with respect to frequency, Opt. Spectrosc. 129, 1173 (2021).
- Demtröder and Roach [2013] W. Demtröder and M. Roach, Laser Spectroscopy: Basic Concepts and Instrumentation, Advanced Texts in Physics (Springer Berlin Heidelberg, 2013).
- Smith and Hänsch [1971] P. W. Smith and R. Hänsch, Cross-relaxation effects in the saturation of the 6328-å neon-laser line, Phys. Rev. Lett. 26, 740 (1971).
- Brechignac et al. [1978] C. Brechignac, R. Vetter, and P. R. Berman, Study of velocity-changing collisions in excited Kr using saturation spectroscopy, Phys. Rev. A 17, 1609 (1978).
- Sasso et al. [1988] A. Sasso, G. M. Tino, M. Inguscio, N. Beverini, and M. Francesconi, Investigation of collisional lineshapes of neon transitions in noble gases’ mixtures, Il Nuovo Cimento D 10, 941 (1988).
- Kronfeldt et al. [1994] H.-D. Kronfeldt, G. Klemz, and D. Ashkenasi, Experimental study on methods minimizing the influence of velocity-changing collisions in doppler-free saturation spectroscopy, Opt. Commun. 110, 549 (1994).
- Note [1] Unless stated otherwise, all uncertainties herein are the combined statistical and systematic uncertainties.
- Siddons et al. [2008] P. Siddons, C. S. Adams, C. Ge, and I. G. Hughes, Absolute absorption on rubidium d lines: comparison between theory and experiment, J. Phys. B At. Mol. Opt. Phys. 41, 155004 (2008).
- Truong et al. [2015] G. W. Truong, J. D. Anstie, E. F. May, T. M. Stace, and A. N. Luiten, Accurate lineshape spectroscopy and the Boltzmann constant, Nat. Commun. 6, 8345 (2015).
- C. B. Alcock and Horrigan [1984] V. P. I. C. B. Alcock and M. K. Horrigan, Vapour pressure equations for the metallic elements: 298–2500k, Can. Metall. Q. 23, 309 (1984).
- McCarron et al. [2008] D. J. McCarron, S. A. King, and S. L. Cornish, Modulation transfer spectroscopy in atomic rubidium, Meas. Sci. Technol. 19, 105601 (2008).
- Eckel et al. [2018] S. Eckel, D. S. Barker, J. A. Fedchak, N. N. Klimov, E. Norrgard, J. Scherschligt, C. Makrides, and E. Tiesinga, Challenges to miniaturizing cold atom technology for deployable vacuum metrology, Metrologia 55, S182 (2018).
- Barker et al. [2022] D. S. Barker, B. P. Acharya, J. A. Fedchak, N. N. Klimov, E. B. Norrgard, J. Scherschligt, E. Tiesinga, and S. P. Eckel, Precise quantum measurement of vacuum with cold atoms, Rev. Sci. Instrum. 93, 121101 (2022).
- Kłos and Tiesinga [2023] J. Kłos and E. Tiesinga, Elastic and glancing-angle rate coefficients for heating of ultracold Li and Rb atoms by collisions with room-temperature noble gases, H2, and N2, J. Chem. Phys. 158, 014308 (2023).
- Thornton et al. [2011] D. E. Thornton, G. T. Phillips, and G. P. Perram, Velocity changing collisions in the laser saturation spectra of 87Rb D2 , Opt. Commun. 284, 2890 (2011).
- Holloway et al. [2014b] C. L. Holloway, J. A. Gordon, A. Schwarzkopf, D. A. Anderson, S. A. Miller, N. Thaicharoen, and G. Raithel, Sub-wavelength imaging and field mapping via electromagnetically induced transparency and Autler-Townes splitting in Rydberg atoms, Appl. Phys. Lett. 104, 244102 (2014b).
- Shaffer and Kübler [2018] J. P. Shaffer and H. Kübler, A read-out enhancement for microwave electric field sensing with Rydberg atoms, in Quantum Technologies 2018, Vol. 10674, edited by J. Stuhler, A. J. Shields, and M. J. Padgett, International Society for Optics and Photonics (SPIE, 2018) p. 106740C.
- Omont, A. [1977] Omont, A., On the theory of collisions of atoms in Rydberg states with neutral particles, J. Phys. France 38, 1343 (1977).
- McWeeny [1973] R. McWeeny, Natural units in atomic and molecular physics, Nature 243, 196 (1973).
- Olney et al. [1997] T. N. Olney, N. Cann, G. Cooper, and C. Brion, Absolute scale determination for photoabsorption spectra and the calculation of molecular properties using dipole sum-rules, Chem. Phys. 223, 59 (1997).
- Randell et al. [1994] J. Randell, S. L. Lunt, G. Mrotzek, J. P. Ziesel, and D. Field, Low energy electron scattering in H2, N2 and O2, J. Phys. B At. Mol. Opt. Phys. 27, 2369 (1994).
- Lunt et al. [1998] S. L. Lunt, J. Randell, J.-P. Ziesel, G. Mrotzek, and D. Field, Very low energy electron scattering in some hydrocarbons and perfluorocarbons, J. Phys. B At. Mol. Opt. Phys. 31, 4225 (1998).
- Idziaszek and Karwasz [2009] Z. Idziaszek and G. Karwasz, Modified effective-range theory for low energy e-N2 scattering, Eur. Phys. J. D 51, 347 (2009).
- Randell et al. [1996] J. Randell, R. J. Gulley, S. L. Lunt, J.-P. Ziesel, and D. Field, Very low energy electron scattering in CO, J. Phys. B At. Mol. Opt. Phys. 29, 2049 (1996).
- Idziaszek et al. [2008] Z. Idziaszek, G. P. Karwasz, and R. S. Brusa, Modified effective range analysis of low energy electron and positron scattering on CO2, J. Phys. Conf. Ser 115, 012002 (2008).
- Arpornthip et al. [2012] T. Arpornthip, C. A. Sackett, and K. J. Hughes, Vacuum-pressure measurement using a magneto-optical trap, Phys. Rev. A 85, 033420 (2012).
- Oliver et al. [1984] B. Oliver, J. G. Bradley, and H. Farrar, Helium concentration in the earth’s lower atmosphere, Geochimica et Cosmochimica Acta 48, 1759 (1984).