Zeoformer: Coarse-Grained Periodic Graph Transformer
for OSDA-Zeolite Affinity Prediction
Abstract
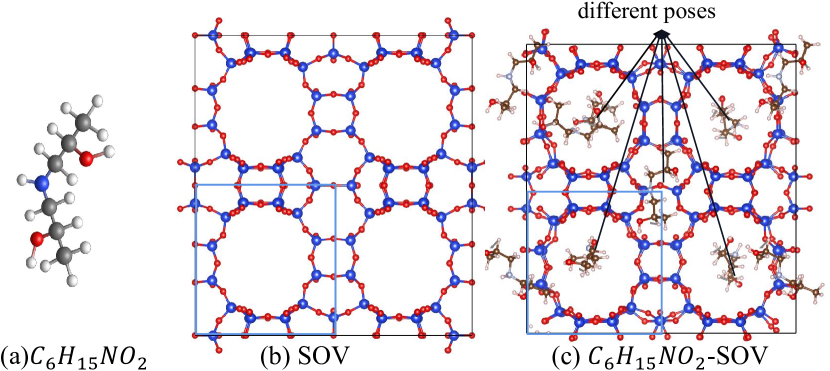
To date, the International Zeolite Association Structure Commission (IZA-SC) has cataloged merely 255 distinct zeolite structures, with millions of theoretically possible structures yet to be discovered. The synthesis of a specific zeolite typically necessitates the use of an organic structure-directing agent (OSDA), since the selectivity for a particular zeolite is largely determined by the affinity between the OSDA and the zeolite. Therefore, finding the best affinity OSDA-zeolite pair is the key to the synthesis of targeted zeolite. However, OSDA-zeolite pairs frequently exhibit complex geometric structures, i.e., a complex crystal structure formed by a large number of atoms. This geometric structure exhibits coarse-grained crystal periodicity and fine-grained local variability: (1) Fine-grained local variability: From the perspective of fine-grained structure, each unit cell shares the same crystal lattice, but there are subtle structural differences, such as the different poses of OSDA in an OSDA-zeolite pair, as shown in figure 1(c). (2) Coarse-grained periodicity: Despite the subtle differences within the unit cell, the overall structure of an OSDA-zeolite pair can still be viewed as the periodic repetition of the unit cell in space from a coarse-grained structural perspective. Although some existing machine learning methods can represent the periodicity of crystals, they cannot accurately represent crystal structures with local variability. To address this issue, we propose a novel approach called Zeoformer, which can effectively represent coarse-grained crystal periodicity and fine-grained local variability. Zeoformer reconstructs the unit cell centered around each atom and encodes the pairwise distances between this central atom and other atoms within the reconstructed unit cell. The introduction of pairwise distances within the reconstructed unit cell more effectively represents the overall structure of the unit cell and the differences between different unit cells, enabling the model to more accurately and efficiently predict the properties of OSDA-zeolite pairs and general crystal structures. Through comprehensive evaluation, our Zeoformer model demonstrates the best performance on OSDA-zeolite pair datasets and two types of crystal material datasets.
1 Introduction
Zeolite (a type of porous crystal) materials have garnered widespread attention for their applications in gas adsorption Pérez-Botella et al. (2022); Ackley et al. (2003), catalysis Weitkamp (2000); Chai et al. (2021), and drug delivery Servatan et al. (2020); Serati-Nouri et al. (2020). Zeolite structures are entirely composed of a periodic repeating structure of tetrahedra (where represents , , or ), which form three-dimensional (3D) networks by sharing vertex oxygen atoms Li and Yu (2014). The diversity in how these periodic tetrahedra connect results in a wide variety of zeolite structure types, theoretically allowing for millions of possible configurations Schmidt et al. (2014). However, designing synthetic routes for target zeolite topologies is a labor-intensive task. To date, the International Zeolite Association Structure Commission (IZA-SC) Baerlocher and McCusker (2021) has cataloged only distinct zeolite structure types. In chemical reactions, zeolites typically crystallize under hydrothermal conditions in the presence of inorganic precursors and organic templates, forming as metastable phases that require organic structure-directing agents (OSDAs) to compensate for energy loss and provide additional energy to stabilize these phases and enable diversification Shin et al. (2019); Moliner et al. (2015); Dusselier and Davis (2018).
Specifically, synthesizing a specific zeolite usually requires an OSDA, since the selectivity for a particular zeolite is largely determined by the affinity between the OSDA and the zeolite Shin et al. (2019). Therefore, finding the best affinity OSDA-zeolite pair is the key to the synthesis of targeted zeolite. An example in Figure 1 shows the combination of zeolite and OSDA forms the structure of the OSDA-zeolite pair. However, the OSDA-zeolite pair often has a complex geometric structure, i.e., a complex crystal structure formed by a large number of atoms. This geometric structure exhibits coarse-grained crystal periodicity and fine-grained local variability: (1) Fine-grained local variability: From the perspective of fine-grained structure, each unit cell shares the same crystal lattice, but there are subtle structural differences, such as the different poses of OSDA in an OSDA-zeolite pair, as shown in 1(c). (2) Coarse-grained periodicity: Despite the subtle differences within the unit cell, the overall structure of an OSDA-zeolite pair can still be viewed as the periodic repetition of the unit cell in space from a coarse-grained structural perspective. Therefore, this kind of crystal structure cannot be accurately represented by simply repeating a unit cell according to lattice parameters. This complex geometric structure challenges most existing deep-learning methods.
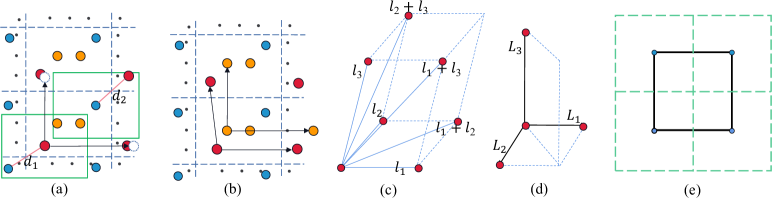
Based on the assumption that the relative coordinates of atoms between different unit cells in a crystal remain unchanged, many deep learning methods Yan et al. (2022); Lin et al. (2023); Yan et al. (2024) represent crystal structures by modeling the crystal graph of a single unit cell along with its periodic pattern. For example, Matformer Yan et al. (2022) directly encodes periodic patterns by assigning six self-connected edges determined by a manually defined lattice matrix for each atom within the unit cell, as shown by the six solid blue lines in Figure 2(c). In Figure 2(a), the black arrows show the periodic encoding of an atom in a two-dimensional structure based on lattice parameters, which may point to non-existent atomic positions. Conformer Yan et al. (2024) encodes periodicity by incorporating the spatial distances between different replicas of each atom along three directions as edge information, as shown in Figure 2(d). As shown by the black arrows in Figure 2(b), the periodic encoding based on this method reflects the differences for specific atoms. However, for unit cells with a large number of atoms, this method may not adequately capture the local differences between different unit cells. Although these periodic encoding methods achieve periodicity, they overlook fine-grained local variability. Specifically, in OSDA-zeolite structures, there are differences in the relative coordinates of atoms between different unit cells. Conformer and Matformer encode periodicity at the level of each individual atom, making them ineffective at capturing local variability caused by changes in atomic positions across different unit cells. More related methods and detailed discussions are presented in Appendix D.
To effectively capture the differences between different unit cells, we need to encode the coarse-grained periodic pattern from the perspective of the entire unit cell, rather than considering each atom individually. Therefore, we reconstruct the unit cell centered around each atom in the original unit cell and encode the pairwise distances between the central atom and other atoms within the reconstructed unit cell. This method encodes the spatial distances between a given atom and the nearest replicas of other atoms within the unit cell, rather than only considering the replicas of the atom itself. When overlapping the reconstructed unit cells for all atoms, the extent of the atom-reconstructed unit cells in two-dimensional space, as shown in Figure 2(e) (indicated by the green box), can extend up to four times the range of the original unit cell (indicated by the black box), and up to eight times in three-dimensional space, forming a supercell. This encoding method better identifies subtle differences between different unit cells, allowing the model to more accurately represent the geometric structure of OSDA-zeolite pairs, specifically the coarse-grained crystal periodicity and fine-grained local variability. The green box in Figure 2(a) provides a simplified illustration. For general crystal materials, this periodic encoding also offers significant advantages. For a detailed analysis, please refer to Appendix D. Finally, these encodings are integrated into the Transformer model, Zeoformer, achieving the best results in predicting OSDA-zeolite affinity and crystal material properties.
The main contributions are as follows:
-
•
To the best of our knowledge, we are the first to conduct the prediction of the affinity between OSDAs and target zeolite topologies in the field of machine learning, which is crucial for guiding zeolite synthesis by screening OSDAs.
-
•
In order to well represent the geometric structure of OSDA-zeolite pairs, i.e., the coarse-grained crystal periodicity with fine-grained local variability, we propose a novel deep learning model, called Zeoformer, which introduces pairwise distance encoding in the reconstructed unit cell.
-
•
We conducted experiments on a zeolite-molecule pairing dataset (OSDB Jensen et al. (2021)) and two commonly used materials benchmark datasets (Materials Project Chen et al. (2019) and JARVIS Choudhary et al. (2020)). The experiments validated the importance of our components and achieved better results.
2 Related Work
2.1 OSDA-guided Zeolite Synthesis
Some studies Moliner et al. (2008); Daeyaert et al. (2019) propose candidate OSDAs for specific zeolite structures using computational methods, including density functional theory and molecular dynamics. Schwalbe and Gomze Schwalbe-Koda and Gómez-Bombarelli (2021) address biases in simulation methods by comparing different approaches to calculate the interaction energy between zeolites and OSDAs, providing robust guidelines for computing binding energies in zeolite-OSDA pairs. Jensen et al. Jensen et al. (2021) employ data-driven approaches to study the relationship between OSDAs, qualitative gel chemistry, and resulting zeolite structures. Machine learning has been applied in studies that do not explicitly model OSDA-zeolite interactions, including the investigation of specific zeolites within finite chemical spaces Corma et al. (2006); Manuel Serra et al. (2007), OSDA-free zeolite systems Muraoka et al. (2019), and zeolite phase transformations Schwalbe-Koda et al. (2019). However, existing research often simplifies OSDA representation to basic attributes such as molecular volume Jensen et al. (2019) or is limited to single zeolite structures Daeyaert et al. (2019). In contrast, we adopt the concept of graph neural networks to model OSDA-zeolite pairs as graphs, aiming to predict their affinities for screening suitable OSDAs to guide zeolite synthesis.
2.2 Crystal Property Prediction with Deep Learning
CGCNN Xie and Grossman (2018) learns material properties from the connections between atoms in crystals. MegNet Chen et al. (2019) is a graph network with global state attributes. GATGNN Louis et al. (2020) uses multiple graph attention layers (GAT) to learn properties of local neighborhoods and global attention layers to weight global atomic features. ALIGNN Choudhary and DeCost (2021) and M3GNet Chen and Ong (2022) incorporate angle information into message passing to produce richer and more discriminative representations. CrysMMNet Das et al. (2023) uses a multimodal framework that integrates graph and text representations to generate joint multimodal representations of crystalline materials. CrysDiff Song et al. (2024) is a pretraining-finetuning framework based on diffusion models. However, these aforementioned methods struggle with accurately representing lattice parameters and crystal periodicity. Matformer Yan et al. (2022) encodes periodic patterns through self-connecting edges of atoms. PotNet Lin et al. (2023) considers the infinite summation of pairwise atomic interactions. Crystalformer Taniai et al. (2024) considers infinitely connected attention, thereby performing infinite summations of interatomic potentials. ComFormer Yan et al. (2024) represents the geometric information of crystals using equivariant vector representations and invariant geometric descriptors of Euclidean distances and angles.
3 Preliminaries
This section provides a brief introduction to crystal structures and OSDA-zeolite structures. For detailed information on OSDA-zeolite structures and the periodic invariance of crystals, please refer to Appendix C.
The Structure of Crystals.
The crystal is a substance with a highly ordered structure. By selecting an appropriate structural unit, the entire crystal can be viewed as the periodic repetition of this unit in space.
This property of atoms within a crystal repeating
in 3D space according to a specific pattern is called periodicity, with the smallest repeatable structural unit being the unit cell of the crystal.
The unit cell fills the crystal space when the structural unit is translated through lattice vectors.
Thus, the unit cell can be defined as , where and can be represented in matrix form.
Typically, , where
represents the number of atoms and represents the atomic type of atom in the unit cell.
is the atomic position matrix, where represents the Cartesian coordinates of the atom in the unit cell in 3D space.
To further encode the periodic pattern, additional lattice vectors are used to describe how the unit cell repeats itself in three directions.
Therefore, in 3D space, we can represent the crystal as .
Definition 1 (Unit Cell Invariance): A function is unit cell invariant if, for all , where , and , we have .
In other words, the crystal structure remains unchanged when the position matrix of the unit cell structure undergoes rotation, translation, or reflection.
The Structure of OSDA-zeolite.
OSDA-zeolite is a variant of crystal structure. It still adheres to the geometric constraints of crystals, but there are local differences between different unit cells in the OSDA-zeolite structure. Therefore, we can still represent the OSDA-zeolite structure as a crystal graph, but this representation needs to reflect the differences between different unit cells.
4 The Proposed Zeoformer
In this section, we propose Zeoformer, with a key focus on encoding the coarse-grained Periodic Pattern Encoding of crystal structures, referred to as , as illustrated by the Update layer in Fig 5. We first demonstrate how to construct coarse-grained periodic patterns that reflect differences between different unit cells, and then explain how the crystal graphs are built upon periodic patterns to ensure the invariance of the crystal graphs. Finally, we present the overall framework of Zeoformer.
4.1 Encoding of Coarse-grained Periodic Pattern
Previous methods Yan et al. (2022); Lin et al. (2023); Yan et al. (2024) for constructing periodic patterns typically rely on the assumption that the relative coordinates of atoms between different unit cells in a crystal remain unchanged. However, in OSDA-zeolite structures, the atomic coordinates can vary between different unit cells. As a result, we cannot encode periodic structures independently for each atom, as was done in the past using lattice parameters. Instead, we need to encode periodicity from the perspective of the entire unit cell. This means that when constructing periodicity, the focus should be on the overall structure of all atoms within the unit cell, rather than treating each atom as an independent entity for encoding. We achieve this by reconstructing the unit cell centered around each atom and encoding the pairwise distances between this central atom and other atoms within the reconstructed unit cell.
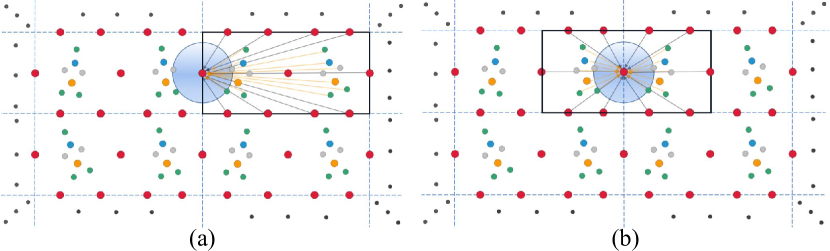
Formally, given the position of the atom and the modified positions of other atoms within the reconstructed unit cell , where belong to . These positions represent the nearest copies of the central atom and the remaining atoms in its reconstructed unit cell, as shown in Figure 3. The following equation provides the periodic pattern encoding, denoted as : where represents the union of feature vectors of distances between the atom and other atoms within the unit cell centered on the atom , with , and representing the number of atoms in the unit cell. represents the union of distance features between all atoms. Since the interaction energy between an atom and its neighboring atoms is usually inversely proportional to the distance, we take the reciprocal of the distance feature after removing zeros.
4.2 Crystal Graph Construction
We represent our crystal graph based on the method of constructing multi-edge crystal graphs. In the graph, each node represents an atom and all its infinite duplicates in 3D space, with positions , and node features . An edge is established from node to node when the Euclidean distance between a duplicate of and satisfies , where is the cutoff radius. We select the nearest edges within the cutoff radius, each with a corresponding edge feature . As shown in Figure 3(b), the blue circles represent the region defined by the cutoff radius. At the same time, the black boxes indicate the atoms included in our periodic pattern encoding. Formally, we represent the constructed crystal graph as . Therein, is the feature vector of the atom , is the feature vector of the -th edge between nodes and , and we denote as the indices of the nodes and that form the edge. is the periodic pattern encoding we introduced above, where is the number of atoms in the constructed graph.
Proof of the Invariance of the Constructed Crystal Graphs.
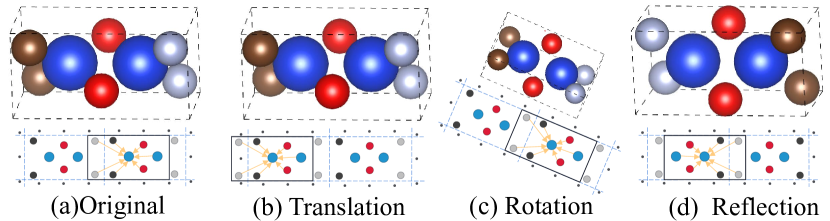
As shown in Figure 4, applying transformations alters the absolute positions of atoms within the unit cell but does not change the types of atoms, their relative positions within the crystal, or the lattice parameters; in other words, it changes the spatial distances between atoms, but the Euclidean distances remain invariant. When reconstructing the lattice parameters centered on each atom, the spatial distances between different replicas of that atom change, resulting in a change in the orientation of the reconstructed unit cell, while its size and shape remain unchanged. The atoms selected within this unit cell and their nearest replicas maintain their Euclidean distances relative to the central atom. Consequently, the constructed periodic pattern encoding remains invariant. Additionally, since we construct multi-edge crystal graphs solely based on the Euclidean distances between atoms in the crystal, the constructed crystal graphs remain invariant under transformations.
| Competition Total | Binding Total | Directivity Energy | Templating | |
|---|---|---|---|---|
| Method | kJ/mol OSDA | kJ/mol OSDA | kJ/mol Si | kJ/mol |
| CGCNN | 23.54 | 17.48 | 0.330 | 0.283 |
| GATGNN | 53.84 | 46.28 | 0.502 | 0.423 |
| Matformer | 15.61 | 12.45 | 0.243 | 0.214 |
| iComFormer | 10.52 | 6.534 | 0.132 | 0.168 |
| Zeoformer | 9.62 | 5.996 | 0.115 | 0.129 |
| Formation Energy | Bandgap(OPT) | Total Energy | Ehull | Bandgap(MBJ) | |
|---|---|---|---|---|---|
| Method | eV/atom | eV | eV/atom | eV | eV |
| CFID (2018) | 14 | 0.30 | 240 | 220 | 0.53 |
| CGCNN (2018) | 63 | 0.20 | 78 | 170 | 0.41 |
| SchNet (2018) | 45 | 0.19 | 47 | 140 | 0.43 |
| MEGNET (2019) | 47 | 0.145 | 58 | 84 | 0.34 |
| GATGNN (2020) | 47 | 0.17 | 56 | 120 | 0.51 |
| ALIGNN (2021) | 33.1 | 0.142 | 37 | 76 | 0.31 |
| M3GNet (2022) | 39.0 | 0.145 | 41 | 95 | 0.36 |
| Matformer (2022) | 32.5 | 0.137 | 35 | 64 | 0.30 |
| PotNet (2023) | 29.4 | 0.127 | 32 | 55 | 0.27 |
| CrysMMNet (2023) | 28.0 | 0.128 | 34 | – | 0.278 |
| CrysDiff (2024) | 29.0 | 0.131 | 34 | 62 | 0.287 |
| Crystalformer (2024) | 30.6 | 0.128 | 32 | 46 | 0.274 |
| eComFormer (2024) | 28.4 | 0.124 | 32 | 44 | 0.28 |
| iComFormer (2024) | 27.2 | 0.122 | 28.8 | 47 | 0.26 |
| Zeoformer | 26.9 | 0.120 | 28.0 | 33.5 | 0.25 |
| Formation Energy | Band Gap | Bulk Moduli | Shear Moduli | |
|---|---|---|---|---|
| Method | eV/atom | eV | log(GPa) | log(GPa) |
| CGCNN | 31 | 0.292 | 0.047 | 0.077 |
| SchNet | 33 | 0.345 | 0.066 | 0.099 |
| MEGNET | 30 | 0.307 | 0.060 | 0.099 |
| GATGNN | 33 | 0.280 | 0.045 | 0.075 |
| ALIGNN | 22 | 0.218 | 0.051 | 0.078 |
| M3GNet | 24 | 0.247 | 0.050 | 0.087 |
| Matformer | 21.0 | 0.211 | 0.043 | 0.073 |
| PotNet | 18.8 | 0.204 | 0.040 | 0.065 |
| CrysMMNet | 20.0 | 0.197 | 0.038 | 0.062 |
| Crystalformer | 18.6 | 0.198 | 0.0377 | 0.0689 |
| eComFormer | 18.16 | 0.202 | 0.0417 | 0.0729 |
| iComFormer | 18.26 | 0.193 | 0.0380 | 0.0637 |
| Zeoformer | 17.59 | 0.190 | 0.0388 | 0.0697 |
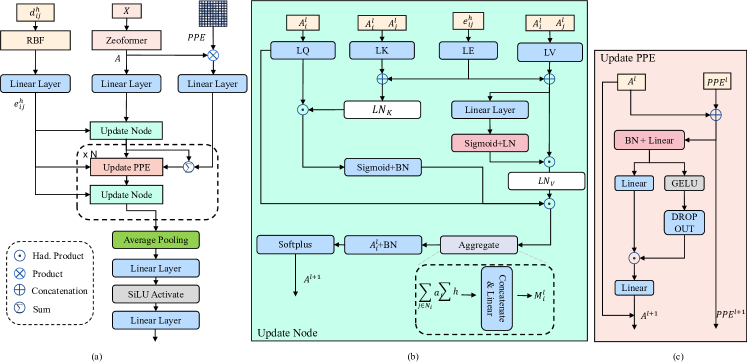
4.3 The Architecture of Zeoformer
In this section, we introduce the information propagation scheme of Zeoformer. The information propagation scheme of Zeoformer consists of four parts: the graph embedding layer, node-wise transformer layer, message passing layer, and output layer. Figure 5 illustrates the overall framework architecture of Zeoformer.
Feature Embedding Layer.
First, let’s introduce the construction of the graph embedding layer. We use the atomic encoding from CGCNN for embedding. For the edge information , we use radial basis functions to encode the distance between two adjacent nodes in the graph, represented by Equation 1, where and are hyperparameters. For the periodic pattern encoding, we perform matrix multiplication on to carry out the initial aggregation of atomic information, obtaining information for the message passing layer. Thus, we obtain the graph embedding as
| (1) |
where denotes the Hadamard product.
Node-wise Transformer Layer.
Building upon the constructed graph, we aggregate the node information. Let represent the input feature vector of node at layer in Zeoformer. The information propagation scheme for layer is described as follows. We use and to denote concatenation and element-wise product. The message from node to is formed by the corresponding query , key , and value features as follows :
| (2) |
where LQ, LK, LV, and LE are the linear transformations for query, key, value, and edge features. , are the nonlinear transformations for key and value, including two linear layers and an activation layer in between. represents the linear transformation for updating messages, and denotes the layer normalization operation. BN denotes the batch normalization layer, and is the dimension of .
Then, we obtain the message by aggregating the information from the neighborhood of node over multiple edges, and is realized as follows :
| (3) |
where is the linear transformation used for updating the edge messages.
Message Passing Layer.
and represent the atomic features and 3D periodic pattern encoding at layer , respectively. Its message-passing mechanism is as follows:
| (4) |
In this process, we update using residual connections He et al. (2016).
Finally, we use average pooling to aggregate the features of all nodes in the graph, followed by a nonlinear layer, and then a linear layer to obtain the scalar output of the graph as described above. A detailed description of the Zeoformer architecture can be found in Appendix F.
5 Experimental Studies
5.1 Experimental Setup
We conducted experiments on one OSDA-zeolite pair dataset (referred to as the OSDB Schwalbe-Koda et al. (2021) dataset) and two material benchmark datasets, namely the Materials Project Chen et al. (2019) and Jarvis Choudhary et al. (2020). Detailed descriptions of the three datasets can be found in the Appendix A. Baseline methods include CFID Choudhary et al. (2018), CGCNN Xie and Grossman (2018), SchNet Schütt et al. (2017), MEGNET Chen et al. (2019), GATGNN Louis et al. (2020), ALIGNN Choudhary and DeCost (2021), M3GNet Chen and Ong (2022), Matformer Yan et al. (2022), PotNetLin et al. (2023), CrysMMNet Das et al. (2023), CrysDiff Song et al. (2024), Crystalformer Taniai et al. (2024), and ComFormer Yan et al. (2024). For all baseline methods on the material datasets, we report the results provided in the cited papers. Results for all baseline models on the OSDB dataset are based on experimental replications using their open-source code. Detailed Zeoformer configurations for different tasks are provided in the Appendix G.
5.2 Experimental Results
| Method | Num. Layer | Ehull | Banding |
|---|---|---|---|
| Zeoformer | 4,0 | 40.6 | 8.351 |
| Zeoformer w | 3,2 | 36.3 | 6.113 |
| Zeoformer w/o | 4,3 | 36.1 | 7.416 |
| Zeoformer w | 4,3 | 33.5 | 5.996 |
OSDB Dataset.
The dataset can be accessed through Schwalbe-Koda et al. (2021), comprising OSDA-zeolite pairs. We retrained all baseline models. To ensure a fair comparison, all baseline models were retrained under identical conditions, ensuring identical training, validation, and test sets, and reported the results for the prediction of four properties in Table 1. Please refer to Appendix I for the other four properties. Detailed configuration information for the retrained baseline models is provided in Appendix H. The metric used is the testing mean absolute error (MAE). Compared to previous studies, Zeoformer achieved the best results across all prediction tasks, demonstrating significant improvements over other baseline models.
JARVIS. The quantitative results for JARVIS Choudhary et al. (2020) are shown in Table 2. Zeoformer achieves superior performance across all tasks. Notably, Zeoformer demonstrates over % improvement compared to the ComFormer variants in the Ehull task. Additionally, we present results for another tasks in Appendix I, where Zeoformer also achieves better performance.
The Materials Project (MP). The experimental results are shown in Table 3. It can be seen that Zeoformer outperforms other baseline models across tasks using training samples. Additionally, Zeoformer achieves competitive results in the bulk moduli and shear moduli tasks with only training samples.
Efficiency.
We compared ZeoFormer on the formation energy task in the JARVIS dataset against Matformer and variants of ComFormer. The results show that Zeoformer significantly outperforms in both training and inference speed while consuming fewer computational resources. For more details, please refer to Appendix I.
Overall, Zeoformer not only achieves excellent results on the OSDA-zeolite dataset but also performs well on benchmark material datasets, demonstrating the model’s outstanding generalization performance and robustness.
5.3 Ablation Studies
In this section, we demonstrate the impact of periodic pattern encoding on the representation learning of OSDA-zeolite and crystal materials through ablation studies. Specifically, we conducted experiments on the OSDB and JARVIS datasets by comparing the results for Banding total and Ehull attributes, using testing MAE as the quantitative evaluation metric.
By comparing models with different layers of periodic pattern encoding against models without periodic pattern encoding but retaining the message passing layer, we validate the importance of periodic pattern encoding. The results show that compared to networks without periodic pattern encoding, we achieved improvements of % and % in the Banding total and Ehull tasks, respectively. Compared to the models that retain only the message passing layer but lack periodic pattern encoding, we achieved improvements of % and % in these two tasks, respectively.
6 Conclusions
In order to predict the OSDA-Zeolite Affinity, we proposed a novel model called Zeoformer. By reconstructing the unit cell centered on each atom and encoding the pairwise distances between this central atom and other atoms, Zeoformer better represents the geometric structure of OSDA-zeolite pairs, capturing both coarse-grained crystal periodicity and fine-grained local variability. Experimental results on three datasets demonstrate that our Zeoformer significantly outperforms baseline methods in various property prediction tasks. Our model helps narrow down the search space for candidate OSDAs, demonstrating significant potential in the field of directed zeolite synthesis. Future work will explore more intrinsic structures of the OSDA-Zeolite pair and generate reasonable OSDA-Zeolite structures.
References
- Ackley et al. [2003] Mark W Ackley, Salil U Rege, and Himanshu Saxena. Application of natural zeolites in the purification and separation of gases. Microporous and Mesoporous Materials, 61(1-3):25–42, 2003.
- Baerlocher and McCusker [2021] Ch Baerlocher and LB McCusker. Database of zeolite structures: http://www. iza-structure. org/databases. Google Scholar There is no corresponding record for this reference, 2021.
- Chai et al. [2021] Yuchao Chai, Weili Dai, Guangjun Wu, Naijia Guan, and Landong Li. Confinement in a zeolite and zeolite catalysis. Accounts of Chemical Research, 54(13):2894–2904, 2021.
- Chen and Ong [2022] Chi Chen and Shyue Ping Ong. A universal graph deep learning interatomic potential for the periodic table. Nature Computational Science, 2(11):718–728, 2022.
- Chen et al. [2019] Chi Chen, Weike Ye, Yunxing Zuo, Chen Zheng, and Shyue Ping Ong. Graph networks as a universal machine learning framework for molecules and crystals. Chemistry of Materials, 31(9):3564–3572, 2019.
- Choudhary and DeCost [2021] Kamal Choudhary and Brian DeCost. Atomistic line graph neural network for improved materials property predictions. npj Computational Materials, 7(1):185, 2021.
- Choudhary et al. [2018] Kamal Choudhary, Brian DeCost, and Francesca Tavazza. Machine learning with force-field-inspired descriptors for materials: Fast screening and mapping energy landscape. Physical review materials, 2(8):083801, 2018.
- Choudhary et al. [2020] Kamal Choudhary, Kevin F Garrity, Andrew CE Reid, Brian DeCost, Adam J Biacchi, Angela R Hight Walker, Zachary Trautt, Jason Hattrick-Simpers, A Gilad Kusne, Andrea Centrone, et al. The joint automated repository for various integrated simulations (jarvis) for data-driven materials design. npj computational materials, 6(1):173, 2020.
- Corma et al. [2006] Avelino Corma, Manuel Moliner, Jose M Serra, Pedro Serna, María J Díaz-Cabañas, and Laurent A Baumes. A new mapping/exploration approach for ht synthesis of zeolites. Chemistry of materials, 18(14):3287–3296, 2006.
- Daeyaert et al. [2019] Frits Daeyaert, Fengdan Ye, and Michael W Deem. Machine-learning approach to the design of osdas for zeolite beta. Proceedings of the National Academy of Sciences, 116(9):3413–3418, 2019.
- Das et al. [2023] Kishalay Das, Pawan Goyal, Seung-Cheol Lee, Satadeep Bhattacharjee, and Niloy Ganguly. Crysmmnet: multimodal representation for crystal property prediction. In Uncertainty in Artificial Intelligence, pages 507–517. PMLR, 2023.
- Dusselier and Davis [2018] Michiel Dusselier and Mark E Davis. Small-pore zeolites: synthesis and catalysis. Chemical reviews, 118(11):5265–5329, 2018.
- He et al. [2016] Kaiming He, Xiangyu Zhang, Shaoqing Ren, and Jian Sun. Deep residual learning for image recognition. In Proceedings of the IEEE conference on computer vision and pattern recognition, pages 770–778, 2016.
- Jensen et al. [2019] Zach Jensen, Edward Kim, Soonhyoung Kwon, Terry ZH Gani, Yuriy Román-Leshkov, Manuel Moliner, Avelino Corma, and Elsa Olivetti. A machine learning approach to zeolite synthesis enabled by automatic literature data extraction. ACS central science, 5(5):892–899, 2019.
- Jensen et al. [2021] Zach Jensen, Soonhyoung Kwon, Daniel Schwalbe-Koda, Cecilia Paris, Rafael Gómez-Bombarelli, Yuriy Román-Leshkov, Avelino Corma, Manuel Moliner, and Elsa A Olivetti. Discovering relationships between osdas and zeolites through data mining and generative neural networks. ACS central science, 7(5):858–867, 2021.
- Li and Yu [2014] Yi Li and Jihong Yu. New stories of zeolite structures: their descriptions, determinations, predictions, and evaluations. Chemical reviews, 114(14):7268–7316, 2014.
- Lin et al. [2023] Yuchao Lin, Keqiang Yan, Youzhi Luo, Yi Liu, Xiaoning Qian, and Shuiwang Ji. Efficient approximations of complete interatomic potentials for crystal property prediction. In International Conference on Machine Learning, pages 21260–21287. PMLR, 2023.
- Louis et al. [2020] Steph-Yves Louis, Yong Zhao, Alireza Nasiri, Xiran Wang, Yuqi Song, Fei Liu, and Jianjun Hu. Graph convolutional neural networks with global attention for improved materials property prediction. Physical Chemistry Chemical Physics, 22(32):18141–18148, 2020.
- Manuel Serra et al. [2007] Jose Manuel Serra, Laurent Allen Baumes, Manuel Moliner, Pedro Serna, and Avelino Corma. Zeolite synthesis modelling with support vector machines: a combinatorial approach. Combinatorial chemistry & high throughput screening, 10(1):13–24, 2007.
- Moliner et al. [2008] Manuel Moliner, Pedro Serna, Ángel Cantín, Germán Sastre, Maria J Diaz-Cabanas, and Avelino Corma. Synthesis of the ti- silicate form of bec polymorph of -zeolite assisted by molecular modeling. The Journal of Physical Chemistry C, 112(49):19547–19554, 2008.
- Moliner et al. [2015] Manuel Moliner, Cristina Martínez, and Avelino Corma. Multipore zeolites: synthesis and catalytic applications. Angewandte Chemie International Edition, 54(12):3560–3579, 2015.
- Muraoka et al. [2019] Koki Muraoka, Yuki Sada, Daiki Miyazaki, Watcharop Chaikittisilp, and Tatsuya Okubo. Linking synthesis and structure descriptors from a large collection of synthetic records of zeolite materials. Nature communications, 10(1):4459, 2019.
- Pérez-Botella et al. [2022] Eduardo Pérez-Botella, Susana Valencia, and Fernando Rey. Zeolites in adsorption processes: State of the art and future prospects. Chemical Reviews, 122(24):17647–17695, 2022.
- Schmidt et al. [2014] Joel E Schmidt, Michael W Deem, and Mark E Davis. Synthesis of a specified, silica molecular sieve by using computationally predicted organic structure-directing agents. Angewandte Chemie, 126(32):8512–8514, 2014.
- Schütt et al. [2017] Kristof Schütt, Pieter-Jan Kindermans, Huziel Enoc Sauceda Felix, Stefan Chmiela, Alexandre Tkatchenko, and Klaus-Robert Müller. Schnet: A continuous-filter convolutional neural network for modeling quantum interactions. Advances in neural information processing systems, 30, 2017.
- Schwalbe-Koda and Gómez-Bombarelli [2021] Daniel Schwalbe-Koda and Rafael Gómez-Bombarelli. Benchmarking binding energy calculations for organic structure-directing agents in pure-silica zeolites. The Journal of Chemical Physics, 154(17), 2021.
- Schwalbe-Koda et al. [2019] Daniel Schwalbe-Koda, Zach Jensen, Elsa Olivetti, and Rafael Gómez-Bombarelli. Graph similarity drives zeolite diffusionless transformations and intergrowth. Nature materials, 18(11):1177–1181, 2019.
- Schwalbe-Koda et al. [2021] Daniel Schwalbe-Koda, Soonhyoung Kwon, Cecilia Paris, Estefania Bello-Jurado, Zach Jensen, Elsa Olivetti, Tom Willhammar, Avelino Corma, Yuriy Román-Leshkov, Manuel Moliner, et al. A priori control of zeolite phase competition and intergrowth with high-throughput simulations. Science, 374(6565):308–315, 2021.
- Serati-Nouri et al. [2020] Hamed Serati-Nouri, Amir Jafari, Leila Roshangar, Mehdi Dadashpour, Younes Pilehvar-Soltanahmadi, and Nosratollah Zarghami. Biomedical applications of zeolite-based materials: A review. Materials Science and Engineering: C, 116:111225, 2020.
- Servatan et al. [2020] Morteza Servatan, Payam Zarrintaj, Ghader Mahmodi, Seok-Jhin Kim, Mohammad Reza Ganjali, Mohammad Reza Saeb, and Masoud Mozafari. Zeolites in drug delivery: Progress, challenges and opportunities. Drug Discovery Today, 25(4):642–656, 2020.
- Shin et al. [2019] Jiho Shin, Donghui Jo, and Suk Bong Hong. Rediscovery of the importance of inorganic synthesis parameters in the search for new zeolites. Accounts of Chemical Research, 52(5):1419–1427, 2019.
- Song et al. [2024] Zixing Song, Ziqiao Meng, and Irwin King. A diffusion-based pre-training framework for crystal property prediction. In Proceedings of the AAAI Conference on Artificial Intelligence, volume 38, pages 8993–9001, 2024.
- Taniai et al. [2024] Tatsunori Taniai, Ryo Igarashi, Yuta Suzuki, Naoya Chiba, Kotaro Saito, Yoshitaka Ushiku, and Kanta Ono. Crystalformer: infinitely connected attention for periodic structure encoding. arXiv preprint arXiv:2403.11686, 2024.
- Weitkamp [2000] Jens Weitkamp. Zeolites and catalysis. Solid state ionics, 131(1-2):175–188, 2000.
- Xie and Grossman [2018] Tian Xie and Jeffrey C Grossman. Crystal graph convolutional neural networks for an accurate and interpretable prediction of material properties. Physical review letters, 120(14):145301, 2018.
- Yan et al. [2022] Keqiang Yan, Yi Liu, Yuchao Lin, and Shuiwang Ji. Periodic graph transformers for crystal material property prediction. Advances in Neural Information Processing Systems, 35:15066–15080, 2022.
- Yan et al. [2024] Keqiang Yan, Cong Fu, Xiaofeng Qian, Xiaoning Qian, and Shuiwang Ji. Complete and efficient graph transformers for crystal material property prediction. arXiv preprint arXiv:2403.11857, 2024.