CaRDiff: Video Salient Object Ranking Chain of Thought Reasoning
for Saliency Prediction with Diffusion
Abstract
Video saliency prediction aims to identify the regions in a video that attract human attention and gaze, driven by bottom-up features from the video and top-down processes like memory and cognition. Among these top-down influences, language plays a crucial role in guiding attention by shaping how visual information is interpreted. Existing methods primarily focus on modeling perceptual information while neglecting the reasoning process facilitated by language, where ranking cues are crucial outcomes of this process and practical guidance for saliency prediction. In this paper, we propose CaRDiff (Caption, Rank, and generate with Diffusion), a framework that imitates the process by integrating multimodal large language model (MLLM), a grounding module, and a diffusion model, to enhance video saliency prediction. Specifically, we introduce a novel prompting method VSOR-CoT (Video Salient Object Ranking Chain of Thought), which utilizes an MLLM with a grounding module to caption video content and infer salient objects along with their rankings and positions. This process derives ranking maps that can be sufficiently leveraged by the diffusion model to decode the saliency maps for the given video accurately. Extensive experiments show the effectiveness of VSOR-CoT in improving the performance of video saliency prediction. The proposed CaRDiff performs better than state-of-the-art models on the MVS dataset and demonstrates cross-dataset capabilities on the DHF1k dataset through zero-shot evaluation.
Introduction
With the rapid growth of online video platforms, millions of videos are produced and consumed daily. This surge presents new challenges in video processing, such as enhancing video quality to improve user experience and compressing videos to save storage costs. Identifying regions of interest (ROIs) within videos has, therefore, become crucial: on the one hand, quality enhancement can focus on these regions; on the other hand, compression algorithms can be locally applied to non-interest regions. This maximizes users’ experience while minimizing video storage and transmission costs.
This growing importance of identifying and prioritizing ROIs in videos has led to increased research on video saliency prediction (Droste, Jiao, and Noble 2020; Bellitto et al. 2021; Wang et al. 2021b; Jain et al. 2021; Ma et al. 2022; Xiong et al. 2024; Wen et al. 2024), which aims to predict the regions of a video most likely to capture human attention and gaze.
Though significant progress has been made in this area, as today’s video content becomes increasingly rich and scenes become more complex, video saliency prediction models trained on limited-size and limited-scope datasets (Wang et al. 2018; Mathe and Sminchisescu 2015) are gradually becoming inadequate. To address this issue, some works have proposed datasets with more diverse scenes, such as the NPF (Yang et al. 2023) and the MVS dataset (Wen et al. 2024). However, due to the high costs associated with fixation annotation, the size of these datasets remains limited. Instead of attempting to create a larger dataset, we sought a solution by analyzing the characteristics of the human gaze: human gaze control during real-world scene perception is influenced by bottom-up stimulus-based information and top-down memory-based knowledge from internal visual and cognitive systems (Buswell 1935; Yarbus 2013). In most cases, the duration and position of individual fixations are determined by the latter (Loftus and Mackworth 1978; Henderson, Weeks Jr, and Hollingworth 1999; Henderson 2003), with language playing a role in this process guiding visual attention. To involve high-level semantics as an auxiliary, captioning has been leveraged to improve salient object detection (Zhang et al. 2019). However, they are still limited to the qualities of captions and lack an understanding of the importance of individual objects mentioned in the captions. Additionally, salient object ranking implies that the importance of objects can aid in saliency map prediction (Kalash, Islam, and Bruce 2019; Song et al. 2023a). Therefore, we believe the role of language in human gaze control is primarily to reason out a salient object ranking, which assists the visual system in locating salient regions.
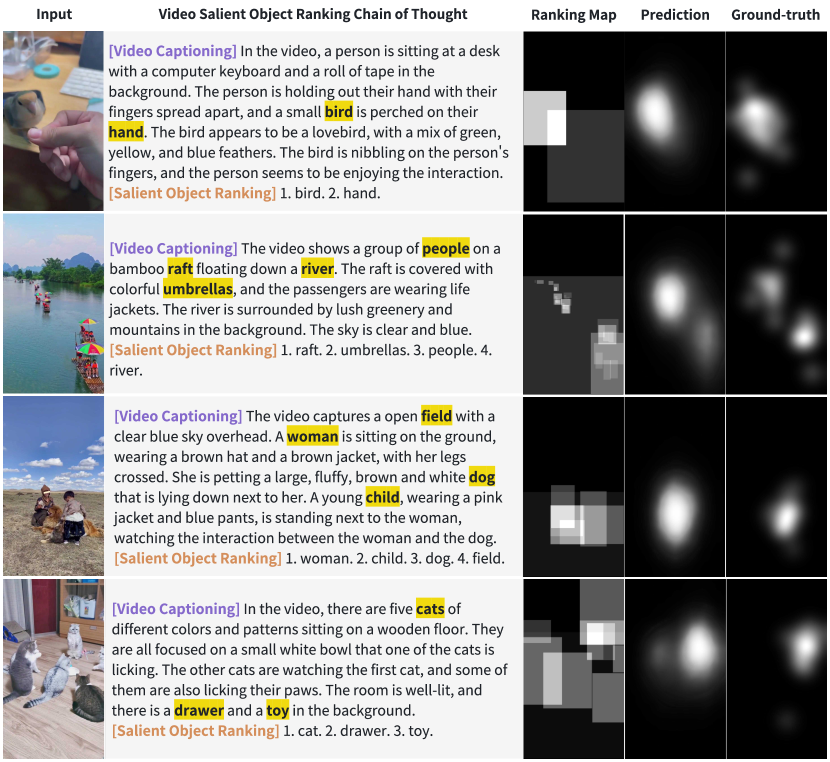
Based on the above analysis, we propose CaRDiff (Caption, Rank, and generate with Diffusion), a framework designed to enhance video saliency prediction by integrating a multimodal large language model (MLLM) to capture high-level semantics explicitly. Specifically, we introduce a novel prompting method named VSOR-CoT (Video Salient Object Ranking Chain of Thought). Instead of only generating captions as an auxiliary (Zhang et al. 2019), VSOR-CoT leverages the strong reasoning capability of MLLM to explicitly derive salient object ranking through chain-of-thought reasoning after generating high-quality video captions. Unlike the implicit way (Zhang et al. 2019) to convey the semantic cues with an attention map, we introduce ranking maps, as shown in Figure 1 (d) to represent locations and ranking cues of salient objects with bounding boxes and grayscale values, where the locations are captured by a grounding module and the ranking are derived from VSOR-CoT. Combined with the video frames, these ranking maps serve as decoding conditions for a diffusion model to predict the final saliency maps. The proposed CaRDiff achieves state-of-the-art performance on MVS (Wen et al. 2024). It also shows cross-dataset capability on the popular video saliency prediction benchmark DHF1k through zero-shot evaluation.
In short, our main contributions are as follows:
-
•
We propose an s innovative video saliency prediction framework, CaRDiff. Based on the powerful reasoning capacity of MLLM, salient objects with their ranking can be reasoned out after video captioning through the proposed VSOR-CoT.
-
•
We introduce ranking maps to maintain the position and ranking cues of salient objects, which are derived from reasoning results of VSOR-CoT and seamlessly guide the diffusion process to enhance saliency prediction.
-
•
Experimental results show that the proposed CaRDiff achieves state-of-the-art performance on the MVS dataset and cross-dataset capability on the popular video saliency prediction benchmark DHF1k through zero-shot evaluation.
Related Work
Video Saliency Prediction and Ranking.
Saliency detection aims to predict the regions in an image or video that attract human attention. Early works about video saliency prediction include ITTI (Itti, Koch, and Niebur 1998) and GBVS (Schölkopf, Platt, and Hofmann 2007). In recent years, deep learning-based methods have significantly progressed in video saliency prediction (Huang et al. 2015; Pan et al. 2017; Jiang et al. 2020; Lai et al. 2020; Droste, Jiao, and Noble 2020; Wang et al. 2021b; Wen et al. 2024). Some methods (Liu et al. 2020; Tsiami, Koutras, and Maragos 2020; Yang et al. 2023; Xiong et al. 2024) utilize multimodal information in videos to improve the performance of video saliency prediction. These methods mainly focus on fusing the visual and audio signals to predict the saliency map. Saliency Object Ranking aims to rank the salient objects in an image or video according to their saliency levels (Islam, Kalash, and Bruce 2018). It utilizes more semantics from videos and has potential benefits for video saliency prediction tasks (Kalash, Islam, and Bruce 2019; Song et al. 2023a).
Multimodal LLM and Chain-of-Thought.
Multimodal Large Language Models (MLLMs) have achieved significant progress in various multimodal tasks. Some methods (Zhang, Li, and Bing 2023; Liu et al. 2024; Wang et al. 2023; Tang et al. 2024; Hua et al. 2024b) use MLLMs to generate captions and summmarizations for images or videos. Others (Chen et al. 2023a; Peng et al. 2023; Xuan et al. 2024; Hua et al. 2024a) use MLLMs to infer the relationships between objects in images. They have also extended to the video domain for video understanding (Tang et al. 2023). The chain of thought is a prompting technique for LLMs/MLLMs that breaks down the reasoning process into multiple smaller steps, improving the accuracy of the results (Wei et al. 2022). For instance, when an LLM is asked to solve a math problem, it might make a mistake if asked for the answer directly. However, if the LLM generates a step-by-step solution process before arriving at the final answer, the accuracy increases.
Diffusion Model.
Recent advancements in diffusion models have significantly bolstered their efficacy in generative modeling (Ramesh et al. 2022; Song et al. 2023b). Denoising diffusion probabilistic models (DDPM) (Ho, Jain, and Abbeel 2020) and denoising diffusion implicit models (Song, Meng, and Ermon 2020) have provided a robust framework for iterative noise addition and removal. Architectural enhancements, notably incorporating attention mechanisms inspired by Transformer models, have further improved model performance (Peebles and Xie 2023). Apart from generative tasks, diffusion models can also be used for discriminative tasks, e.g., object detection (Chen et al. 2023b) and segmentation (Amit et al. 2021). Moreover, text-image alignment has been utilized to enhance the performance of diffusion models in various computer vision tasks, like detection and segmentation (Kondapaneni et al. 2024). Diff-Sal (Xiong et al. 2024) is a pioneer work that adopts a diffusion model to generate saliency maps conditioned by input video and audio, showing promising results compared to conventional methods.
Method: CaRDiff
In this section, we introduce our data curation method for VSOR-CoT Tuning data construction and CaRDiff’s architecture and training strategies.
Data Curation
Our data curation pipeline is shown in Figure 2. It is mainly based on the MVS (Wen et al. 2024), a dataset with videos across abundant scenarios, which contains 1007 video clips, each with fixation maps and saliency maps annotations. We first use Recognize Anything (Zhang et al. 2024) and GroundingDINO (Liu et al. 2023) to extract objects from each video frame, including the objects’ position represented by bounding box coordinates and tags. The objects’ tags and positions are combined with the number of gaze points in the fixation map inside the bounding box to calculate the salient ranking of the object , which is computed as:
| (1) |
where denotes the set of pixels within the bounding box of the object ; is the fixation map; measures the spatial size of , calculated as width height of the bounding box; indicates whether there is a fixation point at the spatial coordinate . The higher the value of , the higher the object’s salient. We then use this object information to generate the ranking response, which is part of the response output by the MLLM, i.e., the complement of VSOR-CoT. The ground-truth responses include two parts: (1) video captions and (2) salient object rankings. The latter is from the process above, while the former is generated by VILA-1.5 (Lin et al. 2024), the state-of-the-art open-source video-language model.
The rankings and positions determine the grayscale value of each pixel in the ranking maps, as defined by the equation:
| (2) |
The resulting values are then scaled to the range . The ranking map will be utilized during training, and it serves as a benchmark for comparison with the predicted ranking map for analytical purposes. Unlike relying on masks to represent the locations of salient objects in SOR, in the ranking maps, we only need the bounding boxes of the objects.
Architecture
Overview.
The proposed CaRDiff (Caption, Rank, and generate with Diffusion), as shown in Figure 3, which consists of an MLLM, a grounding module, and a diffusion model. The MLLM generates the caption for the video content and drives salient object ranking. The grounding module captures the locations of the salient objects. The ranking and the locations are then used to generate ranking maps. The diffusion takes the ranking maps and the video frames as conditions to decode the corresponding saliency maps.
MLLM with VSOR-CoT.
Our MLLM is built upon LLaVA (Liu et al. 2024). For an input video consisting of frames, the visual features are first extracted using a pre-trained vision encoder, specifically CLIP ViT-14/L (Radford et al. 2021). These features are then processed through a Projector, a linear layer designed to align the visual semantic space with the LLM’s input space. A text instruction is tokenized and provided to the LLM along with the visual features. The LLM then generates a video caption and a salient object ranking list based on the inputs and :
| (3) |
The salient object ranking list is derived from the caption through the VSOR-CoT process during LLM inference. This ranking list includes a set of salient object tags and their corresponding rankings , as illustrated in Figure 3. Specifically, during LLM inference, the probability of the ranking list can be decomposed as follows:
| (4) | ||||
where the probability of each rank is calculated based on the preceding ranks , the caption , the instruction , and the visual features . The VSOR-CoT method ensures that the ranking list is generated in a contextually coherent manner by considering the interactions between the video caption and the salient objects.
Grounding Module.
Our grounding module is based on GroundingDINO (Liu et al. 2023) to capture the locations of the salient objects predicted by VSOR-CoT. It can take textual tags as prompts to ground objects in images or frames, where the prompts are from the tags predicted by MLLM:
| (5) |
where is the set of locations (bounding boxes) of these salient objects.
Ranking Map Synthesis.
The predicted ranking map is synthesized according to the predicted objects’ locations and their ranking :
| (6) |
which is a bit different from the ranking map in annotations. The ranking map will have regions corresponding to these objects with their respective grayscale intensities.
Saliency Diffusion Prediction.
The diffusion model in CaRDiff involves two main phases: the forward and reverse denoising processes. In the forward process, noise is added to the saliency map over a series of time steps :
| (7) |
where . At each time step, noise is added:
| (8) |
In the reverse process, the goal is to remove the noise using a U-Net-based diffusion model that predicts the de-noised saliency map :
| (9) |
where is video features, is predicted ranking map, and is the position-wise product and concatenation.
Three-Stages Training
CaRDiff’s training process includes three stages: modality alignment, CoT tuning, and diffusion training.
Modality Alignment.
Modality alignment involves aligning visual features with the input space of the LLM (Language Model). During this stage, only a single-layer projector is updated throughout the training process. The training task is image captioning, utilizing the LCS-558K dataset (Liu et al. 2024), which is a subset comprising 558K image-text pairs from LAION-CC-SBU with BLIP-generated captions (Li et al. 2023). The instruction prompts the MLLM to generate captions for given images. The loss function employed in this process is the cross-entropy loss, defined as follows:
| (10) |
where represents the t-th word in the caption, and denotes the visual features extracted from the image. This cross-entropy loss encourages the model to generate captions that closely match the ground truth descriptions.
CoT Tuning.
At this stage, multiple video frame features will replace the input image feature in the first stage. The instruction prompts the MLLM to predict video captions and the saliency object ranking following the Equation 4. The parameters of the Projector, vision encoder, and MLLM are frozen. The fine-tuning is supervised by the annotations obtained from the data curation process. The loss function also follows Equation 10.
Diffusion Training.
The diffusion model is trained by minimizing the Mean Squared Error (MSE) loss between the predicted noise and the actual noise added during the forward diffusion process:
| (11) |
where and is the actual noise. This loss function ensures the neural network accurately predicts the noise, allowing effective denoising in the reverse process.
By encoding the ranks of salient objects in a grayscale ranking map and integrating these with the video frames, the CaRDiff framework guides the diffusion model to focus on regions of higher importance, resulting in an accurate and semantically meaningful saliency map.
Experiments
In this section, we introduce the experimental evaluations of our CaRDiff method against state-of-the-art models. Our experiments include the comparison of performance on the MVS dataset, ablation study, ranking map ratio experiments, ranking correlation analysis, ranking map replacement experiments, and cross-dataset zero-shot evaluation.
Experiment Setups
Datasets.
We evaluate our method on the MVS dataset with rich video contents and complex scenarios for the maintenance comparison. We also evaluate our method on the validation set of DHF1k (Wang et al. 2018) datasets for cross-dataset zero-shot evaluation.
| Methods | Attributes | Performance | |||||||||||
|---|---|---|---|---|---|---|---|---|---|---|---|---|---|
|
|
Modality |
|
AUC-J | CC | Sim | NSS | ||||||
| ITTI (Itti, Koch, and Niebur 1998) | ✗ | ✗ | V | Non-DL | 0.783 | 0.435 | 0.464 | 0.978 | |||||
| GBVS (Schölkopf, Platt, and Hofmann 2007) | ✗ | ✗ | V | Non-DL | 0.808 | 0.492 | 0.491 | 1.097 | |||||
| SALICON (Huang et al. 2015) | ✗ | ✓ | V | KLD, NSS, Sim | 0.814 | 0.523 | 0.512 | 1.261 | |||||
| AWS-D (Leborán et al. 2017) | ✓ | ✗ | V | Non-DL | 0.675 | 0.240 | 0.384 | 0.560 | |||||
| SalGAN (Pan et al. 2017) | ✗ | ✓ | V | MSE, BCE | 0.812 | 0.511 | 0.503 | 1.269 | |||||
| SAM (Cornia et al. 2018) | ✗ | ✓ | V | CC, NSS, KLD | 0.818 | 0.531 | 0.522 | 1.274 | |||||
| DeepVS (Jiang et al. 2020) | ✓ | ✗ | V | KLD | 0.811 | 0.475 | 0.496 | 1.160 | |||||
| ACLNet (Wang et al. 2021a) | ✓ | ✓ | V | CC, NSS, KLD | 0.821 | 0.542 | 0.524 | 1.251 | |||||
| STRA-Net (Lai et al. 2020) | ✓ | ✓ | V | KLD, NSS, Sim, CC | 0.826 | 0.563 | 0.531 | 1.289 | |||||
| SalEMA (Linardos et al. 2019) | ✓ | ✓ | V | BCE | 0.835 | 0.591 | 0.544 | 1.326 | |||||
| TASED (Min and Corso 2019) | ✓ | ✓ | V | KLD | 0.850 | 0.638 | 0.576 | 1.486 | |||||
| ESAN (Chen et al. 2021) | ✓ | ✓ | V | KLD, NSS, Sim, CC | 0.853 | 0.645 | 0.590 | 1.517 | |||||
| UNISAL (Droste, Jiao, and Noble 2020) | ✓ | ✓ | V | CC, NSS, KLD | 0.855 | 0.654 | 0.586 | 1.524 | |||||
| HD2S (Bellitto et al. 2021) | ✓ | ✓ | V | KLD | 0.858 | 0.662 | 0.603 | 1.550 | |||||
| STSANet (Wang et al. 2021b) | ✓ | ✓ | V | KLD, CC | 0.856 | 0.657 | 0.594 | 1.555 | |||||
| ViNet (Jain et al. 2021) | ✓ | ✓ | V | KLD | 0.857 | 0.664 | 0.595 | 1.561 | |||||
| VSFT (Ma et al. 2022) | ✓ | ✓ | V | KLD, NSS, Sim, CC | 0.857 | 0.666 | 0.597 | 1.572 | |||||
| Diff-Sal (Xiong et al. 2024) | ✓ | ✓ | V, A | MSE | 0.852 | 0.626 | 0.577 | 1.591 | |||||
| MVFormer (Wen et al. 2024) | ✓ | ✓ | V | KLD, NSS, Sim | 0.864 | 0.687 | 0.614 | 1.646 | |||||
| CaRDiff (ours) | ✓ | ✓ | V, L | CE, MSE | 0.870 | 0.714 | 0.630 | 1.685 | |||||
Evaluation Metrics.
We use several standard metrics to evaluate the performance of saliency prediction models: Correlation Coefficient (CC) measures the linear relationship between the predicted and ground truth saliency maps, indicating how well the model’s predictions match the actual data. Normalized Scanpath Saliency (NSS) evaluates the predicted saliency map using human fixation data, assessing how well the model predicts where humans are likely to focus. Similarity Metric (SIM) measures the similarity between the predicted and ground truth saliency maps. Area Under the Curve-Judd (AUC-J) assesses the model’s ability to predict human fixation points, using a metric that combines the true positive rate and false positive rate to evaluate performance. The detailed calculation methods can be found in the Appendix.
Baseline Methods.
We compare our method with various state-of-the-art approaches, including ITTI (Itti, Koch, and Niebur 1998), GBVS (Schölkopf, Platt, and Hofmann 2007), SALICON (Huang et al. 2015), AWS-D (Leborán et al. 2017), SalGAN (Pan et al. 2017), SAM (Cornia et al. 2018), DeepVS (Jiang et al. 2020), ACLNet (Wang et al. 2021a), STRA-Net (Lai et al. 2020), SalEMA (Linardos et al. 2019), TASED (Min and Corso 2019), ESAN (Chen et al. 2021), UNISAL (Droste, Jiao, and Noble 2020), HD2S (Bellitto et al. 2021), STSANet (Wang et al. 2021b), ViNet (Jain et al. 2021), VSFT (Ma et al. 2022), Diff-Sal (Xiong et al. 2024), and MVFormer (Wen et al. 2024).
Implementation Details.
The LLM adopted is Vicuna-v1.5-7B (Touvron et al. 2023). At the modality alignment, we fine-tune the projector layer for two epochs with a learning rate of . At the CoT tuning stage, we fine-tune the LoRA in the LLM with a learning rate of for two epochs. Both the first stage and the second stage are conducted on one NVIDIA A100 80G GPU. At the subsequent diffusion training stage, we use four NVIDIA V100 32G GPUs for three epochs, with a learning rate of . The encoder for frames and ranking maps is MViT-v2 (Li et al. 2022) pre-trained on the K400 dataset (Kay et al. 2017). The decoded saliency maps are for the MVS dataset.
Experimental Results
Performance Comparison.
The performances of baseline models and our CaRDiff are shown in Table 1. Our method achieves state-of-the-art performance across all evaluation metrics on the MVS dataset. Specifically, CaRDiff achieves the highest CC, NSS, SIM, and AUC-J scores, demonstrating its superior ability to predict saliency in mobile videos.
Cross-dataset Performance.
To evaluate the generalizability of our model, we test its zero-shot performance on unseen datasets. Our model maintains performance without any fine-tuning on DHF1k, indicating its robustness and adaptability to different types of video content.
| Model | AUC-J | CC | Sim | NSS |
|---|---|---|---|---|
| Diff-Sal | 0.802 | 0.218 | 0.192 | 1.069 |
| MVFormer | 0.844 | 0.299 | 0.198 | 1.501 |
| CaRDiff (ours) | 0.845 | 0.312 | 0.235 | 1.584 |
Ablation Study.
We conduct an ablation study to assess the contribution of each component in our proposed method, as shown in Table 3. The results indicate that VSOR-CoT significantly enhances performance, regardless of whether VSOR-CoT fine-tuning (FT) or zero-shot CoT (ZS) is employed. Notably, FT outperforms ZS, underscoring the necessity of CoT Tuning. Additionally, although the ranking maps play a crucial transitional role and cannot be directly ablated, they can be replaced. Thus, we designed the following Ranking Map Replacement Experiments.
| Setting | AUC-J | CC | NSS | Sim |
|---|---|---|---|---|
| FT w/ VSOR-CoT | 0.870 | 0.714 | 1.685 | 0.630 |
| FT w/o VSOR-CoT | 0.864 | 0.700 | 1.614 | 0.624 |
| ZS w/ VSOR-CoT | 0.855 | 0.659 | 1.515 | 0.590 |
| ZS w/o VSOR-CoT | 0.846 | 0.626 | 1.459 | 0.577 |
Ranking Map Ratio Experiments.
We noticed that the different ratios of ranking maps used influenced the results. Therefore, we test different ranking map ratios of 0, 1/16, 1/8, 1/4, 1/2, and 1 on the MVS dataset. The results are shown in Figure 5 (a) and Table 4, showing applying ranking maps to 1/4 input frames achieves the highest performance.
| Ranking Map Ratio | AUC-J | CC | NSS | Sim |
|---|---|---|---|---|
| 0 | 0.867 | 0.700 | 1.645 | 0.621 |
| 1/16 | 0.869 | 0.709 | 1.670 | 0.626 |
| 1/8 | 0.870 | 0.712 | 1.678 | 0.629 |
| 1/4 | 0.870 | 0.714 | 1.685 | 0.630 |
| 1/2 | 0.869 | 0.710 | 1.668 | 0.628 |
| 1 | 0.866 | 0.704 | 1.654 | 0.622 |
Ranking Map Replacement Experiments.
We also conduct ranking map replacement experiments by replacing the predicted ranking maps with random ranking maps, which causes saliency shifts as shown in Figure 6. This further proves the guidance of accurate ranking maps is crucial.
Ranking-Saliency Correlation Analysis
We perform a ranking-saliency correlation analysis to understand how well the predicted saliency maps correlate with human eye-tracking data (also shown in (b) and (c) of Figure 5). The high correlation indicates that our model accurately captures regions of interest, demonstrating the rankings or ranking maps predicted by FT are more closely aligned with the ground truth compared to those generated by ZS.
Conclusion
In this paper, we introduced CaRDiff, a novel framework for video saliency prediction that leverages the reasoning capabilities of multimodal large language models. By integrating video captioning and the innovative VSOR-CoT method, CaRDiff effectively ranks salient objects and generates ranking maps that guide diffusion models to predict accurate saliency maps. Our approach outperforms existing state-of-the-art methods on the MVS dataset and demonstrates strong cross-dataset generalization on the DHF1k benchmark. These results validate the effectiveness of incorporating high-level semantics and reasoning in enhancing video saliency prediction.
References
- Amit et al. (2021) Amit, T.; Shaharbany, T.; Nachmani, E.; and Wolf, L. 2021. Segdiff: Image segmentation with diffusion probabilistic models. arXiv preprint arXiv:2112.00390.
- Bellitto et al. (2021) Bellitto, G.; Proietto Salanitri, F.; Palazzo, S.; Rundo, F.; Giordano, D.; and Spampinato, C. 2021. Hierarchical domain-adapted feature learning for video saliency prediction. International Journal of Computer Vision, 129: 3216–3232.
- Buswell (1935) Buswell, G. T. 1935. How people look at pictures: a study of the psychology and perception in art.
- Chen et al. (2021) Chen, J.; Song, H.; Zhang, K.; Liu, B.; and Liu, Q. 2021. Video saliency prediction using enhanced spatiotemporal alignment network. Pattern Recognition, 109: 107615.
- Chen et al. (2023a) Chen, K.; Zhang, Z.; Zeng, W.; Zhang, R.; Zhu, F.; and Zhao, R. 2023a. Shikra: Unleashing multimodal llm’s referential dialogue magic. arXiv preprint arXiv:2306.15195.
- Chen et al. (2023b) Chen, S.; Sun, P.; Song, Y.; and Luo, P. 2023b. Diffusiondet: Diffusion model for object detection. In Proceedings of the IEEE/CVF international conference on computer vision, 19830–19843.
- Cornia et al. (2018) Cornia, M.; Baraldi, L.; Serra, G.; and Cucchiara, R. 2018. Predicting Human Eye Fixations via an LSTM-Based Saliency Attentive Model. IEEE Transactions on Image Processing, 27(10): 5142–5154.
- Droste, Jiao, and Noble (2020) Droste, R.; Jiao, J.; and Noble, J. A. 2020. Unified image and video saliency modeling. In Computer Vision–ECCV 2020: 16th European Conference, Glasgow, UK, August 23–28, 2020, Proceedings, Part V 16, 419–435. Springer.
- Henderson (2003) Henderson, J. M. 2003. Human gaze control during real-world scene perception. Trends in cognitive sciences, 7(11): 498–504.
- Henderson, Weeks Jr, and Hollingworth (1999) Henderson, J. M.; Weeks Jr, P. A.; and Hollingworth, A. 1999. The effects of semantic consistency on eye movements during complex scene viewing. Journal of experimental psychology: Human perception and performance, 25(1): 210.
- Ho, Jain, and Abbeel (2020) Ho, J.; Jain, A.; and Abbeel, P. 2020. Denoising diffusion probabilistic models. Advances in neural information processing systems, 33: 6840–6851.
- Hua et al. (2024a) Hua, H.; Shi, J.; Kafle, K.; Jenni, S.; Zhang, D.; Collomosse, J.; Cohen, S.; and Luo, J. 2024a. FINEMATCH: Aspect-based Fine-grained Image and Text Mismatch Detection and Correction. arXiv preprint arXiv:2404.14715.
- Hua et al. (2024b) Hua, H.; Tang, Y.; Xu, C.; and Luo, J. 2024b. V2Xum-LLM: Cross-modal Video Summarization with Temporal Prompt Instruction Tuning. arXiv preprint arXiv:2404.12353.
- Huang et al. (2015) Huang, X.; Shen, C.; Boix, X.; and Zhao, Q. 2015. SALICON: Reducing the Semantic Gap in Saliency Prediction by Adapting Deep Neural Networks. In 2015 IEEE International Conference on Computer Vision (ICCV), 262–270.
- Islam, Kalash, and Bruce (2018) Islam, M. A.; Kalash, M.; and Bruce, N. D. 2018. Revisiting salient object detection: Simultaneous detection, ranking, and subitizing of multiple salient objects. In Proceedings of the IEEE conference on computer vision and pattern recognition, 7142–7150.
- Itti, Koch, and Niebur (1998) Itti, L.; Koch, C.; and Niebur, E. 1998. A model of saliency-based visual attention for rapid scene analysis. IEEE Transactions on Pattern Analysis and Machine Intelligence, 20(11): 1254–1259.
- Jain et al. (2021) Jain, S.; Yarlagadda, P.; Jyoti, S.; Karthik, S.; Subramanian, R.; and Gandhi, V. 2021. Vinet: Pushing the limits of visual modality for audio-visual saliency prediction. In 2021 IEEE/RSJ International Conference on Intelligent Robots and Systems (IROS), 3520–3527. IEEE.
- Jiang et al. (2020) Jiang, L.; Xu, M.; Wang, Z.; and Sigal, L. 2020. DeepVS2.0: A Saliency-Structured Deep Learning Method for Predicting Dynamic Visual Attention. International Journal of Computer Vision, 129: 203 – 224.
- Kalash, Islam, and Bruce (2019) Kalash, M.; Islam, M. A.; and Bruce, N. D. 2019. Relative saliency and ranking: Models, metrics, data and benchmarks. IEEE transactions on pattern analysis and machine intelligence, 43(1): 204–219.
- Kay et al. (2017) Kay, W.; Carreira, J.; Simonyan, K.; Zhang, B.; Hillier, C.; Vijayanarasimhan, S.; Viola, F.; Green, T.; Back, T.; Natsev, P.; et al. 2017. The kinetics human action video dataset. arXiv preprint arXiv:1705.06950.
- Kondapaneni et al. (2024) Kondapaneni, N.; Marks, M.; Knott, M.; Guimaraes, R.; and Perona, P. 2024. Text-image alignment for diffusion-based perception. In Proceedings of the IEEE/CVF Conference on Computer Vision and Pattern Recognition, 13883–13893.
- Lai et al. (2020) Lai, Q.; Wang, W.; Sun, H.; and Shen, J. 2020. Video Saliency Prediction Using Spatiotemporal Residual Attentive Networks. IEEE Transactions on Image Processing, 29: 1113–1126.
- Leborán et al. (2017) Leborán, V.; García-Díaz, A.; Fdez-Vidal, X. R.; and Pardo, X. M. 2017. Dynamic Whitening Saliency. IEEE Transactions on Pattern Analysis and Machine Intelligence, 39(5): 893–907.
- Li et al. (2023) Li, J.; Li, D.; Savarese, S.; and Hoi, S. 2023. Blip-2: Bootstrapping language-image pre-training with frozen image encoders and large language models. In International conference on machine learning, 19730–19742. PMLR.
- Li et al. (2022) Li, Y.; Wu, C.-Y.; Fan, H.; Mangalam, K.; Xiong, B.; Malik, J.; and Feichtenhofer, C. 2022. Mvitv2: Improved multiscale vision transformers for classification and detection. In Proceedings of the IEEE/CVF conference on computer vision and pattern recognition, 4804–4814.
- Lin et al. (2024) Lin, J.; Yin, H.; Ping, W.; Molchanov, P.; Shoeybi, M.; and Han, S. 2024. Vila: On pre-training for visual language models. In Proceedings of the IEEE/CVF Conference on Computer Vision and Pattern Recognition, 26689–26699.
- Linardos et al. (2019) Linardos, P.; Mohedano, E.; Nieto, J. J.; O’Connor, N. E.; Giro-i Nieto, X.; and McGuinness, K. 2019. Simple vs complex temporal recurrences for video saliency prediction. arXiv preprint arXiv:1907.01869.
- Liu et al. (2024) Liu, H.; Li, C.; Wu, Q.; and Lee, Y. J. 2024. Visual instruction tuning. Advances in neural information processing systems, 36.
- Liu et al. (2023) Liu, S.; Zeng, Z.; Ren, T.; Li, F.; Zhang, H.; Yang, J.; Li, C.; Yang, J.; Su, H.; Zhu, J.; et al. 2023. Grounding dino: Marrying dino with grounded pre-training for open-set object detection. arXiv preprint arXiv:2303.05499.
- Liu et al. (2020) Liu, Y.; Qiao, M.; Xu, M.; Li, B.; Hu, W.; and Borji, A. 2020. Learning to predict salient faces: A novel visual-audio saliency model. In Computer Vision–ECCV 2020: 16th European Conference, Glasgow, UK, August 23–28, 2020, Proceedings, Part XX 16, 413–429. Springer.
- Loftus and Mackworth (1978) Loftus, G. R.; and Mackworth, N. H. 1978. Cognitive determinants of fixation location during picture viewing. Journal of Experimental Psychology: Human perception and performance, 4(4): 565.
- Ma et al. (2022) Ma, C.; Sun, H.; Rao, Y.; Zhou, J.; and Lu, J. 2022. Video Saliency Forecasting Transformer. IEEE Transactions on Circuits and Systems for Video Technology, 32(10): 6850–6862.
- Mathe and Sminchisescu (2015) Mathe, S.; and Sminchisescu, C. 2015. Actions in the Eye: Dynamic Gaze Datasets and Learnt Saliency Models for Visual Recognition. IEEE Transactions on Pattern Analysis and Machine Intelligence, 37(7): 1408–1424.
- Min and Corso (2019) Min, K.; and Corso, J. J. 2019. Tased-net: Temporally-aggregating spatial encoder-decoder network for video saliency detection. In Proceedings of the IEEE/CVF International Conference on Computer Vision, 2394–2403.
- Pan et al. (2017) Pan, J.; Ferrer, C. C.; McGuinness, K.; O’Connor, N. E.; Torres, J.; Sayrol, E.; and Giro-i Nieto, X. 2017. Salgan: Visual saliency prediction with generative adversarial networks. arXiv preprint arXiv:1701.01081.
- Peebles and Xie (2023) Peebles, W.; and Xie, S. 2023. Scalable diffusion models with transformers. In Proceedings of the IEEE/CVF International Conference on Computer Vision, 4195–4205.
- Peng et al. (2023) Peng, Z.; Wang, W.; Dong, L.; Hao, Y.; Huang, S.; Ma, S.; and Wei, F. 2023. Kosmos-2: Grounding multimodal large language models to the world. arXiv preprint arXiv:2306.14824.
- Radford et al. (2021) Radford, A.; Kim, J. W.; Hallacy, C.; Ramesh, A.; Goh, G.; Agarwal, S.; Sastry, G.; Askell, A.; Mishkin, P.; Clark, J.; et al. 2021. Learning transferable visual models from natural language supervision. In International conference on machine learning, 8748–8763. PMLR.
- Ramesh et al. (2022) Ramesh, A.; Dhariwal, P.; Nichol, A.; Chu, C.; and Chen, M. 2022. Hierarchical text-conditional image generation with clip latents. arXiv preprint arXiv:2204.06125, 1(2): 3.
- Schölkopf, Platt, and Hofmann (2007) Schölkopf, B.; Platt, J.; and Hofmann, T. 2007. Graph-Based Visual Saliency, 545–552.
- Song, Meng, and Ermon (2020) Song, J.; Meng, C.; and Ermon, S. 2020. Denoising diffusion implicit models. arXiv preprint arXiv:2010.02502.
- Song et al. (2023a) Song, M.; Li, L.; Wu, D.; Song, W.; and Chen, C. 2023a. Rethinking object saliency ranking: A novel whole-flow processing paradigm. IEEE Transactions on Image Processing.
- Song et al. (2023b) Song, Y.; Zhang, Z.; Lin, Z.; Cohen, S.; Price, B.; Zhang, J.; Kim, S. Y.; and Aliaga, D. 2023b. ObjectStitch: Object Compositing With Diffusion Model. In Proceedings of the IEEE/CVF Conference on Computer Vision and Pattern Recognition (CVPR), 18310–18319.
- Tang et al. (2023) Tang, Y.; Bi, J.; Xu, S.; Song, L.; Liang, S.; Wang, T.; Zhang, D.; An, J.; Lin, J.; Zhu, R.; et al. 2023. Video understanding with large language models: A survey. arXiv preprint arXiv:2312.17432.
- Tang et al. (2024) Tang, Y.; Shimada, D.; Bi, J.; and Xu, C. 2024. AVicuna: Audio-Visual LLM with Interleaver and Context-Boundary Alignment for Temporal Referential Dialogue. arXiv preprint arXiv:2403.16276.
- Touvron et al. (2023) Touvron, H.; Martin, L.; Stone, K.; Albert, P.; Almahairi, A.; Babaei, Y.; Bashlykov, N.; Batra, S.; Bhargava, P.; Bhosale, S.; et al. 2023. Llama 2: Open foundation and fine-tuned chat models. arXiv preprint arXiv:2307.09288.
- Tsiami, Koutras, and Maragos (2020) Tsiami, A.; Koutras, P.; and Maragos, P. 2020. Stavis: Spatio-temporal audiovisual saliency network. In Proceedings of the IEEE/CVF Conference on Computer Vision and Pattern Recognition, 4766–4776.
- Wang et al. (2023) Wang, T.; Zhang, J.; Fei, J.; Zheng, H.; Tang, Y.; Li, Z.; Gao, M.; and Zhao, S. 2023. Caption anything: Interactive image description with diverse multimodal controls. arXiv preprint arXiv:2305.02677.
- Wang et al. (2018) Wang, W.; Shen, J.; Guo, F.; Cheng, M.-M.; and Borji, A. 2018. Revisiting video saliency: A large-scale benchmark and a new model. In Proceedings of the IEEE Conference on computer vision and pattern recognition, 4894–4903.
- Wang et al. (2021a) Wang, W.; Shen, J.; Xie, J.; Cheng, M.-M.; Ling, H.; and Borji, A. 2021a. Revisiting Video Saliency Prediction in the Deep Learning Era. IEEE Transactions on Pattern Analysis and Machine Intelligence, 43(1): 220–237.
- Wang et al. (2021b) Wang, Z.; Liu, Z.; Li, G.; Wang, Y.; Zhang, T.; Xu, L.; and Wang, J. 2021b. Spatio-temporal self-attention network for video saliency prediction. IEEE Transactions on Multimedia, 25: 1161–1174.
- Wei et al. (2022) Wei, J.; Wang, X.; Schuurmans, D.; Bosma, M.; Xia, F.; Chi, E.; Le, Q. V.; Zhou, D.; et al. 2022. Chain-of-thought prompting elicits reasoning in large language models. Advances in neural information processing systems, 35: 24824–24837.
- Wen et al. (2024) Wen, S.; Yang, L.; Xu, M.; Qiao, M.; Xu, T.; and Bai, L. 2024. Saliency Prediction on Mobile Videos: A Fixation Mapping-Based Dataset and A Transformer Approach. IEEE Transactions on Circuits and Systems for Video Technology, 34(7): 5935–5950.
- Xiong et al. (2024) Xiong, J.; Zhang, P.; You, T.; Li, C.; Huang, W.; and Zha, Y. 2024. DiffSal: Joint Audio and Video Learning for Diffusion Saliency Prediction. In Proceedings of the IEEE/CVF Conference on Computer Vision and Pattern Recognition, 27273–27283.
- Xuan et al. (2024) Xuan, S.; Guo, Q.; Yang, M.; and Zhang, S. 2024. Pink: Unveiling the power of referential comprehension for multi-modal llms. In Proceedings of the IEEE/CVF Conference on Computer Vision and Pattern Recognition, 13838–13848.
- Yang et al. (2023) Yang, Z.; Ren, S.; Wu, Z.; Zhao, N.; Wang, J.; Qin, J.; and He, S. 2023. NPF-200: A Multi-Modal Eye Fixation Dataset and Method for Non-Photorealistic Videos. In Proceedings of the 31st ACM International Conference on Multimedia, 2294–2304.
- Yarbus (2013) Yarbus, A. L. 2013. Eye movements and vision. Springer.
- Zhang, Li, and Bing (2023) Zhang, H.; Li, X.; and Bing, L. 2023. Video-llama: An instruction-tuned audio-visual language model for video understanding. arXiv preprint arXiv:2306.02858.
- Zhang et al. (2019) Zhang, L.; Zhang, J.; Lin, Z.; Lu, H.; and He, Y. 2019. CapSal: Leveraging Captioning to Boost Semantics for Salient Object Detection. In 2019 IEEE/CVF Conference on Computer Vision and Pattern Recognition (CVPR), 6017–6026.
- Zhang et al. (2024) Zhang, Y.; Huang, X.; Ma, J.; Li, Z.; Luo, Z.; Xie, Y.; Qin, Y.; Luo, T.; Li, Y.; Liu, S.; et al. 2024. Recognize anything: A strong image tagging model. In Proceedings of the IEEE/CVF Conference on Computer Vision and Pattern Recognition, 1724–1732.
Appendix A Appendix
Detailed Metrics
We evaluate the performance of saliency prediction models using several standard metrics (Islam, Kalash, and Bruce 2018): Correlation Coefficient (CC), Normalized Scanpath Saliency (NSS), Similarity Metric (SIM), and Area Under the Curve-Judd (AUC-J).
Correlation Coefficient (CC)
measures the linear relationship between the predicted () and ground truth () saliency maps:
| (12) |
where and are the mean values of the predicted and ground truth saliency maps, respectively. CC indicates how well the model captures the general spatial distribution of saliency.
Normalized Scanpath Saliency (NSS)
evaluates using human fixation data ():
| (13) |
where is the number of fixation points, is the mean, and is the standard deviation of the predicted saliency map. Considering prediction variability, NSS measures the alignment between the predicted saliency map and human fixations.
Similarity Metric (SIM)
measures the similarity between and :
| (14) |
Values range from 0 to 1, with 1 indicating perfect similarity. SIM compares the saliency distribution at each pixel, providing a measure of local similarity between predicted and ground truth saliency maps.
Area Under the Curve-Judd (AUC-J)
assesses the model’s ability to predict human fixation points:
| (15) |
where is the true positive rate, and is the false positive rate. AUC-J evaluates the model’s effectiveness in distinguishing between true human fixation points and random points, assessing how well predicted saliency regions correspond to actual human fixations.
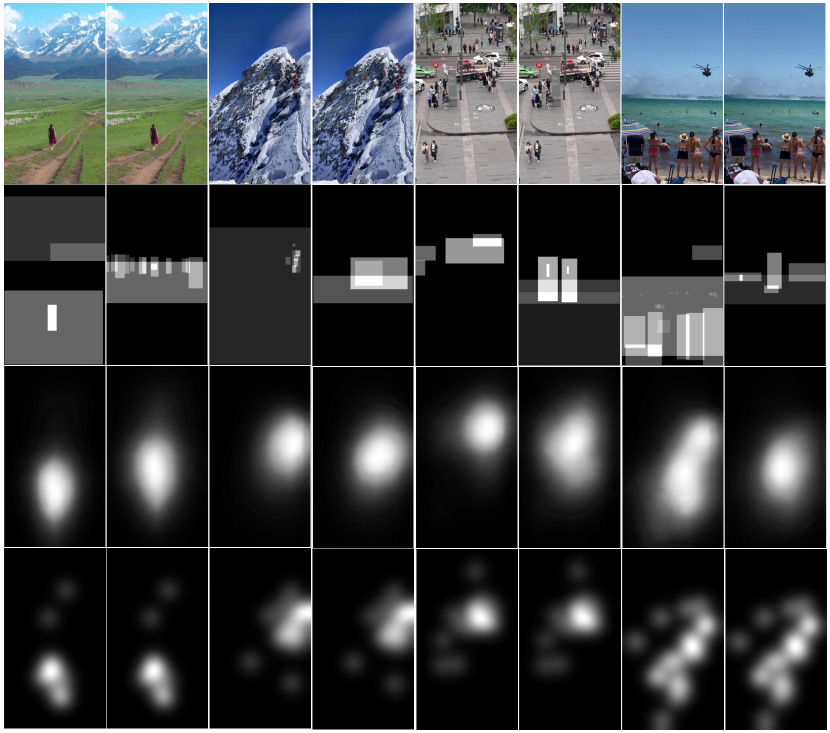
More Visualization Results
We visualize more results predicted by CaRDiff in Figure 8 to the model’s advantage in using language to prioritize and accurately predict attention-worthy regions in videos.
Limitations and Future Work
The performance relies on the accuracy of the grounding module, and the combination of an MLLM and a diffusion model increases computational complexity, making it less feasible for real-time applications or use in resource-constrained environments. Future work could explore more end-to-end approaches, integrating grounding, ranking, and saliency prediction into a single streamlined model to reduce dependency on individual components and lower computational complexity.
