Two successive EUV waves and a transverse oscillation of a quiescent prominence
Abstract
In this paper, we carry out multiwavelength observations of two successive extreme-ultraviolet (EUV) waves originating from active region (AR) NOAA 13575 and a transverse oscillation of a columnar quiescent prominence on 2024 February 9. A hot channel eruption generates an X3.4 class flare and the associated full-halo coronal mass ejection (CME), which drives the first EUV wave front (WF1) at a speed of 835 km s-1. WF1 propagates in the southeast direction and interacts with the prominence, causing an eastward displacement of the prominence immediately. Then, a second EUV wave front (WF2) is driven by a coronal jet at a speed of 831 km s-1. WF2 follows WF1 and decelerates from 788 km s-1 to 603 km s-1 before arriving at and touching the prominence. After reaching the maximum displacement, the prominence turns back and swings for 13 cycles. The transverse oscillation of horizontal polarization is most evident in 304 Å. The initial displacement amplitude, velocity in the plane of the sky, period, and damping time fall in the ranges of 1234 Mm, 65143 km s-1, 1827 minutes, and 33108 minutes, respectively. There are strong correlations among the initial amplitude, velocity, period, and height of the prominence. Surprisingly, the oscillation is also detected in 1600 Å, which is totally in phase with that in 304 Å.
keywords:
Sun: filaments, prominences – Sun: coronal mass ejections (CMEs) – Sun: flares – Sun: oscillations1 Introduction
Filaments are cool and dense plasmas, suspending in the solar corona (Labrosse et al., 2010; Mackay et al., 2010; Parenti, 2014). According to their positions, filaments are divided into three types, including active region filaments, quiescent filaments, and intermediate filaments (Engvold, 1998; Zou et al., 2019). The latitude of filaments has a wide range from the equator to polar regions (Hao et al., 2015; Diercke et al., 2024). Polar crown filaments (or prominences) are regularly observed in H and He ii 304 Å (Régnier et al., 2011; Thompson, 2011; Su & van Ballegooijen, 2012). The magnetic configuration associated with filaments are mostly sheared arcades and magnetic flux ropes (Priest et al., 1989; Aulanier & Demoulin, 1998; DeVore & Antiochos, 2000; Xia et al., 2011; Liu et al., 2012b; Yan et al., 2015). van Ballegooijen & Cranmer (2010) proposed that tangled magnetic field in a current sheet is capable of supporting the highly dynamic prominence threads observed in Ca ii H line (Berger et al., 2008).
Filaments are prone to rise and erupt when getting unstable, giving rise to solar flares (Fletcher et al., 2011) and/or coronal mass ejections (CMEs; Forbes et al., 2006; Chen, 2011). The impulsive energy releases and expulsions are likely to generate large-scale, propagating waves, including coronal extreme-ultraviolet (EUV) waves (Thompson et al., 1998; Delannée, 2000; Chen & Wu, 2011; Shen & Liu, 2012; Liu & Ofman, 2014; Zhang et al., 2022; Zheng et al., 2022; Zhou et al., 2024) and Moreton waves (Moreton, 1960; Uchida, 1968; Chen et al., 2002, 2005; Eto et al., 2002; Zheng et al., 2023) at speeds of hundreds of to 1000 km s-1. Occasionally, EUV waves associated with type II radio bursts could also be driven by fast coronal jets (Su et al., 2015; Maguire et al., 2021; Hou et al., 2023).
Large-amplitude prominence oscillations, including longitudinal and transverse oscillations, are frequently excited and observed by space-borne and ground-based telescopes (Tripathi et al., 2009; Zhang et al., 2012; Arregui et al., 2018; Luna et al., 2018). Longitudinal oscillations are usually excited by flares (Jing et al., 2003), coronal jets (Zhang et al., 2017), and EUV waves (Shen et al., 2014b). Like kink oscillations of coronal loops (Aschwanden et al., 1999; Nakariakov et al., 1999; Nakariakov et al., 2021; Guo et al., 2024), transverse oscillations of filaments are frequently excited by external disturbances, such as H surges (Chen et al., 2008), coronal jets (Zhang et al., 2017), EUV waves (Hershaw et al., 2011; Liu et al., 2012a; Shen et al., 2014b, 2017; Zhang & Ji, 2018; Devi et al., 2022; Dai et al., 2023; Li et al., 2024; Zhang et al., 2024), and Moreton waves (Eto et al., 2002; Okamoto et al., 2004; Gilbert et al., 2008; Asai et al., 2012; Liu et al., 2013). Hershaw et al. (2011) investigated two successive trains of large-amplitude transverse oscillations of a prominence with a height of 82 Mm. The oscillations were induced by two large-scale EUV waves associated with two homologous flares with an interval of 10 hours on 2005 July 30. The first wave train had a larger initial amplitude and a shorter damping time than the second one. Takahashi et al. (2015) studied the activation and oscillation of a prominence located at the north pole, which was excited by a coronal fast-mode shock wave at a speed of 670 km s-1 on 2012 March 7. Interestingly, the prominence was strongly compressed and brightened after the arrival of shock wave.
Vertically oscillating filaments are also named winking filaments in spectral observations (e.g., Hyder, 1966; Kleczek & Kuperus, 1969; Eto et al., 2002; Shen et al., 2014a; Dai et al., 2023). The filaments appear in the blue wing and red wing of H line in a staggered way for several cycles before fading out. Transverse filament oscillations may take place before eruptions (Isobe & Tripathi, 2006; Chen et al., 2008; Dai et al., 2021; Zhou et al., 2016) or during eruptions (Bocchialini et al., 2011; Kumar et al., 2022). Hence, transverse oscillations are considered as another precursor of filament eruptions (Chen et al., 2008). The amplitudes of oscillations are from a few to tens of Mm, and the periods are from a few to tens of minutes. The amplitudes usually damp with time as a result of resonant absorption (Hershaw et al., 2011) or wave leakage (Kleczek & Kuperus, 1969). The observed periods are employed to estimate the strength of magnetic fields supporting the filaments (Hyder, 1966; Ballester, 2006; Shen et al., 2017; Dai et al., 2023; Zhang et al., 2024).
In this paper, we report multiwavelength observations of two successive EUV waves and a transverse oscillation of a quiescent prominence using the observations of the Atmospheric Imaging Assembly (AIA; Lemen et al., 2012) on board the Solar Dynamics Observatory (SDO; Pesnell et al., 2012) on 2024 February 9. The paper is organized as follows. In Section 2, we describe the observations of two EUV waves. The results of prominence oscillation are presented in Section 3. Discussions and a brief summary are arranged in Section 4 and Section 5, respectively.
2 Successive EUV waves
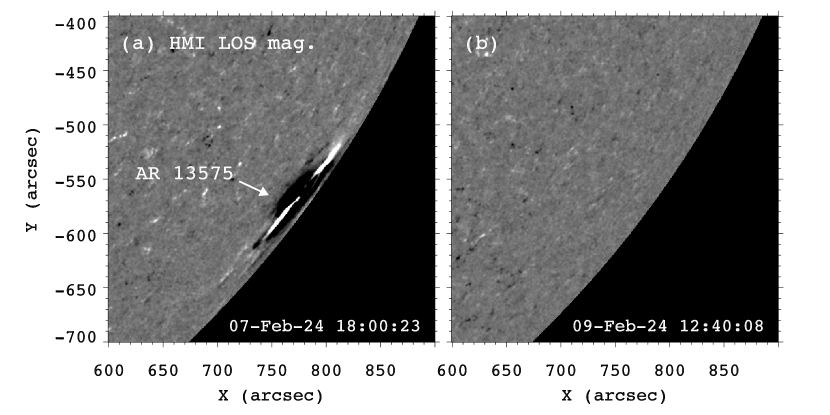
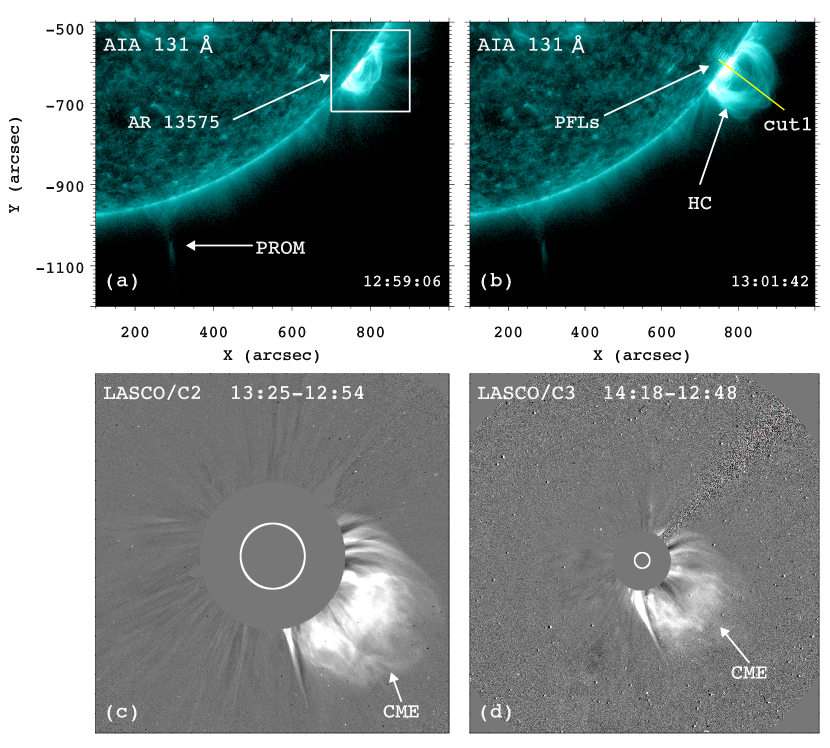
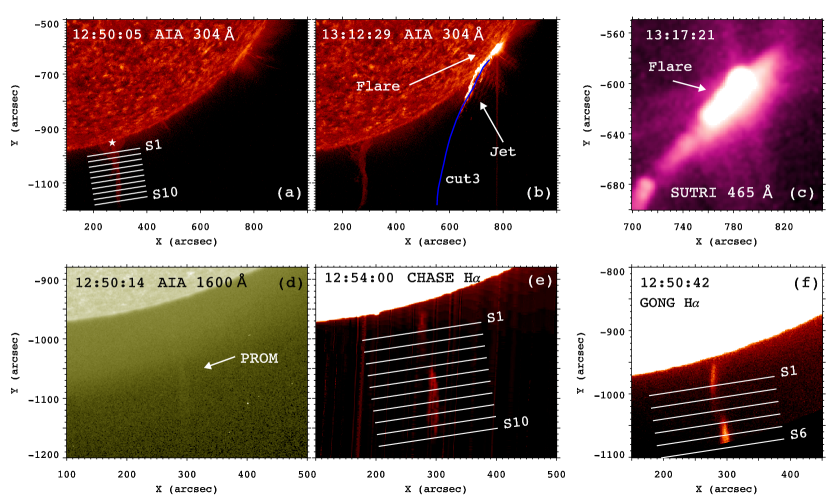
On 2024 February 9, an X3.4 class flare occurred in AR 13575 behind the western limb. In Figure 1, the left and right panels show the line-of-sight (LOS) magnetograms observed by the Helioseismic and Magnetic Imager (HMI; Scherrer et al., 2012) on board SDO on February 7 and 9, respectively. It is obvious that AR 13575 (S36W89) was close to the western limb on February 7 and totally rotated to the far side two days later. In Figure 2(a), the red and blue lines show SXR light curves of the flare in 18 Å and 0.54 Å, respectively. The SXR flux increases from 12:53 UT, peaks at 13:14 UT, and descends gradually in the decay phase. In Figure 3, the top panels show hot post-flare loops (PFLs) of the flare generated by a hot channel (HC; Cheng et al., 2011; Li & Zhang, 2013; Zhang et al., 2022, 2023) eruption originating from AR 13575 (see also the online movie anim1.mp4). HCs ( MK) are exclusively visible in AIA 94 and 131 Å. It should be emphasized that the footpoints of PFLs are blocked by the western limb. Close to the south polar region, there is a quiescent prominence, which is 384 Mm away from the PFLs. In Figure 4, the columnar prominence is distinctly observed in 304 Å (panels (a-b)), 1600 Å (panel (d)), and H line center (panels (e-f)) as well (see also the online movie anim2.mp4). The H images were taken by the H Imaging Spectrograph (HIS; Qiu et al., 2022) on board the Chinese H Solar Explorer (CHASE; Li et al., 2022) and GONG, respectively. The bottom panels of Figure 3 show the consequent full-halo CME at an extremely fast speed of 2782 km s-1 when the HC expands and enters into the field of views (FOVs) of C2 and C3 white-light (WL) coronagraphs of the Large Angle Spectroscopic Coronagraph (LASCO; Brueckner et al., 1995) on board the SOHO spacecraft111cdaw.gsfc.nasa.gov/CME_list/UNIVERSAL_ver2/2024_02/univ2024_02.html.
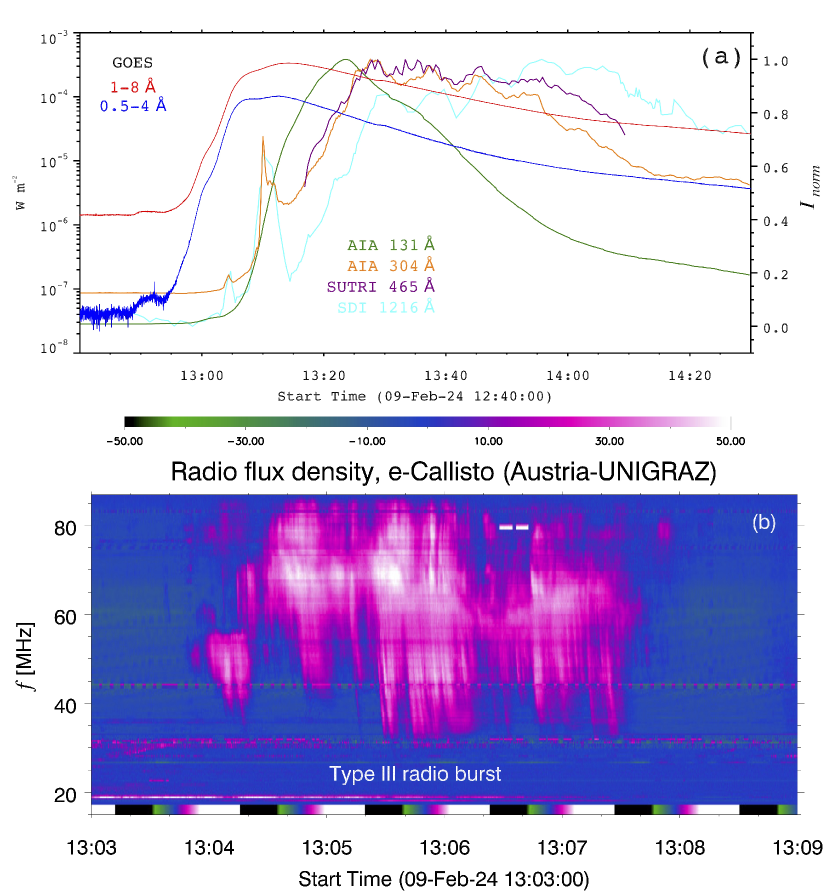
In Figure 3(a), a white box with a FOV of 200200 is used to calculate integrated intensities of the flare region in various wavelengths. The normalized light curves in AIA 131 and 304 Å are plotted with green and orange lines in Figure 2(a). The 131 Å emission increases from 13:00 UT and peaks at 13:24 UT, which is 10 minutes later than the SXR peak. The 304 Å emission reaches the first and second peaks at 13:05 UT and 13:10 UT, respectively. The third peak at 13:25 UT is followed by a gradual and oscillatory decay. Fortunately, the flare was detected in H i 1216 Å with the Solar Disk Imager (SDI) of the Lyman-alpha (Ly) Solar Telescope (LST; Li et al., 2019) on board the Advanced Space-based Solar Observatory (ASO-S; Gan et al., 2023) mission. The corresponding light curve of the flare is plotted with a cyan line in Figure 2(a). It is noticed that the first and second peaks in 1216 Å are concurrent with those of 304 Å. Figure 2(b) shows the radio dynamic spectrum obtained from the e-Callisto/Austria-UNIGRAZ station222www.e-callisto.org. A type III radio burst, whose frequency rapidly drifts from 85 to 30 MHz during 13:0413:08 UT, is the most striking feature. The dynamic spectrum from another station (EGYPT-Alexandria) shows that the frequency of the radio burst reaches up to 140 MHz. This radio burst is roughly coincident with the first peak in both 304 and 1216 Å, implying localized plasma heating in the lower solar atmosphere by flare-accelerated nonthermal electrons.
The flare was also observed with the the Solar Upper Transition Region Imager (SUTRI; Bai et al., 2023) on board the Space Advanced Technology demonstration satellite (SATech-01). Figure 4(b-c) show the flare observed by AIA 304 Å at 13:12 UT and by SUTRI Ne vii 465 Å at 13:17 UT. Likewise, the normalized light curve in 465 Å during 13:1614:09 UT is derived and drawn with a purple line in Figure 2(a), which has a very similar variation as in 304 Å (orange line).
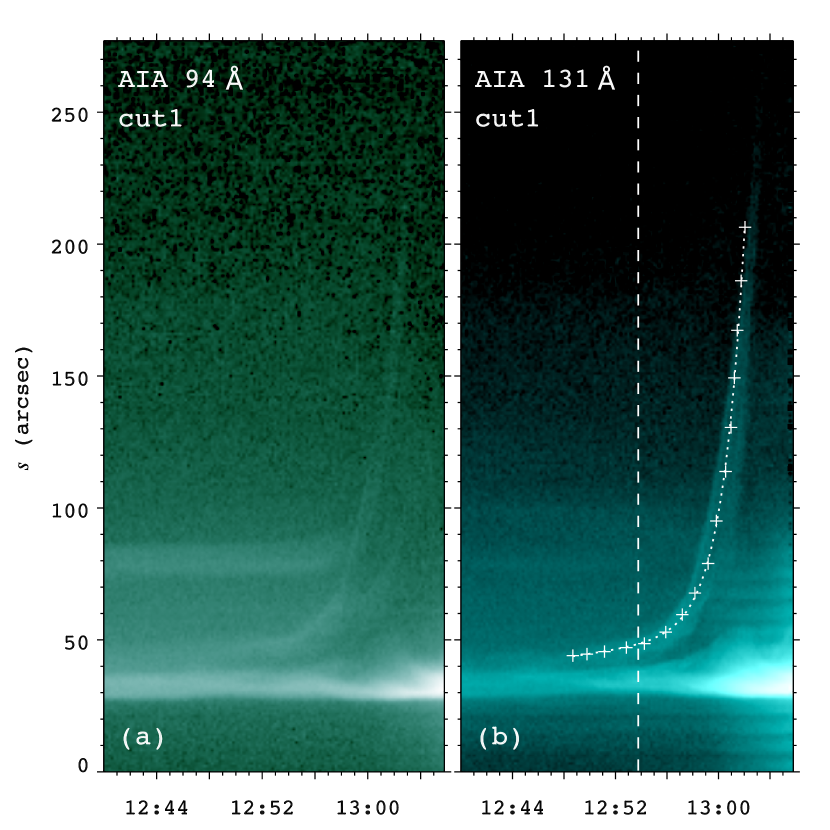
To explore the height variation of the HC, a straight slice (cut1) with a length of 201 Mm is selected along the direction of eruption in Figure 3(b). Time-distance maps of cut1 in 94 and 131 Å are displayed in the left and right panels of Figure 5. In Figure 5(b), the trajectory of HC is marked with white “+” symbols. It is obvious that the HC experiences a slow-rise phase and a fast-rise phase during 12:4913:02 UT, as reported in previous works (Cheng et al., 2020; Zhang et al., 2023). To fit the trajectory, we use the following equation:
| (1) |
where denotes time after 12:48:39 UT, is the height of HC, and , , , and are free parameters. In Figure 5(b), the fitted curve is plotted with a dotted line. The onset time (12:53:53 UT) of fast rise is marked with a vertical dashed line, which is exactly consistent with the start time of flare impulsive phase. The final speed of HC reaches 808 km s-1 at 13:02 UT.
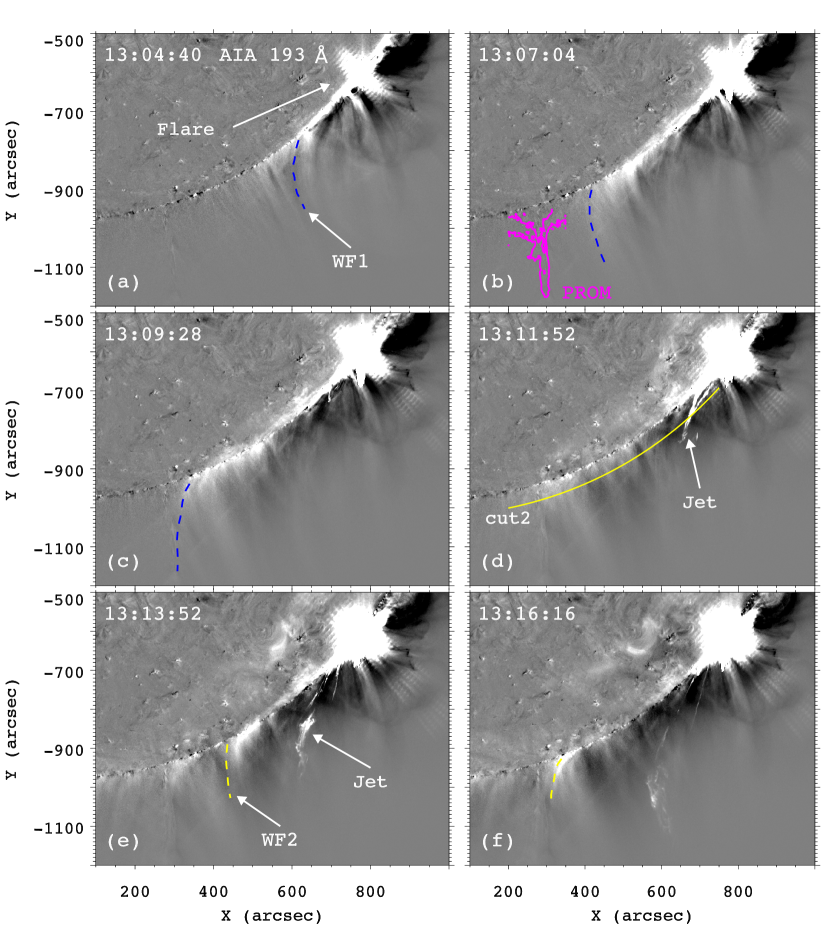
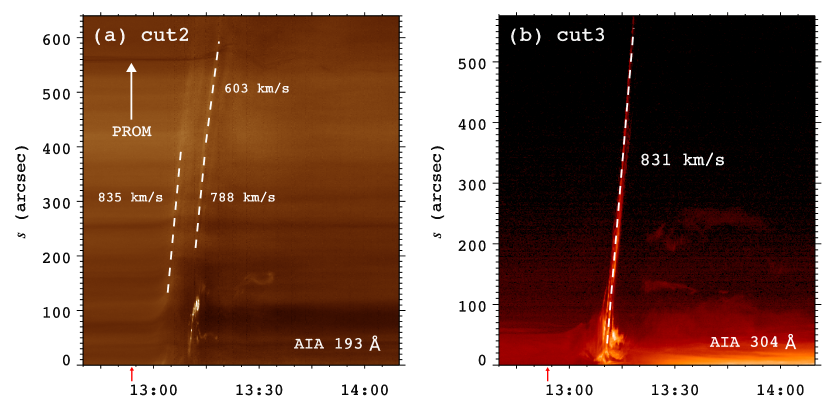
The HC eruption and related full-halo CME generate a fast EUV wave propagating in the southeast direction. Figure 6 shows base-difference images in AIA 193 Å during 13:0413:16 UT (see also the online movie anim3.mp4). As the flare occurs, the first EUV wave front WF1 (blue dashed lines) propagates and sweeps the prominence, which is denoted by the intensity contours in 304 Å at 12:40:05 UT (magenta lines) in panel (b). To calculate the speeds of wave fronts, a curved slice (cut2 with a yellow line) with a length of 464 Mm and a height of 0.05 above the solar surface is selected in panel (d). Time-distance map of cut2 in 193 Å is displayed in the left panel of Figure 7. It is clear that WF1 starts at 13:04 UT and propagates at a speed of 835 km s-1. The WF1 arrives at the prominence at 13:09 UT and pushes it to move eastward. Meanwhile, a coronal jet spurts out from the flare region and propagates in the southeast direction, which is displayed in Figure 4(b) and Figure 6(d). The jet axis has an inclination angle of 80∘ with the local vertical. In Figure 4(b), a curved slice (cut3) with a length of 418 Mm is selected along the jet axis. Time-distance map of cut3 in 304 Å is displayed in Figure 7(b). It is obvious that the jet moves very fast at a speed of 831 km s-1, which is 1.5 times higher than that of blowout jet on 2022 November 12 (Hou et al., 2023). Interestingly, the jet drives a second EUV wave front WF2 in 193 Å, which is shown with yellow dashed lines in Figure 6(e-f). The WF2 decelerates from 788 km s-1 to 603 km s-1 before arriving at the prominence at 13:17 UT when the prominence is still moving eastwards. The initial speed of WF2 is slightly higher than that of EUV wave (shock wave) driven by the blowout jet (Hou et al., 2023).
| Time (UT) | activity |
|---|---|
| 12:49 | Start time of the slow rise of HC |
| 12:53 | Start time of the flare in 18 Å |
| 12:53 | Onset time of the fast rise of HC |
| 13:04 | Start time of WF1 |
| 13:05 | First peak of the flare in 304 and 1216 Å |
| 13:05 | Type III radio burst |
| 13:09 | WF1 arrives at the prominence |
| 13:09 | Beginning of prominence oscillation |
| 13:10 | Second peak of the flare in 304 and 1216 Å |
| 13:10 | Start time of the coronal jet |
| 13:12 | Start time of WF2 |
| 13:14 | Peak time of the flare in 18 Å |
| 13:17 | WF2 arrives at the prominence |
| 13:20 | First peak of prominence oscillation |
| 13:25 | CME shows up in LASCO/C2 |
| 14:10 | End time of prominence oscillation |
3 Prominence oscillation
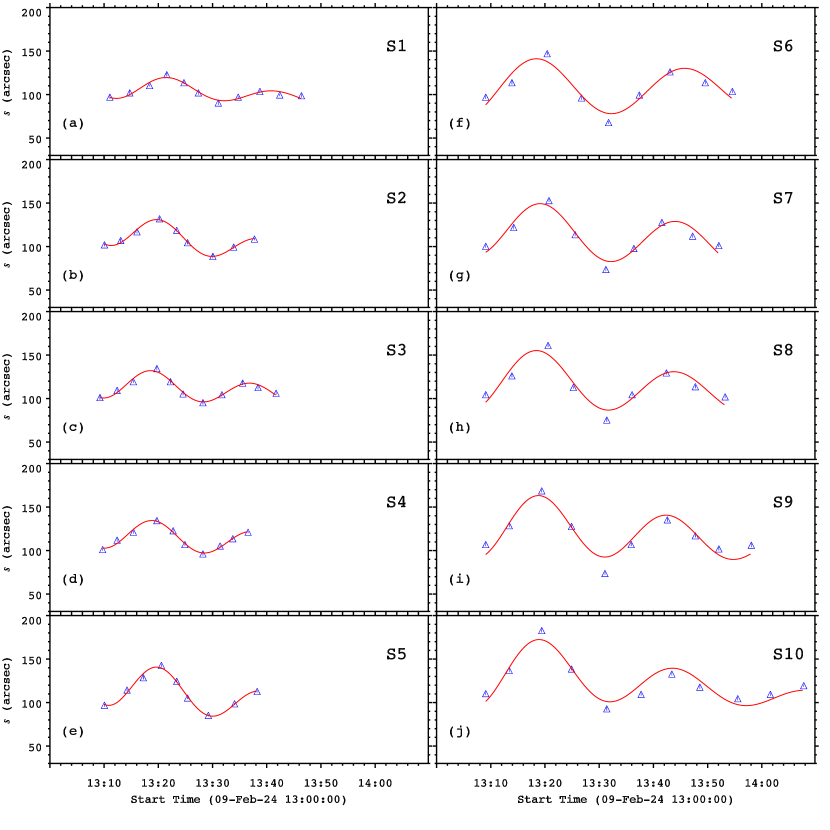
As is shown in Figure 3 and Figure 4, the quiescent prominence with a total length of 157 Mm is located 384 Mm away from the PFLs. The coherent prominence in EUV (131 and 304 Å) wavelengths is seemingly divided into two parts in H, which is probably interpreted by a helical magnetic structure of the prominence (Cheng et al., 2014). As is shown in the online animation anim3.mp4, the prominence undergoes a transverse oscillation after the impact of WF1. In Figure 4(a), ten slices (S1S10 with the same length of 200) perpendicular to the prominence are selected to investigate the evolution of prominence. The heights () of ten slices increase from 36 to 216 (see Table 2). Time-distance maps of these slices in 304 Å are displayed in Figure 8. It is clear that the prominence moves eastward after the impact of WF1 at 13:09 UT (cyan vertical line) and the whole body continues to move smoothly after the arrival of WF2 at 13:17 (magenta vertical line). It is noted that the impact of WF2 on the prominence is much weaker than that of WF1, since only the western side of the prominence is slightly affected when WF2 touches the prominence (Fig. 8(a-d)). The displacement of the prominence reaches maximum at 13:20 UT, when it starts to turn back and oscillates horizontally. The oscillation lasts for 13 cycles until 14:20 UT with the amplitude attenuating as time goes on. To precisely obtain the oscillation parameters, the central positions of prominence are marked manually with blue “+” symbols in Figure 8 and independently drawn with blue triangles in Figure 9. For each slice, the width of the prominence before oscillation is measured, and a quarter of the width is taken to be the error bar of the central position. The following function is employed to make curve fittings:
| (2) |
where , , and represent the initial displacement amplitude, phase, and position along the slices at . and represent the period and damping time of the transverse oscillation. denotes the linear drift speed of the prominence. The curve fittings are carried out using the standard routine mpfit.pro in the SolarSoft333www.lmsal.com/solarsoft/ packages. The results of fittings are plotted with red lines in Figure 9. To calculate error bars of the oscillation parameters, we perform 10 Monte Carlo simulations based on error bars of the central positions of the prominence for each slice. The curve fittings are repeated for 10 times accordingly, and the standard deviations of the parameters are taken to be their error bars. In Table 2, the derived parameters and error bars are listed.
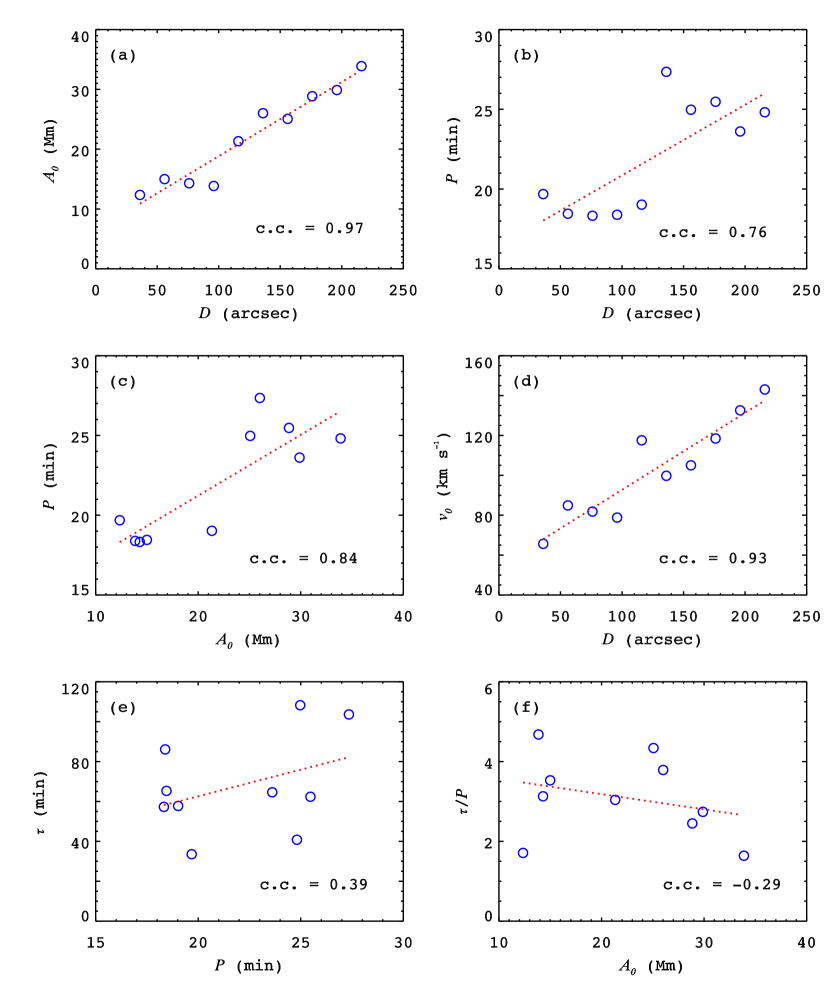
Scatter plots of the parameters are displayed in Figure 10. The initial amplitude lies in the range of 1234 Mm with an average value of 22 Mm and roughly increases with the height of the prominence (Figure 10(a)). The period lies in the range of 1827 minutes with an average value of 22 minutes and generally increases with the height (Figure 10(b)), which is consistent with the result of transverse oscillations of the prominence on 2005 July 30 (Hershaw et al., 2011). The initial amplitude is linearly correlated with the period with a correlation coefficient of 0.84 (Figure 10(c)). The damping time is between 33 and 108 minutes with an average value of 68 minutes (Figure 10(e)). There is a weak correlation between the period and damping time, i.e., . The quality factor () is between 1.6 and 4.3 with an average value of 3.1 (Figure 10(f)). There is no correlation between the quality factor and period (Luna et al., 2018). However, a weak negative correlation between the quality factor and initial amplitude is found, which is similar to the case in kink oscillations of coronal loops (Goddard & Nakariakov, 2016). The initial velocity of oscillation () is between 65 and 143 km s-1 with an average value of 103 km s-1 and is linearly correlated with the height (Figure 10(d)).
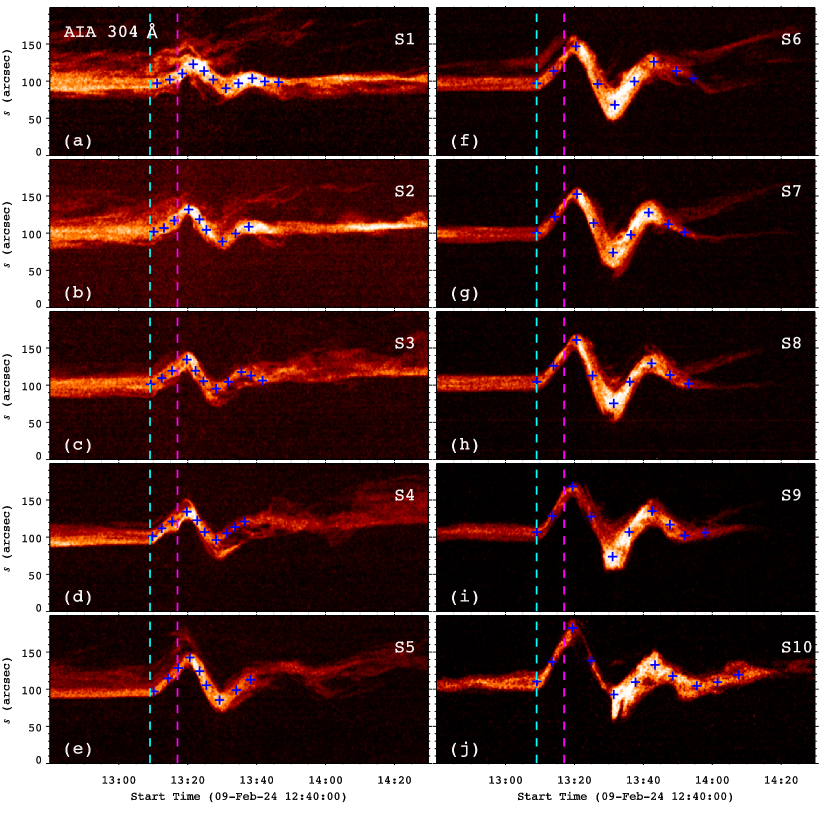
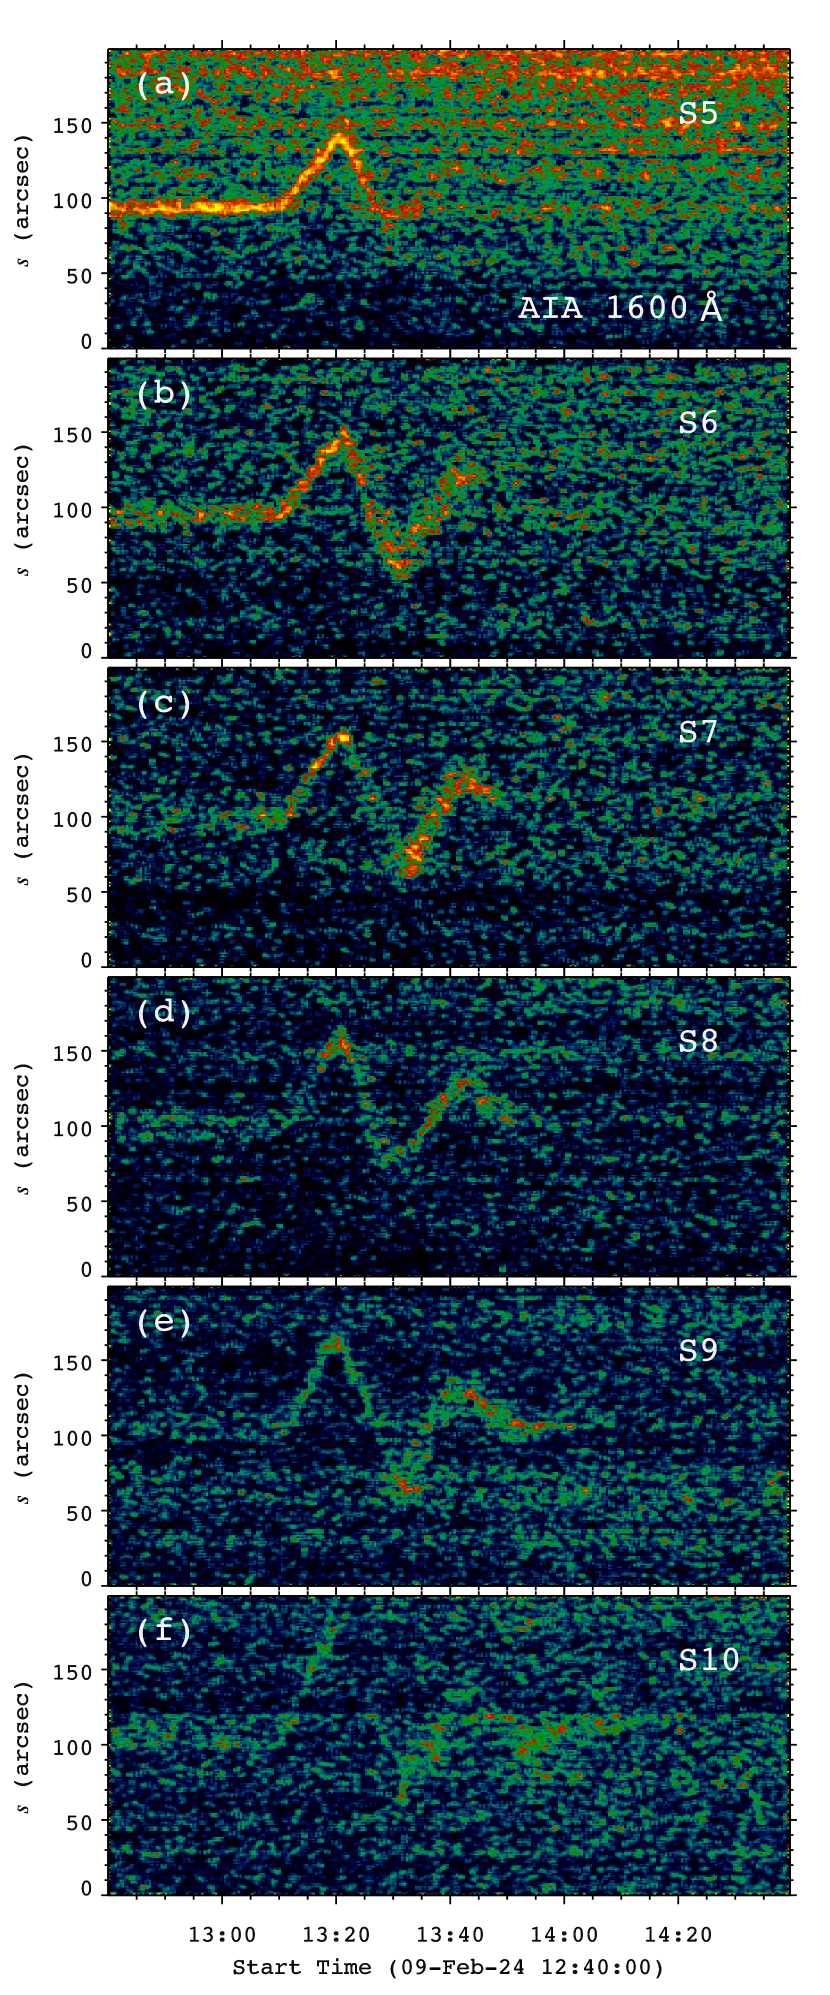
Surprisingly, the horizontal prominence oscillation is also detected in AIA 1600 Å, although the intensity contrast between the prominence and background is lower than that in 304 Å. Time-distance maps of S5S10 in 1600 Å are displayed in Figure 11. It is clear that the oscillation across each slice is completely in phase with that in 304 Å. To our knowledge, this is the first report of prominence oscillation observed in UV 1600 Å. It is noted that the lower part of the prominence is hard to distinguish from the background. Therefore, the oscillation along S1S4 is quite blurred. Time line of the whole events is listed in Table 1.
| Slice | ||||||||||
|---|---|---|---|---|---|---|---|---|---|---|
| [] | [UT] | [Mm] | [rad] | [min] | [min] | - | [Mm] | [km s-1] | [km s-1] | |
| S1 | 36 | 13:11:04 | 12.350.86 | 4.330.19 | 19.680.77 | 33.575.75 | 1.710.34 | 81.630.92 | -6.100.66 | 65.695.68 |
| S2 | 56 | 13:10:04 | 15.000.89 | 4.380.16 | 18.450.55 | 65.3213.31 | 3.540.75 | 88.900.93 | -11.460.88 | 85.107.11 |
| S3 | 76 | 13:09:14 | 14.301.03 | 4.510.11 | 18.330.41 | 57.2813.28 | 3.130.74 | 87.360.65 | -6.470.49 | 81.705.54 |
| S4 | 96 | 13:09:44 | 13.850.83 | 4.640.15 | 18.390.65 | 86.1214.96 | 4.680.87 | 88.440.81 | -6.070.93 | 78.885.46 |
| S5 | 116 | 13:10:04 | 21.331.25 | 4.500.10 | 19.020.41 | 57.776.77 | 3.040.31 | 91.841.33 | -13.061.35 | 117.458.37 |
| S6 | 136 | 13:09:04 | 26.011.33 | 5.650.08 | 27.350.48 | 103.6420.19 | 3.790.76 | 79.420.67 | -1.490.44 | 99.605.03 |
| S7 | 156 | 13:09:04 | 25.070.93 | 5.220.08 | 24.970.33 | 108.2919.77 | 4.340.76 | 89.590.74 | -6.770.67 | 105.123.87 |
| S8 | 176 | 13:09:04 | 28.850.92 | 5.420.04 | 25.470.27 | 62.364.49 | 2.450.17 | 91.310.81 | -6.140.63 | 118.623.64 |
| S9 | 196 | 13:09:04 | 29.880.90 | 5.150.09 | 23.610.40 | 64.606.68 | 2.740.29 | 96.301.24 | -6.010.62 | 132.533.31 |
| S10 | 216 | 13:09:04 | 33.881.26 | 5.190.09 | 24.810.51 | 40.822.70 | 1.640.13 | 103.530.96 | -8.030.51 | 143.003.93 |
| Avg. | 126 | - | 22.051.02 | 4.900.11 | 22.010.48 | 67.9810.79 | 3.100.51 | 89.830.91 | -7.160.72 | 102.775.19 |
4 Discussion
Kolotkov et al. (2016) proposed an analytical model of the global transverse oscillations and stability of quiescent prominences. In their model, a prominence (magnetic flux rope) is a straight current-carrying wire located at a height above the photosphere, while the magnetic dip is created by two photospheric current sources with a separation of 2. The periods of horizontal and vertical oscillations with small amplitudes are derived, which closely depend on the parameters of the system. In a follow-up work, Kolotkov et al. (2018) investigated the effects of finite amplitudes on the transverse prominence oscillations. It is found that finite-amplitude horizontal and vertical oscillations are strongly coupled, especially for larger amplitudes and smaller attack angles between the direction of the driver (e.g., a shock wave) and the horizontal axis. In the nonlinear large-amplitude regime, the horizontal period () always increases with the horizontal amplitude (see top panels of their Fig. 10). For a fixed amplitude, the horizontal period increases with the prominence height as well. In our study, the scatter plots in Figure 10 indicate that the period of transverse oscillation increases with the prominence height (panel (b)) and the displacement amplitude (panel (c)). In this sense, the large-amplitude, horizontal prominence oscillation excited by the EUV waves on 2024 February 9 could be qualitatively explained by the model of Kolotkov et al. (2018). Sophisticated MHD numerical simulations are worthwhile to reproduce and explain the observational results thoroughly (Liakh et al., 2023).
Successive coronal loop oscillations induced by homologous flares have been observed before (Nisticò et al., 2013; Zhang et al., 2020). In our study, the prominence is impacted by two successive EUV wave fronts, WF1 driven by the CME and WF2 driven by the jet, which have a short interval of 8 minutes (Table 1). However, the prominence has not returned back when WF2 arrives. Acturally, the prominence is slightly touched by WF2 and continues to move eastward. Therefore, the two wave fronts push the prominence in the same direction, rather than opposite directions. Consequently, the prominence undergoes a single oscillatory motion.
Successive EUV waves in a single eruption event have been observed. Zheng et al. (2022) investigated twin EUV waves in the solar corona. In the first case, the two waves are separately driven by a filament eruption and a precursor jet, i.e., the jet occurs prior to the filament eruption. Linear speeds of the wave trains are 230 and 390 km s-1. In the second case, the two waves are successively associated with a filament eruption. The two EUV wave fronts in our study are similar to their first case. The difference is that the EUV wave fronts are primarily driven by the CME as a result of a HC eruption and then driven by the coronal jet, which has the opposite order to their case. Besides, the EUV waves in our study are fast-mode waves at speeds of 835 and 788 km s-1, which are significantly faster than the wave trains studied by Zheng et al. (2022).
5 Summary
In this paper, we carry out multiwavelength observations of two successive EUV waves originating from AR 13575 and a transverse oscillation of a columnar quiescent prominence with a total length of 157 Mm on 2024 February 9. The main results are summarized as follows:
-
1.
The first EUV wave front (WF1) is driven by a CME as a result of a HC eruption, which also generates an X3.4 class flare. The speed of WF1 reaches 835 km s-1. After the impact of WF1, the prominence moves eastward immediately. Then, a second EUV wave front (WF2) is driven by a coronal jet at a speed of 831 km s-1. WF2 follows WF1 and decelerates from 788 km s-1 to 603 km s-1 before arriving at and touching the prominence. After reaching the maximum displacement, the prominence turns back and swings for 13 cycles. The horizontally polarized oscillation is most striking in AIA 304 Å and is surprisingly detected in 1600 Å, which are in phase in the two wavelengths.
-
2.
The initial displacement amplitude, velocity in the plane of the sky, period, and damping time fall in the ranges of 1234 Mm, 65143 km s-1, 1827 minutes, and 33108 minutes, respectively. There are strong correlations among the initial amplitude, velocity, period, and height of the prominence.
Acknowledgements
The authors appreciate the reviewer for valuable comments and suggestions to improve the quality of this article. We also appreciate Prof. Liheng Yang in Yunnan Astronomical Observatories for helpful discussions. SDO is a mission of NASA’s Living With a Star Program. AIA and HMI data are courtesy of the NASA/SDO science teams. The CHASE mission is supported by China National Space Administration (CNSA). SUTRI is a collaborative project conducted by the National Astronomical Observatories of CAS, Peking University, Tongji University, Xi’an Institute of Optics and Precision Mechanics of CAS, and the Innovation Academy for Microsatellites of CAS. The ASO-S is supported by the Strategic Priority Research Program on Space Science, Chinese Academy of Sciences. This work is supported by the Strategic Priority Research Program of the Chinese Academy of Sciences, Grant No. XDB0560000, the National Key R&D Program of China 2021YFA1600500 (2021YFA1600502), 2022YFF0503003 (2022YFF0503000), NSFC under the grant numbers 12373065, 12325303, 12273115, 12303057, Natural Science Foundation of Jiangsu Province (BK20231510), and Yunnan Key Laboratory of Solar Physics and Space Science under the grant numbers 202205AG070009, YNSPCC202206. J. Dai is supported by the Special Research Assistant Project of Chinese Academy of Sciences, the Project funded by China Postdoctoral Science Foundation (2023M733734).
Data Availability
The data underlying this article will be shared on reasonable request to the corresponding author.
References
- Arregui et al. (2018) Arregui I., Oliver R., Ballester J. L., 2018, Living Reviews in Solar Physics, 15, 3
- Asai et al. (2012) Asai A., et al., 2012, ApJ, 745, L18
- Aschwanden et al. (1999) Aschwanden M. J., Fletcher L., Schrijver C. J., Alexander D., 1999, ApJ, 520, 880
- Aulanier & Demoulin (1998) Aulanier G., Demoulin P., 1998, A&A, 329, 1125
- Bai et al. (2023) Bai X., et al., 2023, Research in Astronomy and Astrophysics, 23, 065014
- Ballester (2006) Ballester J. L., 2006, Philosophical Transactions of the Royal Society of London Series A, 364, 405
- Berger et al. (2008) Berger T. E., et al., 2008, ApJ, 676, L89
- Bocchialini et al. (2011) Bocchialini K., Baudin F., Koutchmy S., Pouget G., Solomon J., 2011, A&A, 533, A96
- Brueckner et al. (1995) Brueckner G. E., et al., 1995, Sol. Phys., 162, 357
- Chen (2011) Chen P. F., 2011, Living Reviews in Solar Physics, 8, 1
- Chen & Wu (2011) Chen P. F., Wu Y., 2011, ApJ, 732, L20
- Chen et al. (2002) Chen P. F., Wu S. T., Shibata K., Fang C., 2002, ApJ, 572, L99
- Chen et al. (2005) Chen P. F., Fang C., Shibata K., 2005, ApJ, 622, 1202
- Chen et al. (2008) Chen P. F., Innes D. E., Solanki S. K., 2008, A&A, 484, 487
- Cheng et al. (2011) Cheng X., Zhang J., Liu Y., Ding M. D., 2011, ApJ, 732, L25
- Cheng et al. (2014) Cheng X., Ding M. D., Zhang J., Srivastava A. K., Guo Y., Chen P. F., Sun J. Q., 2014, ApJ, 789, L35
- Cheng et al. (2020) Cheng X., Zhang J., Kliem B., Török T., Xing C., Zhou Z. J., Inhester B., Ding M. D., 2020, ApJ, 894, 85
- Dai et al. (2021) Dai J., Zhang Q., Zhang Y., Xu Z., Su Y., Ji H., 2021, ApJ, 923, 74
- Dai et al. (2023) Dai J., Zhang Q., Qiu Y., Li C., Li Z., Li S., Su Y., Ji H., 2023, ApJ, 959, 71
- DeVore & Antiochos (2000) DeVore C. R., Antiochos S. K., 2000, ApJ, 539, 954
- Delannée (2000) Delannée C., 2000, ApJ, 545, 512
- Devi et al. (2022) Devi P., Chandra R., Joshi R., Chen P. F., Schmieder B., Uddin W., Moon Y.-J., 2022, Advances in Space Research, 70, 1592
- Diercke et al. (2024) Diercke A., et al., 2024, A&A, 686, A213
- Engvold (1998) Engvold O., 1998, in Webb D. F., Schmieder B., Rust D. M., eds, Astronomical Society of the Pacific Conference Series Vol. 150, IAU Colloq. 167: New Perspectives on Solar Prominences. p. 23
- Eto et al. (2002) Eto S., et al., 2002, PASJ, 54, 481
- Fletcher et al. (2011) Fletcher L., et al., 2011, Space Sci. Rev., 159, 19
- Forbes et al. (2006) Forbes T. G., et al., 2006, Space Sci. Rev., 123, 251
- Gan et al. (2023) Gan W., et al., 2023, Sol. Phys., 298, 68
- Gilbert et al. (2008) Gilbert H. R., Daou A. G., Young D., Tripathi D., Alexander D., 2008, ApJ, 685, 629
- Goddard & Nakariakov (2016) Goddard C. R., Nakariakov V. M., 2016, A&A, 590, L5
- Guo et al. (2024) Guo M., Van Doorsselaere T., Li B., Goossens M., 2024, A&A, 687, A30
- Hao et al. (2015) Hao Q., Fang C., Cao W., Chen P. F., 2015, ApJS, 221, 33
- Hershaw et al. (2011) Hershaw J., Foullon C., Nakariakov V. M., Verwichte E., 2011, A&A, 531, A53
- Hou et al. (2023) Hou Z., Tian H., Su W., Madjarska M. S., Chen H., Zheng R., Bai X., Deng Y., 2023, ApJ, 953, 171
- Hyder (1966) Hyder C. L., 1966, Z. Astrophys., 63, 78
- Isobe & Tripathi (2006) Isobe H., Tripathi D., 2006, A&A, 449, L17
- Jing et al. (2003) Jing J., Lee J., Spirock T. J., Xu Y., Wang H., Choe G. S., 2003, ApJ, 584, L103
- Kleczek & Kuperus (1969) Kleczek J., Kuperus M., 1969, Sol. Phys., 6, 72
- Kolotkov et al. (2016) Kolotkov D. Y., Nisticò G., Nakariakov V. M., 2016, A&A, 590, A120
- Kolotkov et al. (2018) Kolotkov D. Y., Nisticò G., Rowlands G., Nakariakov V. M., 2018, Journal of Atmospheric and Solar-Terrestrial Physics, 172, 40
- Kumar et al. (2022) Kumar P., Nakariakov V. M., Karpen J. T., DeVore R. C., Cho K.-S., 2022, ApJ, 932, L9
- Labrosse et al. (2010) Labrosse N., Heinzel P., Vial J. C., Kucera T., Parenti S., Gunár S., Schmieder B., Kilper G., 2010, Space Sci. Rev., 151, 243
- Lemen et al. (2012) Lemen J. R., et al., 2012, Sol. Phys., 275, 17
- Li & Zhang (2013) Li L. P., Zhang J., 2013, A&A, 552, L11
- Li et al. (2019) Li H., et al., 2019, Research in Astronomy and Astrophysics, 19, 158
- Li et al. (2022) Li C., et al., 2022, Science China Physics, Mechanics, and Astronomy, 65, 289602
- Li et al. (2024) Li D., Hou Z., Bai X., Li C., Fang M., Zhao H., Wang J., Ning Z., 2024, Science in China E: Technological Sciences, 67, 1592
- Liakh et al. (2023) Liakh V., Luna M., Khomenko E., 2023, A&A, 673, A154
- Liu & Ofman (2014) Liu W., Ofman L., 2014, Sol. Phys., 289, 3233
- Liu et al. (2012a) Liu W., Ofman L., Nitta N. V., Aschwanden M. J., Schrijver C. J., Title A. M., Tarbell T. D., 2012a, ApJ, 753, 52
- Liu et al. (2012b) Liu R., Kliem B., Török T., Liu C., Titov V. S., Lionello R., Linker J. A., Wang H., 2012b, ApJ, 756, 59
- Liu et al. (2013) Liu R., Liu C., Xu Y., Liu W., Kliem B., Wang H., 2013, ApJ, 773, 166
- Luna et al. (2018) Luna M., Karpen J., Ballester J. L., Muglach K., Terradas J., Kucera T., Gilbert H., 2018, ApJS, 236, 35
- Mackay et al. (2010) Mackay D. H., Karpen J. T., Ballester J. L., Schmieder B., Aulanier G., 2010, Space Sci. Rev., 151, 333
- Maguire et al. (2021) Maguire C. A., Carley E. P., Zucca P., Vilmer N., Gallagher P. T., 2021, ApJ, 909, 2
- Moreton (1960) Moreton G. E., 1960, AJ, 65, 494
- Nakariakov et al. (1999) Nakariakov V. M., Ofman L., Deluca E. E., Roberts B., Davila J. M., 1999, Science, 285, 862
- Nakariakov et al. (2021) Nakariakov V. M., et al., 2021, Space Sci. Rev., 217, 73
- Nisticò et al. (2013) Nisticò G., Nakariakov V. M., Verwichte E., 2013, A&A, 552, A57
- Okamoto et al. (2004) Okamoto T. J., Nakai H., Keiyama A., Narukage N., UeNo S., Kitai R., Kurokawa H., Shibata K., 2004, ApJ, 608, 1124
- Parenti (2014) Parenti S., 2014, Living Reviews in Solar Physics, 11, 1
- Pesnell et al. (2012) Pesnell W. D., Thompson B. J., Chamberlin P. C., 2012, Sol. Phys., 275, 3
- Priest et al. (1989) Priest E. R., Hood A. W., Anzer U., 1989, ApJ, 344, 1010
- Qiu et al. (2022) Qiu Y., et al., 2022, Science China Physics, Mechanics, and Astronomy, 65, 289603
- Régnier et al. (2011) Régnier S., Walsh R. W., Alexander C. E., 2011, A&A, 533, L1
- Scherrer et al. (2012) Scherrer P. H., et al., 2012, Sol. Phys., 275, 207
- Shen & Liu (2012) Shen Y., Liu Y., 2012, ApJ, 752, L23
- Shen et al. (2014a) Shen Y., Ichimoto K., Ishii T. T., Tian Z., Zhao R., Shibata K., 2014a, ApJ, 786, 151
- Shen et al. (2014b) Shen Y., Liu Y. D., Chen P. F., Ichimoto K., 2014b, ApJ, 795, 130
- Shen et al. (2017) Shen Y., Liu Y., Tian Z., Qu Z., 2017, ApJ, 851, 101
- Su & van Ballegooijen (2012) Su Y., van Ballegooijen A., 2012, ApJ, 757, 168
- Su et al. (2015) Su W., Cheng X., Ding M. D., Chen P. F., Sun J. Q., 2015, ApJ, 804, 88
- Takahashi et al. (2015) Takahashi T., Asai A., Shibata K., 2015, ApJ, 801, 37
- Thompson (2011) Thompson W. T., 2011, Journal of Atmospheric and Solar-Terrestrial Physics, 73, 1138
- Thompson et al. (1998) Thompson B. J., Plunkett S. P., Gurman J. B., Newmark J. S., St. Cyr O. C., Michels D. J., 1998, Geophys. Res. Lett., 25, 2465
- Tripathi et al. (2009) Tripathi D., Isobe H., Jain R., 2009, Space Sci. Rev., 149, 283
- Uchida (1968) Uchida Y., 1968, Sol. Phys., 4, 30
- Xia et al. (2011) Xia C., Chen P. F., Keppens R., van Marle A. J., 2011, ApJ, 737, 27
- Yan et al. (2015) Yan X. L., Xue Z. K., Pan G. M., Wang J. C., Xiang Y. Y., Kong D. F., Yang L. H., 2015, ApJS, 219, 17
- Zhang & Ji (2018) Zhang Q. M., Ji H. S., 2018, ApJ, 860, 113
- Zhang et al. (2012) Zhang Q. M., Chen P. F., Xia C., Keppens R., 2012, A&A, 542, A52
- Zhang et al. (2017) Zhang Q. M., Li D., Ning Z. J., 2017, ApJ, 851, 47
- Zhang et al. (2020) Zhang Q. M., Dai J., Xu Z., Li D., Lu L., Tam K. V., Xu A. A., 2020, A&A, 638, A32
- Zhang et al. (2022) Zhang Q., Li C., Li D., Qiu Y., Zhang Y., Ni Y., 2022, ApJ, 937, L21
- Zhang et al. (2023) Zhang Q., Teng W., Li D., Dai J., Zhang Y., 2023, ApJ, 958, 85
- Zhang et al. (2024) Zhang Y., Zhang Q., Song D.-c., Ji H., 2024, ApJ, 963, 140
- Zheng et al. (2022) Zheng R., Wang B., Zhang L., Chen Y., Erdélyi R., 2022, ApJ, 929, L4
- Zheng et al. (2023) Zheng R., et al., 2023, ApJ, 949, L8
- Zhou et al. (2016) Zhou G. P., Zhang J., Wang J. X., 2016, ApJ, 823, L19
- Zhou et al. (2024) Zhou X., et al., 2024, Nature Communications, 15, 3281
- Zou et al. (2019) Zou P., Jiang C., Wei F., Zuo P., Wang Y., 2019, ApJ, 884, 157
- van Ballegooijen & Cranmer (2010) van Ballegooijen A. A., Cranmer S. R., 2010, ApJ, 711, 164