XMM-Newton high-resolution spectroscopy of EXO 0748–676 after its re-emergence from a long quiescence
Abstract
EXO 0748–676 is a well-studied neutron star (NS) Low Mass X-ray Binary (LMXB) that recently emerged from 16 years of quiescence into a new outburst. Here, we report the results from a 53 ks XMM-Newton observation to compare with studies for the previous outburst, particularly focusing on high-resolution spectroscopy using the same instrument (RGS) that produced important results for this source during the previous outburst. The EPIC light curve reveals a type I X-ray burst at MJD 60492.31. The entire data are divided into burstless, pre-, and post-burst spectra to understand the effect of the burst on the ionization structure. The spectra for dip and non-dip phases are also created. The primary spectral feature in all phases is a broad O VII recombination line, along with velocity-broadened OVIII, NVII, and Ne IX lines. Notably, the Ne IX line is detected at different ionization states for the pre-burst (11.65 Å) and post-burst (13.56 Å) phases. The O VIII line profile also shows a difference in equivalent width between dip and non-dip phases. These findings suggest the presence of highly ionized circumstellar material or collisionally ionized gas affected by the burst and dips. The source remains in a soft spectral state, which is consistent with observations during the previous outburst.
1 Introduction
EXO 0748–676 is a neutron star (NS) low-mass X-ray binary (LMXB) system, that has been studied extensively since its discovery in 1985 (Parmar et al., 1986). In such a system, an NS accretes matter from a low-mass companion star. The appearance of thermonuclear (type I) X-ray bursts confirmed the compact object type as a neutron star (Gottwald et al., 1987). EXO 0748–676 is a prolific burster with the recurrence time of hr to 10–12 minutes, and bursts can occur as singlets, doublets, and triplets (Boirin et al., 2007). The bursts typically exhibit a linear rise followed by an exponential decay profile, with the duration of s and the characteristic decay time in the range of s (Boirin et al., 2007). Two burst oscillation features (e.g., Bhattacharyya, 2022) at 45Hz (Villarreal & Strohmayer, 2004) and 552 Hz Galloway et al. (2010) were also observed. The source has been associated with an optical counterpart UY Vol (binary orbital period hr; Wade et al., 1985). X-ray eclipses and dips are observed in light curves (Homan et al., 2003), suggesting a high inclination (75∘–82∘; Parmar et al., 1986) of the system. The eclipses are of mins with a typical ingress/egress time of 8–10 s. The intensity dips are the result of absorption by photoionized clouds situated above the accretion disk. During the intensity dips the X-ray spectrum hardens, as is expected from enhanced photoelectric absorption (Parmar et al., 1986). Another spectral characteristic of EXO 0748-676 is a soft excess in the 8–30Å band, observed with ASCA and ROSAT (Thomas et al., 1997; Schulz, 1999). Homan et al. (2003) reported energy-dependent variations in the light curve of the system. The eclipses are more prominent in the hard band (2–10 keV) and sometimes not at all observed in the soft band (Homan et al., 2003). These authors also showed that dipping is more evident in the soft band (0.3 -2 keV). They explained the spectral state evolution of this system as a result of variable absorption covering two emission components, where the extended component is softer than the central source (detailed comparison of the spectral state evolution is in Appendix B).
The high inclination of EXO 0748–676 implies that the observer’s line of sight is close to the accretion disk, and hence, it is ideal for probing the structures above the disk using observed spectral lines. High-resolution spectra from both Chandra/HETG and XMM-Newton/RGS have been used earlier to probe the spectral lines and other properties of this system. Cottam et al. (2001) used the first RGS spectrum to compare the spectra from low emission period, rapid variation period, and bursts. They found broadened recombination lines from N VII, O VII, O VIII, Ne IX, and Ne X (velocity km s-1), and the broadening varied with the ionization parameter. The K edges of the O VII and O VIII were also detected during the rapid variation phases. Cottam et al. (2002) also reported gravitationally redshifted () absorption features (Fe XXV n=2-3, Fe XXVI n=2-3, O VIII n=1-2). These features are crucial in determining NS parameters like radius-to-mass ratio (Bhattacharyya et al., 2006) and probing the superdense matter of the NS core (Bhattacharyya, 2010). However, while these features were detected in the 2000 observations of the burst, they were not found in the later 2003 observations (Cottam et al., 2008).
Chandra/HETG spectroscopy was used by Jimenez-Garate et al. (2003) to reveal the nature of photoionized plasma orbiting the neutron star. They detected the lines reported by Cottam et al. (2001) along with Mg XII Ly and Mg XI lines in the summed HEG and MEG spectrum. Their findings indicate the existence of a photoionized plasma located in the outer radius of the accretion disk and the plasma is located at a height above and below the disk midplane.
In a later work using archival XMM-Newton RGS data, the persistent and dip spectrum of this system was studied in detail (Van Peet et al., 2009). They found that the continuum is absorbed by both a collisionally ionized and photoionized plasma. The photoionized absorber shows significant enhancement in column densities during the dips. They mainly detected the OVII triplet and the OVIII Ly lines. The FWHM for OVII varies from 0.25Å to 0.5Å, and the same for the OVIII Ly line varies between 0.05Å to 0.35Å, which is similar to Cottam et al. (2001) observations. Notably, Jimenez-Garate et al. (2003) determined smaller FWHM values using Chandra than those by both Cottam et al. (2001); Van Peet et al. (2009).
Psaradaki et al. (2018) used 11 archival observations to study the eclipse spectrum. They detected the same OVII, OVIII, NeIX, and NVII lines. Their results of density diagnostics using the OVII triplet lines suggest the existence of two photoionized plasma components with different ionization parameters ( and ). The second component covers a smaller fraction of the source but exhibits an inflow velocity.
After years of its first detection, EXO 0748–676 faded into quiescence in 2008 (Hynes & Jones, 2009) However, it has recently returned to an active accretion phase after years (e.g., see Baglio et al., 2024; Bhattacharya & Bhattacharyya, 2024; Buisson et al., 2024). Given the utility of spectral lines from EXO 0748–676 for probing the accretion structure and other properties of this source, and generally of NS LMXBs, it is immensely interesting to check if similar lines appear during the new outburst, and if yes, to compare them with the lines of the previous outburst. Such a study and comparison is best done using the new XMM-Newton/RGS data because a huge amount of the same instrument’s data from the previous outburst of the source exists. With a preliminary analysis of the current XMM-Newton/RGS data, we reported an oxygen emission feature (Bhattacharya & Bhattacharyya, 2024). Motivated by this finding, here we report the analysis of the entire available XMM-Newton data during the current outburst of EXO 0748–676.
The present study is structured as follows: In section 2, observation and data analysis methods are explained. Then in section 3, the burst timing using EPIC lightcuve is determined. In section 4, we present the results of high-resolution spectral analysis. In section 5, we discuss the results and in section 6, we summarize the results and motivate further research.
2 Methods and data analysis
The observation was performed on June 30, 2024, with a 52.6 ks exposure. This work mainly focuses on the high-resolution spectrum obtained using the Reflection Grating Spectrometer (RGS) instrument. In the present work, the European Photon Imaging Camera (EPIC) light curve is used only for identifying the type I burst time and creating Good Time Intervals (GTIs).
The RGS spectrum covers a wavelength range of 5-35 Å with a resolution of 0.05 Å (mostly constant over the whole wavelength range). The raw XMM-Newton data are reduced using SAS 21.0, and specifically, the RGS 1 and 2 event files, spectra (both 1st and 2nd order), and light curves are generated using rgsproc. Then the RGS 1 and RGS 2 spectra of the same order are combined using rgscombine. This combined spectrum is finally analyzed using XSPEC 12.14.
The EPIC-PN and MOS event files are generated using epproc and emproc. Then the evselect routine is used to create PN, MOS1, and MOS2 source and background light curves (1s, 10s and 100s bins) and spectra. All the light curves are background subtracted and combined using lcmath to obtain the net source light curve.
The EPIC light curve is used to identify the burst duration and midpoint. Then tabgtigen is used to create GTIs for pre-burst (836170508.38 s to 836205700 s Mission Elapsed Time (MET)), post-burst (836206600 s to 836224732 s MET), and burstless durations. These GTI files are again used with rgsproc to create pre-burst, post-burst, and burstless total spectral data products. These first-order spectra are then grouped to contain at least 5 counts in a bin using grppha.
The MOS CCD spectrum (MOS1,2 combined) is fitted with a cuoffpl*pcfabs model (see Appendix:A) to characterize the continuum. Fitted parameter values are used as an initial guess for the RGS continuum fitting using the same model. Then the prominent lines in the high-resolution spectra are fitted with Gaussian models to get the line profile values.
3 EPIC light curve, hardness, and type I X-ray burst
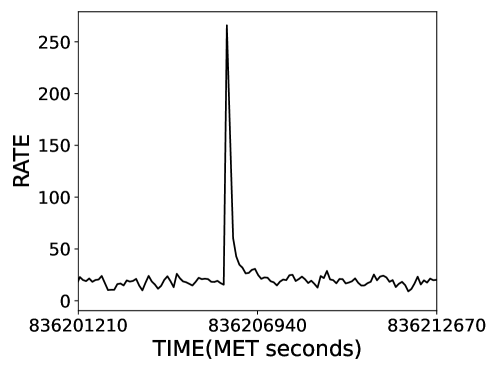
The PN (timing mode), MOS1, and MOS2 (imaging mode) net light curves (100 s binning) of this observation are added together to create a broadband (0.2 - 10 keV) EPIC light curve. A type-I X-ray burst is observed in the combined as well as individual time series. The peak time for the burst is MJD 60492.3097.
The spectral state of the source is necessary to understand and compare spectral features with past/future observations. The source exhibits a soft state throughout this observation (detailed in Appendix B). The eclipses in the broadband (0.3–10 keV) light curve are not as prominent as those observed in the hard band (2–10 keV) light curve. This is also seen in previous studies where the eclipses were absent in the soft but present in the hard band light curves (see Homan et al., 2003, for a detailed discussion).
As mentioned in section 2, in the present work, the EPIC light curve is only used to show the existence of the burst and create good time intervals using these time stamps. Further timing analysis will be presented in a follow-up study.
| Line ID | Line Center | FWHM | FWHM | Equivalent |
| (Å) | (Å) | (km s-1) | Width(Å) | |
| Total | ||||
| Ne IX | 11.65 | 0.28 | 7.2 | -0.28 |
| O VIII | 19.0 | 0.21 | 3.32 | -0.49 |
| O VII | 21.8 | 0.24 | 3.3 | -1.32 |
| N VII | 24.8 | 0.09 | 1.09 | -0.47 |
| Pre-Burst | ||||
| Ne IX | 11.67 | 0.3 | 7.71 | -0.23 |
| O VIII | 19.0 | 0.2 | 3.16 | -0.02 |
| O VII | 21.8 | 0.15 | 2.06 | -1.08 |
| N VII | - | - | - | - |
| Post-Burst | ||||
| Ne IX | 13.56 | 0.35 | 7.74 | -0.33 |
| O VIII | 19 | 0.32 | 5.05 | -0.95 |
| O VII | 21.78 | 0.2 | 2.75 | -1.9 |
| N VII | - | - | - | - |
| Dip | ||||
| Ne IX (1-3) | 11.65 | 0.3 | 7.71 | -0.51 |
| Ne IX (1-2) | 13.53 | 0.11 | 2.35 | -0.2 |
| O VIII | 19.03 | 0.33 | 5.5 | -0.96 |
| O VII | 21.79 | 0.14 | 1.97 | -0.79 |
| N VII | - | - | - | - |
| Non-Dip | ||||
| Ne IX (1-3) | 11.66 | 0.26 | 6.68 | -0.38 |
| O VIII | 19 | 0.08 | 1.31 | -0.18 |
| O VII | 21.8 | 0.29 | 3.95 | -1.06 |
| N VII | - | - | - | - |
4 RGS high resolution spectrsocopy
The high-resolution spectrum of the entire observation reveals various spectral features related to different physical properties of the system. The major contribution to the spectrum is due to the highly ionized circumstellar material. The RGS data of EXO 0748-676 enable a detailed analysis of the emission and absorption features, providing information about the circumstellar material’s ionization states, velocities, and densities. By evaluating these spectral signatures, we can gain a better understanding of how the binary components interact with the surrounding medium, as well as the system’s dynamics and physical parameters. The RGS’ accuracy is critical for determining the chemical composition and physical processes occurring around this low-mass X-ray binary system.
4.1 Pre-, post- and burstless total spectra
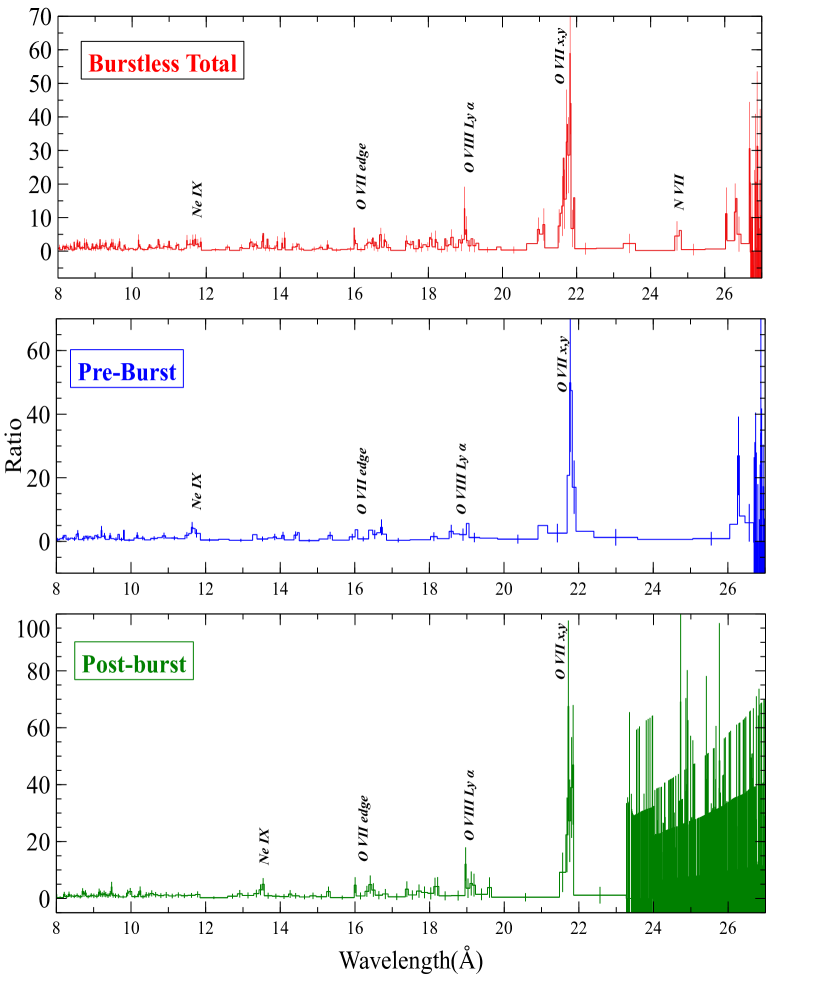
To better understand the evolution of the spectral characteristics, the entire data are divided into three parts: pre-burst, post-burst, and the entire observation excluding the burst (see Section 2).
The broad O VII emission feature (21.8 Å) is evident in all phases of the spectra. This feature is dominated by the O VII, n=1-2 intercombination line (x, y). This is also accompanied by the O VII resonance absorption line (w) at 21.6 Å. Other notable features include Ne IX, O VIII Ly, and N VII emission, as well as the O VII absorption edge from circumstellar contributions (see Figure 2). The line profile values from the Gaussian fit are provided in Table 1.
In addition to these spectral features due to circumstellar ionized material, Cottam et al. (2002) also detected absorption from the neutron star photosphere at 13.8 Å, 25.2 Å, and 26.4 Å. In this case, the spectra are noise-dominated after 23 Å, making it hard to detect the 25.2 or 26.4 Å feature. We do not detect an absorption feature near 13.8 Å. However, a broad Ne IX emission line is detected at 13.56 Å with the possibility of line blending.
The three different segments are compared to each other, and most of the spectral features appear in all of them, with a few exceptions. It must also be noted that the individual pre-burst or post-burst spectra have fewer counts than the total observation, as evident from Figure 2. The O VII intercombination line is detected in all three of these, as are the O VIII Ly and O VII absorption edge.
In the pre-burst spectrum of this observation, an emission feature is observed at 11.67 Å, which is not detected in the post-burst phase. Conversely, another emission line at 13.56 Å appears in the post-burst phase but is not detected in the pre-burst phase. Using AtomDB (Smith & Foster, 2014) to look for lines in these two regions, it is found that Ne IX 11.55 Å, n=1-3 has the highest emissivity, and similarly, the Ne IX 13.55 Å, n=1-2 line has the highest emissivity. Hence, it can be inferred that the Ne IX ion is detected in these two different states during the pre- and post-burst phases. Although these lines show large FWHM values, similar broad lines are also observed in Van Peet et al. (2009). The N VII 24.8 Å emission line is only detected in the total spectrum and not in the pre-burst spectrum. The post-burst spectrum is noise-dominated in this wavelength range.
Finally, compared with previous high-resolution spectral studies, this observation has more similarity with the earlier Cottam et al. (2001) results because the burst is excluded from the total spectra in the present work. Later, Cottam et al. (2002) and Cottam et al. (2008) use only the stacked burst spectra, a similar study can’t be carried out with this observation exhibiting a single burst. Hence, to completely understand this new outburst of this system and separately analyze the persistent and burst (early and late phases) emissions, more high-resolution observations are required.
4.2 Dip and non-dip spectra
High-inclination LMXB systems, such as EXO 0748–676, show intensity dips (Homan et al., 2003). We find such dips from the current XMM-Newton observation, and the RGS spectra created for dip and non-dip periods for this source are compared (Figure 3). The line profile parameters for these phases are given in Table 1.
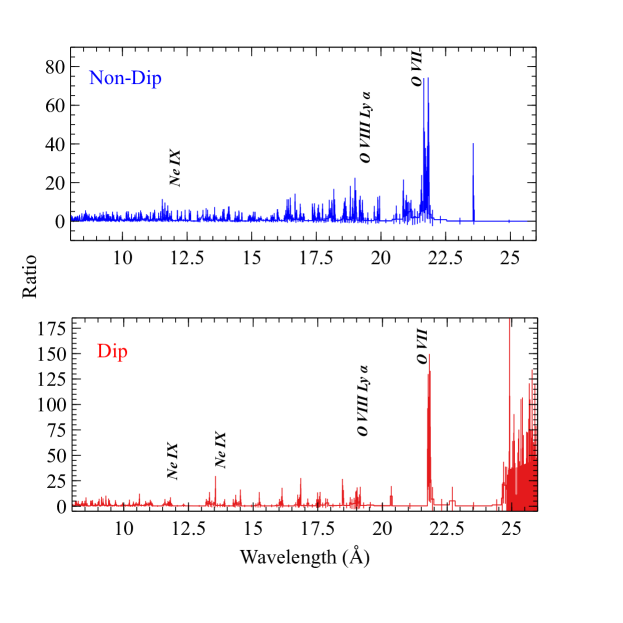
Both the dip and non-dip spectra exhibit the strong O VII intercombination line (21.8Å) and the O VIII Ly emission line (19Å). The Ne IX lines are also detected, the dip spectrum shows both the Ne IX lines at 11.65 and 13.5Å, whereas the non-dip spectrum doesn’t have the 13.5Å line. The N VII (24.8Å) line is not detected in the non-dip phase and the wavelength region of N VII (24.8Å) emission in the dip phase is noise-dominated.
The line characteristics show some difference between the dip and non-dip periods. While the O VII line is detected in both phases, the equivalent width is higher in the non-dip phase. However, the O VIII Ly emission line is of higher equivalent width in the intensity dip phase.
5 Discussion
The spectral characteristics can be used to understand and characterize the circumstellar material and its ionization state. As these emission lines are broadened but do not show any Doppler shift, it can be inferred that there is no signature of inflow or outflow but rather material orbiting around the central engine. Cottam et al. (2001) suggested the existence of a thickened accretion disk where the extended orbiting material exists high above the binary plane. This plasma in the uppermost region is responsible for the emission and absorption features.
The three O VII lines, i.e., the x+y intercombination line (21.8 Å) and the z forbidden line (22.1 Å), can be used as indicators to identify the source of emission. The intercombination line is detected in all the segments, whereas the forbidden line is absent. This indicates that there is either a high-density photoionized gas or a collisionally ionized gas (Van Peet et al., 2009). Although both types of gas will have O VII and O VIII and will show the detected lines, it is hard to disentangle between these two scenarios.
Jimenez-Garate et al. (2003) used Chandra/HETG spectra to detect signatures of photoionized plasma orbiting around the neutron star. We also observe in our spectra the broad O VII recombination line, suggesting the existence of an extended recombination region in the outer accretion disk. They also detected Mg XII and Mg XI lines, which are not detected in any other works. The line widths reported in this work are consistent with Cottam et al. (2001); Van Peet et al. (2009) rather than Jimenez-Garate et al. (2003), although both suggest the existence of the recombination region in the outer radius of the accretion disk, likely created by the impact of the accretion stream.
The light curve exhibits various features like dips, eclipses, and bursts. Psaradaki et al. (2018) used 11 archival observations to create and analyze spectra of the eclipsed phases to understand the disk atmosphere. In a single exposure, we observe only three eclipses (24 minutes integration time), which do not have enough counts for a meaningful eclipse spectroscopy.
Two different Ne IX emission features were detected during the pre-burst and post-burst segments in this study. They can both be due to different excitation levels of Ne IX. The feature in the pre-burst and total spectra is at 11.65 Å n=1-3, and the feature in the post-burst is at 13.5 Å n=1-2. This suggests a change in the ionization parameter after the burst, indicating an interaction of the central source with the accretion disk material or the collisionally ionized gas during the burst. The Ne IX features are broad and have large FWHM values. Van Peet et al. (2009) also found a maximum FWHM of 35 Å, similar to this work.
The dip and non-dip phase spectra also show significant variation in the spectral features. The intensity dips in EXO 0748–676 span most of the orbital phase and can be as low as 80% decrease in flux (Schulz, 1999). The hard band counts are less affected than the soft band. The high-resolution spectra show variation between these phases, the dip, and the non-dip phase. The existence of the Ne IX (1-3) line in the dip feature along with an increased equivalent width of O VIII line suggests a change in ionization structure during the intensity dip phases.
All the emission lines show significant velocity broadening (Table 1), which suggests the existence of orbital motion of material around the central source. The ionization parameters of formation show a correlation with the velocity (Table 1 of Cottam et al. (2001)). This feature is also observed in the present study, and an orbital velocity structure can be derived from this. Ne IX, which has the largest ionization parameter, should be closest to the source and hence show the largest velocity, whereas N VII, with the lowest ionization parameter, should be farthest from the source and show the lowest velocity.
6 Conclusion
This paper presents the high-resolution spectral analysis of the neutron star LMXB system EXO 0748–676. We use a single observation from XMM-Newton , focusing mainly on the RGS data. EXO 0748–676 had been in long quiescence before recently going into an outburst. The summary of the main findings are:
-
•
The source is in the same soft spectral state as for the last outburst (Homan et al., 2003).
-
•
A type-I X-ray burst with a linear rise and exponential decay profile is detected at MJD 60492.3097.
-
•
The total observation is divided into total (burst excluded), pre-burst and post-burst segments. The strongest O VII x,y emission line is detected in all three segments.
-
•
The Ne IX line is observed at 11.65Å in the pre-burst and total burstless spectra, and at 13.56Å in the post-burst phase. This suggests a change in the ionization state of the extended region due to the burst.
-
•
The Ne IX 13.5Å line is absent in the non-dip phase and the O VIII 19Å line also exhibits an increased equivalent width in the dip phase.
We have observed similar spectral behavior to the previous outburst (Cottam et al., 2001). All the major spectral lines mentioned in previous studies (Jimenez-Garate et al., 2003; Van Peet et al., 2009; Psaradaki et al., 2018) are detected in this observation as well. However, to perform detailed modeling and detect other features possibly related to the neutron star photosphere, deeper observations including more bursts are required. Cottam et al. (2001) used 330 ks for analyzing burst spectra, and Van Peet et al. (2009) used the same amount of data to analyze the persistent spectra. Later, Psaradaki et al. (2018) used 11 archival observations to model the eclipse spectrum. A detailed study of the burst spectra and stacking the non-burst persistent emission spectra for studying dips and eclipses needs to be done even for this new outburst. Future monitoring observations using XRISM, Chandra/HETG, and XMM-Newton/RGS will be necessary to unveil crucial physical properties of this system utilizing this new outburst.
Acknowledement: The authors acknowledge the help from XMM-Newton project scientist Dr. Norbert Schartel for his prompt action in obtaining the data through DDT time.
References
- Baglio et al. (2024) Baglio, M., Russell, D., Alabarta, K., et al. 2024, The Astronomer’s Telegram, 16646, 1
- Bhattacharya & Bhattacharyya (2024) Bhattacharya, S., & Bhattacharyya, S. 2024, The Astronomer’s Telegram, 16703, 1
- Bhattacharyya (2010) Bhattacharyya, S. 2010, Advances in Space Research, 45, 949
- Bhattacharyya (2022) Bhattacharyya, S. 2022, Astrophysics and Space Science Library, Vol. 465, Nuclear-Powered X-ray Millisecond Pulsars, ed. S. Bhattacharyya, A. Papitto, & D. Bhattacharya (Cham), 125–155, doi: 10.1007/978-3-030-85198-9_5
- Bhattacharyya et al. (2006) Bhattacharyya, S., Miller, M. C., & Lamb, F. K. 2006, The Astrophysical Journal, 644, 1085
- Boirin et al. (2007) Boirin, L., Keek, L., Méndez, M., et al. 2007, Astronomy & Astrophysics, 465, 559
- Buisson et al. (2024) Buisson, D., Ludlam, R. M., Middleton, M., et al. 2024, The Astronomer’s Telegram, 16673, 1
- Cottam et al. (2001) Cottam, J., Kahn, S., Brinkman, A., den Herder, J., & Erd, C. 2001, Astronomy & Astrophysics, 365, L277
- Cottam et al. (2002) Cottam, J., Paerels, F., & Mendez, M. 2002, Nature, 420, 51
- Cottam et al. (2008) Cottam, J., Paerels, F., Méndez, M., et al. 2008, The Astrophysical Journal, 672, 504
- Galloway et al. (2010) Galloway, D. K., Lin, J., Chakrabarty, D., & Hartman, J. M. 2010, The Astrophysical Journal Letters, 711, L148
- Gottwald et al. (1987) Gottwald, M., Haberl, F., Parmar, A. N., & White, N. E. 1987, Astrophysical Journal, Part 1 (ISSN 0004-637X), vol. 323, Dec. 15, 1987, p. 575-581., 323, 575
- Homan et al. (2003) Homan, J., Wijnands, R., & van den Berg, M. 2003, Astronomy & Astrophysics, 412, 799
- Hynes & Jones (2009) Hynes, R. I., & Jones, E. D. 2009, The Astrophysical Journal, 697, L14
- Jimenez-Garate et al. (2003) Jimenez-Garate, M. A., Schulz, N., & Marshall, H. 2003, The Astrophysical Journal, 590, 432
- Parmar et al. (1986) Parmar, A., White, N., Giommi, P., & Gottwald, M. 1986, Astrophysical Journal, Part 1 (ISSN 0004-637X), vol. 308, Sept. 1, 1986, p. 199-212., 308, 199
- Psaradaki et al. (2018) Psaradaki, I., Costantini, E., Mehdipour, M., & Trigo, M. D. 2018, Astronomy & Astrophysics, 620, A129
- Schulz (1999) Schulz, N. 1999, The Astrophysical Journal, 511, 304
- Sidoli et al. (2005) Sidoli, L., Parmar, A. N., & Oosterbroek, T. 2005, Astronomy & Astrophysics, 429, 291
- Smith & Foster (2014) Smith, R., & Foster, A. 2014, The AtomDB Charge Exchange model
- Thomas et al. (1997) Thomas, B., Corbet, R., Smale, A. P., Asai, K., & Dotani, T. 1997, The Astrophysical Journal, 480, L21
- Van Peet et al. (2009) Van Peet, J., Costantini, E., Méndez, M., Paerels, F., & Cottam, J. 2009, Astronomy & Astrophysics, 497, 805
- Villarreal & Strohmayer (2004) Villarreal, A. R., & Strohmayer, T. E. 2004, The Astrophysical Journal, 614, L121
- Wade et al. (1985) Wade, R. A., Quintana, H., Horne, K., & Marsh, T. 1985, Publications of the Astronomical Society of the Pacific, 97, 1092
Appendix A Spectral analysis of MOS CCD spectrum
Although the main focus of this work is the high-resolution spectroscopy of EXO 0748–676 using RGS, the combined MOS spectra (1+2 using epicspeccombine) are also used to characterize the continuum. The spectrum is fitted with a simple cutoffpl*pcfabs model in XSPEC 12.14.
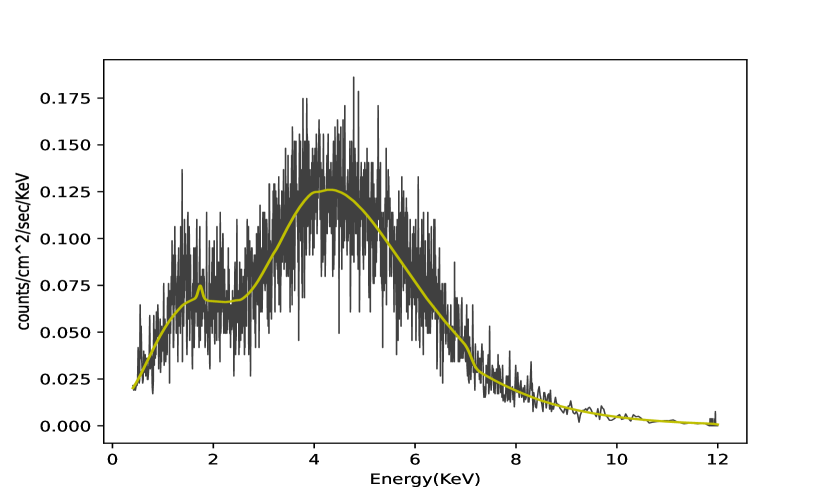
The spectrum shows a complex profile in the soft energy range ( 2 keV) that is difficult to fit with a single power-law model. There is a soft excess evident in the spectrum (Fig. A1), which has also been reported in earlier studies (Sidoli et al., 2005; Thomas et al., 1997; Schulz, 1999) and the latest telegram on NuSTAR observation (Buisson et al., 2024). Hence, a cutoff power law has been used to fit the continuum with partial absorption. A diskbb+powerlaw model with partial absorption was also used, but it did not result in a good fit (/dof = 5392.65/1471). The best-fit parameters from the cutoffpl*pcfabs model are given in Table A1. The parameters were left free for fitting and the resulting fit shows a negative value for the power law index, (Table A1). Although this may not represent the physical process resulting in the continuum shape but it can be used to phenomenologically model the continuum and study the spectral lines using the continuum-normalized RGS spectra.
| Model | Parameter | Value |
|---|---|---|
| -1.810.09 | ||
| cutoffpl | HighECut | 1.03 0.03 keV |
| 19.10.9 cm-2 | ||
| pcfabs | Coverfrac | 0.9130.008 |
| Flux | (4.0 - 4.15) ergs/cm2/s | |
| /dof | 446.40/1471 |
Appendix B Evolution of spectral hardness and hardness intensity diagram
In order to interpret and facilitate future comparison of the spectral results, it is important to understand the spectral state and spectral evolution of the source throughout the observation. The PN timing mode light curve is used in broad (0.3–10 keV), soft (0.3–2 keV), and hard (2–10 keV) energy bands. These energy bands are kept the same as in Homan et al. (2003) to draw a comparison with the spectral state of the source at that time. The hardness ratio (HR) is calculated as the ratio . A multipanel diagram is created (Fig.B1) showing the evolution of HR with time and the light curve in hard and soft energy bands.
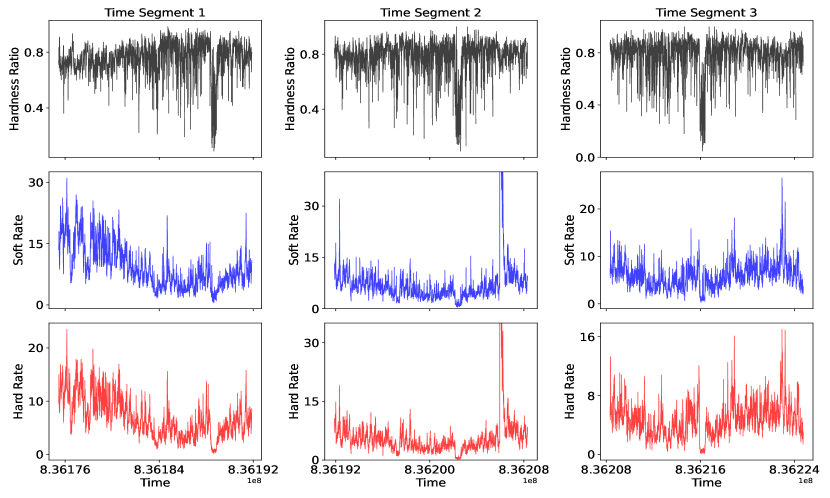
The source remains in a soft state for the entire duration of the observation (mean HR = 0.77). The spectral state is even softer during the eclipse compared to the average. Although hardness ratio values are not explicitly reported, Fig. 1 of Homan et al. (2003) shows that the characteristics of the source reported here are similar to those observed earlier. Hence, it can be seen that the source has returned to its earlier spectral state after 21 years.