Redshift constrain of BL Lac PKS 1424+240
Abstract
In the period between 2009 and 2015, several very high-energy (VHE GeV) gamma-ray flaring events from the BL Lac object PKS 1424+240 were observed by the Cerenkov telescopes VERITAS and MAGIC. It had uncertain redshift () and using spectroscopical measurement, Paiano et al. (2017) found it to be . Using four different extragalactic background light (EBL) models and the photohadronic model, nine independently observed VHE gamma-ray spectra of PKS 1424+240 are analyzed and a global fit is performed on all observations to estimate the best-fit value for the redshift for each EBL model. Confidence levels (CL) intervals for the redshift are also estimated using all the EBL models. This method is tested by comparing our analysis with the observed value. It is shown that the photohadronic scenario provides an excellent description of all the observed spectra. It is found that the EBL model of Domínguez et al. (2011) is the one that provides the most restrictive limits on the redshift of PKS 1424+240, but in our analysis, lies within the CL interval of the EBL model of Saldana-Lopez et al. (2021).
keywords:
BL Lacertae objects: general, galaxies: jets, gamma rays: galaxies1 INTRODUCTION
Blazars are a subclass of active galactic nuclei (AGN), characterized by their non-thermal spectra, originating from a relativistic jet, that is closely aligned with the observer’s line of sight (Urry & Padovani, 1995; Acciari et al., 2011). Blazars exhibit rapid variability throughout their entire electromagnetic spectrum. Their spectral energy distributions (SEDs) show a distinctive double-peak structure (Abdo et al., 2010), the first peak arises as synchrotron photons from the propagation of low-energy electrons in the jet magnetic field. However, the second peak can either be from the Compton scattering of high-energy electrons with their self-produced synchrotron photons, a phenomenon known as synchrotron self-Compton (SSC) scattering (Maraschi et al., 1992; Dermer & Schlickeiser, 1993; Sikora et al., 1994; Blazejowski et al., 2000; Murase et al., 2012; Gao et al., 2013) or from the external Compton scattering with the photons from the accretion disk, broad-line regions or the dusty torus(Dermer & Schlickeiser, 1993; Sikora et al., 1994; Blazejowski et al., 2000).
PKS 1424+240 was discovered in the 1970s as a radio source (Fanti et al., 1974) and was later identified as a blazar by Impey & Tapia (1988). Later, the source was detected in -rays by the Fermi Large Area Telescope (LAT; Atwood et al. (2009)). In the spring of 2009, VERITAS reported the observation of VHE gamma-rays from this source (Ong, 2009) and, subsequently, it was confirmed by MAGIC (Teshima, 2009). Afterwards, several VHE flaring events from PKS 1424+240 were observed between 2009 and 2015. Nonetheless, the frequency of the synchrotron peak for PKS 1424+240 was not directly determined. However, it could be constrained from the optical and the X-ray data and was found to be in the range Hz (Acciari et al., 2010). From the classification of the BL Lac objects, we know that this range of classifies the object as high-frequency peaked BL Lac (HBL) (Padovani & Giommi, 1996; Abdo et al., 2010; Boettcher et al., 2013).
The non-thermal emission in a BL Lac object dominates over the stellar emission of its host galaxy, making it difficult to correctly estimate the redshift. As a consequence, ambiguities arise in tracing the cosmic evolution, the nature and the understanding of the intrinsic VHE spectrum of the source. Given the fact that VHE photons are dampened by the extragalactic background light (EBL), information of the redshift is essential to investigating the role of the EBL.
EBL models are constructed with the convergence of different approaches as direct measurements, semi analytical models of galaxy formation, analysis of cosmic star formation history, and galaxy luminosity densities with SEDs. The models used in this work belong to the last category and their main difference is the number of galaxy samples employed, which is correlated with the redshift value range of the data output from the model (Saldana-Lopez et al., 2021).
The VHE gamma-ray flux of a blazar observed on Earth is given by (Hauser & Dwek, 2001)
| (1) |
where , , and are the observed VHE photon energy, the observed flux, and the intrinsic flux, respectively. Here, the optical depth for the process depends on and the redshift of the source. The exponential factor in Eq. (1) accounts for the attenuation in the VHE flux due to production (Stecker et al., 1992; Ackermann et al., 2012; Padovani et al., 2017). Thus, knowledge on is crucial to estimating the intrinsic flux from the observed flux. Well-known and reliable EBL models by Franceschini et al. (2008); Finke et al. (2010); Dominguez et al. (2011); Gilmore et al. (2012); Saldana-Lopez et al. (2021) are employed by Imagining Atmospheric Cerenkov Telescope (IACT) collaborations to analyze the observed VHE -ray spectra from objects at different redshifts.
As stated previously, the redshift of HBL PKS 1424+240 is measured spectroscopically with a value (Paiano et al., 2017). However, alternative methods do not provide a definitive result. By making a “minimum luminosity assumption" (host galaxy absolute magnitude to be ), Scarpa & Falomo (1995) have derived a lower limit of , while Sbarufatti et al. (2005) set a limit of by using the average value . Acciari et al. (2010) combined the photon index (measured with Fermi Large Area Telescope) with EBL models, to estimate the redshift , with an upper limit of at CL. Comparing the measured and intrinsic VHE spectra due to EBL absorption, an upper limit of 1.19 on the redshift was derived in Yang & Wang (2010). Employing a derived empirical law, describing the relation between the upper limits and the true redshifts, the redshift is estimated to be in Prandini et al. (2010, 2011). The photometric redshift, obtained through spectral fitting of optical/UV data, has an upper limit of (Rau, A. et al., 2012). Furniss et al. (2013) have given a lower limit, , set by the detection of Ly and Ly lines from intervening hydrogen clouds. By multiwavelength spectral characterization and modeling of the blazar, in Ref. Aleksić et al. (2014), a value with an upper limit of 0.81 at is reported. In Ref. Rovero, A. C. et al. (2016), the probability of PKS 1424+240 being a member of a group of galaxies found at was found to be . The observed correlation between the VHE spectral index of blazars and redshift is interpreted as a result of EBL induced absorption effects and the absence of such correlation led to develop a technique to estimate the redshift of distant blazars whose optical spectrum is featureless. For PKS 1424+240, this technique was employed by Zahoor et al. (2022) and have estimated and .
The multi-zone leptonic models are also used to explain the VHE flaring events. However, one needs to almost double the parameters in these models. Models involving hadrons suffer from low efficiency. For example, in the proton synchrotron scenario, the emission of synchrotron photons by protons in the jet environment is suppressed by a factor of , where is the proton mass. Thus, this process requires ultra-high energy proton flux. Also a strong magnetic field is needed, which is unusual in a blazar jet (Mannheim et al., 1991; Mücke & Protheroe, 2001; Mücke et al., 2003). There are several other alternative models, such as spine-layer structured jet model and the lepton-hadron hybrid models to explain these spectra (Ghisellini et al., 2005; Tavecchio & Ghisellini, 2008; MAGIC Collaboration et al., 2019; Ahnen et al., 2018).
Previously, the photohadronic model (Sahu, 2019), has been successfully used to explain the VHE -ray spectra of various HBLs and extreme HBLs (EHBLs) (Sahu et al., 2020, 2021, 2022). A new classification scheme was proposed (Sahu et al., 2019) by analyzing the spectral index of several observed VHE -ray spectra from HBLs. In the foregoing, the photohadronic model (Sahu, 2019) along with four well-known EBL models Saldana-Lopez et al. (2021); Franceschini et al. (2008); Dominguez et al. (2011); Gilmore et al. (2012) are used to analyze nine VHE flaring events of PKS 1424+240 between 2009 and 2015, observed by VERITAS and MAGIC collaborations. By performing a global fit to the full set of experimental data points of these VHE spectra, the central values and CL intervals for the redshift of PKS 1424+240 are determined for each EBL model considered.
2 THE PHOTOHADRONIC MODEL
In the photohadronic model, a double jet configuration is assumed during the VHE flaring process (Sahu, 2019; Sahu et al., 2019). A double jet configuration has been proposed in earlier works (Ghisellini & Tavecchio, 2008; Giannios et al., 2010). In the photohadronic scenario, a compact and constrained narrower jet, with a size , is formed within the wider jet of size , (the quantities in the comoving frame are indicated by primes). In the inner region of the jet, the photon density, , is significantly greater than the photon density in the outer jet region, (). The photohadronic model is based on the conventional interpretation of the first two peaks in the SED, namely, that the first peak results from the synchrotron radiation emitted by relativistic electrons within the jet environment and the second peak is a consequence of the SSC process. The inner jet moves at a (slightly) higher velocity (with bulk Lorentz factor ) compared to the outer jet (with bulk Lorentz factor ). For simplicity, it is assumed and a common Doppler factor (Ghisellini et al., 1998; Krawczynski et al., 2004). For HBLs, we have .
In the photohadronic scenario, protons are accelerated to very high-energies in the inner jet region, and their differential spectrum follows a power-law form, (Dermer & Schlickeiser, 1993), where is the proton energy and is the proton spectral index. The specific value of differs, depending on the type of shock encountered. It can be different for non-relativistic shocks, highly relativistic shocks, and oblique relativistic shocks (Keshet & Waxman, 2005; Summerlin & Baring, 2012). The interaction of these high-energy protons with the SSC background seed photons in the inner jet region results in the production of the -resonance through the process . The -resonance decays to and with different probabilities. Although the direct single pion production and the multi-pion production processes contribute, they are less efficient in the energy range under consideration (Mücke et al., 1999; Owen et al., 2018). Such contributions are neglected in the present work. Finally, the neutral pion decays to -rays and the to neutrinos (Sahu et al., 2012). In the photohadronic scenario, the -rays generated from decay are blue-shifted to VHE -rays and are detected on Earth. The positrons produced from decay will emit synchrotron photons.
The observed VHE -ray energy and the seed photon energy satisfy the condition (Sahu, 2019; Sahu et al., 2019)
| (2) |
In the above process, the VHE photon carries approximately of the proton energy, . Given the inaccessible nature of the inner jet region and the lack of direct means to estimate the photon density within it, a scaling relationship between the inner and the outer jet regions is assumed, which can be expressed as (Sahu et al., 2016)
| (3) |
In the above equation, the left-hand side represents the unknown, while the right-hand side is known. This equation is employed to express the unknown photon density in the inner region in terms of the known photon density in the outer region.
The intrinsic -ray flux from the decay is deduced to be
| (4) |
By taking into account the seed photon density and the proton flux, the intrinsic flux can be expressed as
| (5) |
By putting this in Eq. (1), the observed flux is determined to be
| (6) |
where the spectral index . The component represents the power spectrum of the seed photons in the low energy tail region of the SSC spectrum. The normalization factor can be determined from the observed data. The value of is considered as the only free parameter in the photohadronic model (Sahu et al., 2019). As can be seen from Eq.(6), in the photohadronic model the curvature in the spectrum, if any, can be taken care of by the exponential term (Acciari et al., 2019).
It is important to note that the photohadronic process works well for GeV. Below this energy, the leptonic processes such as the electron synchrotron mechanism and the SSC process have the dominant contribution to the multiwavelength SED.
3 ANALYSIS AND RESULTS
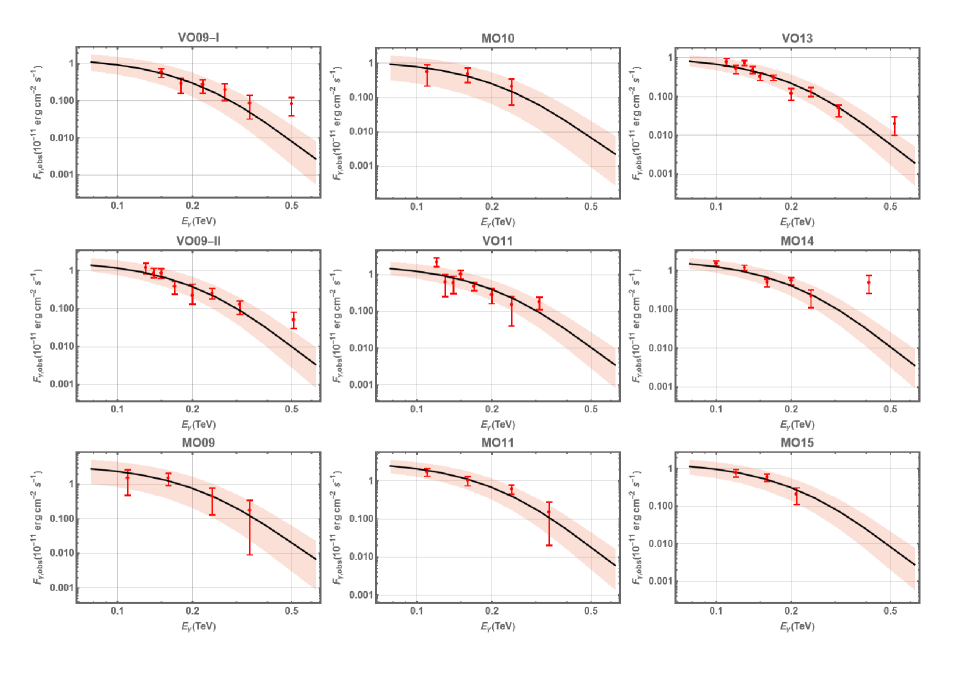
In the analysis of the VHE gamma-ray spectra of PKS 1424+240, the EBL corrections are taken care of by the use of four well-known EBL models. For convenience, the EBL models are referred to as Saldana (Saldana-Lopez et al., 2021), Franceschini (Franceschini et al., 2008), Domínguez (Dominguez et al., 2011), and Gilmore (Gilmore et al., 2012). Also for convenience, each observation is named according to the telescope and the year of observation. The observations by VERITAS in 2009 (from MJD 54881 to MJD 55003) are named as VO09-I for the time averaged spectrum analysis and as VO09-II for the analysis of the VHE -ray spectrum. In Table 1 we have listed details about all the observations.
In accordance with the classification scheme given by Sahu et al. (2019), the VHE emission states of a HBL are defined according to the value. The emission state is considered very high when . The high emission state corresponds to and implies the low emission state. Since PKS 1424+240 is a HBL, must be constrained to lie in the range .
The duration of time observed during each observation period by VERITAS and MAGIC are between two to five months. Thus, the observed spectra are the average spectra. It is very important to note that these observation periods are too long for a spectrum to be in a very high emission state or high emission state. Also, the average spectrum of a long observation is always in a low emission state which corresponds to . Thus, for further analysis to all the nine spectra, we fixed the spectral index to .
For our analysis and to find the best fits to the observed VHE-spectra for a given EBL model, the EBL model is implemented in the photohadronic model and a global fit is performed on all the data points by simultaneously varying the redshift (common to all observations) and the corresponding normalization constants of each of the nine independent observations. The global fitting procedure is repeated for the other three EBL models too to find the best-fit value of the redshift of the HBL PKS 1424+240 and the normalization of the photohadronic model. The redshift CL intervals at , , and , are then calculated for each of the four EBL models considered.
The best fit values for the normalization constants , corresponding to each observation and for the four EBL models, are given in Table 2. One can observe that for a given observation, the value is very similar in all the EBL models. This clearly shows that all the EBL models are also similar to each other. Analogously, the best-fit values for the redshift and their CL intervals at , , and , are calculated which are shown in Table 3. With 42 degrees of freedom (52 experimental data points considered and 10 free parameters), values of minimum obtained for the global fit are 61.8, 64.74, 66.47, and 63.51 for the EBL models of Saldana, Franceschini, Domínguez, and Gilmore, respectively. The use of a different EBL model predicts different CL intervals of for each observed VHE spectrum. The photohadronic model with the EBL model of Domínguez provides the most restrictive intervals on the redshift, the central value with at , at , and , at . Although, the least restrictive intervals on are obtained with the EBL model of Saldana, the measured value of lies within the CL interval of this model.
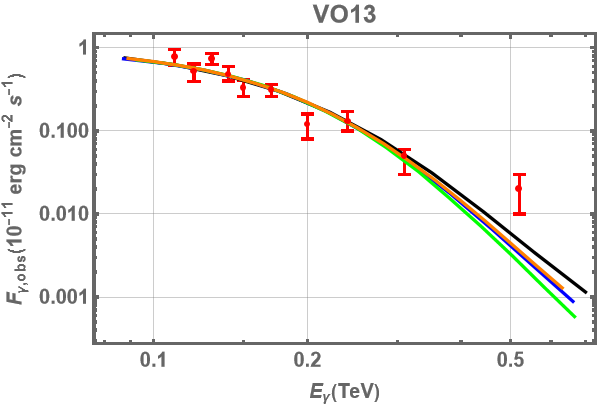
Fits to the nine observed VHE spectra of PKS 1424+240 are displayed in Fig. 1, where, the best-fit parameters for the EBL model of Saldana (given in Tables 2 and 3) are used. The fits to the VHE spectra using the Domínguez, Franceschini, and Gilmore EBL models are omitted because, visually, there is no discernible difference from one EBL model to another. For comparison, all the four EBL models are used to best fit the spectrum of VO13 which is shown in Fig. 2. All the four EBL models fit very well to the data. However, for TeV we observe a small discrepancy. The Saldana EBL model is implemented in the photohadronic model to determine the butterfly -CL regions for the nine observed spectra, which are also shown in Fig. 1. Plots of CL regions with the other three EBL models considered are omitted. For comparison, the redshift of PKS 1424+240 estimated by different authors and the spectroscopic measurement are summarized in Table 4.
| Observation | Instrument | Start date | End date | Period (MJD) | Duration (h) | Reference |
|---|---|---|---|---|---|---|
| VO09-I | VERITAS | 19/02/2009 | 21/06/2009 | 54881 - 55003 | 37.3 | Acciari et al. (2010) |
| VO09-II | ||||||
| MO09 | MAGIC | 17/04/2009 | 23/06/2009 | 54938 - 55005 | 12.5 | Aleksić et al. (2014) |
| MO10 | MAGIC | 14/03/2010 | 19/04/2009 | 55269 - 55305 | 11.6 | Aleksić et al. (2014) |
| VO11 | VERITAS | 06/02/2011 | 30/05/2011 | 55598 - 55711 | 14 | Archambault et al. (2014) |
| MO11 | MAGIC | 24/04/2011 | 08/05/2011 | 55675 - 55689 | 9.5 | Aleksić et al. (2014) |
| VO13 | VERITAS | 11/02/2013 | 04/05/2013 | 56334 - 56447 | 67 | Archambault et al. (2014) |
| MO14 | MAGIC | 23/03/2014 | 18/06/2014 | 56739 - 56826 | 28.19 | Acciari et al. (2019) |
| MO15 | MAGIC | 22/01/2015 | 13/06/2015 | 57044 - 57186 | 20.9 | Acciari et al. (2019) |
| Observation | EBL Model | |
|---|---|---|
| VO09-I | Saldana | 1.420 |
| Franceschini | 1.271 | |
| Domínguez | 1.337 | |
| Gilmore | 1.421 | |
| VO09-II | Saldana | 1.767 |
| Franceschini | 1.593 | |
| Domínguez | 1.683 | |
| Gilmore | 1.776 | |
| MO09 | Saldana | 3.590 |
| Franceschini | 3.257 | |
| Domínguez | 3.426 | |
| Gilmore | 3.624 | |
| MO10 | Saldana | 1.191 |
| Franceschini | 1.074 | |
| Domínguez | 1.126 | |
| Gilmore | 1.194 | |
| VO11 | Saldana | 1.840 |
| Franceschini | 1.649 | |
| Domínguez | 1.736 | |
| Gilmore | 1.840 | |
| MO11 | Saldana | 3.162 |
| Franceschini | 2.855 | |
| Domínguez | 2.996 | |
| Gilmore | 3.175 | |
| VO13 | Saldana | 1.034 |
| Franceschini | 0.931 | |
| Domínguez | 0.981 | |
| Gilmore | 1.037 | |
| MO14 | Saldana | 1.907 |
| Franceschini | 1.709 | |
| Domínguez | 1.797 | |
| Gilmore | 1.913 | |
| MO15 | Saldana | 1.462 |
| Franceschini | 1.312 | |
| Domínguez | 1.381 | |
| Gilmore | 1.460 |
| EBL Model | Redshift | Redshift CL intervals | ||
|---|---|---|---|---|
| Saldana | 0.660 | (0.626, 0.724) | (0.607, 0.756) | (0.597, 0.770) |
| Franceschini | 0.679 | (0.639, 0.722) | (0.616, 0.749) | (0.605, 0.762) |
| Domínguez | 0.689 | (0.650, 0.724) | (0.622, 0.748) | (0.610, 0.758) |
| Gilmore | 0.727 | (0.685, 0.770) | (0.661, 0.798) | (0.650, 0.812) |
| n | Redshift | Method | Reference |
|---|---|---|---|
| 1 | Spectroscopic measurement | Paiano et al. (2017) | |
| 2 | 0.06 < | Minimum luminosity assumption | Scarpa & Falomo (1995) |
| 3 | 0.67 < | Average luminosity value | Sbarufatti et al. (2005) |
| 4 | = 0.5 ± 0.1 | Photon index – EBL models combination | Acciari et al. (2010) |
| 5 | < 0.66 at 95% CL | Photon index – EBL models combination | Acciari et al. (2010) |
| 6 | < 1.19 | Measured – intrinsic VHE spectra comparison | Yang & Wang (2010) |
| 7 | = 0.24 ± 0.05 | Upper limits – true redshifts relationship | Prandini et al. (2010, 2011) |
| 8 | < 1.11 | Spectral fitting of optical/UV data | Rau, A. et al. (2012) |
| 9 | 0.6035 < | Ly and Ly lines detection | Furniss et al. (2013) |
| 10 | = 0.61 ± 0.10 | Multiwavelength spectral characterization | Aleksić et al. (2014) |
| 11 | < 0.81 at | Multiwavelength spectral characterization | Aleksić et al. (2014) |
| 12 | = 0.6010 ± 0.003 | Member of a group of galaxies probability | Rovero, A. C. et al. (2016) |
| 13 | = 0.28 ± 0.13 | VHE spectral index – redshift correlation | Zahoor et al. (2022) |
| 14 | = 0.24 ± 0.11 | VHE spectral index – redshift correlation | Zahoor et al. (2022) |
| 15 | 0.597 < < 0.770 at 95% CL | Global fit to independent observations | Present work (EBL Saldana) |
4 SUMMARY AND DISCUSSION
In this work, the photohadronic model is used in conjunction with the EBL models of Saldana, Franceschini, Domínguez, and Gilmore, to impose stringent constraints on the redshift of PKS 1424+240. This is done by analyzing nine different VHE spectra, independently observed by VERITAS and MAGIC telescopes in the period between 2009 and 2015. Since the photohadronic model (Sahu, 2019; Sahu et al., 2019) has demonstrated its effectiveness in constraining the redshift of various HBLs with unknown values (Sahu et al., 2023), it is employed again to analyze the nine VHE spectra of PKS 1424+240 to constrain its redshift.
The observation period for each spectrum varies between two to five months, too long for a spectrum to be in a very high emission state or in a high emission state. It is observed that all the nine VHE emissions of the HBL PKS 1424+240 were in low emission states (). With this information, for the analysis, a global fit is performed by simultaneously varying the redshift of the object and the normalization constants of each one of the nine independent observations, to find the best fit to the observed VHE spectra for a given EBL model. This procedure is repeated for all the other three EBL models to find the corresponding best fit values of and the parameters . Using the best fit values of the redshift and the ’s, the redshift CL intervals at , , and , for each one of the four EBL models considered are calculated.
Our analysis shows that the EBL model of Dominguez et al. (2011) provides the most restrictive limits on the redshift and the least restrictive intervals on are obtained with the EBL model of Saldana-Lopez et al. (2021). However, the measured value of (Paiano et al., 2017) lies within the CL interval of the EBL model of Saldana-Lopez et al. (2021) only.
Acknowledgements
We thank the reviewer for her/his constructive remarks which helped us to improved the manuscript substantially. The work of S.S. is partially supported by DGAPA-UNAM (México) Project No. IN103522. B. M-C, R. de J. P-A, and G. S-C, would like to thank CONAHCYT (México) for partial support. Partial support from CSU-Long Beach is gratefully acknowledged.
Data Availability
No new data were generated or analysed in support of this research.
References
- Abdo et al. (2010) Abdo A. A., et al., 2010, ApJ, 716, 30
- Acciari et al. (2010) Acciari V. A., et al., 2010, ApJL, 708, L100
- Acciari et al. (2011) Acciari V. A., et al., 2011, ApJ, 729, 2
- Acciari et al. (2019) Acciari V. A., et al., 2019, MNRAS, 486, 4233
- Ackermann et al. (2012) Ackermann M., et al., 2012, Science, 338, 1190
- Ahnen et al. (2018) Ahnen M. L., et al., 2018, A&A, 620, A181
- Aleksić et al. (2014) Aleksić J., et al., 2014, A&A., 567, A135
- Archambault et al. (2014) Archambault S., et al., 2014, ApJ, 785, L16
- Atwood et al. (2009) Atwood W. B., et al., 2009, ApJ, 697, 1071
- Blazejowski et al. (2000) Blazejowski M., Sikora M., Moderski R., Madejski G., 2000, ApJ, 545, 107
- Boettcher et al. (2013) Boettcher M., Reimer A., Sweeney K., Prakash A., 2013, ApJ, 768, 54
- Dermer & Schlickeiser (1993) Dermer C. D., Schlickeiser R., 1993, ApJ, 416, 458
- Dominguez et al. (2011) Dominguez A., et al., 2011, MNRAS, 410, 2556
- Fanti et al. (1974) Fanti C., Fanti R., Ficarra A., Padrielli L., 1974, A&AS., 18, 147
- Finke et al. (2010) Finke J. D., Razzaque S., Dermer C. D., 2010, ApJ, 712, 238
- Franceschini et al. (2008) Franceschini A., Rodighiero G., Vaccari M., 2008, A&A., 487, 837
- Furniss et al. (2013) Furniss A., et al., 2013, ApJL, 768, L31
- Gao et al. (2013) Gao H., Lei W.-H., Zhang B., 2013, MNRAS, 435, 2520
- Ghisellini & Tavecchio (2008) Ghisellini G., Tavecchio F., 2008, MNRAS, 387, 1669
- Ghisellini et al. (1998) Ghisellini G., Celotti A., Fossati G., Maraschi L., Comastri A., 1998, MNRAS, 301, 451
- Ghisellini et al. (2005) Ghisellini G., Tavecchio F., Chiaberge M., 2005, A&A, 432, 401
- Giannios et al. (2010) Giannios D., Uzdensky D. A., Begelman M. C., 2010, MNRAS, 402, 1649
- Gilmore et al. (2012) Gilmore R. C., Somerville R. S., Primack J. R., Domínguez A., 2012, MNRAS, 422, 3189
- Hauser & Dwek (2001) Hauser M. G., Dwek E., 2001, ARA&A., 39, 249
- Impey & Tapia (1988) Impey C. D., Tapia S., 1988, ApJ, 333, 666
- Keshet & Waxman (2005) Keshet U., Waxman E., 2005, PRL., 94, 111102
- Krawczynski et al. (2004) Krawczynski H., et al., 2004, ApJ, 601, 151
- MAGIC Collaboration et al. (2019) MAGIC Collaboration et al., 2019, MNRAS, 490, 2284
- Mannheim et al. (1991) Mannheim K., Biermann P. L., Kruells W. M., 1991, A&A, 251, 723
- Maraschi et al. (1992) Maraschi L., Ghisellini G., Celotti A., 1992, ApJL, 397, L5
- Mücke et al. (1999) Mücke A., Rachen J. P., Engel R., Protheroe R. J., Stanev T., 1999, PASA., 16, 160
- Mücke et al. (2003) Mücke A., Protheroe R. J., Engel R., Rachen J. P., Stanev T., 2003, Astroparticle Physics, 18, 593
- Murase et al. (2012) Murase K., Dermer C. D., Takami H., Migliori G., 2012, ApJ, 749, 63
- Mücke & Protheroe (2001) Mücke A., Protheroe R., 2001, Astroparticle Physics, 15, 121
- Ong (2009) Ong R. A., 2009, ATel., 2084, 1
- Owen et al. (2018) Owen E. R., Jacobsen I. B., Wu K., Surajbali P., 2018, MNRAS, 481, 666
- Padovani & Giommi (1996) Padovani P., Giommi P., 1996, MNRAS, 279, 526
- Padovani et al. (2017) Padovani P., et al., 2017, A&AR., 25, 2
- Paiano et al. (2017) Paiano S., Landoni M., Falomo R., Treves A., Scarpa R., Righi C., 2017, The Astrophysical Journal, 837, 144
- Prandini et al. (2010) Prandini E., Bonnoli G., Maraschi L., Mariotti M., Tavecchio F., 2010, MNRAS Letters, 405, L76
- Prandini et al. (2011) Prandini E., Bonnoli G., Maraschi L., Mariotti M., Tavecchio F., 2011, Nuovo Cimento C Geophysics Space Physics C, 34, 241
- Rau, A. et al. (2012) Rau, A. et al., 2012, A&A, 538, A26
- Rovero, A. C. et al. (2016) Rovero, A. C. Muriel, H. Donzelli, C. Pichel, A. 2016, A&A, 589, A92
- Sahu (2019) Sahu S., 2019, Rev. Mex. Fis., 65, 307
- Sahu et al. (2012) Sahu S., Zhang B., Fraija N., 2012, Phys. Rev. D, 85, 043012
- Sahu et al. (2016) Sahu S., Miranda L. S., Rajpoot S., 2016, EPJ. C, 76, 127
- Sahu et al. (2019) Sahu S., Fortín C. E. L., Nagataki S., 2019, ApJ, 884, L17
- Sahu et al. (2020) Sahu S., López Fortín C. E., Castañeda Hernández L. H., Nagataki S., Rajpoot S., 2020, ApJ, 901, 132
- Sahu et al. (2021) Sahu S., López Fortín C. E., Valadez Polanco I. A., Rajpoot S., 2021, ApJ, 914, 120
- Sahu et al. (2022) Sahu S., Valadez Polanco I. A., Rajpoot S., 2022, MNRAS, 515, 5235
- Sahu et al. (2023) Sahu S., Medina-Carrillo B., Sánchez-Colón G., Rajpoot S., 2023, MNRAS, 522, 5840
- Saldana-Lopez et al. (2021) Saldana-Lopez A., et al., 2021, MNRAS, 507, 5144
- Sbarufatti et al. (2005) Sbarufatti B., Treves A., Falomo R., 2005, ApJ, 635, 173
- Scarpa & Falomo (1995) Scarpa R., Falomo R., 1995, A&A, 303, 656
- Sikora et al. (1994) Sikora M., Begelman M. C., Rees M. J., 1994, ApJ, 421, 153
- Stecker et al. (1992) Stecker F. W., de Jager O. C., Salamon M. H., 1992, ApJ, 390, L49
- Summerlin & Baring (2012) Summerlin E. J., Baring M. G., 2012, ApJ, 745, 63
- Tavecchio & Ghisellini (2008) Tavecchio F., Ghisellini G., 2008, MNRAS, 385, L98
- Teshima (2009) Teshima M., 2009, ATel., 2098, 1
- Urry & Padovani (1995) Urry C. M., Padovani P., 1995, PASP., 107, 803
- Yang & Wang (2010) Yang J., Wang J., 2010, PASJ, 62, L23
- Zahoor et al. (2022) Zahoor M., Sahayanathan S., Zahir S., Iqbal N., Manzoor A., Bhatt N., 2022, MNRAS, 511, 994