Domain Generalized Recaptured Screen Image Identification Using SWIN Transformer
Abstract
An increasing number of classification approaches have been developed to address the issue of image rebroadcast and recapturing, a standard attack strategy in insurance frauds, face spoofing, and video piracy. However, most of them neglected scale variations and domain generalization scenarios, performing poorly in instances involving domain shifts, typically made worse by inter-domain and cross-domain scale variances. To overcome these issues, we propose a cascaded data augmentation and SWIN transformer domain generalization framework (DAST-DG) in the current research work Initially, we examine the disparity in dataset representation. A feature generator is trained to make authentic images from various domains indistinguishable. This process is then applied to recaptured images, creating a dual adversarial learning setup. Extensive experiments demonstrate that our approach is practical and surpasses state-of-the-art methods across different databases. Our model achieves an accuracy of approximately 82% with a precision of 95% on high-variance datasets.
Index Terms:
Data augmentation, Domain Generalization, Image Forensics, Recaptured Screen Images, Deep Learning, SWIN Transformer.I Introduction
With technological advancement, digital multimedia files can nowadays be simply recorded by cameras and shared over the Web. Tampering, including reacquiring, is an immediate threat to digital image integrity. As a result, for images to act as reliable witnesses, their originality must be thoroughly verified [30, 2]. According to [5, 26], humans have difficulty differentiating between the two classes—i.e., recaptured and original images. Recaptured images can deceive real-world systems, particularly forensic systems, leading to Rebroadcast Image Attacks (RIA). To mitigate such fraud and attacks, it is essential to incorporate detection forensics to identify rebroadcast images. In RIA detection, handcrafted features include wavelet statistical distributions [53, 16, 54], noise analysis, and color and texture non-uniformity [10]. Among all the available RIA detection techniques, texture distribution is considered a reliable solution [28]. Physical artefacts such as specularity, blurriness, and chromaticity are effective differential features. In addition to handcrafted features, some neural network methods [9, 42, 15, 14] are explored to improve classifier performance. Besides, various databases are generated for model training to build a robust classification model, which extracted artefacts from the input images having different domains because of the variance in features, including scale, illumination, and color [43]. Therefore, the domain generalization of the datasets is a practical challenge in RIA tasks. Till now, most of the proposed frameworks achieve good performance for single-domain scenarios. Thus, as illustrated in Fig. 1, a cross-domain recaptured image detection task is presented to gain an understanding of a shared feature space for classifying intra, inter and cross-domain scale variances. Domain Generalization (DG) techniques offer direct solutions for this problem.
I-A Motivation
The existing recaptured image detection techniques mainly fall under two main categories: machine learning and deep learning. Both approaches identify characteristic features without the requirement for additional information embedding. For case in point, a questioned digital image can go through scrutinizing for inherent artefacts for tampering detection. However, the existing techniques lack robustness against all available datasets. After the acquisition procedure, the LCD recaptured image goes through an outright image acquisition chain with or without minimal or post-processing (tampering). The existing tampering detection techniques consider this image as an original copy. However, most existing recapture detection schemes focus on a single dataset. This paper focuses on the domain generalization problem for digital image datasets recaptured through camera-screen communication.
I-B Major Contributions
Before proposing the authentication technique for recaptured detection, we want to emphasize some significant points and the key contributions of the proposed work:
-
•
First, the features of dataset images are extracted by the SWIN transformer. The loss between the original and predicted labels is calculated using the traditional binary cross entropy.
-
•
The proposed model integrates the global and local feature maps using the SWIN transformer architecture.
-
•
To evaluate the effectiveness of our proposed approach, we tested our model for intra, inter, and cross-database examination using a combination of three databases.
-
•
We consider various experiment settings, including deep learning models, loss functions, and training and testing datasets.
-
•
Experimental results show that the proposed scheme with SWIN transformer with softmax activation function and cross-entropy loss outperformed other approaches. Specifically, under the most challenging scenario of cross-domain experiment, i.e., evaluation across different types of images produced by different devices and environmental settings, the proposed neural network has achieved an accuracy rate of around 86%.
I-C Paper Organization
After a comprehensive review of related works in Section II, Section III delineates the the definition of domain generalization and SWIN transformer. Section IV provides the detail of the model used in our research, providing an in-depth description of the experiments conducted with distinct models, elaborating on their architecture and configurations. In Section V, we rigorously evaluate the models using specific performance metrics, presenting a detailed analysis of their results. Finally, Section VI concludes the paper by summarizing the key findings and outlining potential avenues for future research in this domain.
II Related Work
This section provides a concise overview of recent advancements in recaptured image detection and related work. Numerous existing methods rely on prior knowledge of artefacts in reacquired images, utilizing this information to classify images based on these identified artefacts. researchers proposed numerous methods for near-duplicate image detection considering a variety of artefact types. Table I summarizes those methods for near-duplicate image detection based on extracted artefacts, providing insights into the techniques employed by different authors in this field.
| Artefact Type | Methods | Key Findings/Results | Limitations/Challenges | References |
| Aliasing II-A | - Multi-LBP, Multi-scale Wavelet-statistical features |
- Extraction of aliasing, loss of detail, and color distortion
- Achieved accuracies up to 98.95% |
- Difficulty in removal post-processing
- Limited effectiveness if used alone |
[5, 37, 34, 26] |
| Blurriness II-B |
- Block and blurriness effects from JPEG compression
- Wavelet decomposition |
- Extraction of blur characteristics
- Achieved accuracies up to 98.58% |
- Limited applicability to JPEG format images | [42, 21, 24, 2, 30] |
| Noise II-C |
- Features based on noise and double JPEG compression
- Periodic patterns from LCD monitors |
- Detection of noise characteristics
- Techniques for noise reduction and classification |
- Not rotationally invariant | [49, 15, 14, 45] |
| Contrast/Color/Texture Non-Uniformity II-D |
- Tone response function adjustments
- Texture feature extraction using methods like Local Binary Pattern (LBP) descriptor |
- Correction of contrast and color balance errors
- Texture feature extraction for classification |
- Reliability of color moment extraction | [15, 33, 16, 9, 17, 24, 51, 3, 10, 53, 16, 54] |
| Deep Learning II-E |
- CNN models with pre-processing layers
- Utilization of learned filters instead of pre-defined kernels |
- Automatic feature extraction from original and recaptured images
- Improved detection accuracy |
- Computational complexity | [32, 48, 19, 8, 52, 59, 25, 29] |
The detailed description of the artefacts (in Table I) is provided in the following subsections.
II-A Aliasing Artefacts
The aliasing artefacts, commonly referred to as colour moiré [36], pose challenges in post-processing but can be mitigated with proper setup during recapturing [42]. The frequency response of recaptured images, typically contains more high-frequency components than original images, primarily due to additional noise. As a result, aliasing and loss-of-detail effects are more pronounced in recaptured images.
II-B Blurriness Artefacts
An authentic image captures a diverse range of colours and edges with varying levels of contrast and sharpness. However, when the same scene is recaptured with a digital device, inherent blurring inevitably occurs. This blurriness persists despite correct focusing by the acquisition device, primarily due to imperfections in the capturing lens, including spherical aberration leading to the barrel and pincushion distortion [44]. Additionally, blur distortion can be introduced by the camera acquisition pipeline, resulting in unique blur characteristics for each camera [42].
II-C Noise Artefacts
The noise distribution in recaptured media is influenced by factors such as the characteristics of the recaptured camera, the brightness setting of the imitating medium, and surrounding conditions. While the noise characteristic of the camera can accurately identify the source camera, its limitation lies in its lack of rotational invariance.
II-D Contrast, Colour and Texture Non-Uniformity Artefacts
Modern digital cameras, LCD screens, and projector devices adhere to the sRGB colour encoding standard. Digital cameras typically apply a tone response function during pre-processing, deviating slightly from the standard sRGB response to produce visually pleasing images with slightly higher contrast. However, in screen-camera communication processes, the resulting media includes the tone response functions of both the camera and the screen, leading to higher overall contrast than single captures. Colour-related artefacts in recaptured media may include errors in colour balance, such as tints introduced during recapture from projectors or LCD screens and increased colour saturation. Authors often incorporate colour moments and contrast features in their training methodologies [15, 33, 16, 9, 17]. However, the reliable extraction of colour moments depends on the analysed content. Additionally, some authors have utilized specularity distribution as another feature for colour classification [24, 51, 3, 10]. Physical-based features for recapture detection, as explored in [10], revealed that colour histogram and contrast were the most effective features, while specularity and blurriness were less convincing. Texture features have proven to be effective characteristics for recaptured media [50, 53, 16, 54], with the LBP descriptor and its variants being particularly promising for texture information extraction.
II-E Automatic Extracted Artefacts
The increasing popularity of deep learning networks and their excellent detection accuracy in computer vision enable researchers to explore this technique for recognition and classification problems [32].
Table II provides a clear comparison and analysis of the features and model used for classification work of the existing recaptured image detection approaches. Additionally, the shortcomings of state-of-the-art methods are discussed.
| Year (citation) | Artefacts (Features) | Classifier Model | Shortcomings |
|---|---|---|---|
| 2008 [51] | Probability distribution, dithering patterns | Physical modeling of a recapturing process | The model performance is not good in planar surfaces in generic scenes. |
| 2010 [10] | Colour distortions | Statistics-based features, chromaticity covariance matrix | Degradation process directly by the application of mathematical models. |
| 2010 [5] | Aliasing-like distortions’ colour distortion, blurriness | Blurriness, texture, noise, and colour features | The network performance is not good enough. |
| 2013 [15] | Texture, colour noise, difference histogram | Histogram of image local difference, colour moments | Feature extraction becomes more and more cumbersome. |
| 2013 [34] | Noise residual features | Used 2DFT of noise residual and theory of cyclostationarity | This method works only for aliasing-free image datasets. |
| 2013 [53] | Texture features | Based on texture features | only single feature is considered. |
| 2015 [26] | aliasing distortion | Used 2DFT of noise residual and theory of cyclostationarity | Images with dark content create detection challenge. |
| 2015 [42] | aliasing and blurriness | Dictionary approximation error of edge profiles | Performance is degrading with Kodak camera images. |
| 2015 [35] | color distortions | Features of colour moments and DCT coefficients | This method is only effective for JPEG images that are compressed images. |
| 2016 [48] | Extract features from dataset using a CNN | Used CNN algorithm | color information not used. |
| 2016 [38] | Texture, HSV colour, and blurriness | Used SVM classifier | Only used images taken by back-facing camera. |
| 2017 [47] | Quality-aware feature and histogram feature | Compression artefacts have been used | This method only works for JPEG compressed images. |
| 2017 [8] | Extract features from dataset using a CNN | CNN-based approach | Proposed network use only fewer convolutional layers. |
| 2017 [19] | Aliasing distortion and noise artefacts | Convolution and recurrent neural network-based | Large fully connected layers increase the model complexity. |
| 2018 [41] | Wavelet characteristics and noise characteristics | Mean value, variance, and skewness, extract noise image using LBP | The images have not been tested on different image formats. |
| 2018 [58] | Structure distortions | Enhanced residual-based correlation coefficients | Only work for JPEG compressed images. |
| 2019 [60] | LBP-coded maps | LBP features | Fixed filter layer at the input may ignore some useful information. |
| 2020 [2] | images edge profile | An image’s edge profile can be used to determine its structural level | Only consider edge profile and proposed method cannot identify images obtain from different media. |
| 2020 [52] | Aliasing distortion | AMNet with additive and multiplicative modules | The dataset consist of only LCD and mobile screenshots images. |
| 2021 [56] | Extracting local and global features using CNN | CFMs saliency maps | lack of transfer learning and supervised classification model. |
| 2021 [46] | Texture and Reflectance Characteristics | convolutional neural network | only for certificate document. |
| 2021 [55] | textual and background information | TENet | tamper localization of the forgery of texts is remained to be investigated. |
| 2021 [25] | scale alignment domain generalization framework (SADG) | CNN | scale variances and domain shift problems addressed. |
| 2021 [27] | Statistical texture features | SVM classifier | benchmark results not good |
| 2022 [57] | normalized LTC (local ternary count) histograms of residual maps | SVM classifier | design more optimal residual maps and the luminance and color artefacts study. |
| 2022 [7] | spatial and spectral distortion models | CNN model | only for printing and scanning process and prior knowledge of the printer model is required. |
| 2022 [59] | (LTC) of high order prediction error | SVM classifier | prediction error maps calculation strategies not optimal. |
| 2022 [31] | Edge, wavelet and artefact transform | Feature Disentanglement and Dynamic Fusion (FDDF) model | tested on Large-scale Real-scene Universal Recapture (RUR) dataset proposed by them. |
| 2022 [6] | Siamese network | network with ResNeXt101 backbone | results good for only few-shot fine-tuning document types. |
| 2022 [61] | correlations between color channels | constrained convolutional neural network | attention mechanism module missing. |
| 2022 [23] | intensity and gradient information | generalized central difference convolution (GCDC) network | improvement scope in fusion strategy and attention module. |
| 2022 [30] | Edge Histogram Descriptors | SVM Classifier | Tested only on LCD recaptured images. |
| 2022 [29] | Wavelet transform (DDD-DWT), CNN | SVM Classifier | Tested only on LCD recaptured images. |
| 2023 [18] | combines local-feature and global-feature extraction modules | convolutional neural network (CNN) and vision transformer (ViT) | does not work well for the detailed images, such as small-scale image features. |
| 2023 [20] | frequency filter bank and multi-scale cross-attention fusion module | two-branch deep neural network | Limited data generalization and computationally complex. |
III preliminary
In this section we will explain the definition of domain and domain generalization followed by the SWIN Transformer.
Domain: Let and denotes a nonempty input and output space, respectively. A domain is compose of data that are sampled from a distribution, where denoting the features and label, respectively. denotes the input sample features and output label joint distribution with and as random variables.
Domain Generalization (DG): We are given source domains (or training datasets), where denoting the domain. The joint distributions between each pair of datasets are different, i.e., . The objective of domain generalization is to learn a robust and generalized predictive model from the training datasets to achieve a minimum prediction error on an unknown test dataset as given by the Eq. 1:
| (1) |
where is the error and is the loss function and . In our research, we have evaluated loss using Binary Cross Entropy (BCE) function. The loss function is defined in Eq. 2.
| (2) |
where is the estimated probability value and is the true value of original image class () and recaptured image class (), respectively with numbers of sample images in respective classes.
Some researchers have designed the DG techniques for face-antispoofing problems, such as MADDG [39] and SSDG [13]. However, these techniques are highly customized and thus not applicable to the LCD recaptured images detection problem. The process of image reacquisition can involve various cameras and imitating LCD sources with different specifications, resulting in features that may cluster in feature space but across different domains.
Keeping the aforementioned in mind, we propose a data augmention with SWIN transformer based domain generalization framework (DAST-DG), as illustrated in Fig. 2. Specifically, a new testing dataset is designed from data augmentation techniques along with complex CutMix and CutOut techniques to generate more challenging datasets. The feature extraction and classification model is based on the concept of SWIN transformer. A feature generator is trained to compete with a domain discriminator to make the characteristic artefacts of original images from different domains indifferent. This will ensure that the recaptured images from other domains are separated and the original photos of all the domains are aggregated. As a result, different feature attributes can be grouped, leading to better-generalized class labelling.
IV Proposed Methodology
The proposed SWIN transformer architecture used in the research, exemplified in Figure 3, is a hierarchical vision Transformer designed for various vision tasks. The architecture employs several innovative techniques to process and transform input data efficiently.
The SWIN Transformer first divides an input image into non-overlapping segments using a patch-splitting module (refer fig. 4), similar to the Vision Transformer (ViT). Each patch is treated as a segmentation, and its features are concatenated through the different layers in the network. For example, given a patch size of , the feature dimension of each segment will be . A linear embedding layer then projects these raw features into an arbitrary dimension .
IV-A Stage 1: Initial Embedding and Transformation
Several transformer blocks, modified to include SWIN transformer blocks with shifted window-based self-attention module (SW-MSA), applied to these patch feature map segmentations. The initial embedding maintains the number of segmentation is denoted as . This stage is referred to as Stage 1 as shown in fig. 3.
IV-B Stage 2: Hierarchical Representation
The hierarchical representation is achieved by reducing the segmentations by patch-merging layers as the network deepens. The first patch-merging layer concatenates the features of each group of neighboring segments and applies a linear layer to the 4C-dimensional concatenated feature maps. This helps reduce the number of segmentations by a factor of a quartet, achieving downsampling the resolution to . The output dimension is set to . Following this, the transformer blocks are applied to the feature maps while keeping the resolution at .
IV-C Stages 3 and 4: Further Hierarchical Representation
The procedure is repeated for Stage 3 and Stage 4, with output resolutions of and , respectively. Each stage progressively reduces the number of segmented feature maps and increases the feature dimension, producing a hierarchical representation akin to traditional convolutional networks like VGG and ResNet and vision transformer.
IV-D Transformer Block
A SWIN transformer block replaces the standard multi-head self-attention (MSA) module with a shifted window-based MSA module (SW-MSA) blocks in the network stages. For more detail refer to paper by Ze Liu et al. [22]. Each SWIN transformer block includes the following components (refer fig. 5:
-
•
Shifted window-based MSA module (SW-MSA).
-
•
A two-layer multilayer perceptron (MLP) with Gaussian Error Linear Unit (GELU) function.
-
•
Normalization layers (LN) applied before each MSA and MLP components.
-
•
Residual connections are applied after each module.
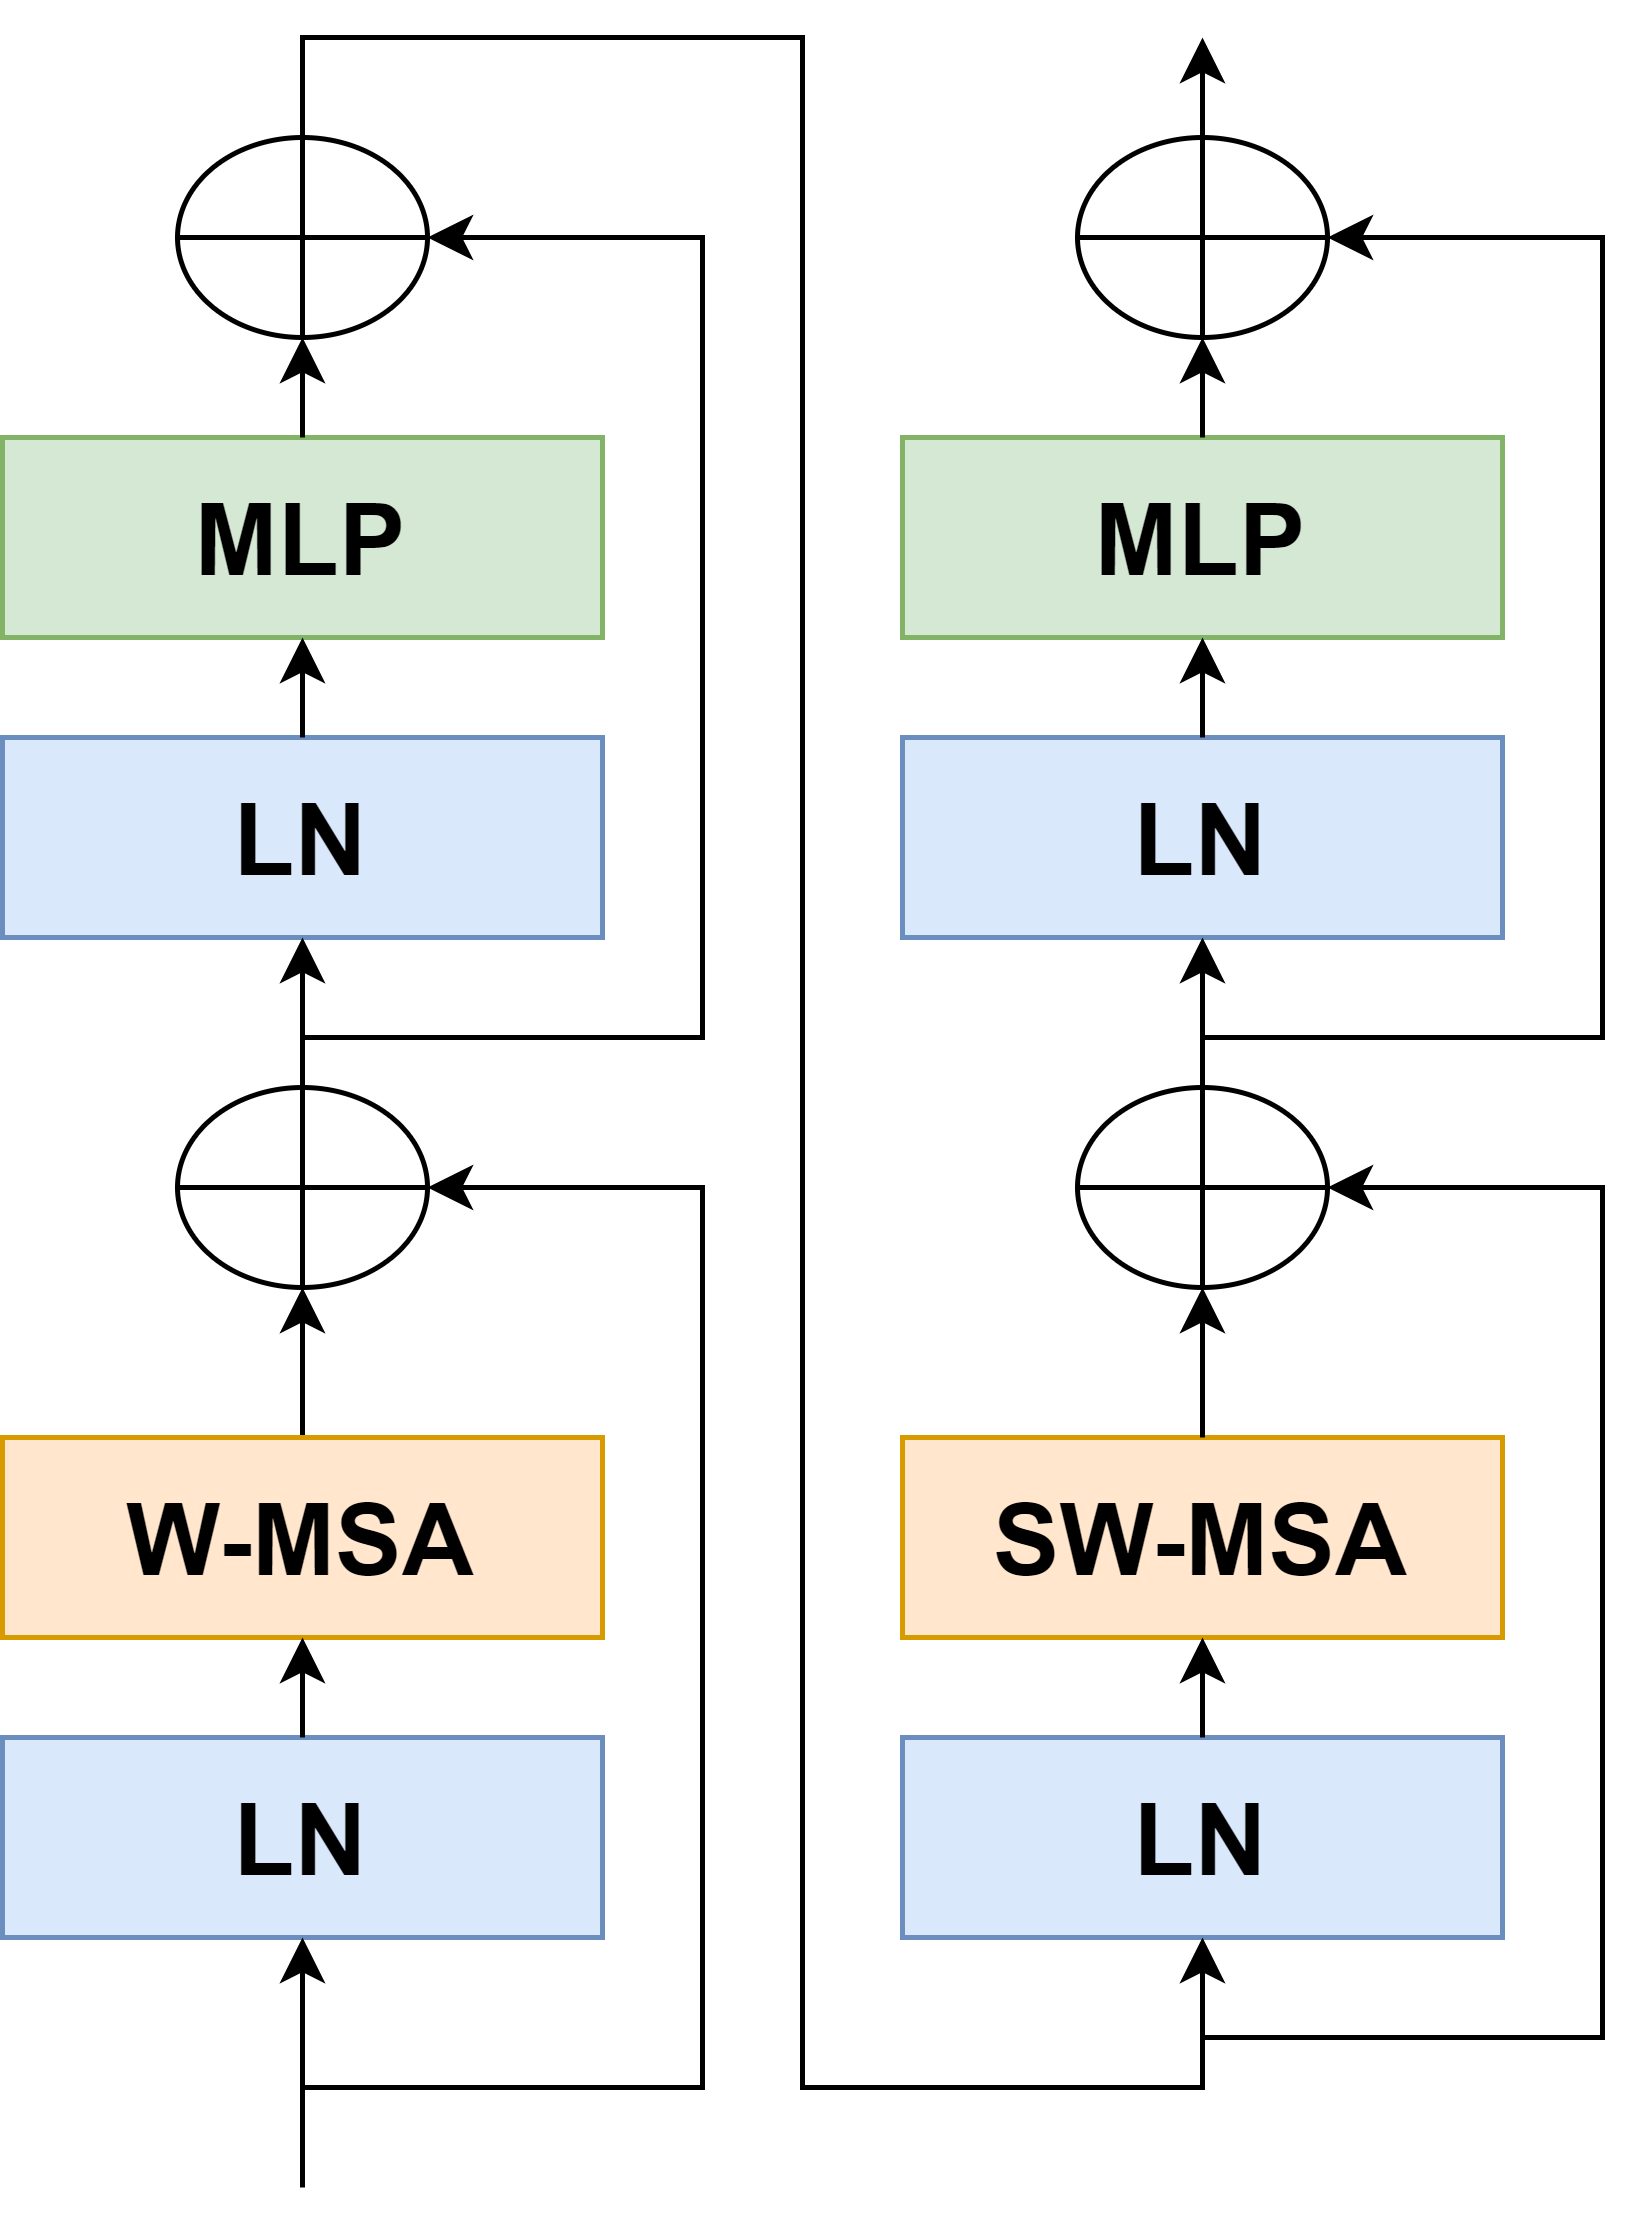
For the SW-MSA, considering an input feature map dimensions . The attention operation within a segmentation can be formulated by Eq 3.
| (3) |
where, and are the query, key and the value matrices, respectively. The dimension of key is . The output of each SWIN transformer block can be expressed by the Eq. 4.
| (4) |
IV-E Classifier and Loss Functions
Suppose we have domains and there are two categories in each domain, i.e., output label having value 0/1 representing recaptured/original images. Our objective is to generalize from to unseen target domain . The features are generated by the SWIN transformer, for the input images (original and recaptured). To optimize the domain feature generated maps in the backpropagation step, gradient calculation of loss functions (refer sec III) are evaluated at the last layer of the network. The classification is done using SoftMax activation function.
V Datasets and Experiment Results
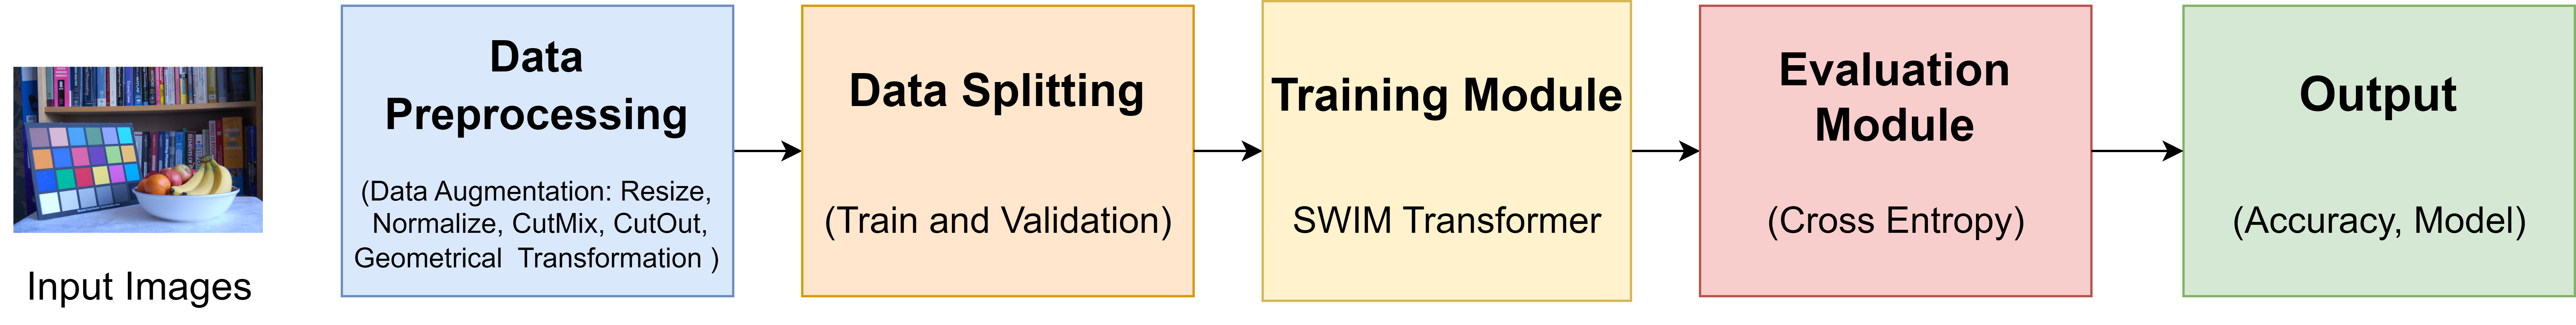
The block diagram in Fig. 6 illustrates the steps involved in accurately classifying the input image as a recaptured image. Initially, the input data undergoes preprocessing to eliminate noise caused by varying resolutions and lighting conditions. Subsequently, the dataset is partitioned into training and testing sets. The data is trained using the SWIN Transformer. Finally, the performance of the model is evaluated considering metrics like accuracy, precision, recall, F1 score, confusion matrix and so on.
V-A Datasets
For several reasons, standard datasets are essential in various research fields, particularly in computer vision and machine learning. They provide a common ground for benchmarking and comparing the performance of algorithms, ensuring fair evaluations and reproducibility of research. These datasets contribute to algorithm development and testing, enabling researchers to assess their methods under consistent conditions. Moreover, standard datasets play a vital role in education, providing students with hands-on experience and ethical considerations by ensuring algorithms are tested on diverse and representative datasets. The three publicly available datasets [4, 42, 1] are present for the LCD recapture image attacks detection. Summarization of the LCD displayed recaptured images from the three datasets (refer to Table III-IV).
| Dataset Name | Camera 1 | Imitating Medium | Camera 2 | ||
| Model | Resolution | Model | Resolution | ||
| NTU-ROSE111http://rose1.ntu.edu.sg/datasets/recapturedImages.asp | - Canon (10D, 400D) | - 22721704 pixels | LCD Screens | - Canon Powershot | - 22721704 pixels |
| - Casio | - 42562832 pixels | - Philips 19” 190B6CG | - Olympus Mju | - 42562832 pixels | |
| - Lunix (D1) | - NEC 17” AccuSync | - Oylmpus E500 | |||
| - Nikon (D70, S210) | - Acer 17” AL712 | ||||
| - Sony (Alpha) | |||||
| ICL222http://www.commsp.ee.ic.ac.uk/ pld/research/Rewind/Recapture/ | - Kodak (V550 S and B, V610) | - 5MP to 20MP | LCD Screens | - 5MP to 24MP | |
| - Nikon (D40, D70) | - NEC MultiSync IPS | - Nikon (D3200, D70) | |||
| - Panasonic (TZ7) | EA232WMi 23” | - Panasonic (TZ7, TZ10) | |||
| - Canon (600D) | - Canon (60D, 600D) | ||||
| - Olympus (E-PM2) | - Olympus (E-PM2) | ||||
| - Sony (RX100) | - Sony (RX100) | ||||
| Mturk333https://agarwalshruti15.github.io/ | - Apple Iphone | 5MP to 20 MP | LCD Screens | - Nikon | - 5MP to 20 MP |
| - Canon | - Samsung | ||||
| - Casio | Scanners | - Fujifilm | |||
| - Fujifilm | - Apple Iphone | ||||
| - Kodak | Printers | - Canon | |||
| - Leica | - Sony | ||||
| - Parasonic | Screengrab | - Panasonic | |||
| - Nikon | - HTC | ||||
| - Samsung | - Kotak | ||||
| Attributes | NTU-ROSE Dataset[4] | ICL Dataset[42] | Mturk Dataset[1] |
| Year | 2010 | 2015 | 2018 |
| Number of Original Images | 2710 | 900 | 3956 |
| Number of Recaptured Images | 2776 | 1400 | 3873 |
| LCD Screen Count | 3 | 1 | 129 |
| Original Camera Quantity | 5 | 8 | 1036 |
| Reacquisition Camera Quantity | 3 | 9 | 119 |
| Alias-Free Status | No | Yes | No |
| Presence of Tampered Content | Yes | No | No |
| Original Image Format | JPEG | JPEG | JPEG |
| Recaptured Image Format | JPEG | PNG | PNG |
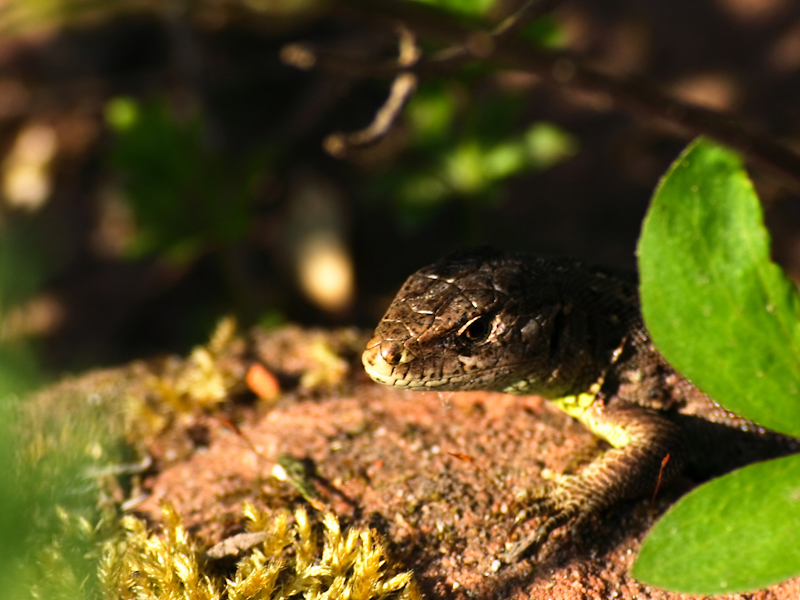
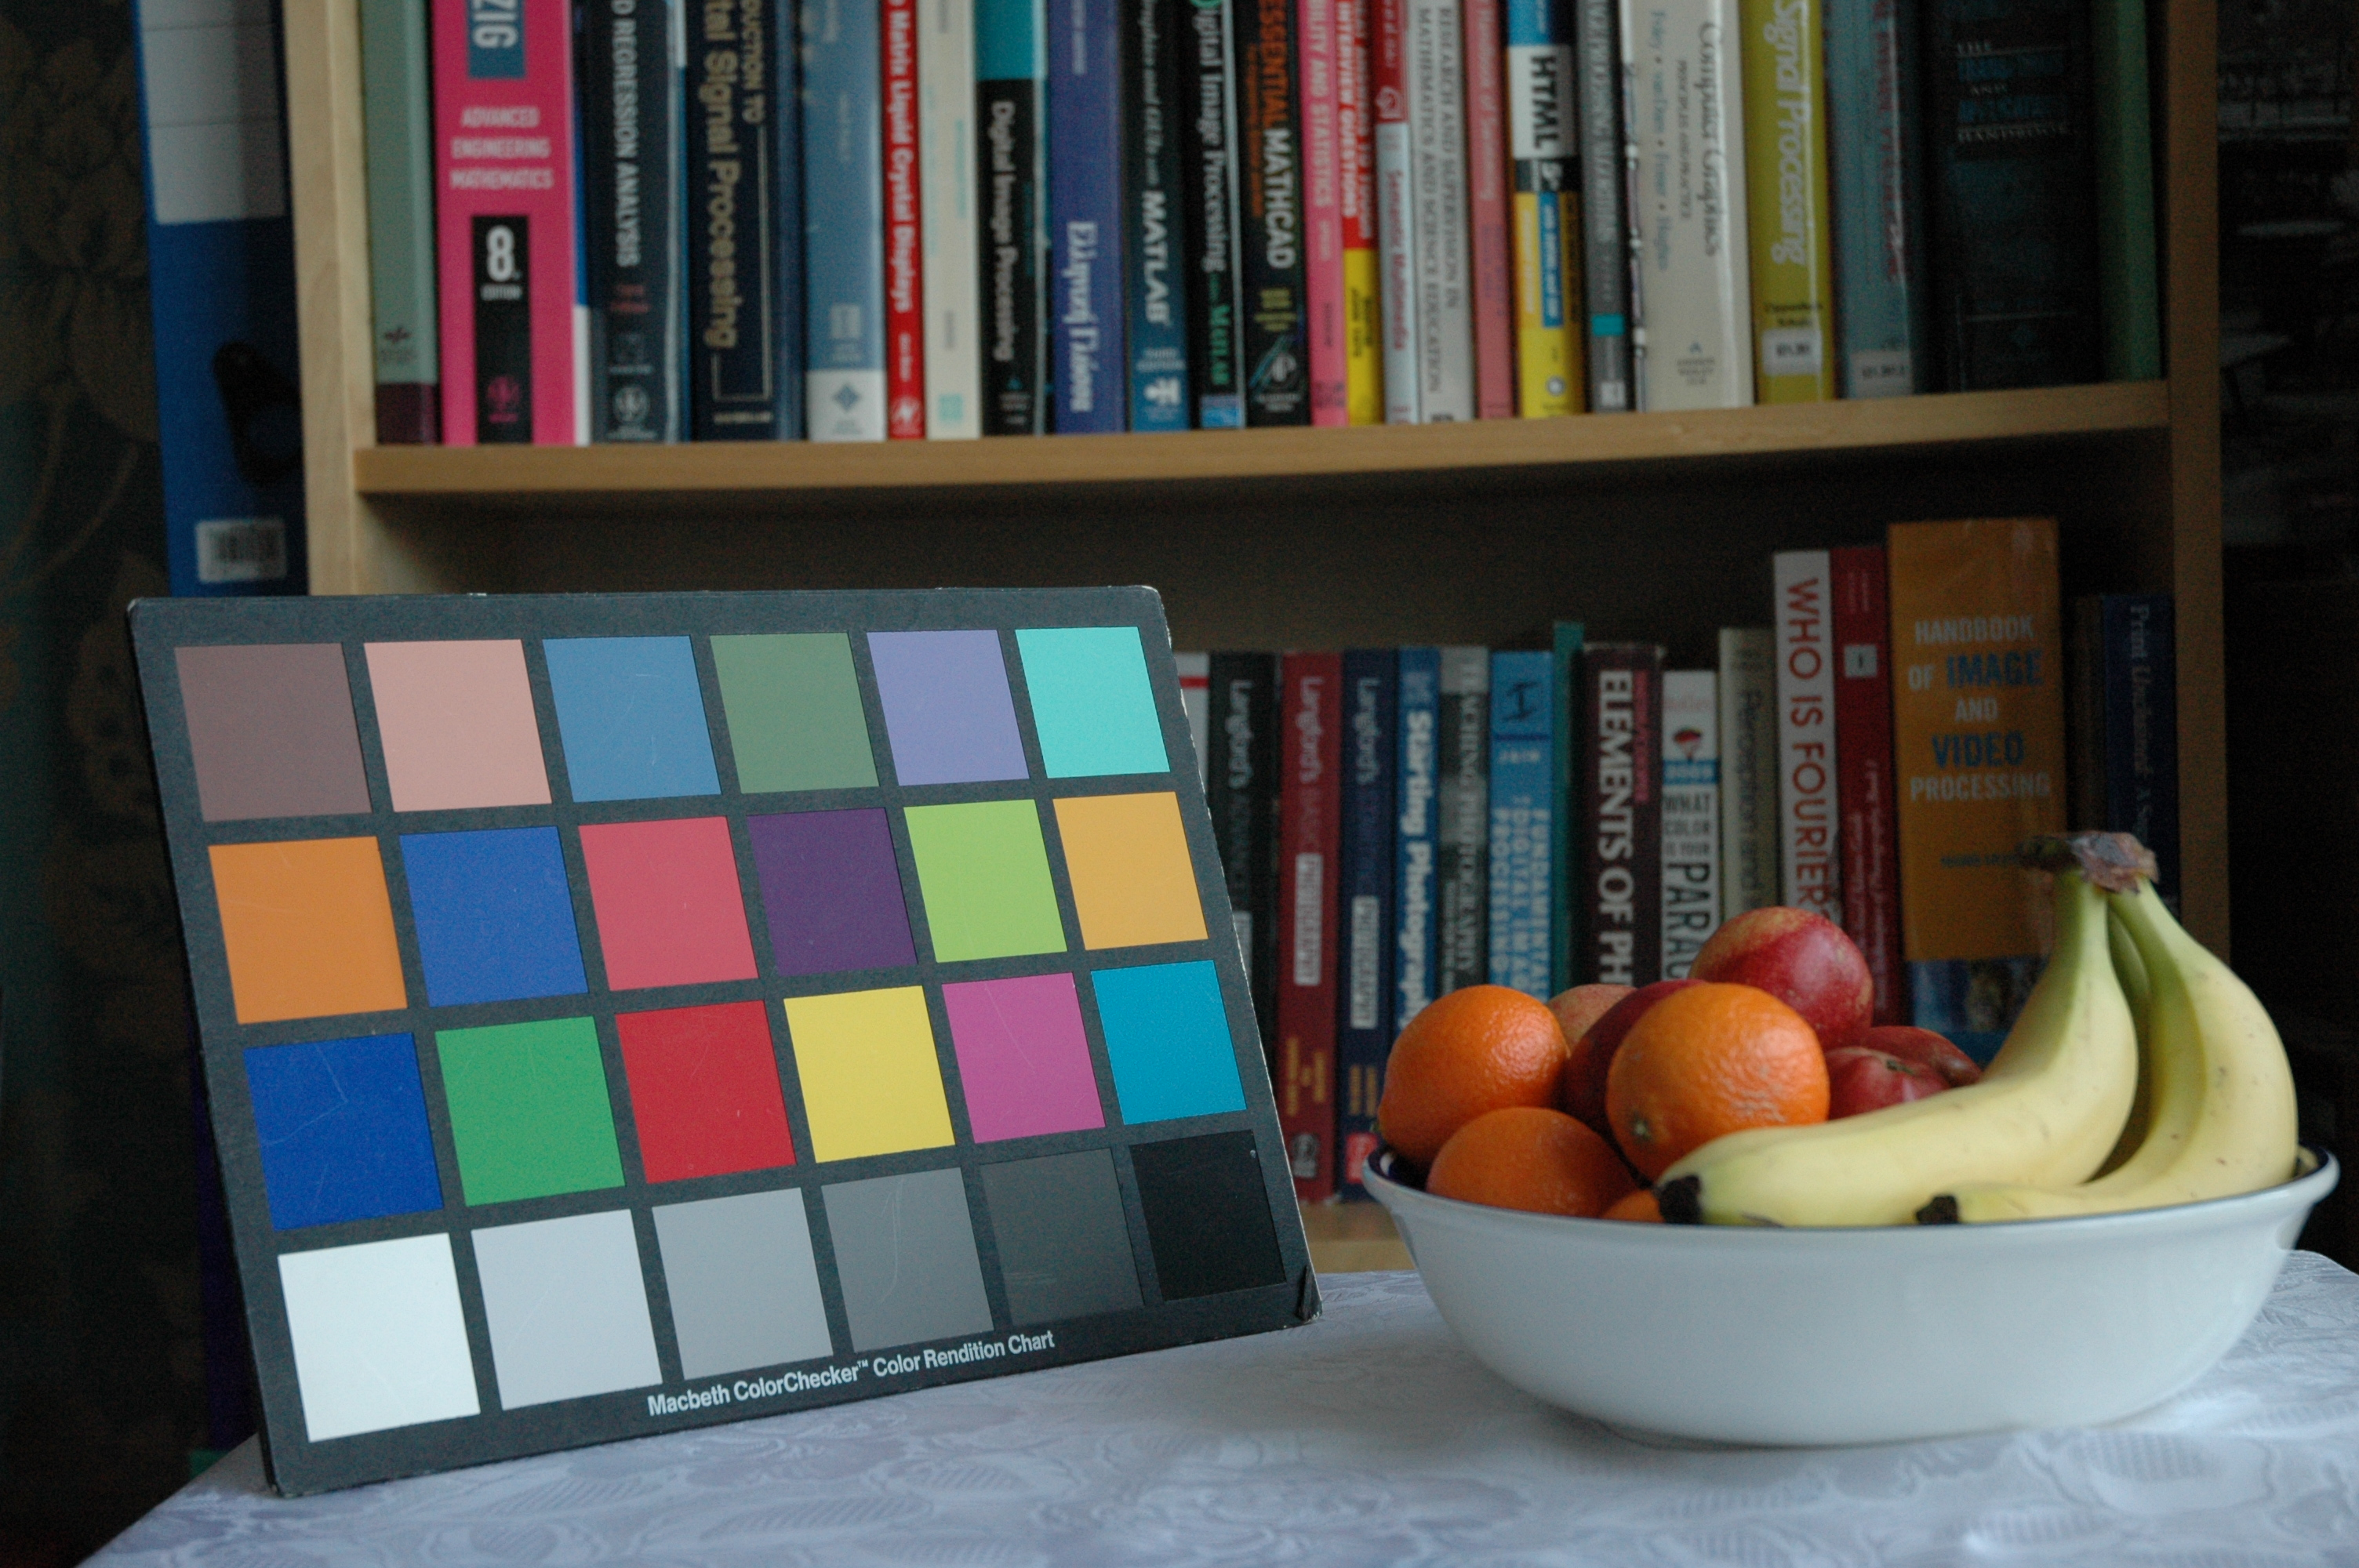

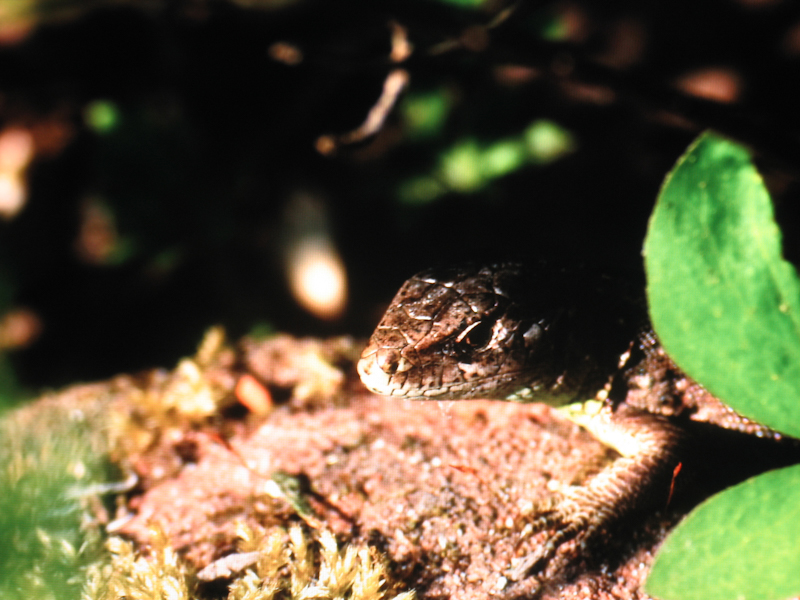

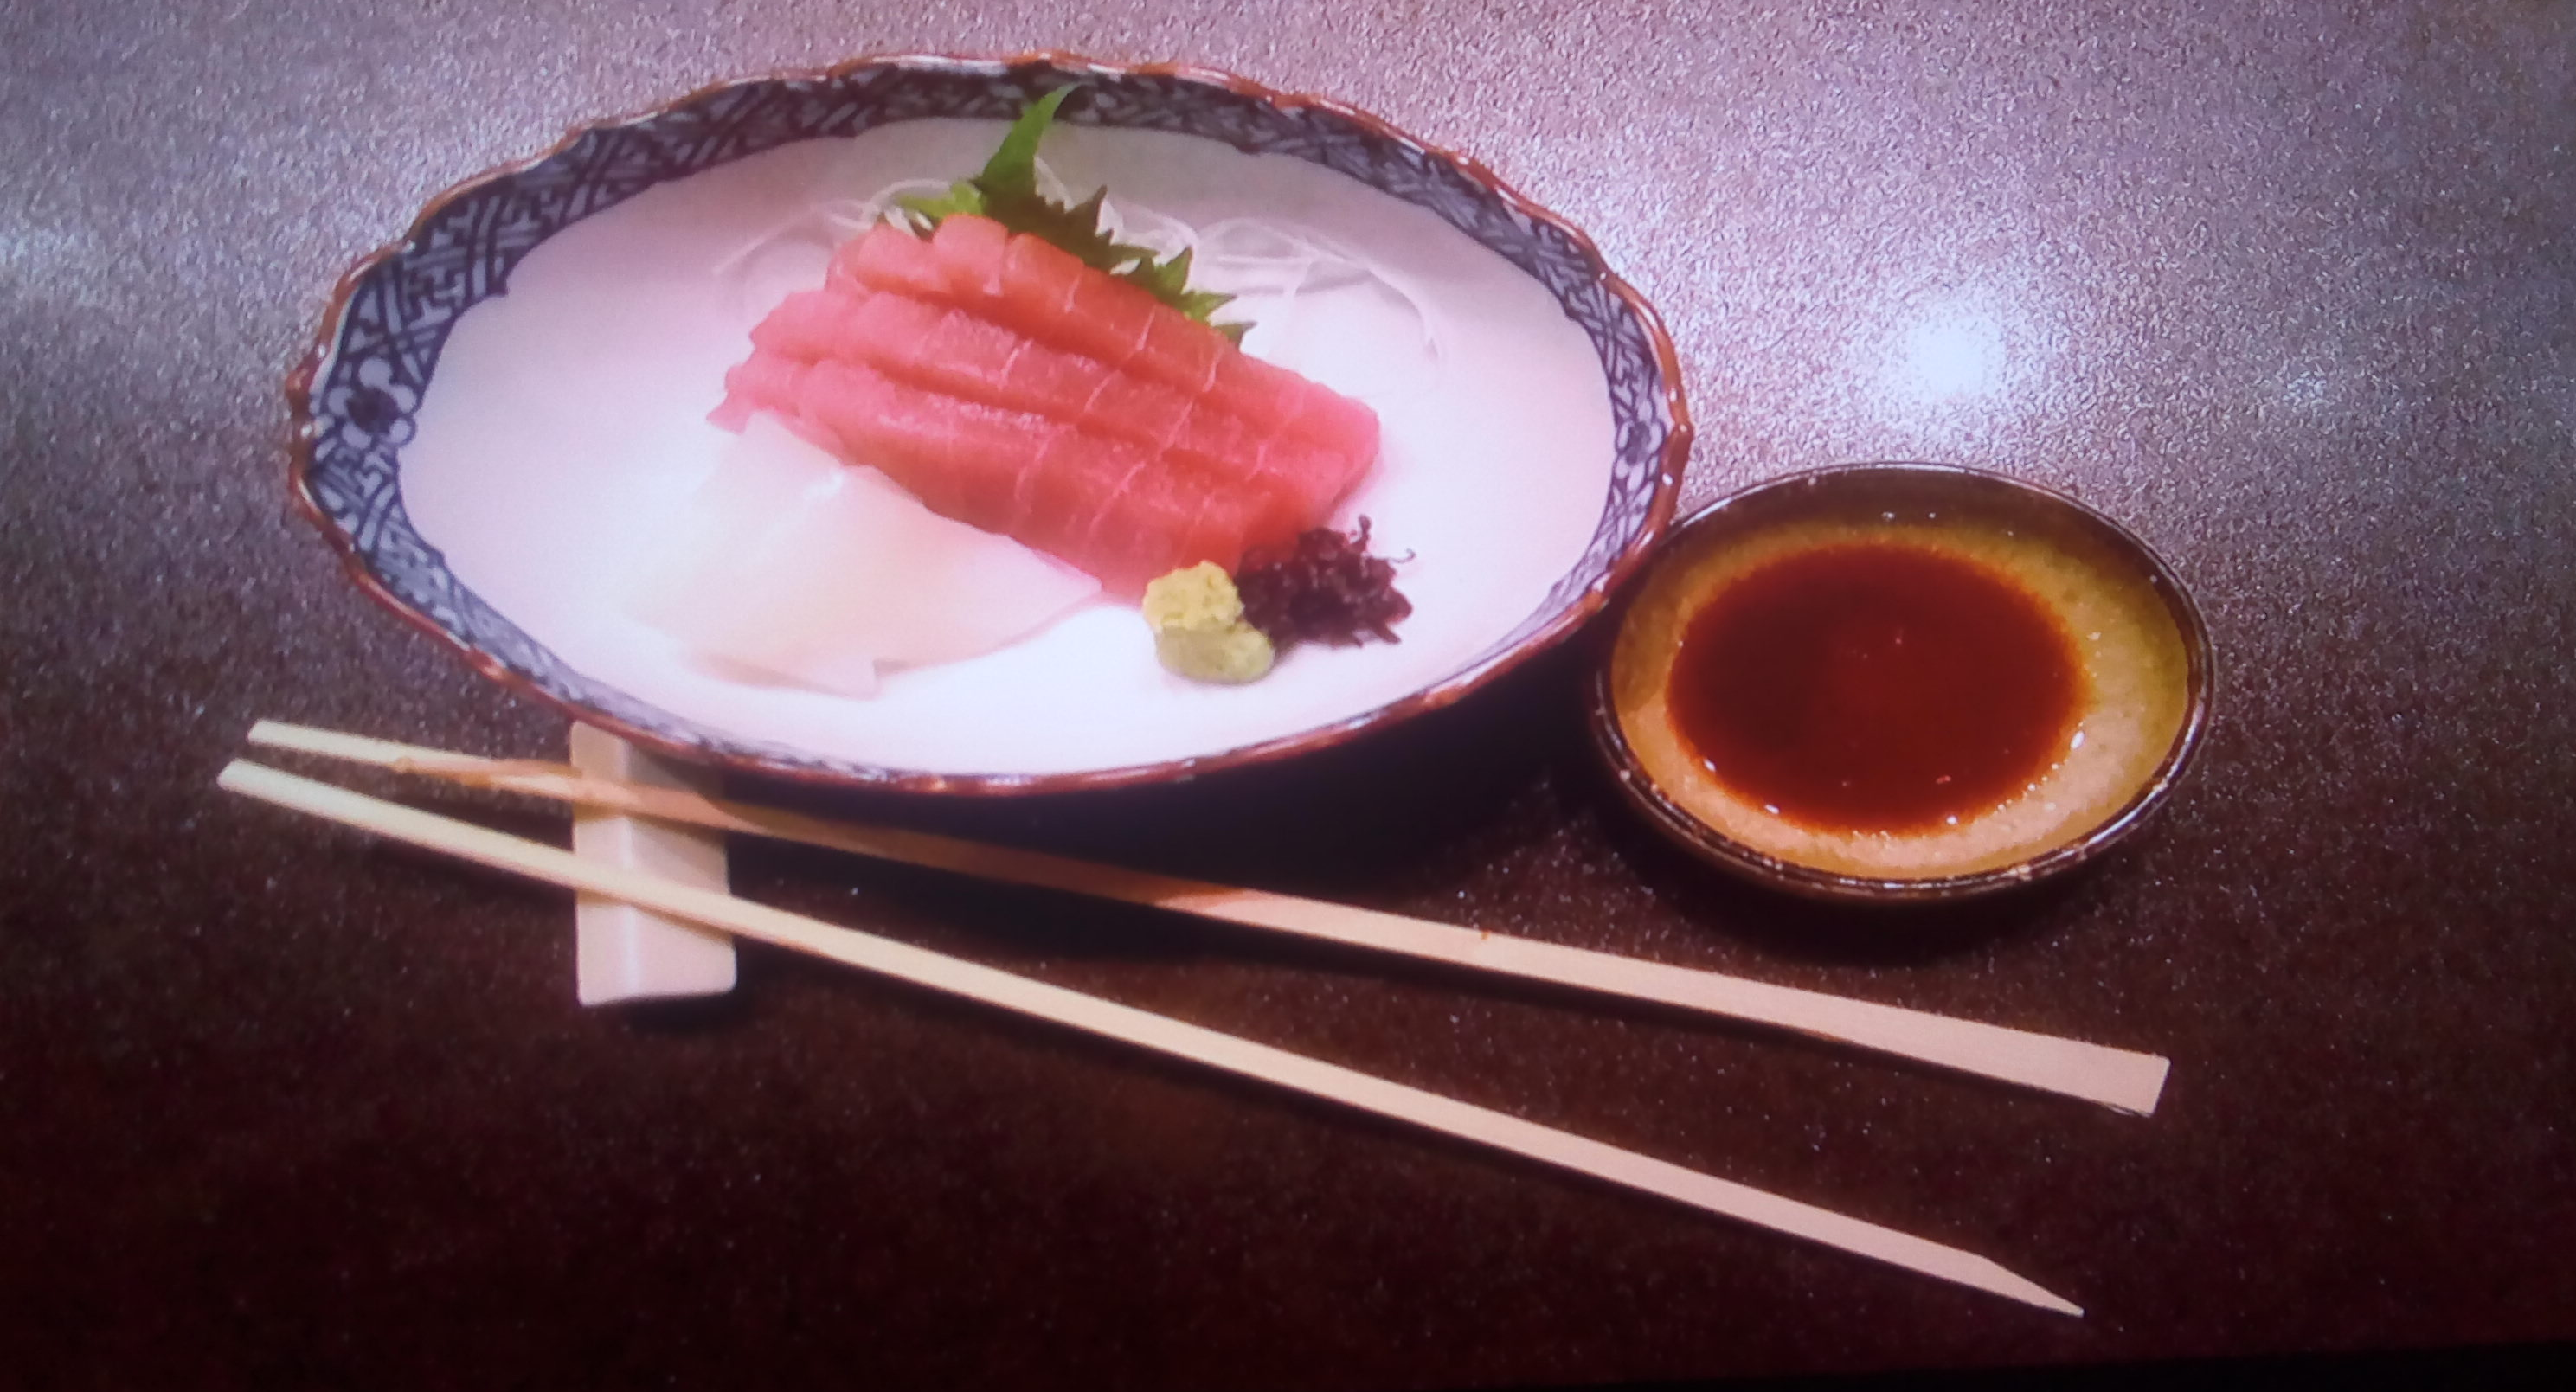
Examples from the NTU-ROSE, ICL and Mturk datasets are illustrated in Fig. 7. It can be observed by comparing both classes of images from different datasets that the recapturing process introduces artefacts such as noise, blurring and color distortion. To show the variations in the resultant features embedding among the three datasets sampled images for the two classes, we have ploted the two dimension t-SNE visualization plot (refer fig. 8).
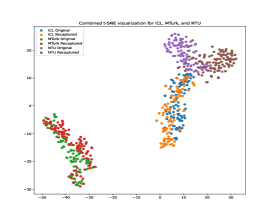
There are a few critical points to be noted. The red and green dots represent the features extracted from the recaptured and original images from the D3 dataset. The brown and purple dots represent the D1 dataset features, and the orange and blue dots represent the D2 dataset images. First observation, the captured and recaptured samples from D1 and D2 are clustered together. However, they are collected by two sets of different devices and different capturing environments but have high-resolution images. It demonstrates the difficulty in the generalization performance of the proposed deep model using these images for training and testing it for the D3 dataset because of the difference between the training and testing features. Second, most of the samples from D3 are found to be in a single cluster. This indicates that the proposed scheme acceptably distinguishes between D3 and D1/D2 images. Third, this follows for both classes of images from all three datasets.
V-B Experimention Settings and Hyperparameters
In experimental setup, we employ our DAST network to extract features. The parameters of each module in a network are explained in the subsection IV. We have made our code publicly available on Github URL. Adam optimizer is used to automatically adjust the learning rate and fine-tune our model for 10 epochs. In addition, our model is implemented in PyTorch, running on a Dell inspiron 5502 with CPU processor i5 and RAM of 16GB. The details of hyperparameters is mentioned in table V. The evaluation parameters used are accuracy, precision, recall values and AUC (Area Under the receiver operating characteristic Curve) plots for the testing datasets. The value of AUC provides the area under the ROC curve. The higher value indicates a better authentication performance for the recaptured image classification. Also, we have the accuracy and loss plots generated for 10 epochs showing the training and validation results.
| Hyperparameters | Values |
|---|---|
| Learning Rate | 0.0001 |
| Optimizer | Adam |
| Loss functions | Cross Entropy |
| Batch Size | 32 |
| Input Image Size | 2242243 |
| Normalized Mean | [0.485, 0.456, 0.406] |
| Normalized Std | [0.229, 0.224, 0.225] |
V-C Experimental Results and Discussion
To investigate the challenges posed by LCD recaptured images, we compare the performances of the proposed technique with some state-of-the-art methods on the three databases under different experimental settings. The table VI shows the testing and training datasets combinations.
| Experiment Type | Training Datasets | Testing Datasets |
|---|---|---|
| Intra-Domain | D1 | D1 |
| D2 | D2 | |
| D3 | D3 | |
| Inter-Domain | D1+D2+D3 | D1+D2+D3 |
| Cross-Domain | D1+D2 | D3 |
| D2+D3 | D1 | |
| D3+D1 | D2 |
V-C1 Intra and Inter-Domain Results
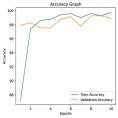
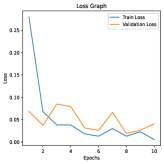
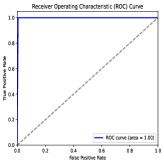
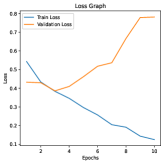
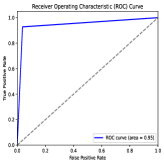
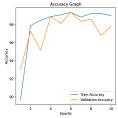
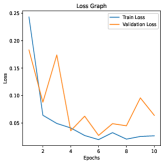
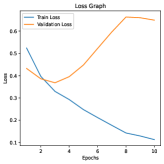
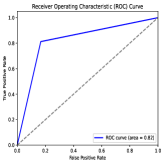
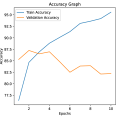
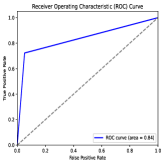
The training and testing images are from the same dataset acquired by the different devices but under the same environmental conditions. Also, the training and testing datasets have additional sample images from data augmentation. The data augmentation helps generalize the model and avoids the over-fitting issue. The loss function used is cross-entropy with a softmax classifier. For the intra-database experiment, the results show that the AUCs of our proposed model are 99.77%, 99.65%, and 94.53% for datasets I, II, and III, respectively. For the inter-domain experiment, the AUCs is 81.84%. The AUC value is dropped for the inter-domain compared to the intra-domain testing (refer table VII). The training and validation accuracy, loss, and ROC curves for ten epochs are shown in Fig. 9. Also, from the t-SNE, we can observe that the D1 dataset has distinguished features for the original and recaptured classes, but the remaining two datasets have no such distinguishment for classification. This is reflected in the precision and recall values for all three datasets.
| Datasets | Training Samples | Testing Samples | Accuracy | Precision | Recall | F1-score |
|---|---|---|---|---|---|---|
| D1 | 3245 | 4057 | 99.77 | 99.66 | 100 | 99.83 |
| D2 | 1872 | 2340 | 99.65 | 99.44 | 100 | 99.72 |
| D3 | 9145 | 11432 | 94.53 | 96.05 | 92.78 | 94.38 |
| D1+D2+D3 | 10418 | 3473 | 81.84 | 82.33 | 81.75 | 82.04 |


V-C2 Cross-dataset Experiment
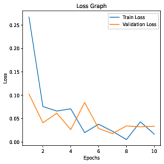
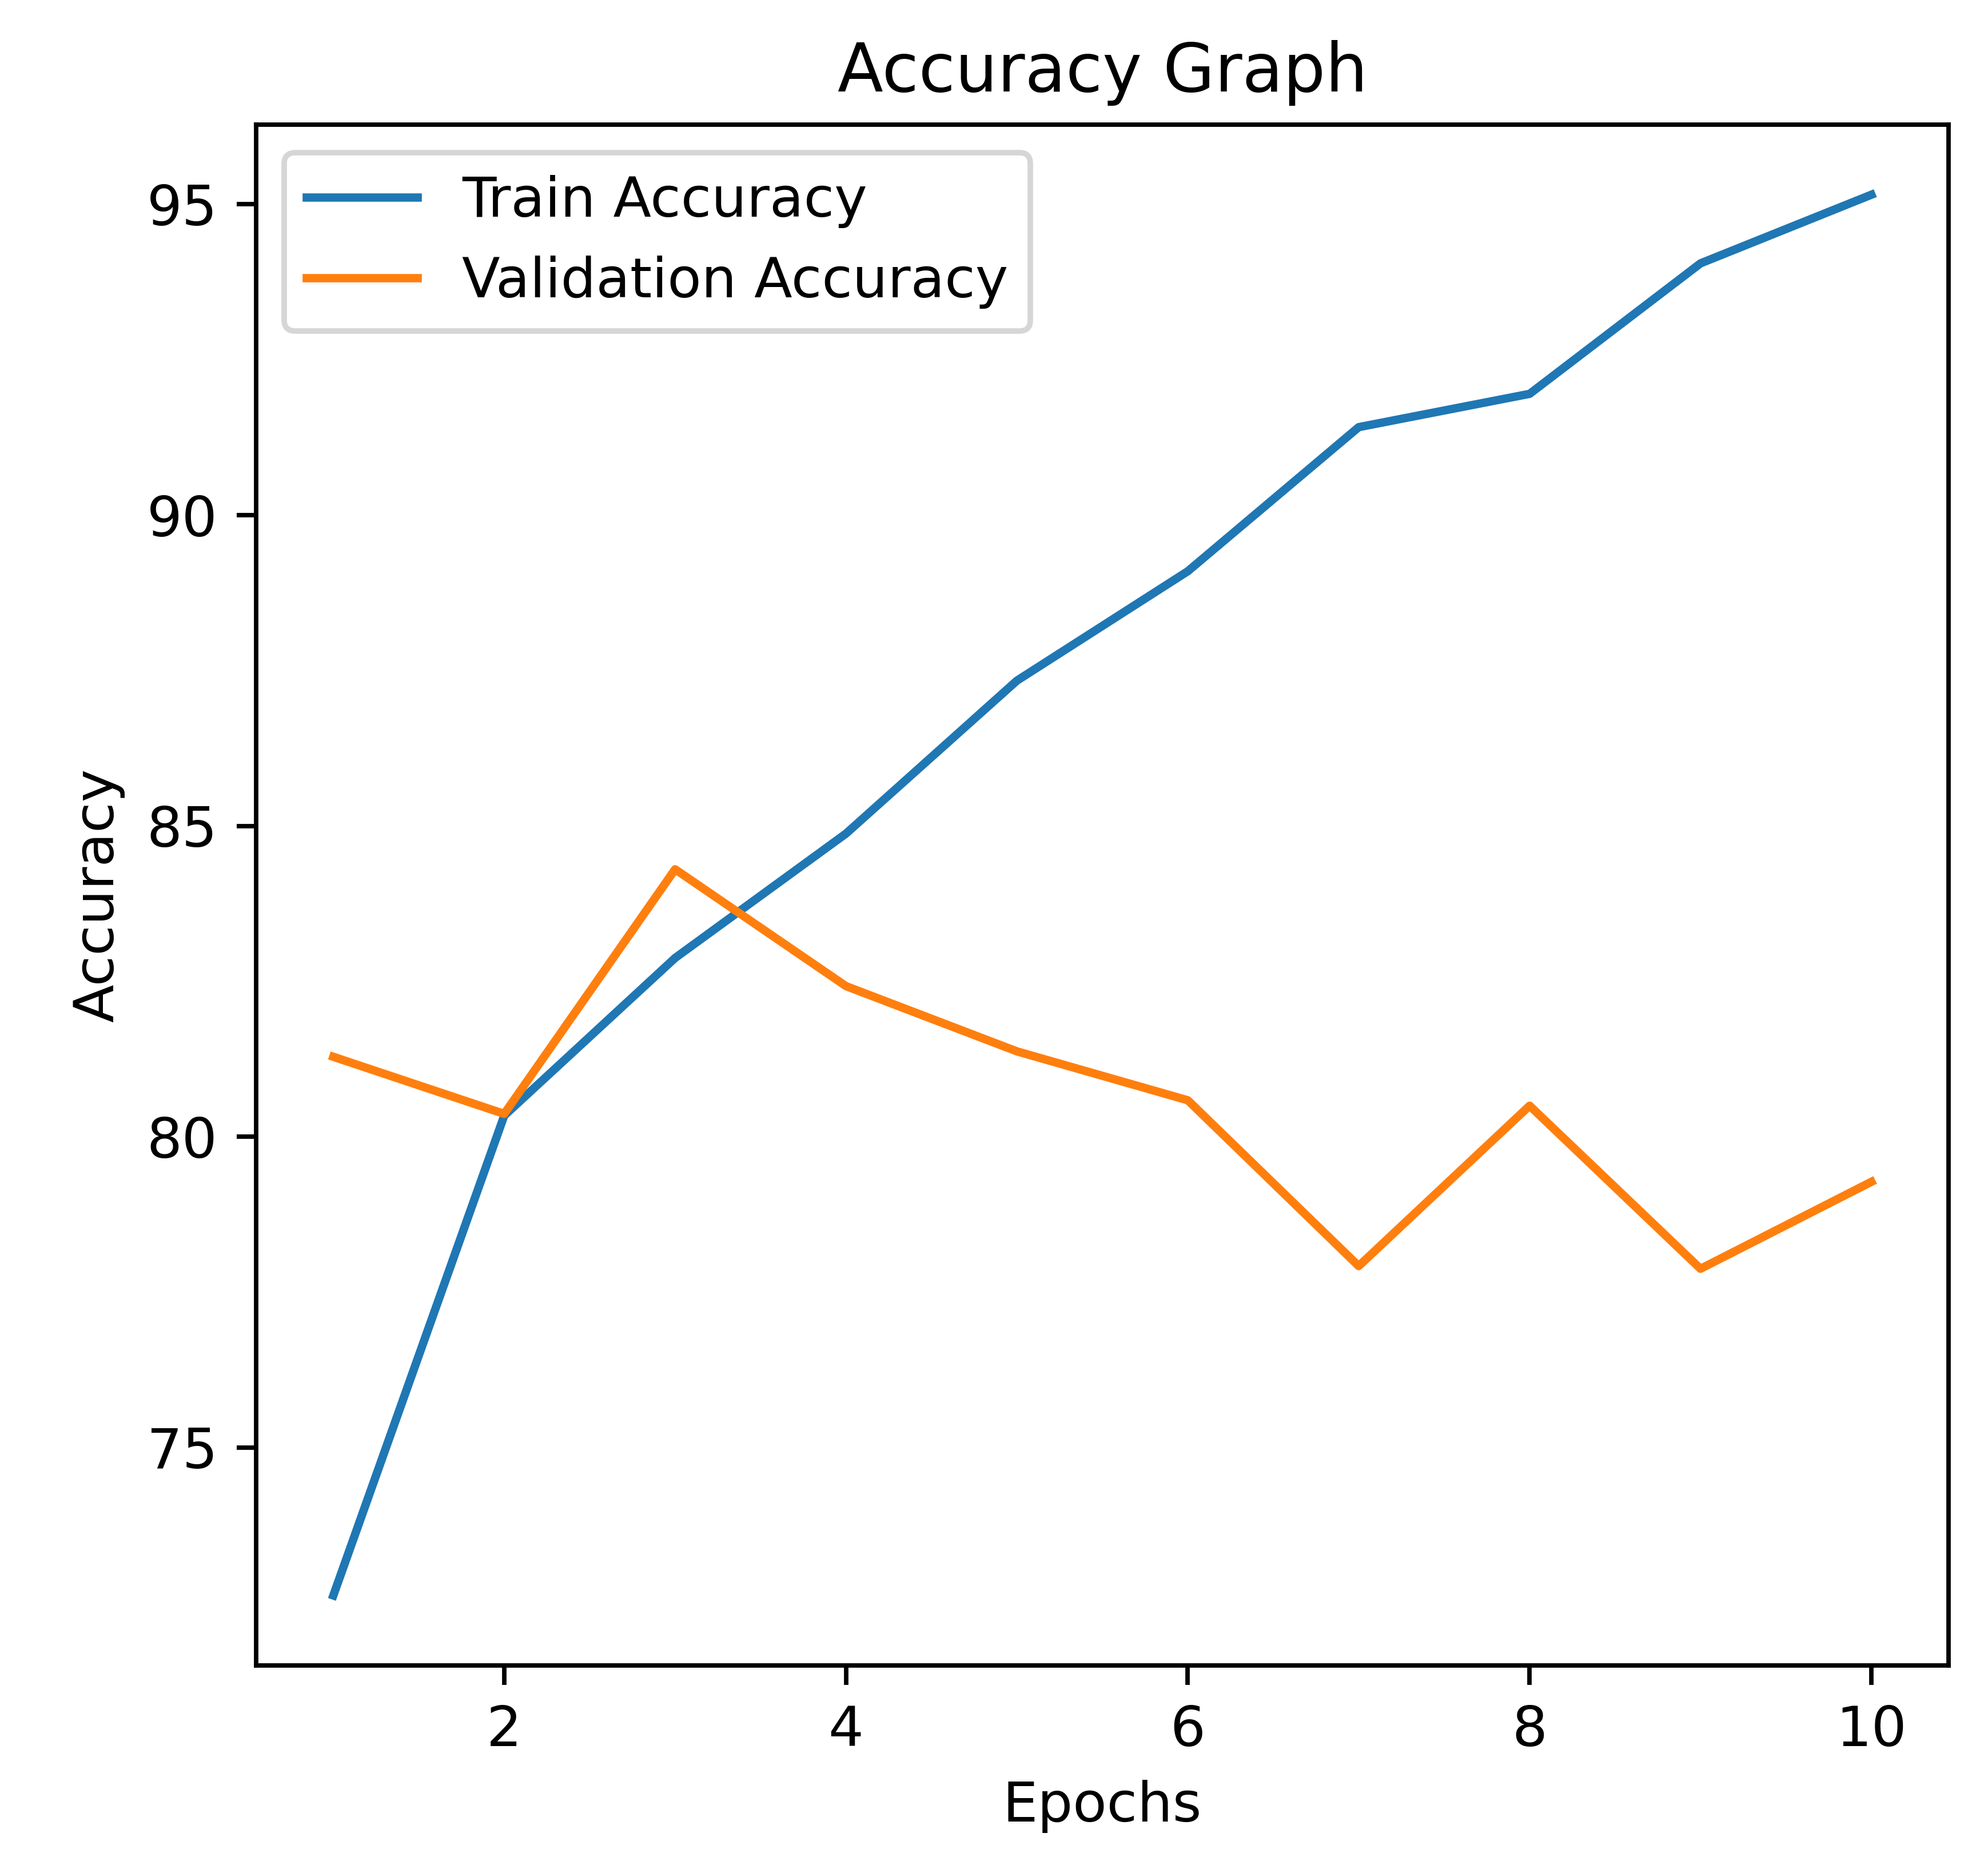
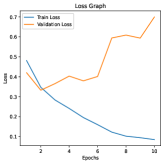
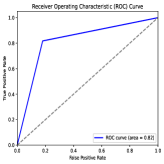
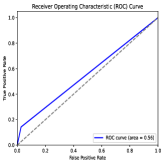
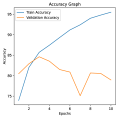
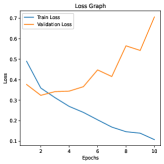
The training and testing images are from different datasets, which involve different imaging devices and environmental conditions for recapturing. This experiment protocol is the most challenging one. This is the first time cross-domain analysis has been performed on such a large scale. All the previous work focused on intra-domain testing and inter-domain analysis using a single different dataset for testing and training. Combining datasets introduces a more challenging scenario. Also, introducing data augmentation increases the difficulty in classification. The training and validation accuracies and loss can be observed in Fig. 10. The ROCs with the AUC values are also shown in the figure. The table VIII provides the evaluation details for the cross-domain analysis. The AUC value for the training dataset D1+D2, tested on D3, is the lowest. The other two combinations provide an accuracy of 81% with precision values of 90% and 95%, respectively.
| Datasets | Training Samples | Testing Samples | Accuracy | Precision | Recall | F1-score |
| D1+D2 D3 | 5117 | 11432 | 57.24 | 79.87 | 18.35 | 29.85 |
| D2+D3 D1 | 10644 | 4057 | 81.90 | 90.61 | 81.22 | 85.66 |
| D3+D1 D2 | 12018 | 2340 | 80.94 | 95.68 | 72.29 | 82.35 |
V-C3 Comparative Analysis
Based on the diversity present in the datasets in section V-A, we evaluate the performance of different approaches under the intra, inter and cross-domain experiments in this section. The techniques used for comparative analysis include traditional machine learning classifier with handcrafted features, namely, texture features (LBP8,1+SVM [5]), aliasing noise and blurring effects (Pixel-wise correlation coeff. + SVM [45]), generic CNN models (VGG16 [40], ResNet 50 [11] and DenseNet 121 [12]). For all the techniques the hyperparameters were empirically selected by the datasets. The feature dimensions for the LBP features was 59 and for the correlation coefficients was 54.
For the intra-database experiment, the results show that the AUCs of most CNN-based models are 0.7. The VGG16 approach achieves AUCs in databases I, II and III, and for inter-domain 64%. The cross-domain AUCs is between 30-40%. ResNet approach achieves AUCs for intra-domain and inter-domain , respectively. The DenseNet achieves AUCs for the three datasets: I, II, and III and for cross-domains . For the LBP-based classifiers, the AUC is 59% in Database I, 53% in Database II, and Database III. Given the average performance of all the approaches under an intra-database setting, our method provides the best intra, inter-domain and cross-domain testing results.
| Methods | D1 | D2 | D3 | D1+D2+D3 | D1+D2 D3 | D2+D3 D1 | D3+D1 D2 |
|---|---|---|---|---|---|---|---|
| LBP+SVM(RBF) [5] | 98.95 | 97.44 | 93.54 | 77.40 | 52.08 | 57.12 | 50.50 |
| Pixel-wise Corr. Coef.[45] | 99.18 | 97.70 | 86.75 | 79.45 | 50.00 | 63.21 | 44.83 |
| VGG16 [40] | 79.47 | 77.60 | 75.85 | 64.73 | 56.63 | 74.50 | 76.45 |
| ResNet 50 [11] | 82.50 | 84.17 | 82.78 | 55.78 | 56.47 | 75.79 | 78.03 |
| DenseNet 121 [12] | 79.12 | 80.76 | 81.32 | 49.17 | 56.05 | 55.12 | 67.95 |
| Proposed DAST | 99.77 | 99.65 | 94.53 | 81.84 | 58.24 | 81.90 | 80.94 |
In this experiment’s first part, we use the same image patches for training and testing experimentation. It can be seen from Table IX that when the training data and the testing data consist of different domains, the performances of all the detection approaches have decreased significantly compared with those from the intra and inter-database experiments. The AUCs for the LBP-SVM classifier with default parameters are lower than 55%, which is unsatisfactory. Limitations of LBP features can be overcome by employing other variants of LBP. However, it will increase the feature dimensions. Also, the correlation coefficients for the residual noise images provide accuracy as low as 40% for the intra-domain and 63% for the cross-domain. The traditional feature extraction algorithm is ineffective because of its inability to extract features from different domains. The resolution of the images is different. Also, generalizing the features from tens and hundreds of cameras is impossible using traditional handcrafted features and machine learning classifiers. The problem of underfitting and overfitting is not resolved even after using the regularization parameter.
For the second part, we have employed a few generic CNN models, namely VGG16, ResNet 50, and DenseNet 121; the AUCs on average for the inter and intra-domain are between 75-85%. The cross-domain results are unsatisfactory. The accuracy is in between 55-75%. The results achieved by our proposed method are much better. However, all the approaches do not perform well when trained on NTU+ICL image datasets and tested on the Mturk dataset for the following reasons. The testing images are low resolution and less discriminative than the training datasets. The training dataset has a negligible aliasing effect than the testing datasets. The variance in the acquiring device cameras is very high.
VI Conclusion
In this work, we proposed a domain generalized recaptured image detection technique, which is a simple but effective anti-forensic scheme using a SWIN transformer. Experimental results have demonstrated that the proposed scheme has good generalization performance under various capturing devices (low and high-resolution cameras), imitating medium (different LCD screens), and different post-processing forgeries (anti-aliasing filters, colour tampering, copy-move and copy-paste). Based on understanding the feature variations, the SWIN transformer extracted the local and global features. The proposed scheme is simple but competitive. The results show that under the most challenging experiment protocol, i.e., the cross-domain experiments, the AUCs of the approaches using the state-of-the-art method are only 0.40 on average, which is way below the results achieved by our model. Our study of RIA is limited to images acquired through the ubiquitous LCD screens as the display media. Other rebroadcast imitating mediums, such as printers, scanners, low-end mobile cameras, and high-quality projection, shall be investigated in the future. Besides detecting the recaptured images, it is also interesting to identify the other recapturing pipelines and estimate the effects of pipeline parameters. Achieving domain generalization for different sources of imitating mediums will be highly challenging.
References
- [1] Agarwal, S., Fan, W., Farid, H.: A diverse large-scale dataset for evaluating rebroadcast attacks. In: 2018 IEEE International Conference on Acoustics, Speech and Signal Processing (ICASSP). pp. 1997–2001. IEEE (2018), https://agarwalshruti15.github.io/
- [2] Anjum, A., Islam, S.: Recapture detection technique based on edge-types by analysing high-frequency components in digital images acquired through lcd screens. Multimedia tools and applications 79(11), 6965–6985 (2020)
- [3] Bai, J., Ng, T.T., Gao, X., Shi, Y.Q.: Is physics-based liveness detection truly possible with a single image? In: Proceedings of 2010 IEEE International Symposium on Circuits and Systems. pp. 3425–3428. IEEE (2010)
- [4] Cao, H.: Statistical image source model identification and forgery detection. Ph.D. thesis, PhD thesis, Nanyang Technological University (2010), https://rose1.ntu.edu.sg/dataset/recapturedImages/
- [5] Cao, H., Kot, A.C.: Identification of recaptured photographs on lcd screens. In: 2010 IEEE International conference on acoustics, speech and signal processing. pp. 1790–1793. IEEE (2010)
- [6] Chen, C., Zhang, S., Lan, F., Huang, J.: Domain-agnostic document authentication against practical recapturing attacks. IEEE Transactions on Information Forensics and Security 17, 2890–2905 (2022)
- [7] Chen, C., Zhao, L., Yan, J., Li, H.: A distortion model-based pre-screening method for document image tampering localization under recapturing attack. Signal Processing 200, 108666 (2022)
- [8] Choi, H.Y., Jang, H.U., Son, J., Kim, D., Lee, H.K.: Content recapture detection based on convolutional neural networks. In: International Conference on Information Science and Applications. pp. 339–346. Springer (2017)
- [9] Edmunds, T., Caplier, A.: Face spoofing detection based on colour distortions. IET biometrics 7(1), 27–38 (2018)
- [10] Gao, X., Ng, T.T., Qiu, B., Chang, S.F.: Single-view recaptured image detection based on physics-based features. In: 2010 IEEE International Conference on Multimedia and Expo. pp. 1469–1474. IEEE (2010)
- [11] He, K., Zhang, X., Ren, S., Sun, J.: Deep residual learning for image recognition. In: Proceedings of the IEEE conference on computer vision and pattern recognition. pp. 770–778 (2016)
- [12] Huang, G., Liu, Z., Van Der Maaten, L., Weinberger, K.Q.: Densely connected convolutional networks. In: Proceedings of the IEEE conference on computer vision and pattern recognition. pp. 4700–4708 (2017)
- [13] Jia, Y., Zhang, J., Shan, S., Chen, X.: Single-side domain generalization for face anti-spoofing. In: Proceedings of the IEEE/CVF Conference on Computer Vision and Pattern Recognition. pp. 8484–8493 (2020)
- [14] Jung, D.J., Hyun, D.K., Lee, H.K.: Recaptured video detection based on sensor pattern noise. EURASIP Journal on Image and Video Processing 2015(1), 1–14 (2015)
- [15] Ke, Y., Shan, Q., Qin, F., Min, W.: Image recapture detection using multiple features. International Journal of Multimedia and Ubiquitous Engineering 8(5), 71–82 (2013)
- [16] Kim, I., Ahn, J., Kim, D.: Face spoofing detection with highlight removal effect and distortions. In: 2016 IEEE International Conference on Systems, Man, and Cybernetics (SMC). pp. 004299–004304. IEEE (2016)
- [17] Kose, N., Dugelay, J.L.: Classification of captured and recaptured images to detect photograph spoofing. In: 2012 International Conference on Informatics, Electronics & Vision (ICIEV). pp. 1027–1032. IEEE (2012)
- [18] Li, G., Yao, H., Le, Y., Qin, C.: Recaptured screen image identification based on vision transformer. Journal of Visual Communication and Image Representation 90, 103692 (2023)
- [19] Li, H., Wang, S., Kot, A.C.: Image recapture detection with convolutional and recurrent neural networks. Electronic Imaging 2017(7), 87–91 (2017)
- [20] Li, J., Kong, C., Wang, S., Li, H.: Two-branch multi-scale deep neural network for generalized document recapture attack detection. In: ICASSP 2023-2023 IEEE International Conference on Acoustics, Speech and Signal Processing (ICASSP). pp. 1–5. IEEE (2023)
- [21] Li, R., Ni, R., Zhao, Y.: An effective detection method based on physical traits of recaptured images on lcd screens. In: International Workshop on Digital Watermarking. pp. 107–116. Springer (2015)
- [22] Liu, Z., Lin, Y., Cao, Y., Hu, H., Wei, Y., Zhang, Z., Lin, S., Guo, B.: Swin transformer: Hierarchical vision transformer using shifted windows. In: Proceedings of the IEEE/CVF international conference on computer vision. pp. 10012–10022 (2021)
- [23] Liu, Z., Zhu, N., Wang, K.: Recaptured image forensics based on generalized central difference convolution network. In: 2022 IEEE 2nd International Conference on Software Engineering and Artificial Intelligence (SEAI). pp. 59–63. IEEE (2022)
- [24] Luan, X., Wang, H., Ou, W., Liu, L.: Face liveness detection with recaptured feature extraction. In: 2017 International Conference on Security, Pattern Analysis, and Cybernetics (SPAC). pp. 429–432. IEEE (2017)
- [25] Luo, J., Guo, J., Qiu, W., Huang, Z., Hui, H.: Scale invariant domain generalization image recapture detection. In: International Conference on Neural Information Processing. pp. 75–86. Springer (2021)
- [26] Mahdian, B., Amsky, A.N., Saic, S.: Detecting cyclostationarity in re-captured lcd screens. Journal of Forensic Research 6(4), 1 (2015)
- [27] Mehta, P.: Detection of near-duplicate images using statistical texture features. In: 2021 Asian Conference on Innovation in Technology (ASIANCON). pp. 1–8. IEEE (2021)
- [28] Mehta, P., Singh, M.K., Singha, N.: Near-duplicate image detection based on wavelet decomposition with modified deep learning model. Journal of Electronic Imaging 31(2), 023017 (2022)
- [29] Mehta, P., Singh, M.K., Singha, N.: Near-duplicate image detection based on wavelet decomposition with modified deep learning model. Journal of Electronic Imaging 31(2), 023017–023017 (2022)
- [30] Mehta, P., Tripathi, R.K.: Near-duplicate detection for lcd screen acquired images using edge histogram descriptor. Multimedia Tools and Applications pp. 1–19 (2022)
- [31] Miao, S., Zheng, L., Jin, H.: Learning feature disentanglement and dynamic fusion for recaptured image forensic. arXiv preprint arXiv:2206.06103 (2022)
- [32] Mittal, V., Sharma, R.: Deep learning approach for voice pathology detection and classification. International Journal of Healthcare Information Systems and Informatics (IJHISI) 16(4), 1–30 (2021)
- [33] Moreira-Pérez, J.J., Chupeau, B., Doërr, G., Baudry, S.: Exploring color information to characterize camcorder piracy. In: 2013 IEEE International Workshop on Information Forensics and Security (WIFS). pp. 132–137. IEEE (2013)
- [34] Muammar, H., Dragotti, P.L.: An investigation into aliasing in images recaptured from an lcd monitor using a digital camera. In: 2013 IEEE International Conference on Acoustics, Speech and Signal Processing. pp. 2242–2246. IEEE (2013)
- [35] Ni, R., Zhao, Y., Zhai, X.: Recaptured images forensics based on color moments and dct coefficients features. J. Inf. Hiding Multim. Signal Process. 6, 323–333 (2015)
- [36] Niu, D., Ruohao, G., Wang, Y.: Morié attack (ma): A new potential risk of screen photos. In: Advances in Neural Information Processing Systems (2021)
- [37] Patel, K., Han, H., Jain, A.K., Ott, G.: Live face video vs. spoof face video: Use of moiré patterns to detect replay video attacks. In: 2015 International Conference on Biometrics (ICB). pp. 98–105. IEEE (2015)
- [38] S.A.A.H., S., Mayurathan, B.: Recognition of recaptured images using physical based features (2016)
- [39] Shao, R., Lan, X., Li, J., Yuen, P.C.: Multi-adversarial discriminative deep domain generalization for face presentation attack detection. In: Proceedings of the IEEE/CVF Conference on Computer Vision and Pattern Recognition. pp. 10023–10031 (2019)
- [40] Simonyan, K., Zisserman, A.: Very deep convolutional networks for large-scale image recognition. arXiv preprint arXiv:1409.1556 (2014)
- [41] Sun, Y., Shen, X., Lv, Y., Liu, C.: Recaptured image forensics algorithm based on multi-resolution wavelet transformation and noise analysis. International Journal of Pattern Recognition and Artificial Intelligence 32(02), 1854003 (2018)
- [42] Thongkamwitoon, T., Muammar, H., Dragotti, P.L.: An image recapture detection algorithm based on learning dictionaries of edge profiles. IEEE Transactions on Information Forensics and Security 10(5), 953–968 (2015)
- [43] Torralba, A., Efros, A.A.: Unbiased look at dataset bias. In: CVPR 2011. pp. 1521–1528. IEEE (2011)
- [44] Visentini-Scarzanella, M., Dragotti, P.L.: Modelling radial distortion chains for video recapture detection. In: 2013 IEEE 15th International Workshop on Multimedia Signal Processing (MMSP). pp. 412–417. IEEE (2013)
- [45] Wang, K.: A simple and effective image-statistics-based approach to detecting recaptured images from lcd screens. Digital Investigation 23, 75–87 (2017)
- [46] Yan, J., Chen, C.: Cross-domain recaptured document detection with texture and reflectance characteristics. In: 2021 Asia-Pacific Signal and Information Processing Association Annual Summit and Conference (APSIPA ASC). pp. 1708–1715. IEEE (2021)
- [47] Yang, P., Li, R., Ni, R., Zhao, Y.: Recaptured image forensics based on quality aware and histogram feature. In: International Workshop on Digital Watermarking. pp. 31–41. Springer (2017)
- [48] Yang, P., Ni, R., Zhao, Y.: Recapture image forensics based on laplacian convolutional neural networks. In: International Workshop on Digital Watermarking. pp. 119–128. Springer (2016)
- [49] Yin, J., Fang, Y.: Digital image forensics for photographic copying. In: Media Watermarking, Security, and Forensics 2012. vol. 8303, p. 83030F. International Society for Optics and Photonics (2012)
- [50] Yin, J., Fang, Y.: Markov-based image forensics for photographic copying from printed picture. In: Proceedings of the 20th ACM international conference on Multimedia. pp. 1113–1116 (2012)
- [51] Yu, H., Ng, T.T., Sun, Q.: Recaptured photo detection using specularity distribution. In: 2008 15th IEEE International Conference on Image Processing. pp. 3140–3143. IEEE (2008)
- [52] Yue, H., Mao, Y., Liang, L., Xu, H., Hou, C., Yang, J.: Recaptured screen image demoiréing. IEEE Transactions on Circuits and Systems for Video Technology 31(1), 49–60 (2020)
- [53] Zhai, X., Ni, R., Zhao, Y.: Recaptured image detection based on texture features. In: 2013 Ninth International Conference on Intelligent Information Hiding and Multimedia Signal Processing. pp. 234–237. IEEE (2013)
- [54] Zhang, L.B., Peng, F., Qin, L., Long, M.: Face spoofing detection based on color texture markov feature and support vector machine recursive feature elimination. Journal of Visual Communication and Image Representation 51, 56–69 (2018)
- [55] Zhao, L., Chen, C., Huang, J.: Deep learning-based forgery attack on document images. IEEE Transactions on Image Processing 30, 7964–7979 (2021)
- [56] Zhou, Z., Lin, K., Cao, Y., Yang, C.N., Liu, Y.: Near-duplicate image detection system using coarse-to-fine matching scheme based on global and local cnn features. Mathematics 8(4), 644 (2020)
- [57] Zhu, N., Guo, Q., Cui, M., Guo, X.: Recaptured image forensics based on normalized local ternary count histograms of residual maps. Signal, Image and Video Processing 16(1), 165–173 (2022)
- [58] Zhu, N., Li, Z.: Recaptured image detection through enhanced residual-based correlation coefficients. In: Cloud Computing and Security: 4th International Conference, ICCCS 2018, Haikou, China, June 8-10, 2018, Revised Selected Papers, Part VI 4. pp. 624–634. Springer (2018)
- [59] Zhu, N., Liu, Z.: Recaptured image forensics based on local ternary count of high order prediction error. Signal Processing: Image Communication 104, 116662 (2022)
- [60] Zhu, N., Qin, M., Yin, Y.: Recaptured image detection based on convolutional neural networks with local binary patterns coding. In: Fourth International Workshop on Pattern Recognition. vol. 11198, pp. 11–16. SPIE (2019)
- [61] Zhu, N., Xiang, H., Liu, Z.: Exposing recaptured images with constrained convolutional neural network. In: 2022 7th International Conference on Signal and Image Processing (ICSIP). pp. 463–467. IEEE (2022)