The rich galactic environment of a H2-absorption selected quasar††thanks: Based on data collected at the Very Large Telescope from the European Southern Observatory under Prog. IDs 111.24UJ.004 and 105.203L.001
We present the first VLT/MUSE observations of a quasar featuring a proximate molecular absorption system, SDSS J125917.31+030922.5. The proximate damped Ly absorption acts as a natural coronagraph, removing the quasar emission over 40 Å in wavelength, and allows us to detect extended Ly emission without the necessity of subtracting the quasar emission. This natural coronagraph permits the investigation of the quasar environment down to its inner regions ( kpc), where galaxy interactions or feedback processes should have the most noticeable effects. Our observations reveal a dense environment, with a highly asymmetric Ly emission within ( kpc), possibly shaped by a companion galaxy, and a southern extension of the nebulae at about 50 kpc, with rotation-like kinematic signature. The width of the Ly emission is broadest closer to the quasar, indicating perturbed kinematics as expected if interactions and significant gas flows are present. The foreground absorbing system itself is redshifted by 400 km/s relative to the background quasar, and therefore is likely arising from gas moving towards the quasar. Finally two additional Ly emitters are detected with significance at 96 and 223 kpc from the quasar, making this field overdense relative to other similar observations of quasars at . Our results support the hypothesis that quasars with proximate neutral/molecular absorption trace rich environments where galaxy interactions are at play and motivates further studies of -selected quasars to shed light on feeding and feedback processes.
Key Words.:
quasars: emission lines, quasars: absorption lines, quasars: individual: SDSS J125917.31+030922.5, galaxies: high-redshift1 Introduction
Thanks to their tremendous luminosity, quasars have been used since their discovery in the 1960s as powerful cosmic probes. Their spectra indeed carry a wealth of absorption signatures from the various intervening gaseous environments encountered along the line of sight to the observer, ranging from the diffuse ionized intergalactic medium (e.g., Rauch, 1998) to large column densities of neutral gas that imprint characteristic damped Lyman-alpha systems (DLAs, with , see Wolfe et al., 2005).
Associated systems are believed to originate within the quasar environment. Due to their physical proximity, a low velocity difference between the quasar and the associated system is expected, dominated by the kinematics of the gas rather than the Hubble flow. This motivated the first systematic studies of associated systems by selecting samples of proximate DLAs, defined as systems with velocity differences km s-1 (PDLAs, see Ellison et al., 2010). The detectability of such systems in H i depends on the competition between clustering in quasar environment and ionization by the intense radiation field of the later (Prochaska et al., 2008).
More recently, Noterdaeme et al. (2019) uncovered a population of proximate molecular absorption systems. Because the presence of H2 requires a shielding H i layer (see e.g. Sternberg et al., 2014), proximate H2 absorbers are expected to be PDLAs. The incidence rate of proximate H2 absorbers was found to be an order of magnitude higher relative to the intervening H2 systems, indicating that proximate H2 systems are indeed tracing environments surrounding the quasars. The velocity of the foreground absorber relative to the background quasar is likely due to the kinematics of the gas, where positive and negative velocity differences suggest accretion and outflow processes, respectively, in line with an observed trend between this velocity and the gas metallicity (Noterdaeme et al., 2023). Detailed analysis of optical and millimetre data then permits further investigation of outflowing (Noterdaeme et al., 2021) or merging (Balashev et al. in prep) processes in these systems.
The above observations have not yet been connected to the quasar emission properties. Integral field spectroscopy (IFS) has proved to be invaluable in providing 3D maps of the emission in quasar fields, even reaching an striking 100% detection rate of extended Ly emission around bright quasars, with scales reaching up to hundreds of kpc (Borisova et al., 2016). However, the outshining continuum and Ly emission from the central engine, even if expected to arise from a tiny region, poses a severe challenge to investigate structures at galactic scales ( kpc), closer to the quasar itself, where outflows, inflows and galaxy interactions are expected to play a crucial role. Indeed, regardless of the consistent detection, the ability to recover the resolved emission depends on the efficiency of quasar point spread function (PSF) subtraction methods. Empirical PSF methods generally perform well at large distances from the central quasar but leave large residuals in the inner regions (see examples in Arrigoni Battaia et al., 2019; Farina et al., 2019). Other methodologies involve modeling the quasar spectra and then subtracting the model for each spaxel of the data cube (North et al., 2017), but the accuracy of the extracted emission strongly depends on the modeling, which may also introduce biases by involving the use of quasar template spectra.
In this letter, we present the first IFS observations of a proximate H2 system, in the quasar SDSS J125917.31+030922.5 (hereafter J1259+0309). A natural coronagraph is provided by the corresponding high-column density PDLA, enabling Ly nebula extraction without the necessity of modelling and subtracting the quasar light, making it the most precise mapping of nebular emission at low projected distances to date. This allows us to trace the gas structure in a complex, likely interacting environment.
2 Observations
IFS observations of J1259+0309 were carried out by the Multi Unit Spectroscopic Explorer (MUSE) instrument (Bacon et al. 2010), mounted on UT4 at the Very Large Telescope (VLT). Observations were executed under good seeing conditions (average ). Six 10 minutes long exposures were taken with different position angles (0∘, 22.5∘, 45∘, 90∘, 112.5∘ and 135∘), for better spatial sampling.
Raw exposures were reduced using ESO MUSE Data Reduction Software (pipeline version 2.8.9; Weilbacher et al., 2020). We ran two iterations of the scipost recipe, the first to obtain data images for producing a sky mask to be used in the second iteration. Finally, the Zurich Atmosphere Purge (Soto et al., 2016) software was used to remove any residual pattern from the sky subtraction procedure. To account for correlated noise, the final variance cube is scaled to match the measured variance of the background. The PSF’s full width at half maximum (FWHM) is measured to be 0.7” in processed datacube.
In this paper, we also use spectroscopic data from VLT/X-shooter and adopt the systemic redshift of the quasar host galaxy as based on CO(3-2) emission from NOEMA observations (Noterdaeme et al., 2023). We use as the reference for zero velocity in the following sections. This implies a spatial scale of 7.5 pkpc per arcsec for a flat CDM cosmology with and km s-1 Mpc-1.
3 Methodology and results
3.1 The PDLA as perfect natural coronagraph
Observing Ly emission in quasar fields normally requires precise modelling of the quasar PSF as it heavily dominates the emission. For IFS data, this is generally done empirically by estimating the PSF from broad band images extracted from the same data cube (see Borisova et al. (2016) or Farina et al. (2019) for examples). However, the outshining quasar emission itself inevitably leaves residuals that prevent measuring faint nebular Ly emission in the inner regions, impeding any characterisation of the emission at the scale of the quasar host or nearby companion galaxies. For J1259+0309, the presence of a PDLA () with large H i column density () efficiently suppresses the quasar light over a wide wavelength range (optical depth higher than 5 over ) so, for the first time, there is no need to perform neither PSF nor continuum subtraction and we can directly extract the extended Ly emission, including the relatively narrow component at the core of the DLA profile (see Fig. 1). In short, the PDLA acts as a natural coronagraph that suppresses the point source emission well before any dispersive process due to the Earth’s atmosphere, the telescope or the instrument.
3.2 Identification and subtraction of a low redshift galaxy
The left panel of Fig. 2 shows a white light image of the data cube, in which several sources are detected. Within this region, we identified only one additional line emitting source, which turns out to be a galaxy and whose H emission, falling at , could in principle contaminate the high- Ly map at this position. We predicted the H emission based on the strength of the H and H lines, assuming recombination and values reported in Table B.7 from Dopita & Sutherland (2003), and subtracted the emission from the cube on a spaxel-by-spaxel basis wherever we managed to detect H with S/N , despite the strength of the H emission being below the noise level for most subtracted spaxels.
3.3 Optimal extraction of the Ly nebula
We employed similar methods as outlined in Borisova et al. (2016) and Farina et al. (2019), in which the only pre-detection process is background subtraction at spaxels where the quasar is not detected. A S/N cube is then created from the results of the last step, which is converted into a binary cube, where unit values indicate voxels with S/N (zero otherwise). Finally, a 3D segmentation mask is obtained by running a friends-of-friends algorithm on this binary cube. The largest group of connected voxels is considered as the final mask. An extended explanation of the methodology will be presented in Urbina et al. (in prep.). The optimally extracted Ly nebula (zeroth moment) and its first and second moments are shown in Fig. 3. In addition to the main emission around the position of the quasar, we detect an elongated secondary emission centered 2 arcsec (15 kpc) to the East and a weaker Southern emission connected through a filamentary structure (S/N ). We also present four zoomed in velocity-binned images of the nebula in the inner regions for better visualization of the structures at those scales.
3.4 Additional Ly emitters in the field
| LAE 1 | LAE 2 | |
| RA (J2000) | 12:59:16.777 | 12:59:15.922 |
| DEC (J2000) | +03:09:34.57 | +03:09:45.97 |
| Impact parameter (pkpc) | 96 | 223 |
| Redshift | 3.2455 | 3.2457 |
| Integrated flux | 3.8 | 4.3 |
| (10-17 erg s-1 cm-2 ) | ||
| Peak Ly flux | 8.0 | 9.1 |
| (10-18 erg s-1 cm-2 Å-1) | ||
| Peak significance () | 11.5 | 11.4 |
To explore the wider environment around J1259+0309, we searched for potential Ly emitters (LAE) in the cube using the LSDCat weak line emitting source detection software (Herenz, 2023). LSDCat employs a matched filtering approach which is applied in spatial and then in the spectral direction respectively. For J1259+0309, we used a 2D Moffat profile with FWHM 0.7” in the spatial direction and a gaussian profile with FWHM of 300 for the spectral direction, i.e., a compact source with a narrow line emission. The output of the software is detection significance cube. In Fig. 4, we show the extracted spectrum and narrow-band images of the two LAE candidates detected this way and summarize their properties in Table 1.
4 Discussion
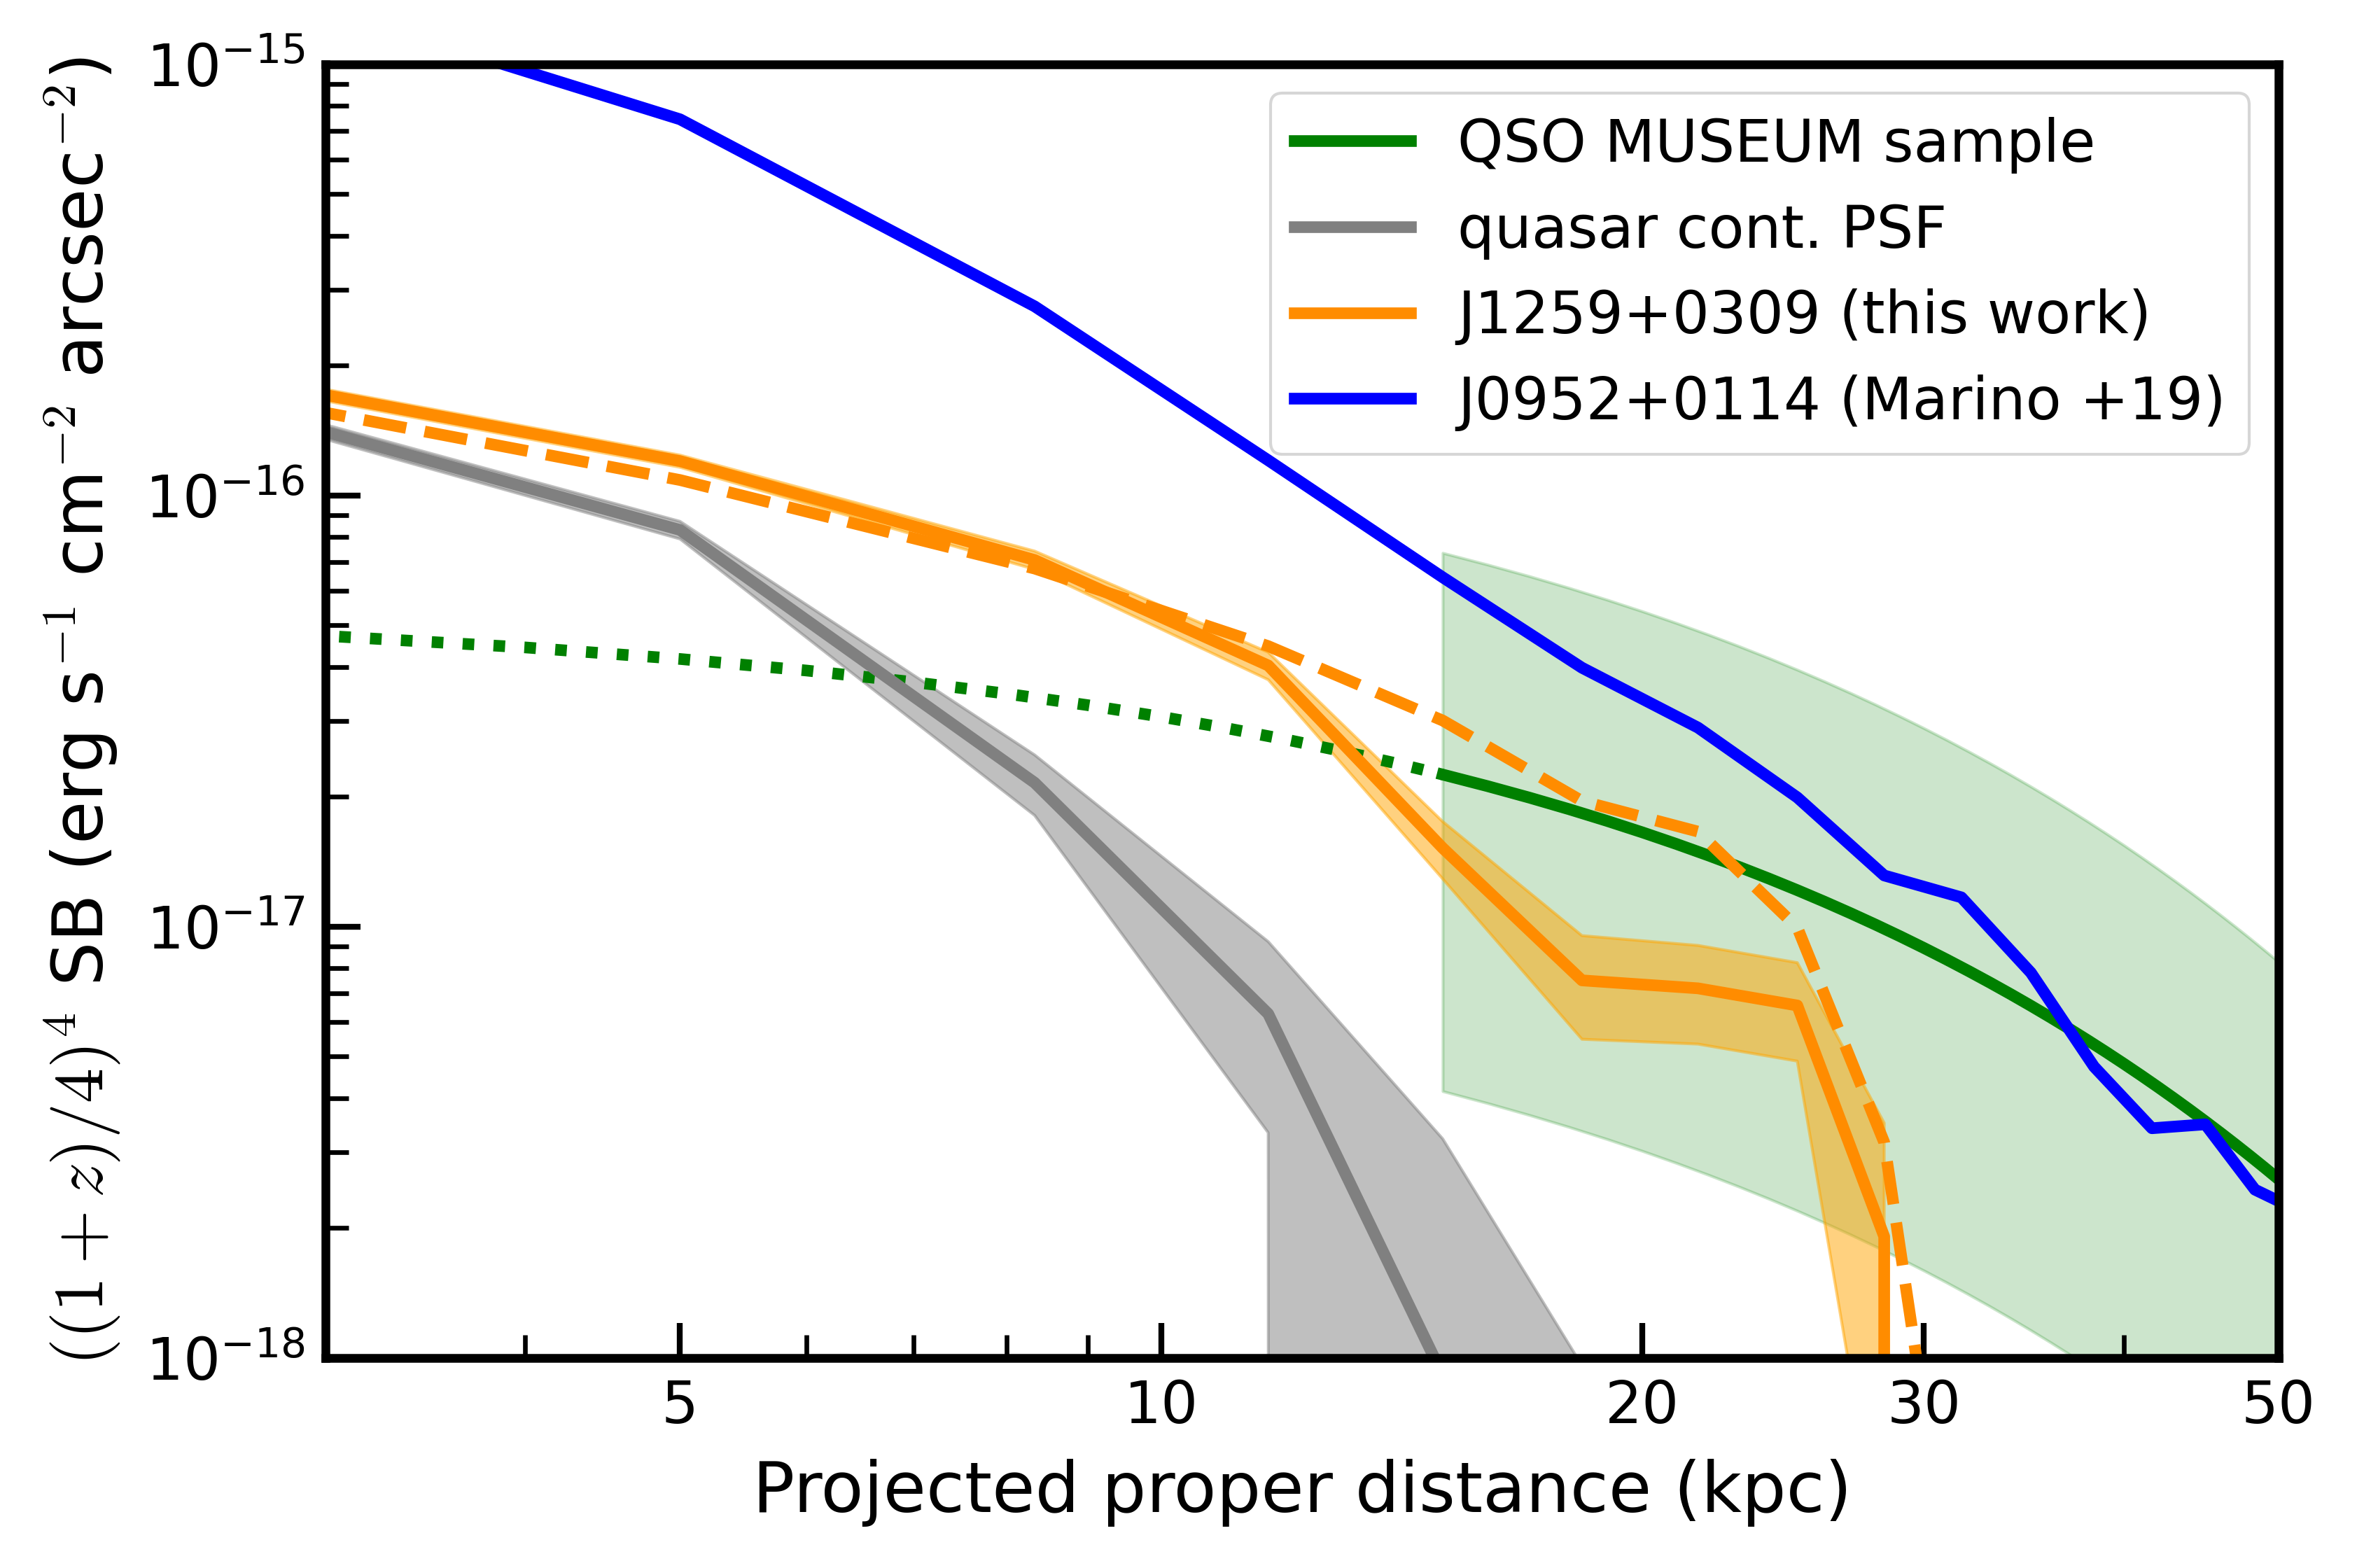
In Fig. 5, we present the circularly averaged surface brightness (SB) profile of the Ly emission around J1259+0309, together with that of SDSS J095253.83+011421.9 (hereafter J0952+0114 Marino et al., 2019) and the best exponential fit to the QSO museum sample (Arrigoni Battaia et al., 2019). Apart from a few noticeable cases, most Ly emission in this sample is concentrated within 50 kpc from the quasar, and has a relatively isotropic profile with a median minor-to-major axis ratio of 0.73. However, PSF contamination impedes constraining the Ly SB profile within the inner 2-3”. This is unfortunate since the close environment of quasars (within a few 10 kpc) is where outflowing or infalling gas and galaxy interactions should have most noticeable effects and hence key to understanding the baryonic cycle or galaxy interactions. Moreover, precisely determining the SB profile of the inner regions can provide some insights into the powering mechanism of the nebulae. Post-processing cosmological simulations by Costa et al. (2022) suggest an approximately flat profile at low projected distances is not possible to recover when only assuming recombination and collisional excitation. As the profile shown in Fig. 5 is indeed approximately flat up to kpc, we may conclude that mechanisms such as resonant scattering can be relevant in this case.
MUSE observations of J0952+0114, where PSF subtraction is not required due to the presence of a PDLA111In J0952+01114 there can still be quasar continuum contamination as zero flux levels are not reached in the Ly portion of the spectrum., show a much higher flux in the central regions compared to what is expected from extrapolating the MUSEUM profile but did not reveal much structure either. This particular quasar originally attracted attention because it lacks the broad Ly component expected from the broad metal line emission (Hall et al., 2004). Jiang et al. (2016) later showed the presence of a PDLA which covers only the continuum and the broad-line region but is filled with relatively narrow ( ) emission, explaining the difficulty in identifying the PDLA as such. This PDLA exhibits strong absorption from silicon in its excited fine-structure state (Si ii*), which may indicate high compactness of the associated gas (Fathivavsari, 2020). Additionally, the quasar spectrum shows a higher line emission-to-continuum ratio compared to quasar composite spectra, suggesting differential reddening, where dusty gas in the PDLA does not fully cover the metal emission regions either. Regardless of its exact origin, the extended Ly emission in J0952+0114 may still be dominated by a central point-like source that is observationally smoothed by the PSF over a few arcseconds. This would explain the very strong Ly-alpha emission in the DLA as well as the smooth symmetric shape centered on the quasar position, with a lack internal structure at kpc ().
In the case of J1259+0309, the central point source emission is efficiently suppressed over a wide wavelength range and the remaining emission has a surface brightness closer to expected from extrapolating the peripheral emission profile. While we do not know the actual extent of the absorbing gas, our Ly mapping is not blinded by the central emission, which allows us to resolve structures presented in Fig. 3. We indeed observe a clear asymmetric shape of Ly emission even at small separations of ( kpc) from the quasar, which extends eastwards. For the inner regions of the nebula (without the southern extension) we measured a flux weighted minor-to-major axis ratio of 0.48. Only % of Ly nebulae have a minor-to-major axis ratios lower than J1259+0309 (Arrigoni Battaia et al., 2019).
The relative velocity of the PDLA with respect to is km/s – the PDLA is at a higher redshift than the quasar – which suggests that absorbing gas must be moving towards the quasar. The gas traced by the DLA could hence be tracing a feeding stream or to another galaxy in the group that may eventually merge with the quasar host. This system is also a low-metallicity proximate H2 absorber (, (H; Noterdaeme et al., 2023) with little to no dust reddening. Therefore, for the H i-H2 transition to occur under the influence of the quasar radiation, we anticipate a relatively high volume density (Noterdaeme et al., 2019)222The excitation of H2 suggests the cloud is located at a few 10 kpc, i.e. outside the quasar host galaxy, with density cm-3. This also means that most of the Ly photons from the quasars are actually emitted within a parsec to sub-parsec size region to be covered by such a compact cloud. This is similar to the size of the broad line region typically estimated using other quasar emission lines.. We finally note that the quasar is also a broad absorption line (BAL) quasar, which suggest quasar-driven outflows may be present as well. Nevertheless, this is not necessarily related to the PDLA since less than 10% of quasars are expected to be BALs (Trump et al., 2006).
These PDLA properties suggest the quasar is located in a dense environment with ongoing galaxy interactions. The Ly emission shows consistent signatures of this. A positive gradient in FWHM towards the central quasar (see third panel in Fig. 3) suggests disturbed kinematics occurring in regions with outflows or infalling material, although the Ly emission can be further broadened by radiative-transfer effects only (e.g. Laursen et al., 2011). The inner nebula shows enhanced secondary emission to the East, possibly due to a galaxy companion333Using Subaru/HSC -band imaging we constrained the absolute magnitude of the companion galaxy to be ., which drives the asymmetric shape as well. Additionally, the nebula extends southwards from the central quasar at ” ( kpc). This region shows a different kinematic signature compared to the inner regions, with a velocity gradient may indicate a rotating gas (Fig. 3). Albeit detected only with S/N, a filamentary structure may connect this emission to the material in the immediate vicinity of the quasar. We also note that the number of LAE candidates detected within the J1259+0309 field (2 LAE) is times larger than expected for similar quasar fields at (assuming a 2 detection limit of erg s-1 cm-2 arcsec-2 and after completeness corrections, Arrigoni Battaia et al. 2019), suggesting a denser-than-average environment.
The rich environment unveiled by the Ly emission around J1259+0309 suggests that galaxy interactions are actively occurring, on scales of 15 kpc up to 50 kpc. Such a dense environment is not typical for quasars at these redshifts. This suggest that, by selecting the system based on H2 absorption, we have selected an environment richer than average. As large programs surveying the typical population of quasars are already available, the next step is to explore a large number of quasar fields with proximate absorbers (Urbina, in prep) to assess whether selecting quasars with proximate absorbers dictate their environmental properties or the properties seen in J1259+0309 field can be attributed to the cosmic variance.
Acknowledgements.
F.U. acknowledges support by Subdirection of Human Capital ANID (national MSc 2023/22231861). S.B. is supported by RSF grant 23-12-00166. S.L. acknowledges support by FONDECYT grant 1231187. Authors thank the referee for all comments and suggestions provided.References
- Arrigoni Battaia et al. (2019) Arrigoni Battaia, F., Hennawi, J. F., Prochaska, J. X., et al. 2019, MNRAS, 482, 3162
- Borisova et al. (2016) Borisova, E., Cantalupo, S., Lilly, S. J., et al. 2016, ApJ, 831, 39
- Costa et al. (2022) Costa, T., Arrigoni Battaia, F., Farina, E. P., et al. 2022, MNRAS, 517, 1767
- Dopita & Sutherland (2003) Dopita, M. A. & Sutherland, R. S. 2003, Astrophysics of the diffuse universe
- Ellison et al. (2010) Ellison, S. L., Prochaska, J. X., Hennawi, J., et al. 2010, MNRAS, 406, 1435
- Farina et al. (2019) Farina, E. P., Arrigoni-Battaia, F., Costa, T., et al. 2019, ApJ, 887, 196
- Fathivavsari (2020) Fathivavsari, H. 2020, ApJ, 888, 85
- Hall et al. (2004) Hall, P. B., Snedden, S. A., Niederste-Ostholt, M., et al. 2004, AJ, 128, 534
- Herenz (2023) Herenz, E. C. 2023, Astronomische Nachrichten, 344, e20220091
- Jiang et al. (2016) Jiang, P., Zhou, H., Pan, X., et al. 2016, ApJ, 821, 1
- Laursen et al. (2011) Laursen, P., Sommer-Larsen, J., & Razoumov, A. O. 2011, ApJ, 728, 52
- Marino et al. (2019) Marino, R. A., Cantalupo, S., Pezzulli, G., et al. 2019, ApJ, 880, 47
- North et al. (2017) North, P. L., Marino, R. A., Gorgoni, C., et al. 2017, A&A, 604, A23
- Noterdaeme et al. (2023) Noterdaeme, P., Balashev, S., Cuellar, R., et al. 2023, A&A, 673, A89
- Noterdaeme et al. (2021) Noterdaeme, P., Balashev, S., Krogager, J. K., et al. 2021, A&A, 646, A108
- Noterdaeme et al. (2019) Noterdaeme, P., Balashev, S., Krogager, J. K., et al. 2019, A&A, 627, A32
- Prochaska et al. (2008) Prochaska, J. X., Hennawi, J. F., & Herbert-Fort, S. 2008, ApJ, 675, 1002
- Rauch (1998) Rauch, M. 1998, ARA&A, 36, 267
- Soto et al. (2016) Soto, K. T., Lilly, S. J., Bacon, R., Richard, J., & Conseil, S. 2016, MNRAS, 458, 3210
- Sternberg et al. (2014) Sternberg, A., Le Petit, F., Roueff, E., & Le Bourlot, J. 2014, ApJ, 790, 10
- Trump et al. (2006) Trump, J. R., Hall, P. B., Reichard, T. A., et al. 2006, ApJS, 165, 1
- Weilbacher et al. (2020) Weilbacher, P. M., Palsa, R., Streicher, O., et al. 2020, A&A, 641, A28
- Wolfe et al. (2005) Wolfe, A. M., Gawiser, E., & Prochaska, J. X. 2005, ARA&A, 43, 861