Using a new spectral disentangling approach to ascertain whether the massive binary HDE 228766 contains a WolfRayet star††thanks: Based on observations collected at Observatorio Astronómico Nacional de San Pedro Mártir (México) and Observatoire de Haute Provence (France).
Abstract
The massive binary HDE 228766 is composed of an O type primary and an evolved secondary. However, previous qualitative analyses of the composite spectrum have led to a wide discussion about whether the secondary is an Of or a WolfRayet star. We use new observations and our novel QER20 package to disentangle for the first time the spectra of the two stellar components and obtain artifactfree reconstructed spectra, yielding the more accurate and reliable spectral classifications of O7.5 V((f))z for the primary and O6 Iaf for the secondary. The emission features of the PCygni profiles of the H and He i 5876 Å lines, present in the reconstructed spectrum of the secondary, show that this star is at an initial phase of its transition to the WN evolutionary stage. A previously unobserved variable emission, composed of at least four independent features, is seen since 2014 superposed to the H absorption line. Our analysis reveals that these emission features originate from a physically extended region. This could be explained by an episode of enhanced mass loss in the scenario of a nonconservative evolution of the binary.
keywords:
binaries: spectroscopic – stars: massive – stars: winds – stars: individual (HDE 228766)1 Introduction
HDE 228766, a massive binary system with a period of 10.7426 days, is of special interest because it is very likely that it has undergone episodes of mass transfer and that its secondary component is now in transition toward the WolfRayet (WR) phase. Hiltner (1951) classified the secondary star of this system as WN, attributed to this component the emission features present in the observed spectra, and surmised that the absorption profiles are due to a B or late O primary. Additionally, Hiltner (1951) attributed all the absorption of the H line to the late O component, and observed that the orbital modulation of this line is more irregular and of smaller amplitude compared to the other lines present in the observed spectra. This led Hiltner to conclude that the primary should be much more massive than the secondary.
Hiltner & Schild (1966) and Walborn (1973) classified the secondary component of HDE 228766 as type Of. This classification implies that this star contributes to the absorption flux of the H line in the observed spectra. Therefore, Walborn (1973) recommended reevaluating the orbital parameters and in particular the high mass ratio established by Hiltner (1951) for this system. Likewise, Massey & Conti (1977) suggested that the secondary has its own absorption spectrum, which led them to classify this system as O 7.5 + O 5.5f. However, for Massey & Conti (1977) the presence of emission lines in the spectrum of HDE 228766 indicates that the secondary is already evolving toward the WR phase, a process that could take 500,000 years before reaching a typical WR mass of (10 ) at a massloss rate of 10-5 yr-1.
In contrast, Rauw et al. (2002) classified the secondary of HDE 228766 as WN8ha, based on an estimated of 10Å for the He ii 4686 Å emission line, and a comparison of the observed spectra with those of WR 25 and WR 108. Yet, comparison with these objects could be biased since Gamen et al. (2006) reported that WR 25 is binary, while van der Hucht (2001) and Shara et al. (2009) mention that WR 108 is a probable WN + OB binary system. It should be noted that previous spectral classifications were not quantitative and were not based on disentangled spectra.
On the other hand, Rauw et al. (2002) discussed the interaction between the winds of the components of HDE 228766 from the identification of a weak variable emission feature in the H line. Analysis of this spectral feature led Rauw et al. (2002) to conclude that the interaction between the winds occurs in a region located near the surface of the primary star. From an Xray spectroscopic study, Rauw et al. (2014) concluded that the wind collision zone is between 0.67 and 0.71 of the secondary component, where is the orbital separation between the stars.
In this paper we aim at clarifying the evolutionary status of the secondary through the analysis of disentangled spectra free of artefacts. We use newly available observations of HDE 228766 to update the orbital parameters calculated for this system (§ 2), and to perform for the first time the spectral disentangling of the observed spectra applying the novel QER20 Package algorithm (§ 3). Based on the reconstructed spectra, we propose a quantitative spectral classification and discuss the evolutionary status of the stellar components (§ 4). Finally, we analyze the variable emission feature that we discovered in the H line and discuss the location of the emitting zone (§ 5).
2 Observed spectra and orbital parameters of HDE 228766
In this study we use 75 spectra of HDE 228766 collected between 1999 and 2021 at the Observatoire de Haute Provence (OHP), France, and the Observatorio Astronómico Nacional of San Pedro Mártir (SPM), México. Table 1 lists the spectral range, the spectral resolution and the number of observations (N) collected during each observing campaign.
The observations collected at the OHP, previously used in the Rauw et al. (2002) study, were obtained with the 1.52 m telescope equipped with the Aurélie spectrograph. In 1999, the detector was a Thomson TH7832 linear array with a pixel size of 13 m2. From 2000 on, the detector of the Aurélie instrument was replaced by a 2048 × 1024 CCD EEV 42-20#3, with a pixel size of 13.5 m2. We refer to Rauw et al. (2002) for an explanation of the procedure followed to reduce these data.
The SPM spectra were collected with the ESPRESSO spectrograph mounted on the 2.12 m telescope. The CCD detector was a E2V optical chip with 2048 × 2048 pixels of 13.5 m2. These spectra were reduced using the MIDAS echelle package. To remove the telluric lines we use the telluric task of IRAF and the spectral atlas of Hinkle et al. (2000).
| Campaign | Obs. |
|
|
N | ||||
|---|---|---|---|---|---|---|---|---|
| Jul - Aug 1999 | OHP | 4150 - 4920 | 0.05 | 20 | ||||
| Sep - Oct 2000 | OHP | 4450 - 4900 | 0.10 | 10 | ||||
| Sep - Oct 2000 | OHP | 6350 - 6769 | 0.12 | 9 | ||||
| Sep - Oct 2001 | OHP | 6350 - 6769 | 0.12 | 10 | ||||
| Jun 2014 | OHP | 4450 - 4900 | 0.10 | 6 | ||||
| Jun 2014 | SPM | 4150 - 7260 | 0.12 | 11 | ||||
| Aug 2015 | SPM | 4200 - 7270 | 0.12 | 3 | ||||
| Sep 2017 | OHP | 4450 - 4900 | 0.10 | 5 | ||||
| Sep 2021 | SPM | 3840 - 7500 | 0.12 | 1 |
2.1 The composite spectrum of HDE 228766
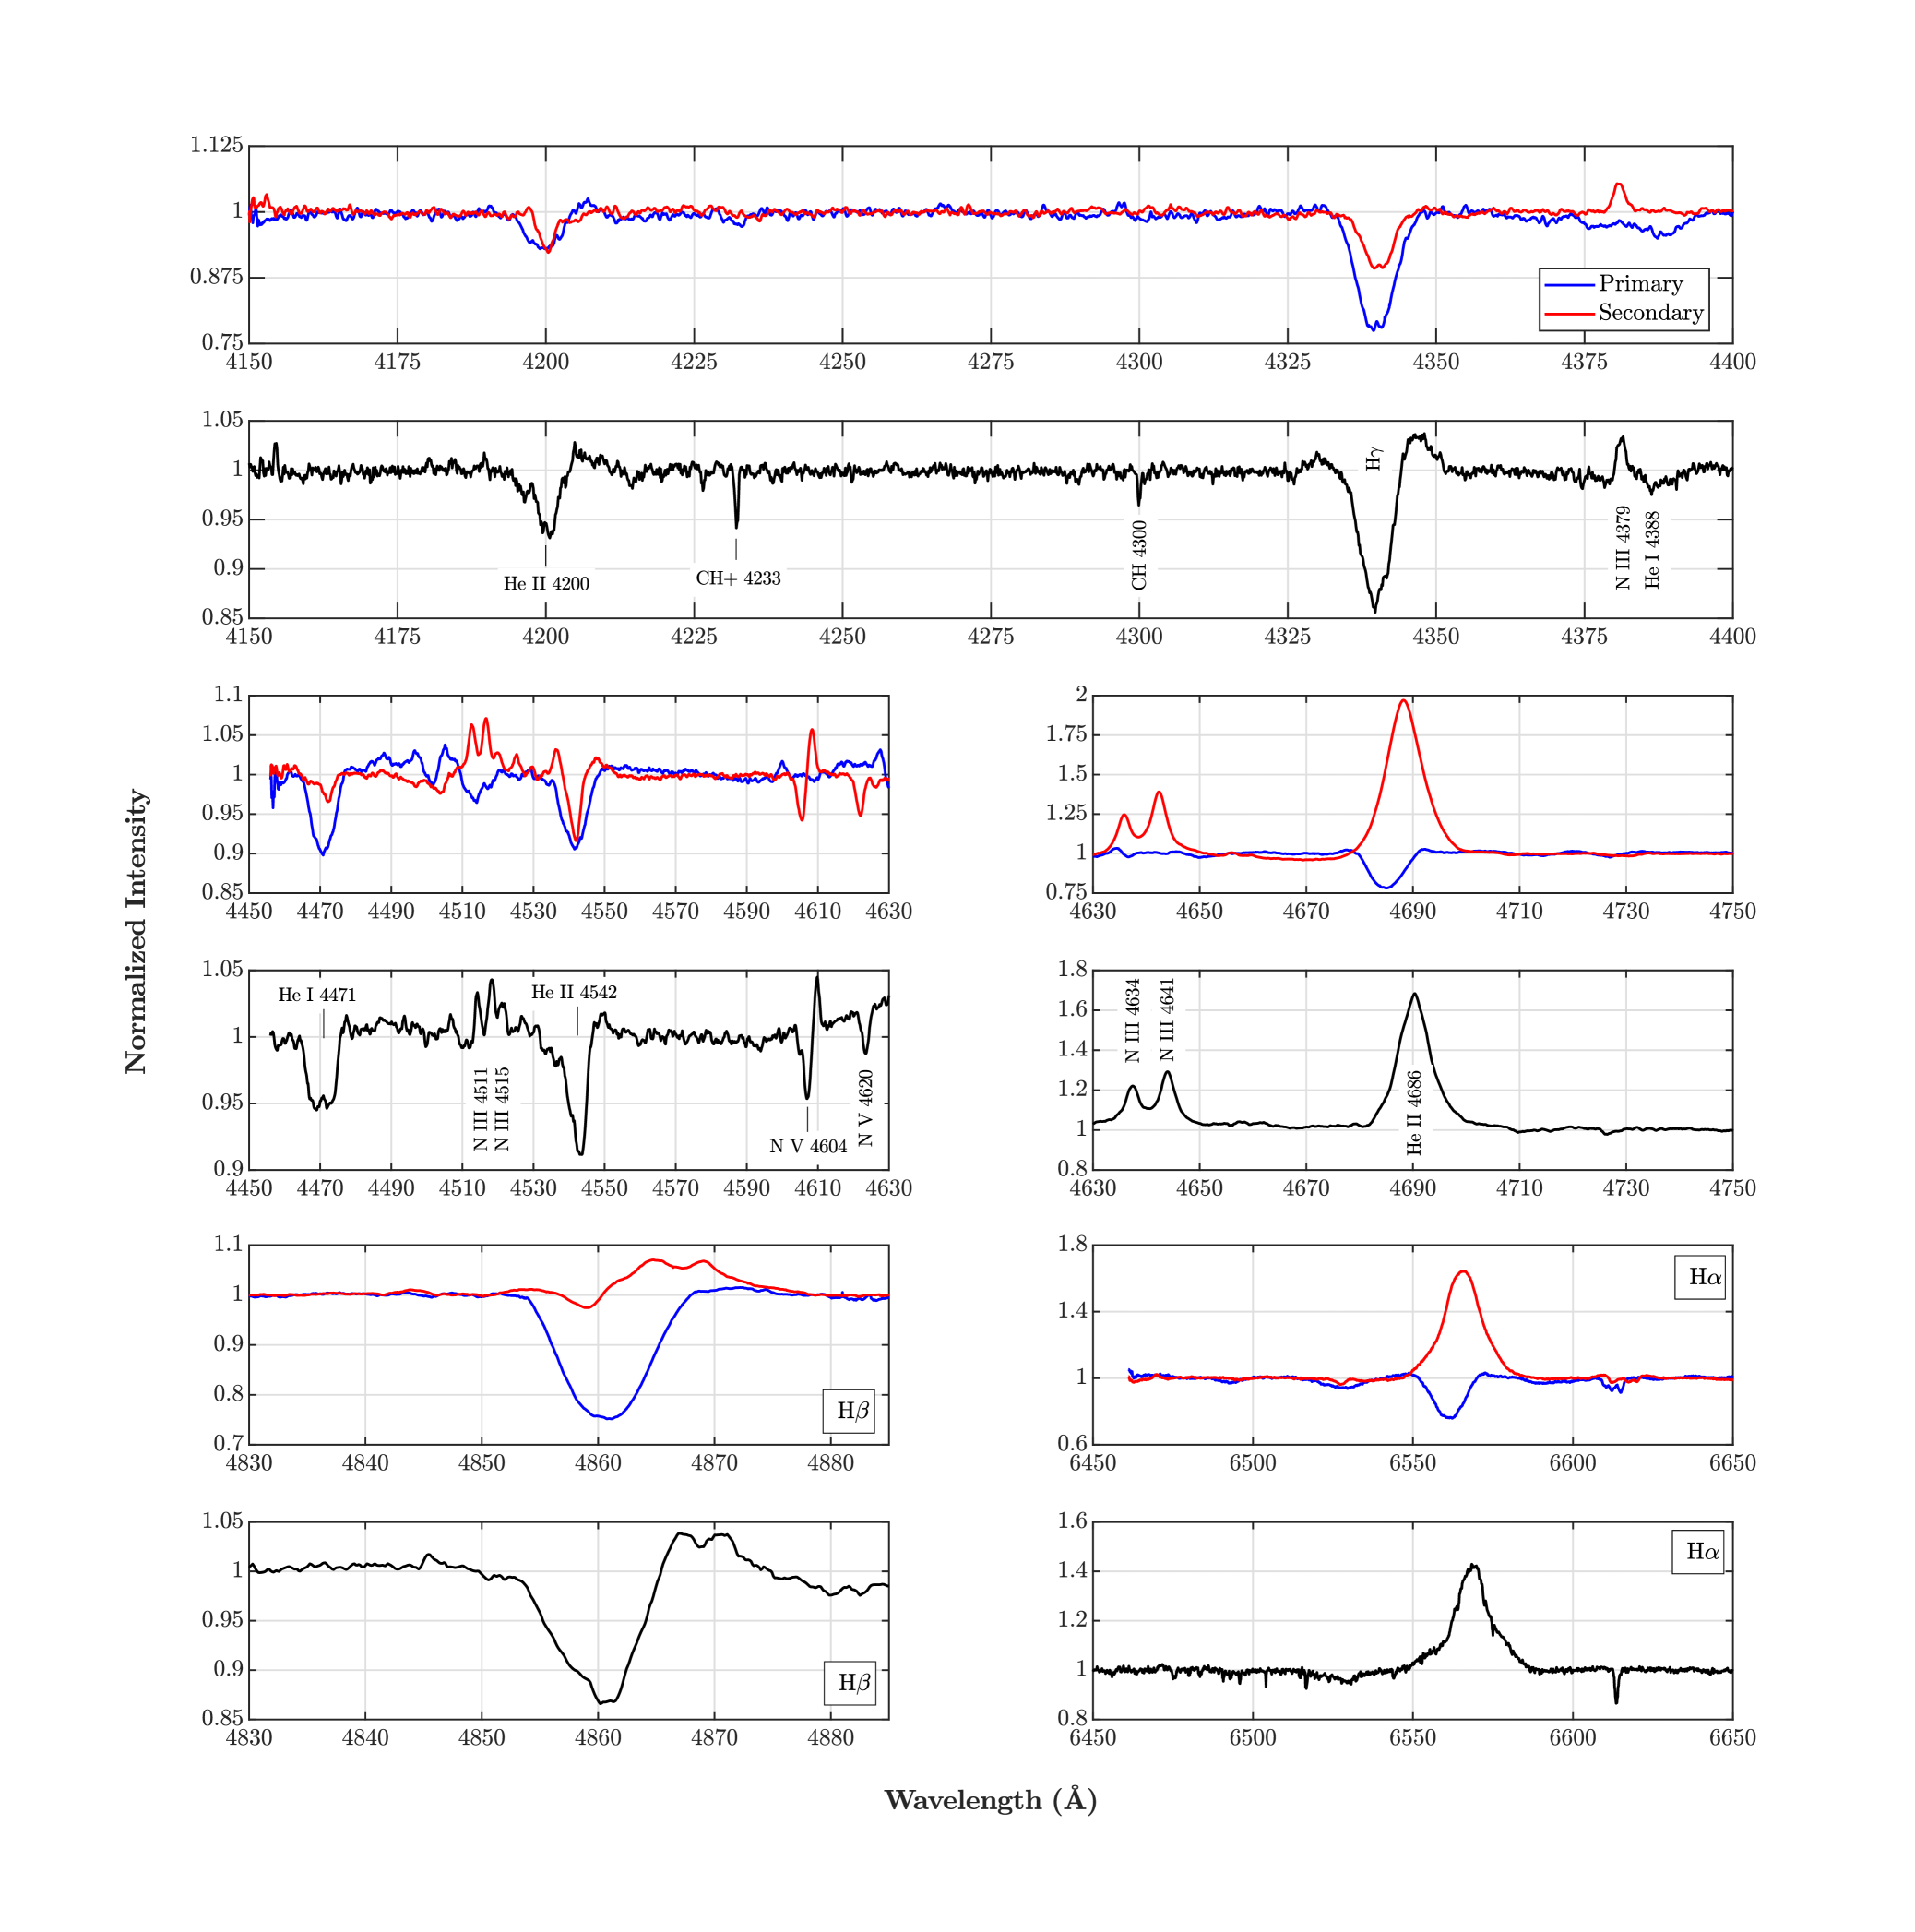
The composite spectrum of HDE 228766 contains the typical emissions of Of and WN stars at N iii 463441 Å and He ii 4686 Å (Figure 1, in black). The H line is also present in strong emission. The lines He ii 4200 Å, He ii 4542 Å and N v 4604 Å exhibit a relatively weak PCygni profile associated with the secondary wind, while in the H line this profile is much stronger. The clear splitting of the He i 4471 Å line by the Doppler effect demonstrates the binarity of the system. The observed spectra contain absorption lines of the interstellar medium due to CH+ at 4233 Å and CH at 4300 Å.
In the 20 observations from the 1999 campaign that include the H line, this line appears entirely in absorption over the entire orbital cycle. In contrast, emission wings located on both sides of the H absorption are observed in all our spectra between 2014 and 2021. Figure 2 shows the H line averaged over the 1999 campaign (green) and over the 2014 campaign (orange).
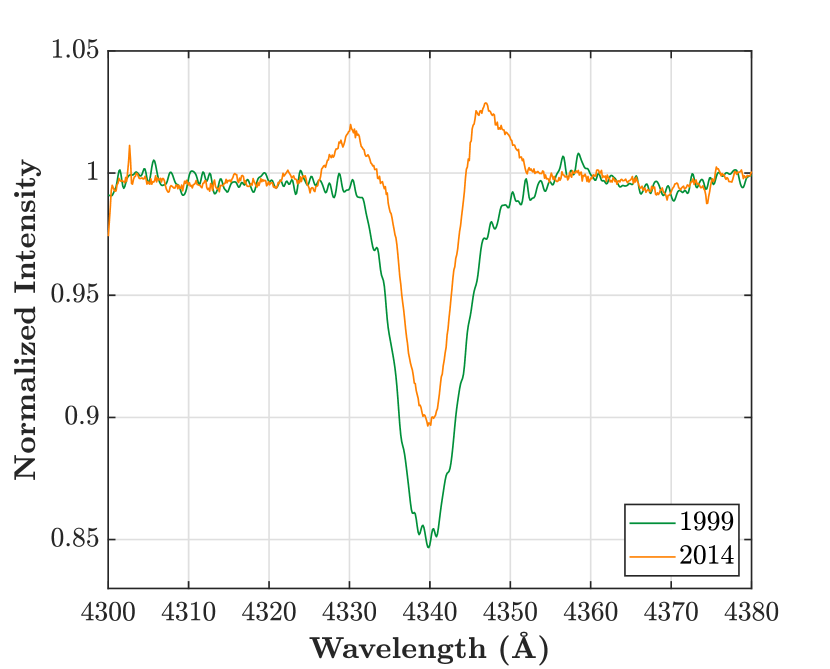
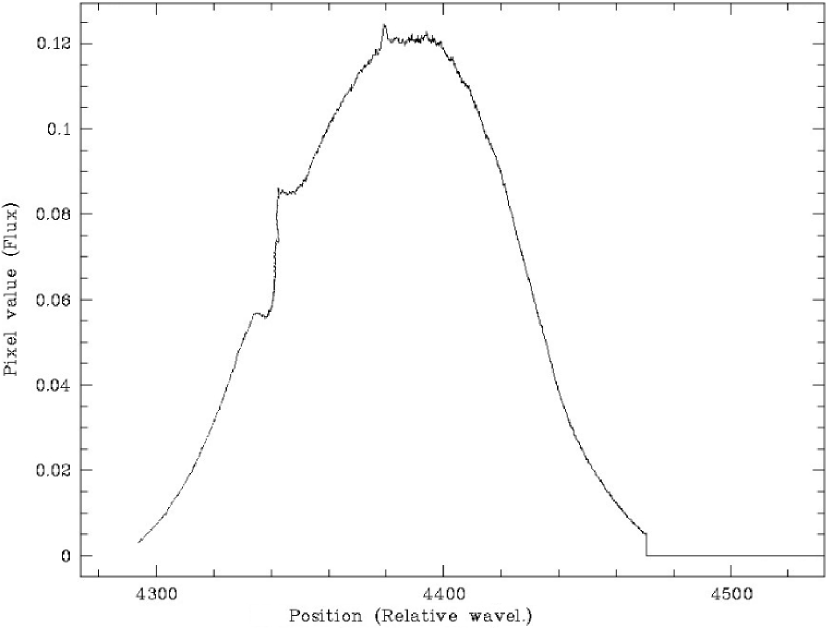
Figure 3 shows the appearance of one of the spectra collected at SPM during the 2014 campaign, before correcting the blaze and fitting the continuum. In this initial step of the reduction of the spectra, the existence of the emission wings that we discovered in the H line is evident, which allows us to infer that they are not an artefact of the reduction process.
In all our spectra from 2014 this excess emission is clearly visible at H , as it contrasts with the absorption profile observed previously. It is probable that there are excess emissions in the H and/or H spectral lines, but these are not clearly identified in the observations due to the strong emissions from the secondary. In fact, Rauw et al. (2002) reported a weak emission feature in H that we do not clearly identify in all observations (as does occur in the case of H ). In § 5 we analyze this variable emission feature in H line and discuss its possible interpretation.
2.2 Orbital parameters of HDE 228766
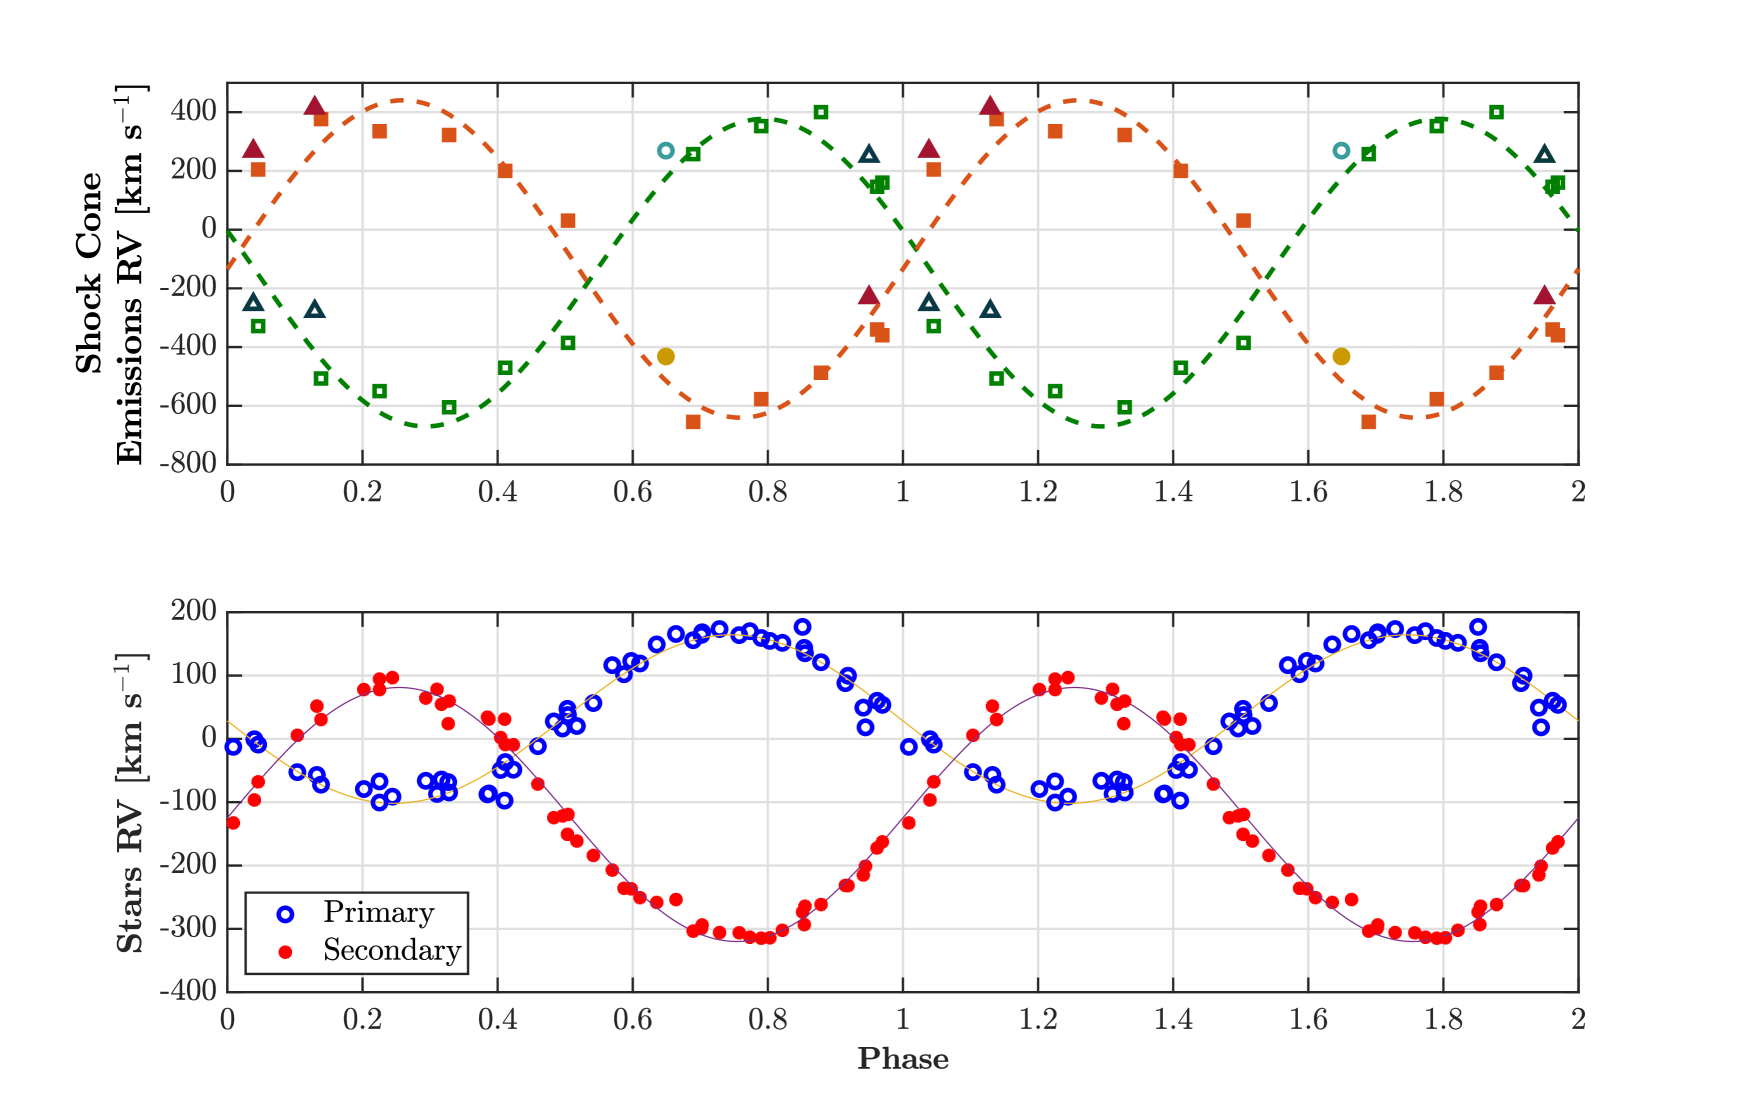
Figure 4 illustrates the radial velocity for the primary (blue) and secondary (red) components, measured from the Doppler shift of the He ii 4542 Å line. The set of collected observations adequately covers the phases of the orbital cycle, which is essential for the spectral disentangling (§ 3). Phase 0 corresponds to the conjunction phase, with the secondary component located between the primary star and the observer.
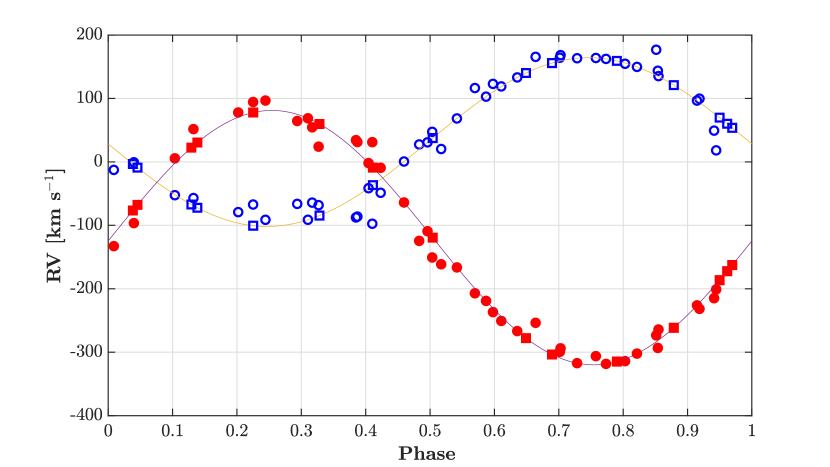
We use the new observations from the 2014 – 2021 (SPM) campaigns to update the orbital parameters of HDE 228766 calculated by Rauw et al. (2002). The orbital solution was computed using the radial velocities measured on the He ii 4542 Å line (Figure 4) and the LOSP111LOSP is available in: https://www.stsci.edu/~hsana/losp.html program (Liège Orbital Solution Package), in its version for the SB2circular case (Rauw et al., 2000; Sana et al., 2006), with the period fixed at 10.7426 days and eccentricity equal to zero (Rauw et al., 2002). We also compute the orbital solution using the Binary Star Solve222Binary Star Solve is available in: https://github.com/NickMilsonPhysics/BinaryStarSolver program (Milson et al., 2020), developed in Python. Table 2 compares the orbital parameters obtained with these two methods, as well as those presented in Table 3 of Rauw et al. (2002). The results are consistent with each other. However, the error bars given by Binary Star Solve are much smaller than those obtained using LOSP. This is because, for the calculation of the errors, LOSP uses the classical error propagation theory, while Binary Star Solve uses the inverse of the Hessian matrix as the covariance matrix to calculate likelihood estimates.
| Orbital Parameter | Symbol | This Work LOSP | This Work Binary Star Solve | Rauw et al. (2002) | ||||||
|---|---|---|---|---|---|---|---|---|---|---|
| Primary | Secondary | Primary | Secondary | Primary | Secondary | |||||
|
10.7426 (fixed) | 10.7426 (fixed) | 10.7426 (fixed) | |||||||
|
0 (adopted) | 0 (adopted) | 0 (adopted) | |||||||
|
19481.530 0.02 | 19481.530 0.02 | 1822.052 0.305 | |||||||
|
31.5 4.0 | -119.2 5.0 | 32.0 0.2 | -119.8 0.2 | 31.4 7.3 | -119.0 8.2 | ||||
|
134.0 4.9 | 200.5 7.3 | 133.0 0.3 | 201.0 0.3 | 133.7 7.6 | 200.2 10.9 | ||||
|
28.4 1.0 | 42.6 1.5 | —– | —– | 28.4 1.6 | 42.5 2.3 | ||||
|
2.7 0.3 | 9.0 1.0 | 2.6 0.1 | —– | —– | —– | ||||
|
25.0 2.1 | 16.7 1.3 | —– | —– | 24.8 1.8 | 16.6 2.4 | ||||
|
1.5 0.1 | —– | 1.50 0.11 | |||||||
|
29.4 1.1 | 24.5 0.9 | —– | —– | 29.3 1.5 | 24.4 1.2 | ||||
Among the results of the orbital solution of this binary, the high mass ratio of the system and the high minimum masses of the stellar components stand out. The mass ratio could be explained by an episode of mass transfer from the secondary to the primary due to a Roche lobe overflow episode. On the other hand, the high minimum masses, added to the low orbital period of the system and the proximity between the stars, allowed Rauw et al. (2002) to infer the existence of a stellar wind shock region that could produce relatively intense optical and Xray emission. In fact, Rauw et al. (2014) found that the Xray spectra of this system exhibit variations that are consistent with what is expected for a windwind collision. Yet, the only evidence of this collision that Rauw et al. (2014) found in the optical spectra is reduced to a weak excess of variable emission in the H line. This situation makes even more relevant our discovery of the relatively intense asymmetric variable emission wings presented by the H line in the spectra of the 2014 – 2021 campaigns, since it could be new evidence of the interaction between the stellar components of this system (§ 5).
3 Spectral disentangling
As seen in Figure 1, the spectra of the stellar components of HDE 228766 are strongly blended, which greatly hinders spectral disentangling. Furthermore, by applying the widely used shiftandadd spectral disentangling technique proposed by Marchenko et al. (1998), huge artifacts caused by the wide and intense emission lines of the secondary component overshadow the relatively weak absorptions of the primary (this may explain why no attempts to disentangle the spectra of this system are found in the literature). These artifacts consist of broad spurious wings, located symmetrically with respect to the wavelength of the spectral lines. In the case of the primary component, these wings appear in absorption, while in the spectrum of the secondary they are observed in emission. Quintero et al. (2020) presents a detailed analysis of the shortcomings of the shiftandadd method.
This difficulty in disentangling the spectra of HDE 228766 explains why until now the evolutionary status of the stars belonging to this system has not been established from a quantitative analysis of the individual spectra of the components.
In Quintero et al. (2020) we introduced a novel spectral disentangling method, known as the QER20 Package, ideal for binary systems with low Doppler shifts and wide and intense spectral lines. This package aims at correcting the artifacts produced by the shiftandadd technique and obtaining reconstructed spectra which are free of artifacts and thus yield more reliable line profiles and fluxes (see Quintero et al. (2020) for a detailed description of the QER20 Package algorithm and the validation tests we performed using synthetic and real spectra). As described below, we have expanded the original version of the QER20 Package, which we successfully applied to the 9 Sgr binary system in Quintero et al. (2020), so that it can handle a wider variety of cases, given that each binary presents new challenges.
The fundamental principle of the QER20 Package consists in considering the integrated flux of a given spectral line as a free parameter. During each iteration, the QER20 Package looks for artifacts in the reconstructed profiles, and redistributes the flux of these artifacts between the reconstructed profiles of the two stars. However, the observed spectra of HDE 228766 proved to be a challenge for the QER20 Package, because the emission features of the PCygni profiles of the He ii 4200 Å, He ii 4542 Å, N v 4604 Å and H lines can be treated as artifacts by the algorithm. In addition, the strong and wide emissions in the N iii 463441 Å and He ii 4686 Å lines produce strong and wide absorption artifacts, so the spectral window must be large enough for the QER20 Package to correct the artifacts without distorting the spectrum. This in turn increases the demand for computational resources, which made it necessary to further optimize the algorithm.
Figure 1 presents the reconstructed spectra for the stellar components of HDE 228766 returned by the QER20 Package, in the spectral range 4150 4750 and in the H and H lines. For the case of the He ii 4200 Å, He ii 4542 Å, N v 4604 Å and H lines, we adjusted the algorithm in such a way that it only corrected the artifacts produced on the blue side of the main absorption. Thus, the emission feature of the PCygni profile of these lines is not mistaken for an artifact.
Massey & Conti (1977) deduced approximately equal brightness for the components of HDE 228766 ( mag) by estimating the ratio of the intensities of the H8 and H9 spectral lines. From the analysis of the He i 4471 Å and He ii 4542 Å lines in observations corresponding to quadrature phases, Rauw et al. (2002) also concluded that both components are of similar brightness, with . These authors state that the overluminosity of the secondary could be due to the fact that the evolution of the whole system would have been influenced by mass exchange. We adopt this brightness ratio to estimate the contribution of each component to the total flux: 43.1% for the primary and 56.9% for the secondary. The reconstructed spectra presented in Figure 1 are rectified by these contributions.
Neither of the two reconstructed spectra exhibits the variable emission wings of the H line that we identified in the composite spectra. This is because, during each iteration, the QER20 Package algorithm corrects the observations for the radial velocities of the stellar components, so any spectral features that do not follow this same pattern of velocities are diluted over the entire spectral window (this issue is discussed in Section § 5).
Our reconstructed spectra show that the H line of the primary is in absorption, while that of the secondary presents a clear PCygni profile. Meanwhile, the H line appears in absorption for the primary and in strong emission for the secondary. The spectral line set N iii 463441 appears in emission in both components, very weak in the primary and strong in the secondary. The He ii 4200 Å line appear in absorption in the spectra of both components, something typical of O stars, although this line presents an asymmetry in the secondary star and a weak PCygni profile in the primary.
Contrary to Hiltner (1951) and in agreement with Massey & Conti (1977), our spectral disentangling shows that the secondary of HDE 228766 has its own typical Ostar absorption lines in the 4450 4630 Å window. These characteristic lines are He i 4471 Å and He ii 4542 Å.
Rauw et al. (2002) mention that in the observed spectra, the He ii 4542 Å line presents a blue shift that could be the result of the strong wind of the secondary star. The spectral disentangling allows us to infer that the blue shift detected by Rauw et al. (2002) in this line is due to the weak asymmetric emission wings present in the reconstructed spectrum of the secondary, since the position of the maximum absorption remains at 4542 Å. These emission wings are not artifacts, as they appear in the reconstructed spectrum of the secondary even though the QER20 Package applies the artifact correction strategy at each iteration. Moreover, the red wing is present in all observations (Figure 1), while the blue wing appears in most of the observations. These emission wings in the secondary spectrum could be due to the superposition of photospheric absorption with the broad emission from rotating stellar wind material.
4 Evolutionary status
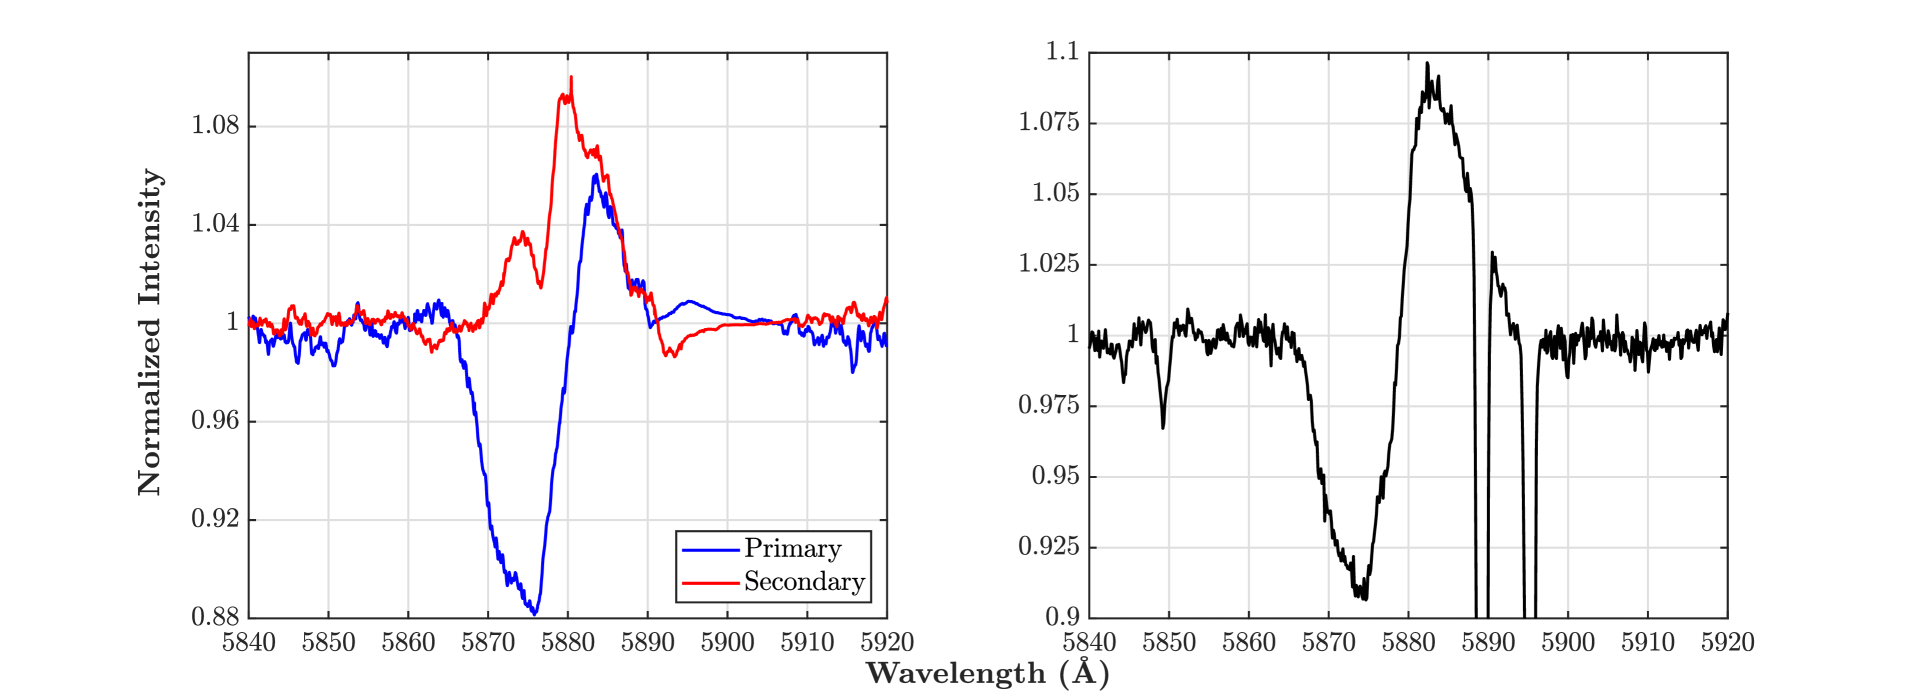
Right: observation with the highest flux in the absorption feature of the PCygni profile. The intense and narrow absorptions at 5890 Å and 5895 Å correspond to the Na i of the interstellar medium (removed for disentangling).
The reconstructed spectra of the stellar components of HDE 228766 allow us to perform a quantitative spectral classification of these stars for the first time. For that, we use the quantitative criteria of Conti & Alschuler (1971), based on the flux ratio of the He i 4471 Å and He ii 4542 Å lines (see also Mathys (1988), revisited by Martins (2018)).
For the primary star, , therefore this component is classified as O7.5. On the other hand, 1.44 Å, and according to Martins (2018) stars with 0.6 Å belong to luminosity class V with the qualifier ((f)). Furthermore, Sota et al. (2011) and Martins (2018) state that the qualifier ((f)) is assigned in the case of weak N iii 463441 Å emission and strong He ii 4686 Å absorption, conditions that are fulfilled in the reconstructed spectrum of the primary component of HDE 228766. Finally, Arias et al. (2016) state that the "z" characteristic is assigned when . For the primary component, . In conclusion, the primary star of HDE 228766 has the spectral classification O7.5 V((f))z.
The "z" characteristic was introduced by Walborn & Blades (1997) to identify Otype stars belonging to luminosity class V and exhibiting the He ii 4686 Å line in strong absorption. Vz stars are the least luminous and, consequently, the closest to the zeroage main sequence (ZAMS) within the Otype stars. Although the quantitative studies of Sabín-Sanjulián et al. (2014) reported numerous exceptions to this hypothesis, Arias et al. (2016) found that almost all OVz stars from the Galactic OStar Spectroscopic Survey (GOSSS) are associated with very young clusters, whereas clusters without Vz objects are older. These facts add weight to the interpretation of the "z" characteristic as a signature of youth.
Based on a qualitative analysis of the blended spectra, Rauw et al. (2002) suggest that the primary is the least evolved component of the binary HDE 228766. These authors explain this situation by a rejuvenation of the primary after a Roche lobe overflow (RLOF) of the secondary star. Our discovery of the "z" characteristic was made possible by our efficiency QER disentangling algorithm. Together with the mass ratio and the minimum masses yielded by the orbital solution (see Table 2), it confirms the hypothesis of the mass transfer episode.
However the evolutionary status of the secondary is clearly the most salient question regarding HDE 228766. Is it a WolfRayet star as suggested by Rauw et al. (2002)? This question bears on all other key aspects: the wind-wind interactions, the mass transfer and the rejuvenation of the primary.
In the literature we find five criteria to differentiate between Of and late WN (WNL) spectral types:
(i) Equivalent widths of the He ii 4686 Å and He i 5876 Å lines.
According to Crowther & Smith (1997), Of stars are delimited by 1 and 0.6. Although the QER20 Package yields an adequate reconstruction of He ii 4686 Å (see Figure 1), unfortunately He i 5876 Å is not included in the spectral window of the OHP observations. Therefore, we only have the 15 observations from the 2014 – 2021 SPM campaigns to disentangle this line. Nevertheless, we perform the separation of these 15 spectra using the QER20 Package in order to obtain an approximation to the real aspect of the He i 5876 Å line profile in the spectrum of the secondary, and an upper limit for the flux of this line.
In the observed spectra of HDE 228766, the He i 5876 Å line profile corresponds to the blending of the absorption of the primary star with the PCygni profile of the secondary. Therefore, we adjusted the QER20 Package algorithm so that the artifact correction is only performed on the blue side of the spectral line. Thus, we eliminate the risk that the emission feature of the PCygni profile is mistaken for an artifact. The left panel of Figure 5 presents the reconstructed spectra for the stellar components of HDE 228766 in the He i 5876 Å line, returned by QER20 Package. For comparison, the right panel of Figure 5 shows the observation with the highest flux in the absorption feature of the PCygni profile. Before disentangling we remove the strong Na i interstellar lines at 5890 Å and 5895 Å.
The absorption feature in the reconstructed spectrum of the secondary and the strong PCygni profile in the primary are indications that disentangling is not effective in this line due to the low number of observations. Yet, this reconstruction is useful to estimate the upper limit of the flux of the He i 5876 Å line in the secondary component: Å and . Now, if we consider the extreme case in which the entire flux of the observation in the right panel of Figure 5 is attributed to the secondary component, we would obtain Å and .
On the other hand, from the spectrum of the secondary component reconstructed by the QER20 package (Figure 1), we obtain Å and . This result, and our maximum limit for , are below the maximum limits established in criterion (i), demonstrating that the secondary of HDE 228766 belongs to the spectral type Of.
(ii) Maximum normalized intensities of the emission features of the PCygni profiles of the H , H and He i 5876 Å lines.
In WNL stars, the emission features of the PCygni profiles of the H , H and He i 5876 Å lines have much stronger maximum normalized intensities than mid or lateOf stars: , and , respectively (Crowther & Bohannan, 1997). In contrast, the maximum normalized intensities of these lines in the reconstructed spectrum of the secondary star of HDE 228766 are well below these values: H +0.07, H 0.0 and He imax 5876 Å +0.18.
(iii) Maximum normalized intensity of the H line.
Furthermore, WNL stars exhibit strong H emission with maximum normalized intensities of (Crowther & Bohannan, 1997), whereas the reconstructed spectrum of the secondary component of HDE 228766 shows a maximum normalized intensity of +0.67 for this line.
(iv) Presence of PCygni profile in He ii 4542 Å or blue shift if this line is only in absorption, in combination with 3 Å and 12 Å.
Bohannan & Crowther (1999), mention that an Of star should be reclassified as WNL if its spectrum meets any of the following conditions: "1. If He ii 4542 Å has a clear PCygni profile, or if it is only in absorption and has a clearly blue-shifted central wavelength of more than 50 km s-1.". In the secondary star of HDE 228766, the He ii 4542 Å line does not have a PCygni profile but rather faint emission wings. Furthermore, although this line shows a slight asymmetry towards the blue, the wavelength at which the maximum absorption occurs remains at 4542 Å. "2. If 3 Å, with He ii 4686 Å in emission.". This condition is not fulfilled in the secondary star of HDE 228766, because although He ii 4686 Å is in emission, Å. "3. If 12 Å.". This condition is not fulfilled in the secondary star of HDE 228766 since Å.
(v) He i 4471 Å line profile.
Crowther & Walborn (2011) recommend keeping the Of classification in mid and lateO stars if the He i 4471 Å line is in absorption, which is the case of the secondary star of HDE 228766. Likewise, Crowther & Bohannan (1997) and Crowther & Walborn (2011) indicate that the stars WN89 present a very strong PCygni profile in the He i 4471 Å line, while the mid or lateOf stars show this line in absorption, as happens with the secondary component of HDE 228766.
Since the application of the five criteria on the reconstructed spectrum of the secondary component of HDE 228766 unanimously confirms that this star has the Of spectral type and not the WNL, we can now perform its quantitative spectral classification. According to Conti & Alschuler (1971) and Martins (2018), the ratio yields an O6 type. Since Å, the secondary component of HDE 228766 belongs to luminosity class Ia with the qualifier f. Furthermore, Sota et al. (2011) state that the qualifier f is assigned when the N iii 4634-41-42 Å and He ii 4686 Å lines are in emission above the continuum. In conclusion, the secondary component of HDE 228766 is O6 Iaf.
Even though our spectral analysis places the secondary component of HDE 228766 at a preWolfRayet evolutionary stage, several features of the reconstructed spectrum clearly indicate that this star is already in transition to the WN stage, namely the emission features of the PCygni profiles of the H and He i 5876 Å lines.
5 H variable emission
As mentioned in § 2.1 a variable emission feature is present at H in all our 11 spectra from the 2014 campaign, whilst it is not seen in the 1999 spectra (Figure 2). This feature was also observed in each of our three 2015 spectra, as well as in our 2021 spectrum.
In WR + O binaries, the variable emission associated with their colliding winds is generally observed as an excess emission superposed to the strong WR emission lines. This typically occurs in the He ii 4686 line, as is the case with the WN + O systems WR 21, WR 31, WR 47 (Fahed & Moffat, 2012) and WR 139 (Flores et al., 2001); or in the C iii 5696 and C iv 5808 lines, as is the case with the WC/WO + O binaries WR 9, WR 30a (Bartzakos et al., 2001), WR 42 (Hill et al., 2000), WR 48 (Hill et al., 2002) and WR 79 (Lührs, 1997).
In the case of HDE 228766 (classified in this work as O7.5 V + O6 Iaf), the H line is in absorption both in the composite spectra and in the reconstructed spectrum of the individual components (Figure 1). This makes it difficult to analyze the variable emission feature, as it is blended with the main absorption.
To overcome this difficulty and allow a detailed analysis of the variable emission observed since 2014 in the H line, we need to subtract the absorption feature. This can be done because the 1999 spectra are in pure absorption.
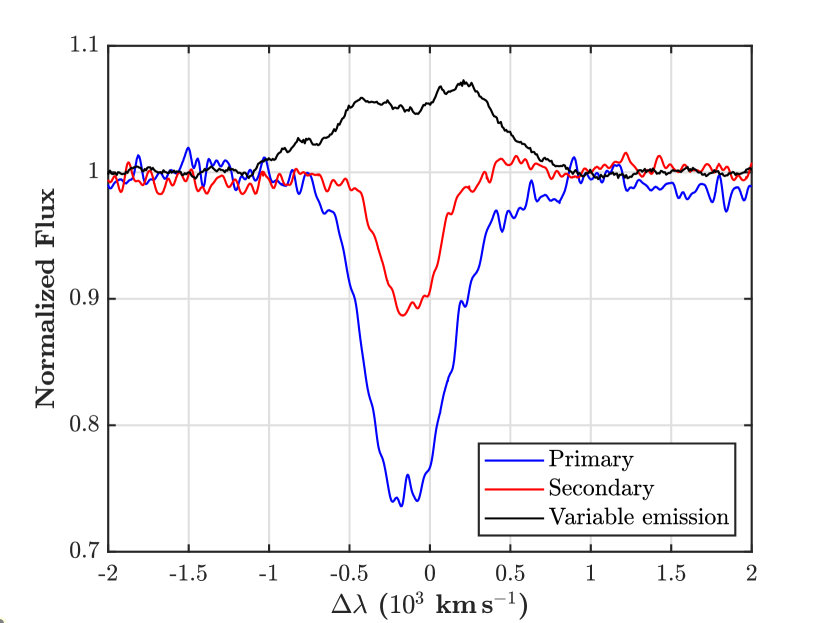
To reduce noise and to perform the subtraction at the exact orbital phases of the 2014 – 2021 observations, we apply again our QER20 disentangling algorithm around the H line, but this time using only the 20 observations of 1999. Having thus obtained the averaged absorption spectrum of each stellar component (red and blue spectra in Figure 6), these can be subtracted, after the proper redshift correction, from each of the 15 observations of the 2014 – 2021 campaigns.
Figure 6 shows in black the average spectrum after subtraction. Note that the average of the variable emission feature ranges from to 970 km s-1, with a slight decrease in intensity at the central wavelength. In addition, the emission flux is considerable compared to the absorption flux (presumably from the stellar components). This is evidence that HDE 228766 is a particular case, since in most of the binaries showing windwind collisions reported in the literature, the excess emission originating in the interaction between the winds has a flux much lower than the stellar emission.
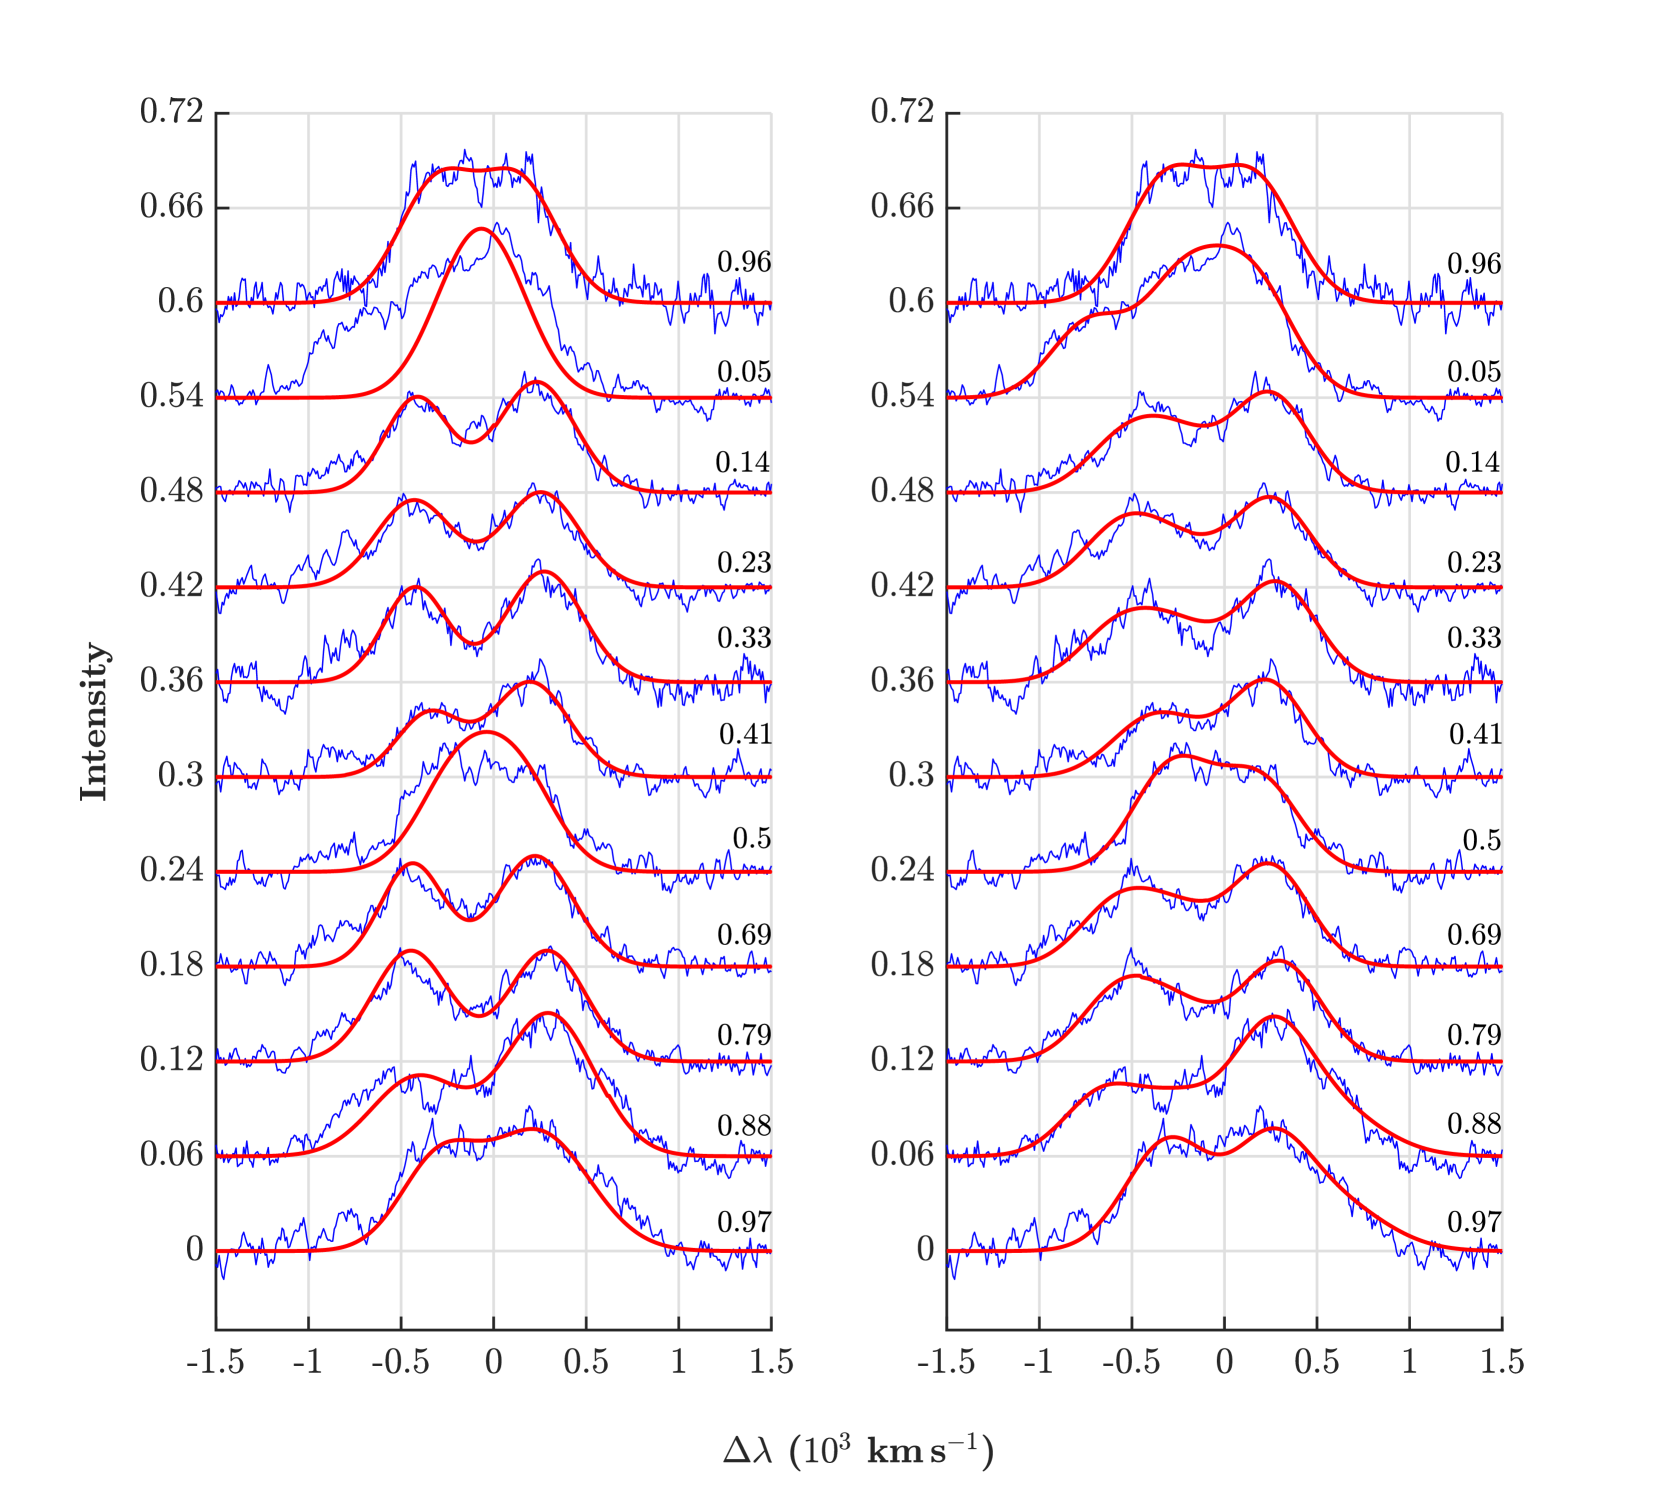
In order to establish the possible origin of this emission, in a first approach, we fit the 15 emission 2014 – 2021 spectra with two Gaussian curves, fixing their width at 900 km s-1, allowing their flux to vary up to 10, and leaving the radial velocity associated with the Doppler shift as a free parameter. The left panel of Figure 7 shows that a rather good fit is obtained for most phases observed in 2014. Yet it is clear that two Gaussians are not capable to reproduce the observations at phases near conjunction (notably phases 0.05 and 0.5).
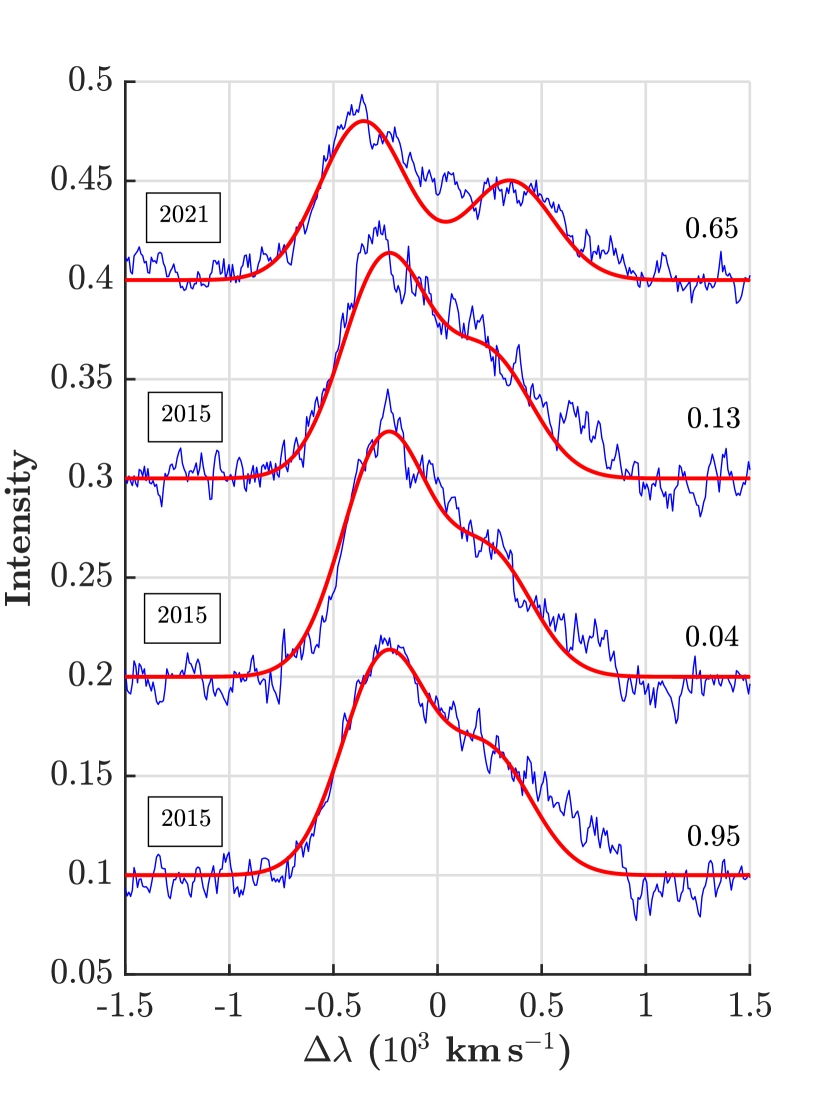
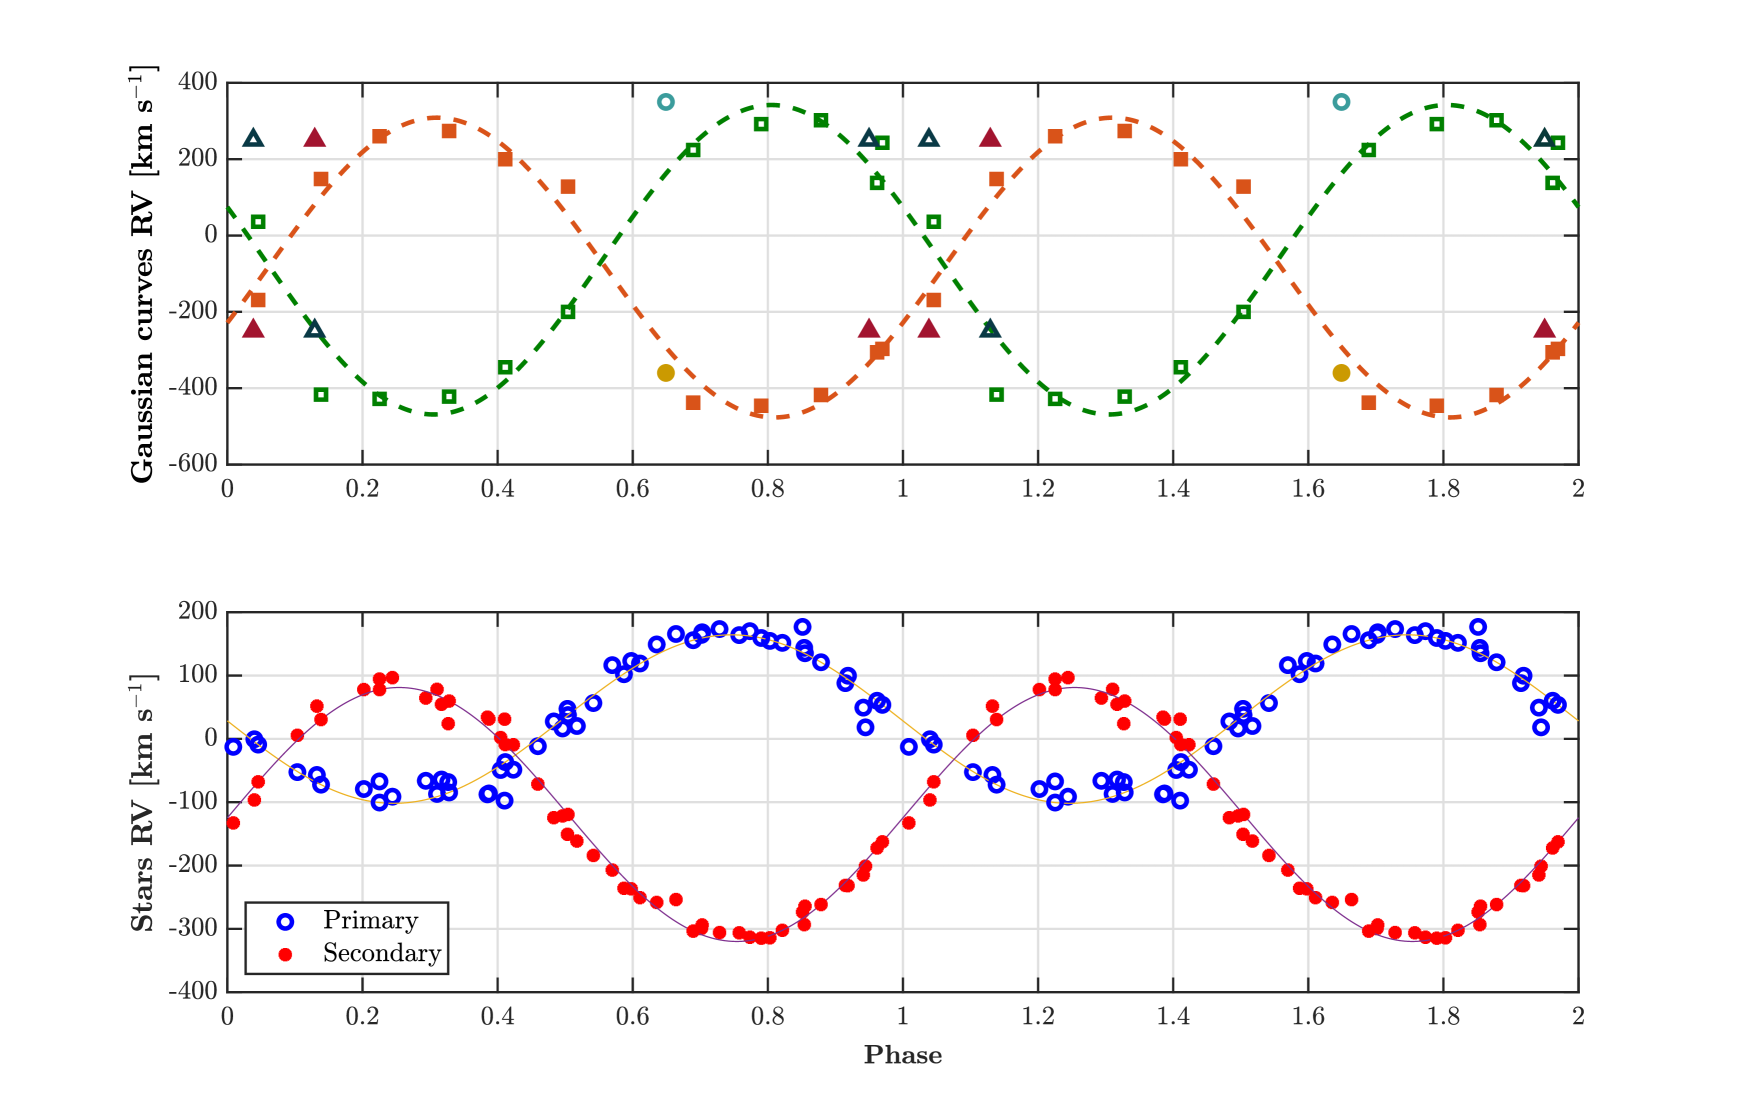
If the gas represented by these two Gaussians follows the orbital motion, its radial velocity must show a sinusoidal curve because the orbit is circular. This is indeed what we find for the 2014 spectra (Figure 8). However neither the 2015 observations at phases 0.04 and 0.13 nor the 2021 observation follow this sinusoidal curve. On the contrary, we find that the best fit for each of the three 2015 spectra is obtained with two Gaussians centered at +240 and -240 km s-1. This seem to indicate that they are produced by gas maintaining a constant Doppler shift, despite the fact that these observations correspond to different phases of the orbital cycle (Figure 9).
Thus our simple model of two Gaussians following the orbital motion breaks down because of (1) the inadequate fit of the line profile at phases near conjunctions and (2) the fact that the three 2015 observations are best fitted with two Gaussians having fixed radial velocities. This lead us to infer that, superposed on the two emissions produced by the windwind collision (which follow the orbital motion), there is a stationary emission coming from a spatially extended zone.
Consequently, we proceed to repeat the fitting process but now using four Gaussians: two with fixed radial velocities centered around -240 and +240 km s-1, and two having free velocities. Again we set the width at 900 km s-1 and allow a maximum variation of 10 in the flux. This implies that the gas producing the emission would occupy a region that spatially spans beyond the orbits of the stars, since in velocity space the primary and secondary components have velocities of 134 and 200.5 km s-1, respectively (see Table 2). The right panel of Figure 7 shows that the new fit with four Gaussians reproduces much better the observations. This seems to indicate that there are four components producing the H emission: two are stationary and two are moving.
Figure 10 presents the result obtained by subtracting the two fixed radial velocity Gaussians from the variable emission feature present in the 2014 observations. After removing the two stationary emissions, two emissions with Doppler shifts that change in phase with the orbital motion are clearly identified (Figure 11).
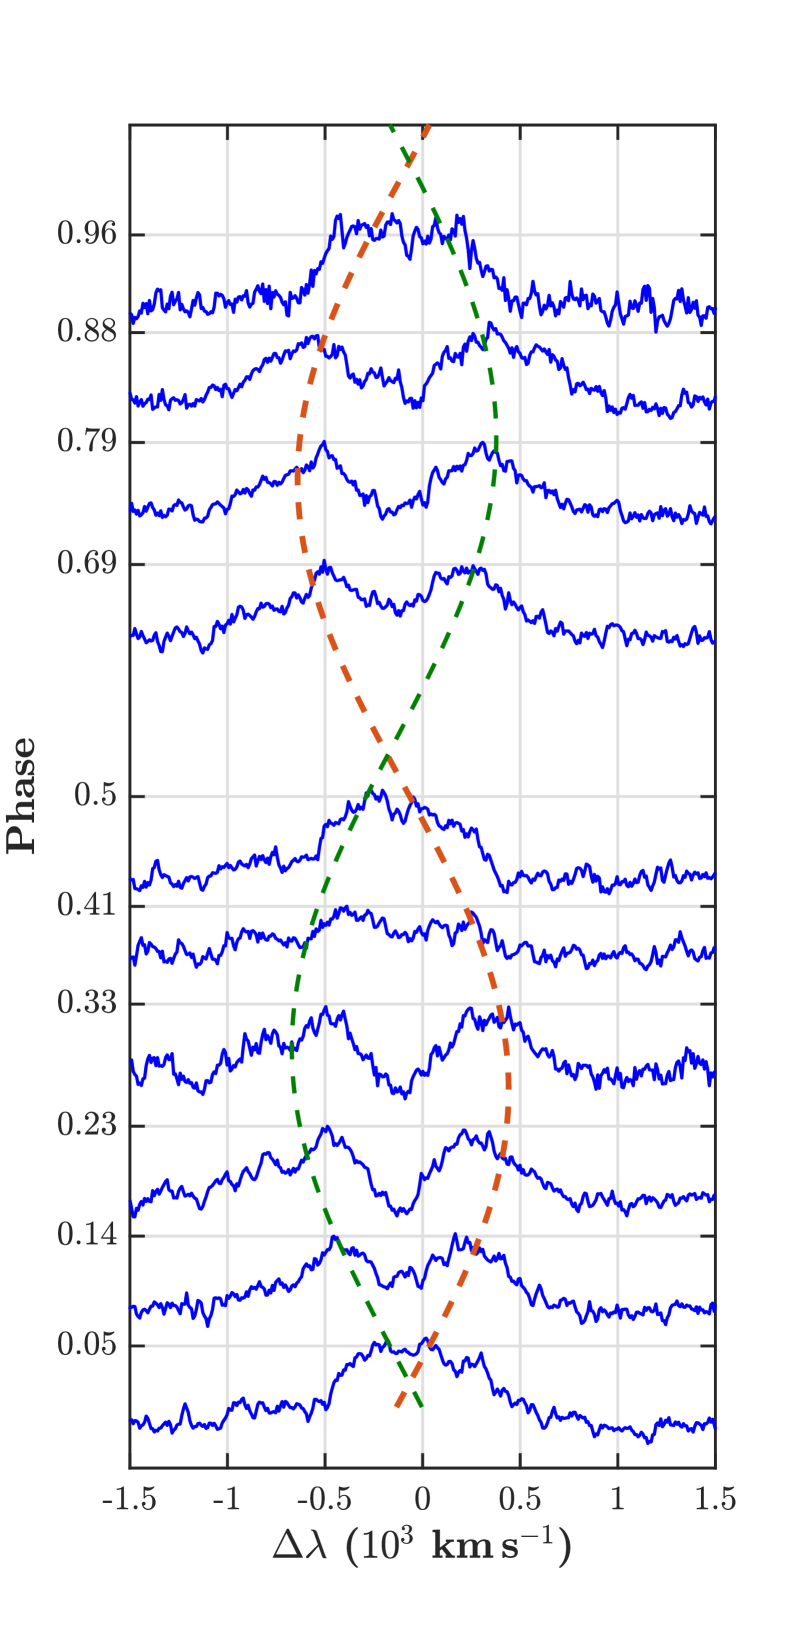
Our analysis suggests that the emission zones are spatially extended around the stellar components, which supports our hypothesis that the wind shock cone is insufficient to explain the excess emission we discovered in the observations of the 2014 to 2021 campaigns. In fact, this region extends far beyond the orbit of the secondary. This explains why the average of the variable emission feature has a width ( km s-1, Figure 6) greater than the semiamplitude of the radial velocity curve of this component (200.5 km s-1, Table 2).
What could be the origin of these emission zones? WR O star binaries have a highly nonconservative evolution (Petrović, 2020). In this scenario, when mass is transferred from the donor to the massgainer, either not all of the transferred matter ends up on the mass gainer or the mass gainer immediately ejects some of it (Langer, 2022). Our hypothesis is that the binary HDE 228766 undergoes a nonconservative evolution. Thus, a Roche lobe overflow episode produced the rejuvenation of the primary component and led to the current mass ratio and minimum masses. During the mass exchange, part of the material ended up distributed in a spatially extended region around the stellar components, producing the excess emission that we discovered in the H line.
6 Conclusions
Using new observations of the massive binary HDE 228766, we update the orbital parameters of this system. We report for the first time a variable emission feature in the H line, present during our 2014 to 2021 observing campaigns. We apply to this binary our novel QER20 disentangling Package, yielding the first reconstructed spectra of the stellar components. These enable us to perform a quantitative spectral classification of the components for the first time: O7.5 V((f))z for the primary component and O6 Iaf for the secondary. The "z" characteristic in the classification of the primary star indicates that the secondary is the most evolved component, which supports the hypothesis that the whole system could have been influenced by mass exchange. This hypothesis is consistent with the high mass ratio of the system, the elevated minimum masses of the stellar components and the overluminosity of the secondary. In addition, the reconstructed spectrum of the secondary star contains clear indications that it is in an early stage of transition to the WN state: relatively weak emission features of the PCygni profiles of the H and He i 5876 Å lines.
We also conclude that the variable H emission is composed of at least four independent features. Two of them are stationary and the other two follow the orbital motion. Thanks to the QER20 Package we are able to isolate this emission for analysis. This reveals the existence of a spatially extended emission zone that has not been reported so far. This zone could be the result of an episode of enhanced mass loss in a nonconservative evolution scenario; either from the secondary toward the primary or from the whole system.
We have started an observing program to monitor the mediumterm behavior of the variability of the H line, and possibly to detect variability in other lines. This will enable a more detailed study of the region(s) where it originates. Modeling of these new spectra using a stellar atmosphere code (e.g. CMFGEN), and additional Xray observations, will enable us to describe the shock zone and better estimate the physical parameters of the wind and the stellar components. New observations in the optical should allow us to reliably reconstruct the profile of the He i 5876 Å line in the secondary star and help us monitor its transition toward the WolfRayet WNL stage.
Acknowledgments
We are grateful to Prof. Hugues Sana for the LOSP Package, and to Prof. Gregor Rauw for comments on an earlier version of this paper and for sharing with us his spectra of HDE 228766 collected between 1999 and 2021 at the Observatoire de Haute Provence (OHP), France. We acknowledge the financial support of the Consejo Nacional de Humanidades, Ciencias y Tecnologías de México (CONACyT) and the Vicerrectoría de Investigaciones Innovación y Extensión of the Universidad Tecnológica de Pereira (Colombia). We thank the referee for constructive comments that have helped to improve the paper. We also thank the staff of San Pedro Mártir Observatory (México).This research has made use of NASA’s Astrophysics Data System Bibliographic Services.
Data Availability
The SPM spectra can be made available upon reasonable request.
References
- Arias et al. (2016) Arias J. I., et al., 2016, The Astronomical Journal, 152
- Bartzakos et al. (2001) Bartzakos P., Moffat A. F. J., Niemela V. S., 2001, Monthly Notices of the Royal Astronomical Society, 324, 33
- Bohannan & Crowther (1999) Bohannan B., Crowther P. A., 1999, The Astrophysical Journal, 511, 374
- Conti & Alschuler (1971) Conti P. S., Alschuler W. R., 1971, The Astrophysical Journal, 170, 325
- Crowther & Bohannan (1997) Crowther P. A., Bohannan B., 1997, Astronomy & Astrophysics, 317, 532
- Crowther & Smith (1997) Crowther P. A., Smith L. J., 1997, Astronomy & Astrophysics, 320, 500
- Crowther & Walborn (2011) Crowther P. A., Walborn N. R., 2011, Mon. Not. R. Astron. Soc, 416, 1311
- Fahed & Moffat (2012) Fahed R., Moffat A. F. J., 2012, Monthly Notices of the Royal Astronomical Society, 424, 1601
- Flores et al. (2001) Flores A., Auer L. H., Koenigsberger G., Cardona O., 2001, The Astrophysical Journal, 563, 341
- Gamen et al. (2006) Gamen R., et al., 2006, Astronomy & Astrophysics, 460, 777
- Hill et al. (2000) Hill G. M., Moffat A. F. J., St-Louis N., Bartzakos P., 2000, Monthly Notices of the Royal Astronomical Society, 318, 402
- Hill et al. (2002) Hill G. M., Moffat A. F. J., St-Louis N., 2002, Monthly Notices of the Royal Astronomical Society, 335, 1069
- Hiltner (1951) Hiltner W. A., 1951, The Astrophysical Journal, 113, 317
- Hiltner & Schild (1966) Hiltner W. A., Schild R. E., 1966, The Astrophysical Journal, 143, 770
- Hinkle et al. (2000) Hinkle K., Wallace L., Valenti J., Harmer D., 2000, Visible and Near Infrared Atlas of the Arcturus Spectrum 3727-9300 A. https://ui.adsabs.harvard.edu/abs/2000vnia.book.....H
- Langer (2022) Langer N., 2022, in St-Louis N., Vink J. S., Mackey J., eds, Proceedings for IAU Symposium 361: Massive Stars Near and Far. IAU, Ballyconnell, Ireland, pp 1–10, doi:10.48550/arXiv.2209.04165
- Lührs (1997) Lührs S., 1997, Publications of the Astronomical Society of the Pacific, 109, 504
- Marchenko et al. (1998) Marchenko S. V., Moffat A. F. J., Eenens P. R. J., 1998, Publications of the Astronomical Society of the Pacific, 110, 1416
- Martins (2018) Martins F., 2018, Astronomy & Astrophysics, 616, A135
- Massey & Conti (1977) Massey P., Conti P. S., 1977, The Astrophysical Journal, 218, 431
- Mathys (1988) Mathys G., 1988, Astronomy and Astrophysics Supplement Series, 76, 427
- Milson et al. (2020) Milson N., Barton C., Bennett P. D., 2020, arXiv e-prints, p. arXiv:2011.13914
- Petrović (2020) Petrović J., 2020, Serbian Astronomical Journal, pp 1–13
- Quintero et al. (2020) Quintero E. A., Eenens P., Rauw G., 2020, Astronomische Nachrichten, 341, 628
- Rauw et al. (2000) Rauw G., Sana H., Gosset E., Vreux J., Jehin E., 2000, Astronomy & Astrophysics, 360, 1003
- Rauw et al. (2002) Rauw G., Crowther P. A., Eenens P. R. J., Manfroid J., Vreux J.-M., 2002, Astronomy & Astrophysics, 392, 563
- Rauw et al. (2014) Rauw G., Mahy L., Nazé Y., Eenens P., Manfroid J., Flores C. A., 2014, Astronomy & Astrophysics, 566, A107
- Sabín-Sanjulián et al. (2014) Sabín-Sanjulián C., et al., 2014, Astronomy & Astrophysics, 564, A39
- Sana et al. (2006) Sana H., Gosset E., Rauw G., 2006, Monthly Notices of the Royal Astronomical Society, 371, 67
- Shara et al. (2009) Shara M. M., et al., 2009, The Astronomical Journal, 138, 402
- Sota et al. (2011) Sota A., Maíz Apellániz J., Walborn N. R., Alfaro E. J., Barbá R. H., Morrell N. I., Gamen R. C., Arias J. I., 2011, The Astrophysical Journal Supplement Series, 193, 24
- Walborn (1973) Walborn N. R., 1973, The Astrophysical Journal, 186, 611
- Walborn & Blades (1997) Walborn N. R., Blades J. C., 1997, The Astrophysical Journal Supplement Series, 112, 457
- van der Hucht (2001) van der Hucht K. A., 2001, New Astronomy Reviews, 45, 135