Benchmarking Vision Language Models for Cultural Understanding
Abstract
Foundation models and vision-language pre-training have notably advanced Vision Language Models (VLMs), enabling multimodal processing of visual and linguistic data. However, their performance has been typically assessed on general scene understanding – recognizing objects, attributes, and actions – rather than cultural comprehension. This study introduces CulturalVQA, a visual question-answering benchmark aimed at assessing VLM’s geo-diverse cultural understanding. We curate a collection of 2,378 image - question pairs with 1-5 answers per question representing cultures from 11 countries across 5 continents. The questions probe understanding of various facets of culture such as clothing, food, drinks, rituals, and traditions. Benchmarking VLMs on CulturalVQA, including GPT-4V and Gemini, reveals disparity in their level of cultural understanding across regions, with strong cultural understanding capabilities for North America while significantly lower performance for Africa. We observe disparity in their performance across cultural facets too, with clothing, rituals, and traditions seeing higher performances than food and drink. These disparities help us identify areas where VLMs lack cultural understanding and demonstrate the potential of CulturalVQA as a comprehensive evaluation set for gauging VLM progress in understanding diverse cultures.
Benchmarking Vision Language Models for Cultural Understanding
Shravan Nayak1,2 Kanishk Jain1,2 Rabiul Awal1,2 Siva Reddy1,3 Sjoerd van Steenkiste4 Lisa Anne Hendricks4 Karolina Stańczak1,3 Aishwarya Agrawal1,2 1Mila – Quebec AI Institute, 2Université de Montréal, 3McGill University, 4Google DeepMind Correspondence: shravan.nayak@mila.quebec
1 Introduction
Recent multimodal vision-language models (VLMs) (Radford et al., 2021; Liu et al., 2023; Peng et al., 2023; Chen et al., 2024; Lu et al., 2024) have shown impressive performance in tasks such as image-to-text generation, visual question answering, and image captioning, inter alia. These tasks predominantly focus on general scene understanding capabilities such as recognizing attributes, objects, and actions in scenes containing objects in their common context (Lin et al., 2014). However, given the advancing capabilities of VLMs, we believe the time is now ripe to hold VLMs to higher standards. We believe that to support increasingly global digital interactions, VLMs must also be capable of understanding the cultural values (Liu et al., 2021) such as beliefs, rituals, and traditions, for a variety of cultures in the world.
In order to adequately assess whether the current state-of-the-art VLMs – including proprietary models such as GPT-4V (OpenAI, 2023) and Gemini (Gemini Team et al., 2023) – encode cultural knowledge, we need systematic benchmarks. However, evaluating cultural understanding is a challenging task since culture is a multifaceted concept consisting of both tangible (e.g., clothing, and food) as well as intangible elements (e.g., ritual practices). Current benchmarks in this domain, including MaRVL (Liu et al., 2021) and GD-VCR (Yin et al., 2021), while offering foundational insights, have critical shortcomings. MaRVL primarily focuses on visual reasoning tasks (e.g., counting, spatial reasoning) on top of images sourced from various cultures, and lacks probing cultural common sense – the knowledge bank shared by the members of a cultural group (see § 3). GD-VCR although explores commonsense, it is limited by its reliance on movie scenes, which do not encompass the broader spectrum of everyday cultural contexts.
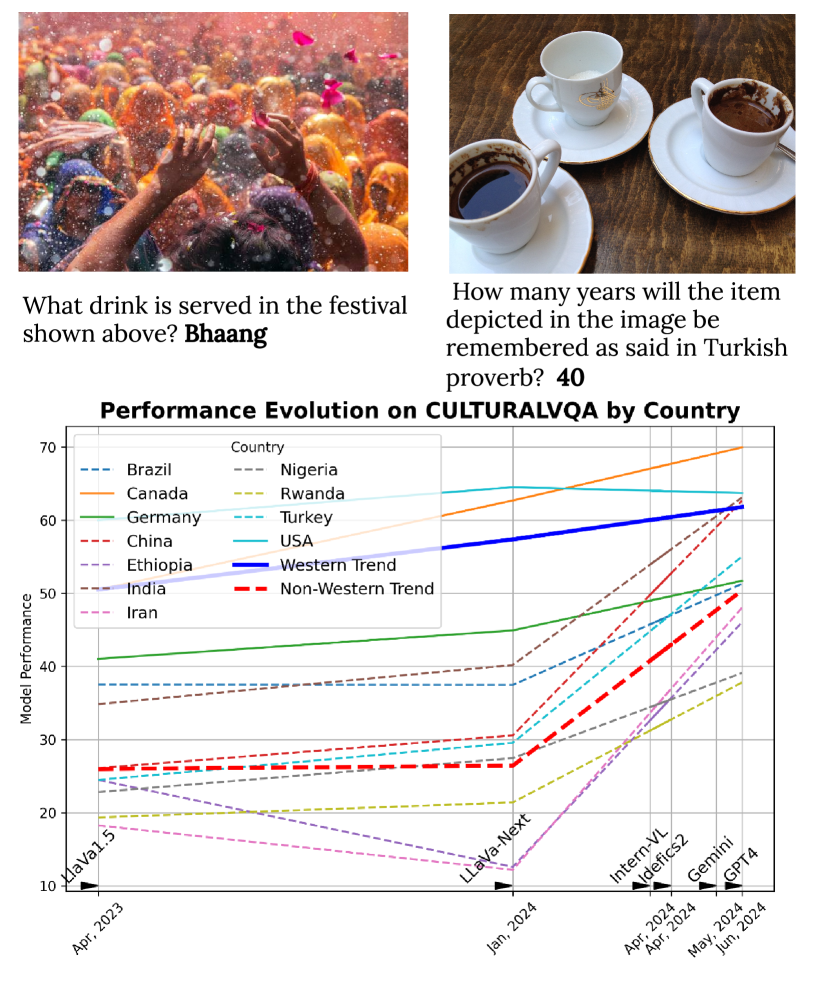
In response to the above challenges, we propose CulturalVQA, a novel benchmark specifically designed to assess cultural understanding of VLMs. CulturalVQA is based on Visual Question Answering (VQA), requiring models to integrate both visual and textual information, which permits the formulation of diverse questions, thereby enabling the evaluation of a model’s understanding of cultural nuances. The CulturalVQA benchmark extends the language-only CANDLE dataset (Nguyen et al., 2023), which provides a comprehensive collection of cultural commonsense knowledge assertions. We expanded this dataset by automatically collecting images that depict the cultural concept described by the assertions. On top of these images, we collect questions and answers by employing annotators from different cultures who would be familiar with the different cultural concepts depicted in the images. See Fig. 1 (top) for some examples of questions and answers. Our benchmark consists of 2,378 questions collected on top of 2,328 unique images with 1-5 answers per question (total 7,206 answers) from 11 countries.111We provide a data statement in § A. We also present several analyses to better understand the nature of questions and answers in our benchmark.
Further, we systematically evaluate several state-of-the-art VLMs on CulturalVQA. Our evaluation reveals a distinct performance gap between proprietary and open-source models, with open-source models significantly underperforming in comparison (e.g., there is a 29.78% gap between the highest-performing closed-source model and its open-source counterpart in the country for which the models perform the worst, Ethiopia). Additionally, we observe a significant disparity in model performance across countries. For instance, the highest-performing proprietary model, GPT-4V, achieves 67% and 72% accuracy for North American cultural concepts while only between 43% and 56% accuracy on concepts from Africa. VLMs also show varying degrees of proficiency across cultural facets, with closed-source VLMs performing better on questions about rituals and traditions while scoring worse on those related to clothing, food, and drink. We develop CulturalVQA as a comprehensive evaluation set for gauging VLMs’ progress in understanding diverse cultures and highlighting areas where VLMs lack cultural understanding, with the hope that our benchmark will contribute to accelerating the advancements of VLMs in their cultural understanding, as illustrated in Fig. 1.
2 Related work
Cultural understanding is closely related to geo-diverse understanding. Existing geo-diverse datasets, for instance, the Dollar Street dataset (Gaviria Rojas et al., 2022) includes 38,479 images of everyday household items from homes around the world, while the GLDv2 dataset (Weyand et al., 2020) contains 5 million images and 200k distinct instance labels of natural and human-made landmarks, but both only test recognition capabilities as opposed to cultural understanding. The GD-VCR dataset (Yin et al., 2021) probes cultural understanding, but its reliance on cinematic scenes limits the diversity of real-world cultural contexts it can have. Another related line of work focuses on multilingual understanding. For instance, Bugliarello et al. (2022) bring together five datasets across a number of tasks in 20 languages. However, their focus lies in multilingual understanding (as opposed to cultural understanding). Another multilingual dataset, MaRVL (Liu et al., 2021), tests visually grounded reasoning across multiple languages and cultures. However, MaRVL does not explore the cultural common sense of rituals and traditions. Additionally, the XM3600 dataset (Thapliyal et al., 2022), includes image captions from 36 regions and languages, thus providing a broad geographical coverage but nonetheless contains mostly Western content and lacks depth in the included cultural concepts (Pouget et al., 2024). Closest to our work, the MaXM benchmark (Changpinyo et al., 2023), building on the XM3600 dataset, and the concurrent study by Romero et al. (2024) both use the VQA format to explore regional and cultural understanding. MaXM focuses primarily on the ability to process images from varied regions rather than on nuanced cultural understanding. Romero et al. (2024) study cultural questions in a multilingual setup. However, their focus diverges from ours as, like MaRVL, they allocate a much smaller proportion of their dataset to traditions and rituals.
3 CulturalVQA: Dataset Creation
Cultural Taxonomy
Culture is a multifaceted concept that describes the way of life of a collective group of people, distinguishing them from other groups with different cultures (Hofstede et al., 2010; Hershcovich et al., 2022). In this paper, we use the concept of a country as a proxy for a cultural group (Adilazuarda et al., 2024). 222See § 7 for a discussion of this choice. Our work assumes common ground within a cultural group by probing culturally relevant concepts that are collectively understood, as well as shared cultural common sense employed in reasoning (Hershcovich et al., 2022). For instance, lavash – a traditional Persian bread (see Fig. 2) – is an example of a culturally relevant concept, while the common practice of waltzing at weddings exemplifies the cultural common sense among Germans.
Building on these definitions, we introduce a benchmark that evaluates both the tangible aspects of culture through culturally relevant concepts, such as food, drink, and clothing, as well as the intangible facets via shared common sense embedded in rituals and traditions.333Herein, the term ‘concepts’ is used to encompass both cultural concepts and common sense. We frame this evaluation as a VQA task assessing models’ cultural understanding. Starting with a pool of countries, we collect images and use culturally knowledgeable annotators to frame questions. Finally, we collect the ground truth answers.
Selection of Countries
To build a benchmark that reflects cultural diversity, we aimed to achieve broad geographical coverage. Our final dataset spans 11 countries and 5 continents. These countries were specifically selected to cover different cultural categories from the World Values Survey (Haerpfer et al., 2022) and include Confucian (China), African-Islamic (Turkey, Iran, Ethiopia, Nigeria, Rwanda), Protestant Europe (Germany), English-speaking (USA, Canada), Latin America (Brazil), and South Asian (India) cultures. We opt for an intentional overrepresentation of African-Islamic countries to address their typical scarcity in geo-diverse datasets.
Selection of Images
The image selection begins with the CANDLE dataset (Nguyen et al., 2023), which provides a rich collection of Cultural Commonsense Knowledge (CCSK). Each of the 1.1 million entries includes URLs to webpages with relevant CCSK data from the C4 corpus (Raffel et al., 2020). Inspired by findings from (Zhu et al., 2023), which highlighted that 80% of webpages in the C4 corpus contain relevant images, we scrape images from these URLs, focusing particularly on CCSK data from the geography and religion domains of our selected countries.
To refine the image dataset derived from web scraping, we applied filters for aspect ratio, size, and specific keywords, and used CLIP similarity (Hessel et al., 2021) to rank images for cultural relevance. Images with low CLIP scores were discarded, and we sampled the remaining images based on their scores, with higher scores having a higher probability of selection. Details of the image filtering process can be found in § B.
Question Collection
Following the conceptual culture framework by Hofstede et al. (2010), we directed annotators to create questions that are easily answerable by someone from their own culture but challenging for outsiders. To elicit such questions, annotators were guided by the instructions shown in § C and were provided with images and additional context to cultural concepts presented in the image (retrieved from CANDLE). We encouraged them to create questions based on their cultural knowledge, using the additional context (accessible behind a click-to-expand box) only when absolutely necessary. Annotators were also advised to skip images if they found them culturally irrelevant or were unfamiliar with the depicted content.
Initially, for this task, we attempted to engage professional annotators from the Amazon Mechanical Turk (MTurk) platform. However, we encountered challenges in finding sufficient presence of annotators from some of the targeted countries. Therefore, we expanded our search to other communities with a broad cultural representation, including Masakhane, an African NLP organization, and Mila, an international academic AI research institute. Employing annotators from these sources, we conducted pilot studies to iterate over the task instructions and to pre-select high-quality participants.
Answer Collection
Next, we asked the annotators to write answers to the questions created in the previous step, ensuring that the answers reflected common agreement within their culture (see instructions in § D). We prompt them to use English for universal concepts like cats or apples and use widely recognized and agreed upon local terms for concepts like beliefs, festivals, or local cuisine, rather than translating these terms into English. For example, the annotators should write the term naan instead of Indian bread. This approach preserves the cultural specificity of the collected answers. Further, we instructed annotators to be as precise as possible in their answers (e.g., sushi instead of food and Oolong tea instead of tea) and to keep their responses concise, ideally between one to three words.
4 Dataset Analysis
This section provides a detailed analysis of our dataset’s composition and characteristics. In particular, we offer an analysis of images, questions, answers, and cultural concepts included in the CulturalVQA dataset.
Images
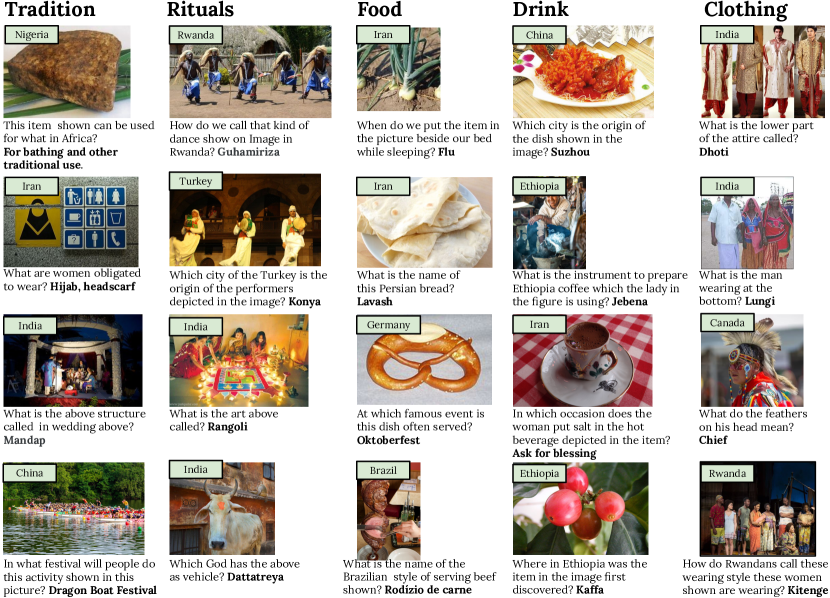
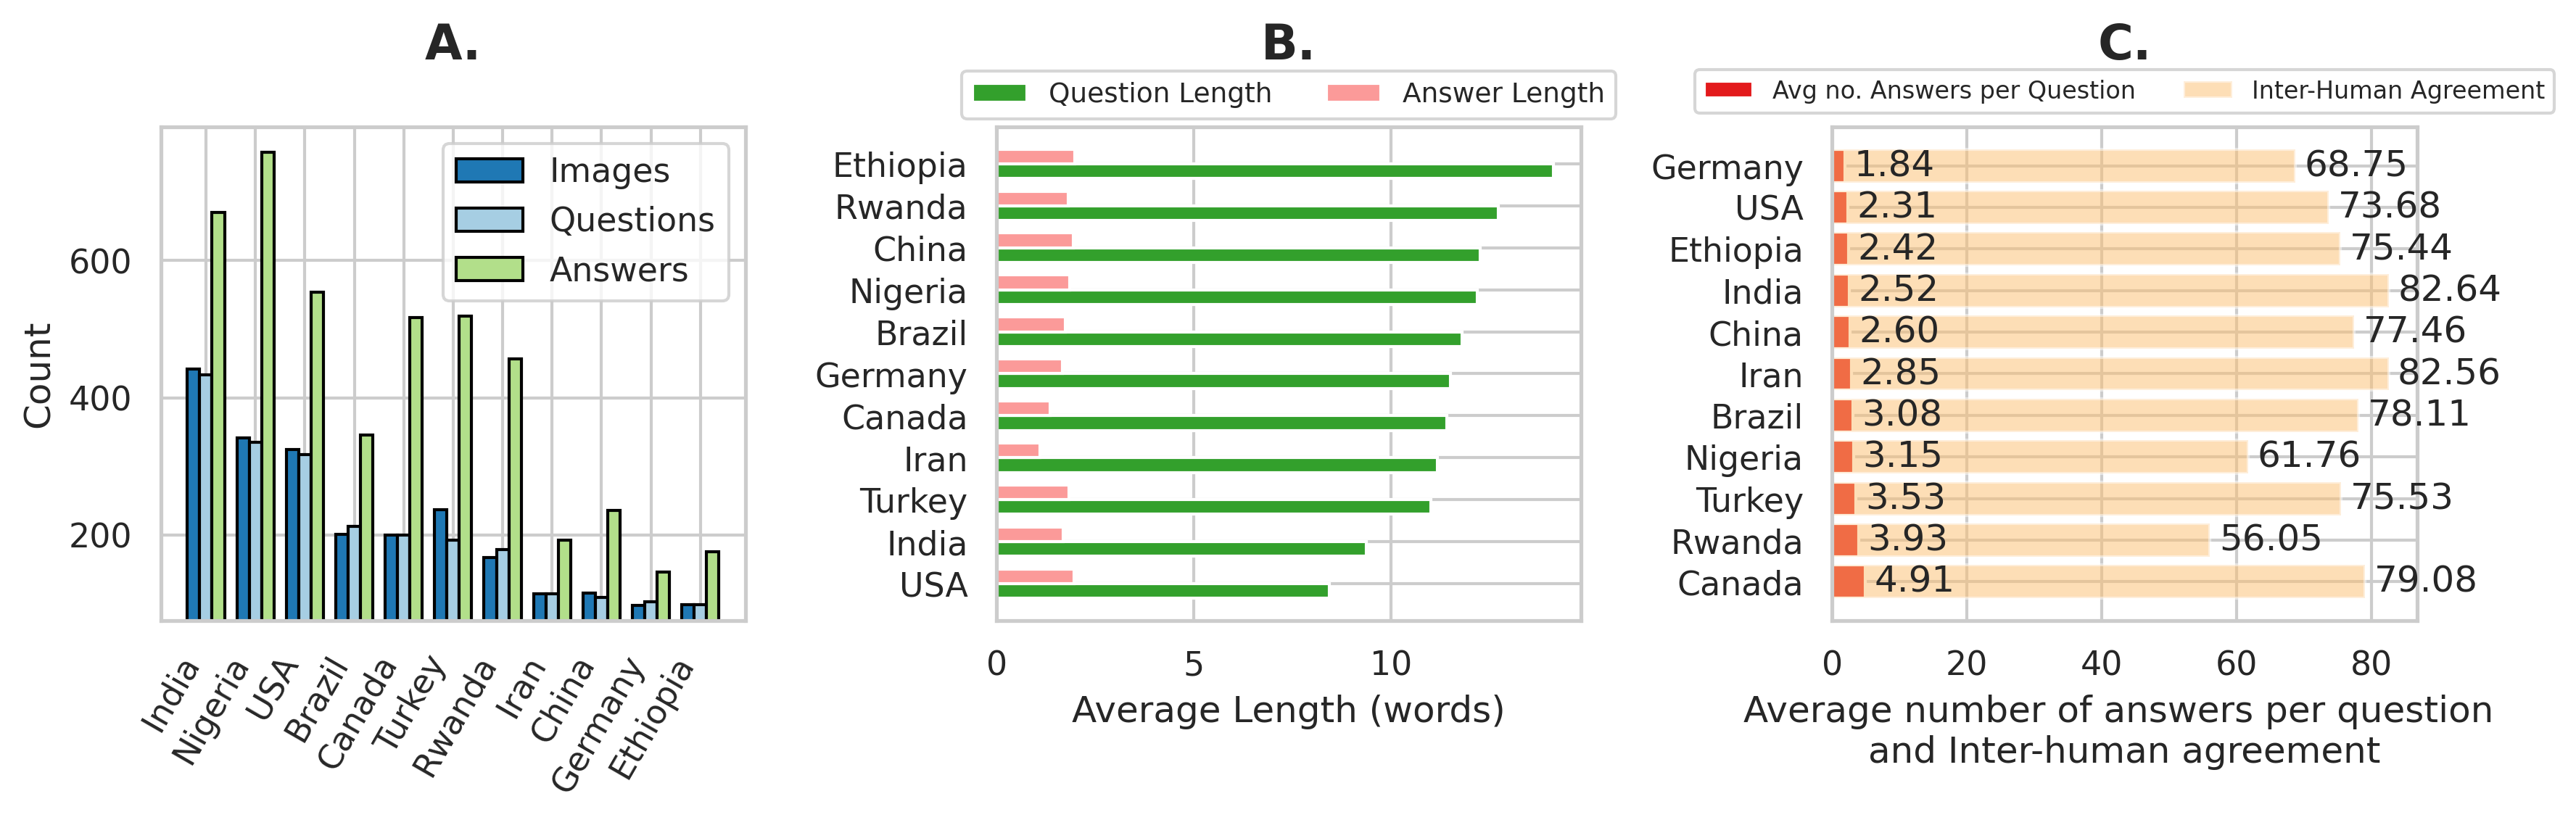
Our dataset comprises of 2,328 unique images. In Fig. 2, we show representative samples showcasing the images and cultural concepts within our dataset. The concepts depicted in the images are sourced from 11 countries, selected through a strategic process to ensure extensive cultural representation. The distribution of unique image count per country is detailed in Fig. 3.
Questions
We collected 2,378 questions in total. In Fig. 3, we present the number of unique questions per country. The questions have an average length of 10.98 words (see Fig. 3 for country-wise breakdown). Most frequent question types include ‘What’(51.3%), ‘Which’(11.2%), ‘In’ (5.6%), ‘Why’ (3.4%),‘Where’(3.1%) ‘Identify’(3.0%), and ‘How’ (2.7%) questions. For example, ‘What’ questions often relate to identifying cultural entities like saree or Dirndl (traditional Indian and German dresses, respectively) in the clothing category, or festivals like Ramadan (observed e.g., in Nigeria) and Spring Festival (celebrated in China) among rituals. ‘Where’ questions inquire about locations significant to specific foods, such as the origins of Quebec chicken. Finally, we analyzed whether the collected questions contain stereotypes and found that they are largely absent (see § E).
Answers
CulturalVQA consists of 7,206 manually curated answers in total.444We collected 1-5 answers per question, depending on the availability of annotators. The average answer length is 1.73 words (see Fig. 3 (B) for country wise breakdown). We assess whether answers predominantly feature terms from local languages. To this end, we verified how many answers have corresponding English Wikipedia titles; for 80% of the answers at least one of the answer words is contained in at least one Wikipedia title. Thus our benchmark is still suitable for English VLMs.
Cultural Concepts
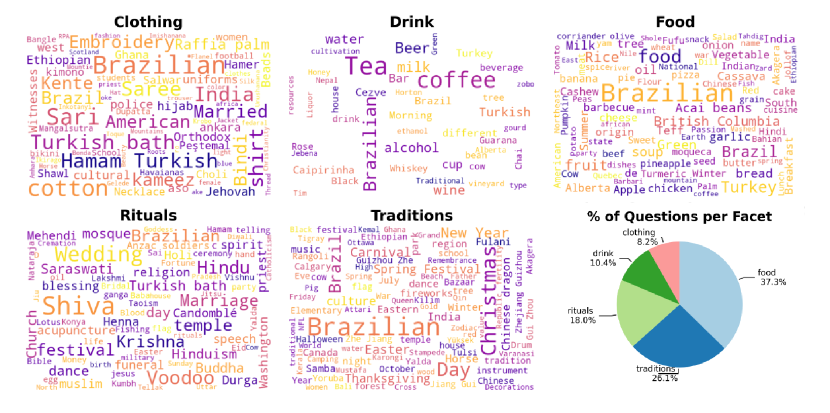
According to the pie chart in Fig. 4, food-related questions are most prevalent, accounting for 37.3% of the dataset, followed closely by traditions and rituals, which represent 26.1% and 18% respectively. Thus, roughly 44% of the questions in our dataset probe for cultural understanding of the intangible aspects of culture (rituals and traditions)! The word clouds generated from the collected answers in Fig. 4 reveal diverse expressions of rituals and traditions represented by terms like hamam (Turkey) and meskel (Ethiopia). Further, the food category includes diverse items such as feijoada (Brazil), fufu (Nigeria), and vada (India) indicating a geo-diverse culinary scope. While the clothing category is the least prevalent in the dataset, it shows the highest variety in terms of collected answers. The drink category is notably one of the smallest, both in terms of the size and number of unique answers.
5 Benchmarking VLMs on CulturalVQA
Evaluation Metric
Evaluating open-ended VQA is challenging. Traditionally, string matching has been used but it is known to underestimate model performance. Based on findings from Mañas et al. (2024), which demonstrate the effectiveness of reference-based LLM evaluation for open-ended VQA tasks, we adopt LAVE, their proposed metric, as our evaluation metric with GPT-4 as the LLM (see § F for the LLM prompt used). We validated the effectiveness of LAVE for our use case by computing correlation with human judgments. LAVE judgment agrees with human judgment 79% of the times for GPT-4, 73% of the times for Gemini, and 76% of the times for Intern-VL.
VLMs used for benchmarking
We benchmark several state-of-the-art VLMs on the proposed CulturalVQA dataset, ranging from closed-source models like GPT-4 (GPT-4o) and Gemini Pro (Gemini-Pro-Vision 1.0) to a wide variety of open-source models, ranging from 7 to 25 billion parameter count: Blip2 Li et al. (2023), InstructBlip Dai et al. (2024), Llava1.5 Liu et al. (2023), Llava_Next Liu et al. (2024), Idefics2 Laurençon et al. (2024), and Intern-VL 1.5 Chen et al. (2024). See § G for a detailed discussion of the selected models.
| Open-Source | Closed-Source | |||||||
|---|---|---|---|---|---|---|---|---|
| Country | InstructBlip | LLaVa1.5 | Blip2 | LLaVa-Next | Idefics2 | Intern-VL | Gemini | GPT-4 |
| Brazil | 10.57 | 40.38 | 32.21 | 45.62 | 54.37 | 52.53 | 66.34 | 76.44 |
| Canada | 17.00 | 50.50 | 58.50 | 62.50 | 69.00 | 67.50 | 65.50 | 72.00 |
| China | 16.52 | 26.09 | 34.78 | 33.04 | 38.26 | 53.04 | 65.22 | 65.22 |
| Ethiopia | 3.19 | 24.47 | 17.02 | 18.09 | 25.53 | 26.60 | 42.55 | 56.38 |
| Germany | 30.77 | 41.03 | 51.28 | 48.72 | 38.46 | 48.72 | 48.72 | 61.54 |
| India | 19.91 | 34.84 | 46.61 | 42.53 | 49.32 | 53.85 | 58.37 | 69.68 |
| Iran | 11.30 | 18.26 | 19.13 | 17.39 | 23.48 | 30.43 | 46.09 | 57.39 |
| Nigeria | 13.74 | 22.81 | 21.35 | 28.95 | 31.87 | 33.92 | 36.26 | 43.27 |
| Rwanda | 4.97 | 19.34 | 22.65 | 25.41 | 23.20 | 28.73 | 35.36 | 46.41 |
| Turkey | 21.52 | 24.47 | 33.76 | 33.33 | 37.97 | 41.35 | 56.12 | 59.92 |
| USA | 29.54 | 58.77 | 62.77 | 62.77 | 65.23 | 71.38 | 62.15 | 66.77 |
| Average | 16.27 | 32.81 | 36.37 | 38.03 | 41.51 | 46.18 | 52.97 | 61.36 |
What degree of visual understanding is required to answer the questions in CulturalVQA?
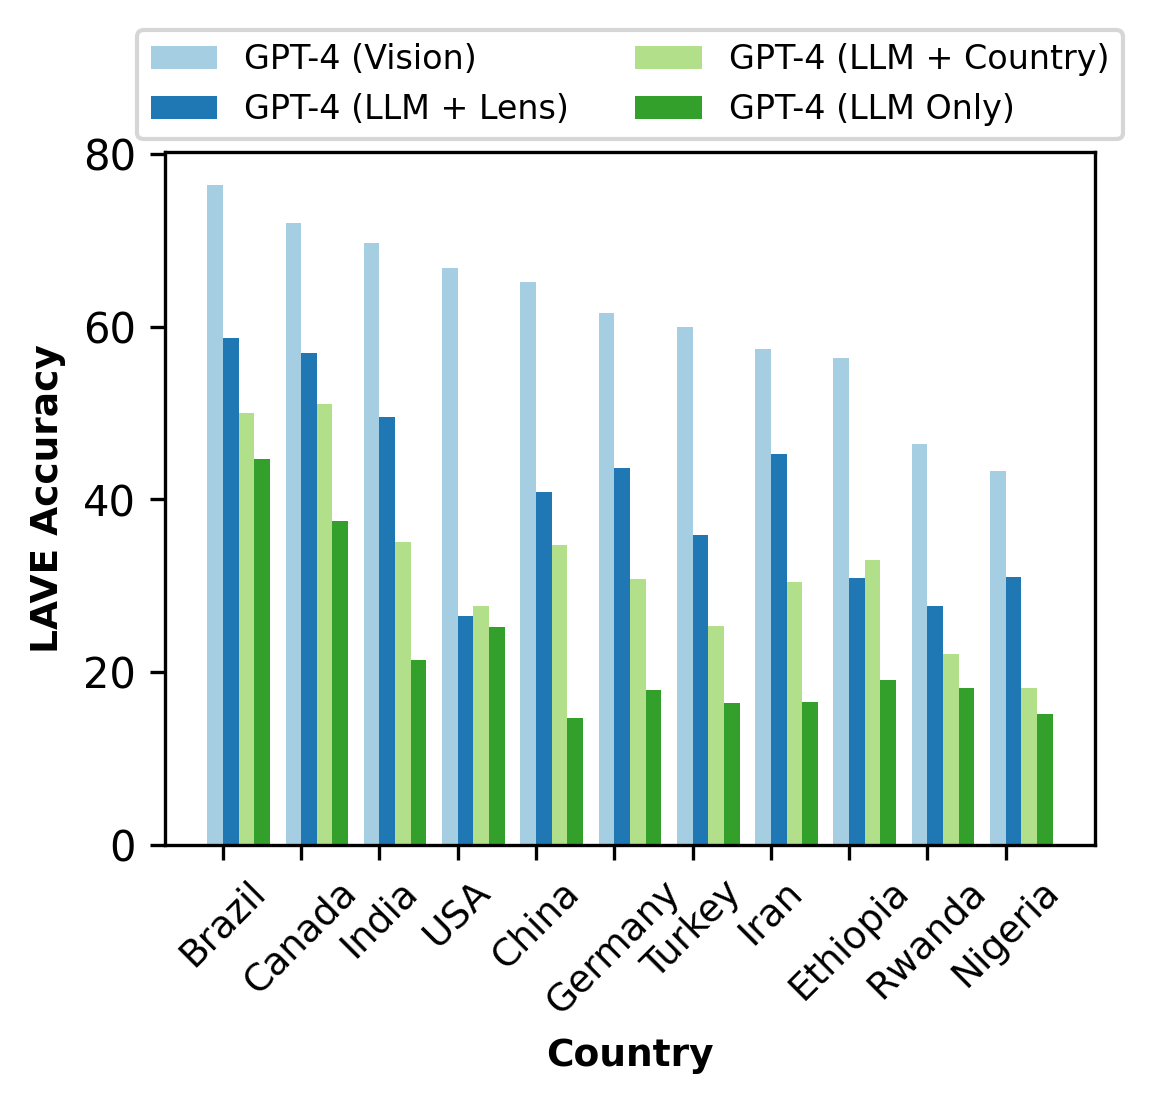
To investigate this, we employ the following baselines. LLM-only: This baseline uses an LLM to answer questions based on solely the question input. It helps gauge the extent to which the questions in our dataset can be addressed without any visual context, solely relying on the language-only cultural information encoded in the parameters of the LLM. LLM + Country: It introduces country-specific context into the LLM prompts to determine if knowing the country along with the question can already elicit the correct answer! LLM + Lens: Unlike the other two baselines, which do not rely on visual context, this baseline takes as input the image entity names extracted by Google Lens, along with the question. Thus, it helps gauge whether the questions in our dataset can be answered with only coarse-level knowledge of the visual context.
We evaluate the baselines using GPT-4 as the underlying LLM. The LAVE accuracies for these baselines, as well as for the GPT-4 VLM (which also incorporates an image as input in addition to the question), are presented in Fig. 5. We see that although the country information and the coarse visual entities help improve the performance on top of the LLM-only baseline, the performance of the strongest baseline (LLM + Lens) is still far from that of the VLM. This verifies that the questions in our dataset require sufficient visual understanding to answer them accurately.
To what extent are VLMs culturally aware?
We report the LAVE accuracies for zero-shot evaluation of open-source and closed-source vision-language models on the proposed CulturalVQA benchmark in Tab. 1. The average LAVE accuracy for the highest-performing model, GPT-4, is approximately 61%, with performance varying across countries from 43% to 72%. We see substantial disparity in cultural understanding across different VLMs, with the best-performing open-source model (Intern-VL for most countries) achieving an average LAVE accuracy of only 46%, and performance ranging across countries from 26% to 71%. This result indicates a considerable performance gap between closed-source models and the best-performing open-source model. This gap is particularly pronounced in countries within the African-Islamic culture (Ethiopia, Nigeria, Iran, and Turkey), with a 29.78% gap for Ethiopia, the country for which the models perform the worst.
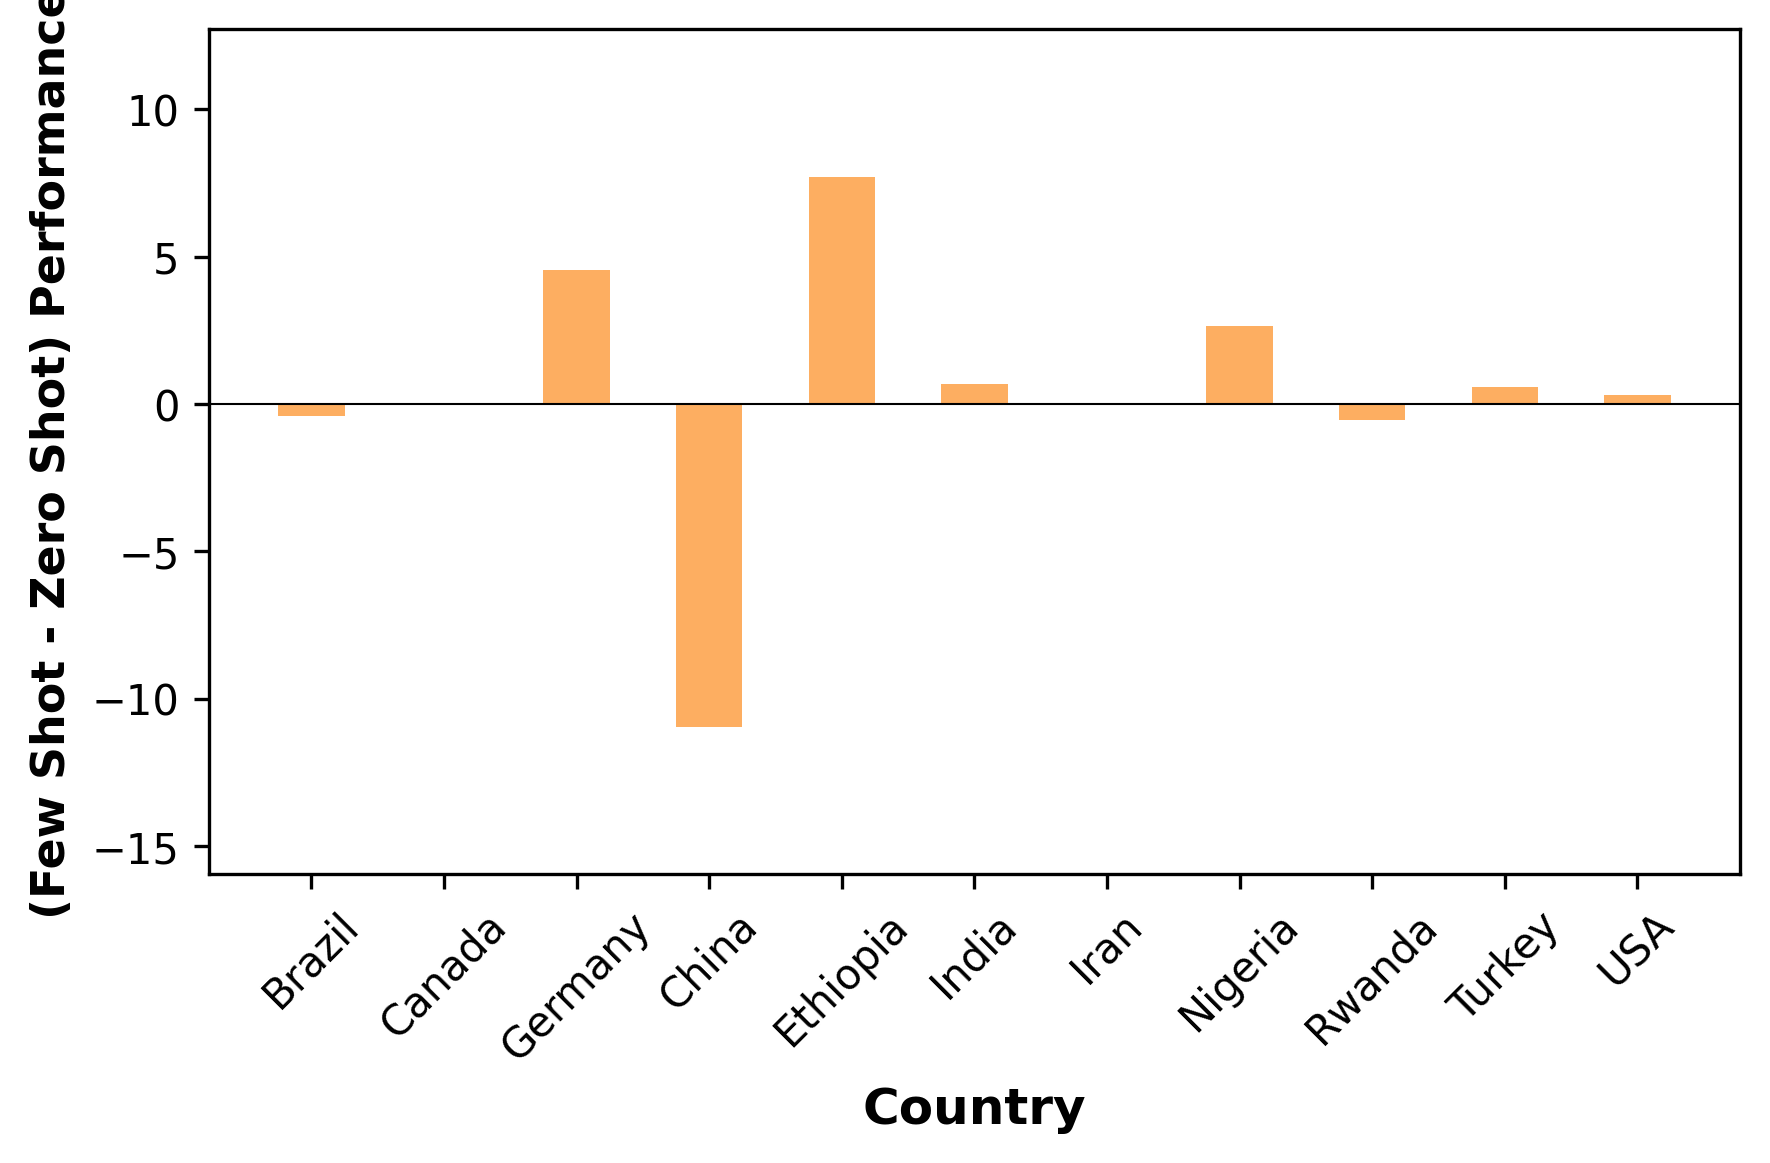
We also conduct few-shot evaluation of VLMs to assess if solving the CulturalVQA benchmark is merely a matter of guiding the VLMs in the right direction via a handful of examples from each country. For the few-shot setup, we include one example for each country (i.e., a total of 11 examples). The few-shot prompt used in the setup is provided in § I. Our analysis in Fig. 6 reveals that few-shot prompting does not consistently improve performance over zero-shot, despite having examples from all countries. Notably, some countries like Germany, Ethiopia, and Nigeria showed clear improvements (3-8% point increase), while others such as Brazil, China, India, and Rwanda experienced performance drops or minimal gains. This inconsistency in performance improvement suggests that the effectiveness of few-shot prompting may not be uniformly beneficial across different cultural contexts. This finding implies that GPT-4’s performance on culturally nuanced tasks may be more dependent on its pre-existing knowledge base rather than the immediate context provided. These results highlight the challenging nature of our proposed CulturalVQA dataset, as it successfully captures cultural knowledge that is not easily acquired through simple few-shot prompting techniques, emphasizing the need for more advanced approaches to enhance model performance on cultural understanding tasks.
The subsequent analyses in this section are conducted on top of zero-shot results.
Are VLMs better at understanding cultures from some countries than others?
A country-level (see Tab. 1) analysis of the models reveals stark variance in performance across different regions. Generally, open-source models perform well for high-resource countries such as the USA, Canada, Brazil, and India while achieving inferior performance in underrepresented countries (Ethiopia, Iran, and Rwanda). This trend holds true even for open-source models with large parameter sizes, such as Intern-VL, indicating that data diversity is more crucial for cultural understanding than model size. Although closed-source models showcase less drastic performance discrepancies across countries, their performance also degrades significantly for African-Islamic countries.
Are VLMs better at understanding some cultural concepts than others?
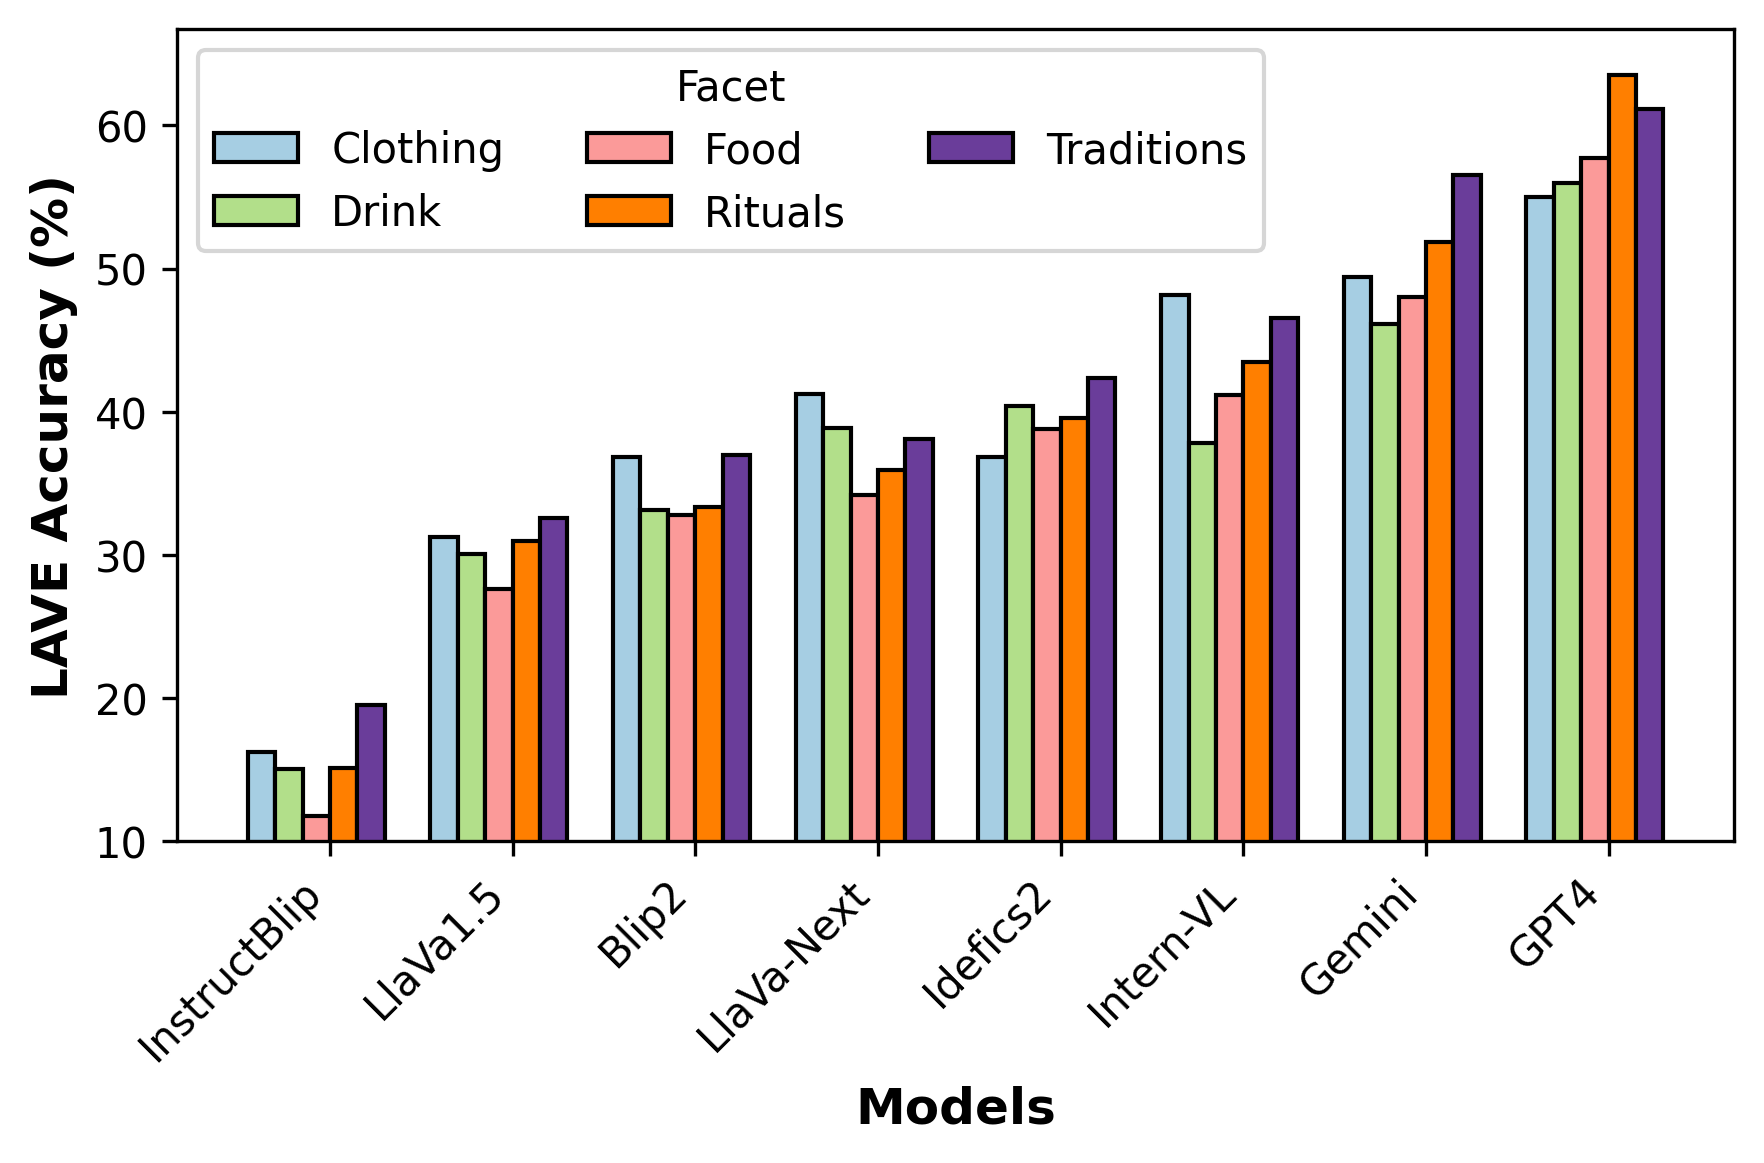
In Fig. 7, we report the model performance across 5 cultural facets. Generally, we find that proprietary models tend to perform better on intangible concepts – rituals, and traditions, compared to drink and food. Indeed, the highest performance of GPT-4 is achieved in the rituals facet (), whereas in the clothing facet, it achieves a lower performance of .
How do culturally knowledgeable people perform on CulturalVQA?
We calculate human performance for 1,455 questions for which we have three or more answers using the LAVE metric. For each question, we compute the accuracy of one of the human answers against the remaining human answers using LAVE. We then average the scores across all answers. Since all these answers are written by annotators who are familiar with the culture probed in the question, this human performance tells us how well culturally knowledgeable people perform on CulturalVQA.
Based on the results reported in Fig. 3 (C), human performance is notable and ranges from 55%-85%, with certain countries, such as Iran, showing particularly high scores (). We qualitatively analyze reasons for low human performance for Rwanda and Nigeria, the two lowest scoring countries (56.05% and 61.76% respectively). Several factors contribute to these relatively lower numbers. First, we have used country as a proxy for a cultural group, which might be particularly inaccurate for these countries. There may be subcultures within these countries where the same concept holds different meanings, leading to varied interpretations. This is especially relevant for visually similar items. For example, for the question: “What’s the item that the people are beating called in the local parlance?,” the answers received are Ìlù, Igba, and drums. The first two are also types of drums, with the former used in Yoruba culture and the latter in Igbo culture. Depending on the respondents’ cultural background, their answers may have varied. Secondly, we also found that annotators often disagreed on questions that required identifying geographical locations. For example, for the question: “What part of Rwanda are the crops shown in the image grown more?” the answers are Gisagara, Gicumbi District, and Nyamagabe. These types of questions, especially for Rwanda, might have contributed to the lower performance.
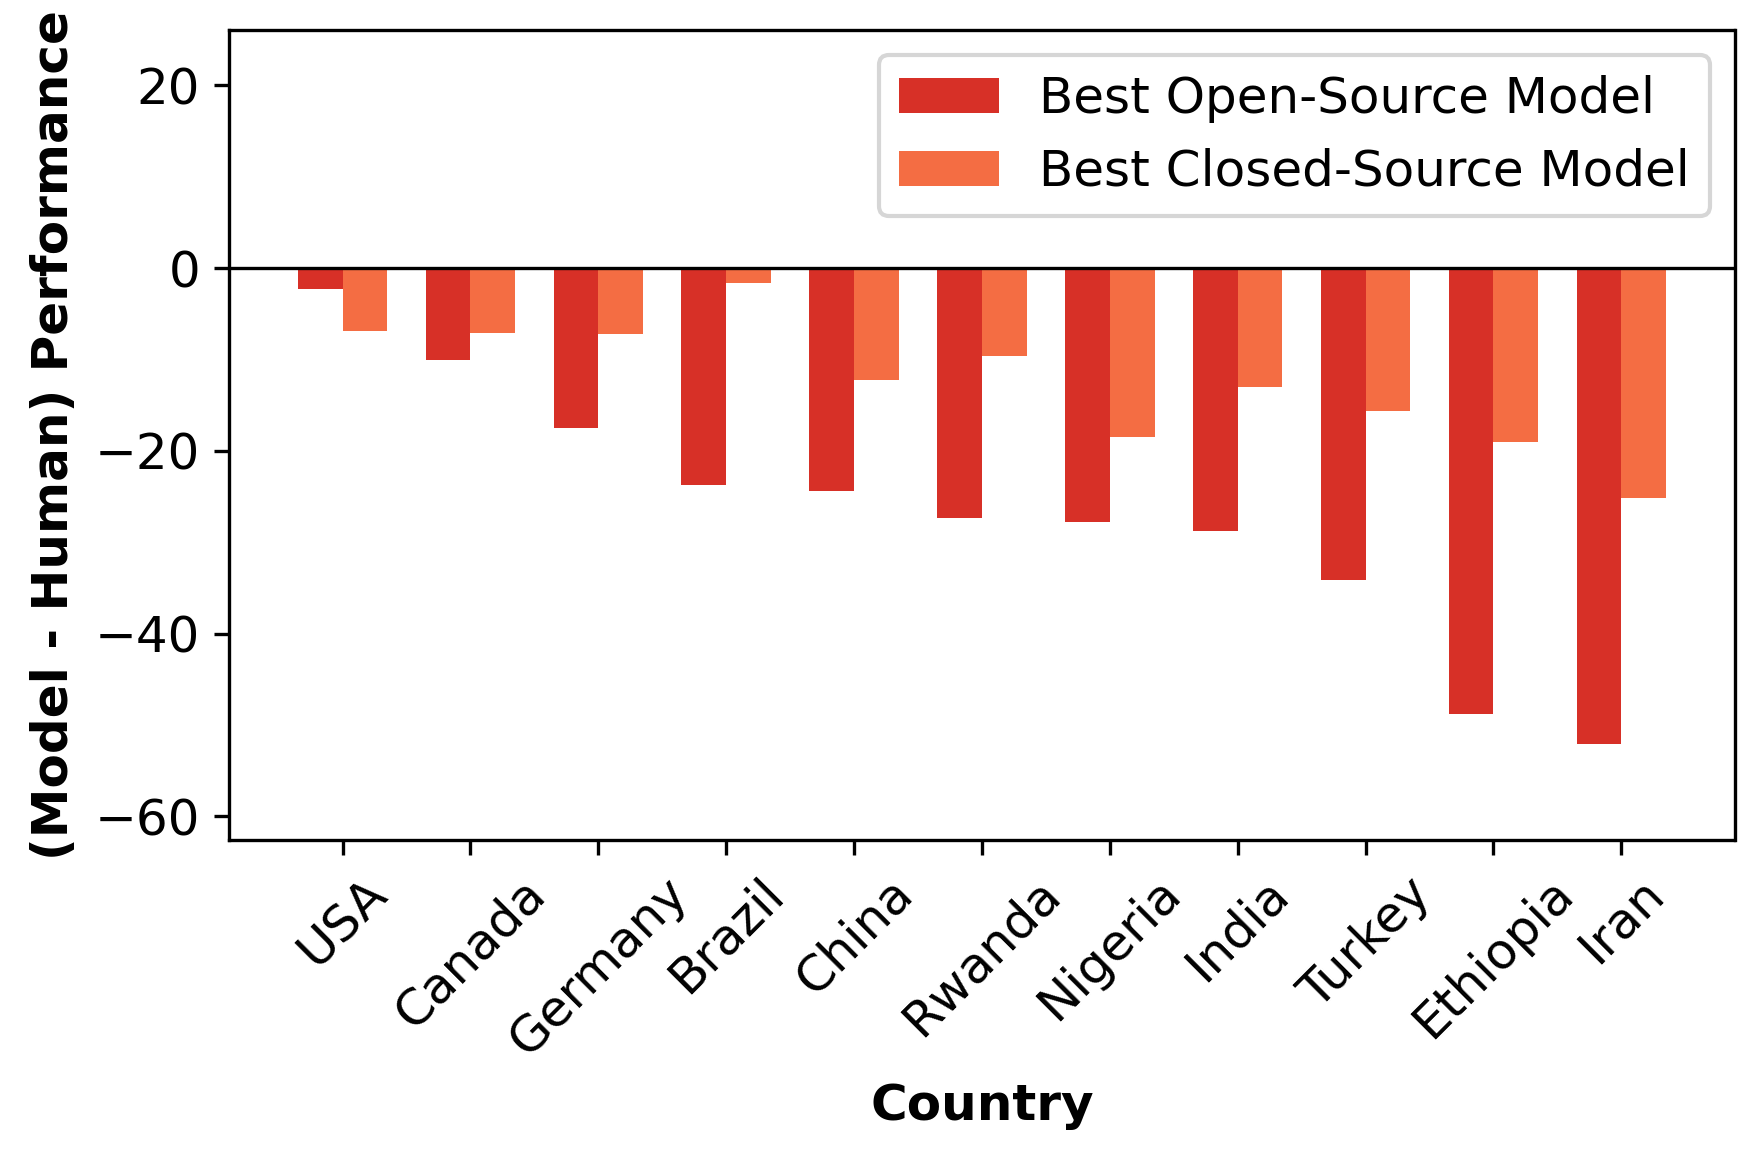
We also calculate the Pearson correlation between human and model performance across countries. For open-source models, we observe a relatively low correlation, ranging from 0.1 to 0.4. Interestingly, for closed-source models like Gemini and GPT-4, we find a stronger correlation of 0.69 and 0.75, respectively. This suggests that the factors affecting human performance similarly influence the performance of these closed-source models. However, from Fig. 8, when comparing human and model performance using the same metric, we find that closed-source models still lag behind humans for all countries indicating that while these models follow human performance trends, there is still a marked gap in their cultural understanding compared to humans. This gap is even more pronounced for open-source models, which show an even larger discrepancy in model performance compared to human performance across all countries.
Further, in Fig. 8, we observe a larger gap for non-Western countries such as Iran, Nigeria, India, Turkey, and Ethiopia (). Conversely, the smaller gap for Canada and the USA (< 7.0%) indicates a closer alignment between models and human performance, likely due to a better representation of Western cultural concepts in the training data. Interestingly, GPT-4 shows a relatively low gap for Brazil (), possibly because the questions for Brazil often probe coarse visual understanding. This trend is further supported by LLM + Lens baseline in Figure 5 which performs exceptionally well for Brazil.
How much do varying question difficulty and varying answer counts affect model performance disparity across countries?
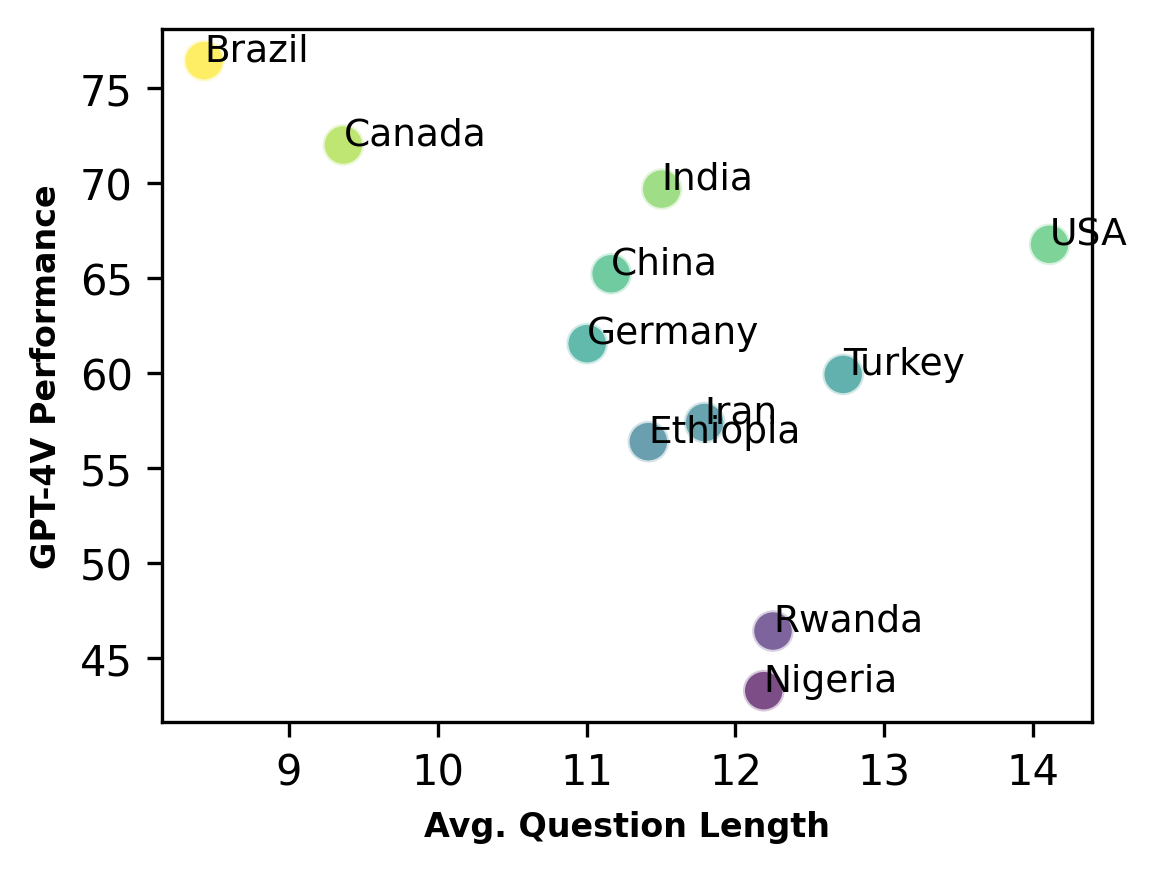
Since we sourced questions from different annotator groups across countries, it is imperative to ask if the disparity in model performance across countries is due to the disparity in inherent difficulty levels of questions across countries. To investigate this, we analyze the correlation between the model performance and the average question length (see Fig. 3 (B) for average question length across countries). We use average question length as a proxy for question difficulty because we believe shorter questions probe more direct knowledge, whereas longer questions require more nuanced, detailed cultural knowledge. As the variance in absolute question lengths is small, looking at ranks is more meaningful, which is why we use Spearman for this analysis. We find a weak Spearman rank correlation between question length and model performance ranging between -0.3 and 0.3 for most models, with the exception of GPT-4 and Gemini, which exhibit a moderate negative correlation of -0.52 on average. Further, Fig. 11 presents a scatter plot of GPT-4 performance vs. average question lengths across countries. We can see that for most countries except Brazil, Canada, and the USA, the variance in question lengths is small. This suggests that question length is not a significant factor behind the disparity in model performance across countries.
Another factor potentially affecting the disparity in model performance is the variable number of human answers per question across countries (see Fig. 3 (C)). These human answers are used as the reference answers in the LAVE metric making it more rigid for countries with fewer references and vice-versa. To investigate this, we compute the correlation between model performance and the average number of answers per question across countries. We again use Spearman correlation since the variance in absolute values of average numbers of answers per question across countries is small. We find a very low correlation ranging between -0.3 and 0 across models, indicating that the disparity in the number of human answers does not meaningfully affect the disparity in model performance across countries.
Human judgment of model performance
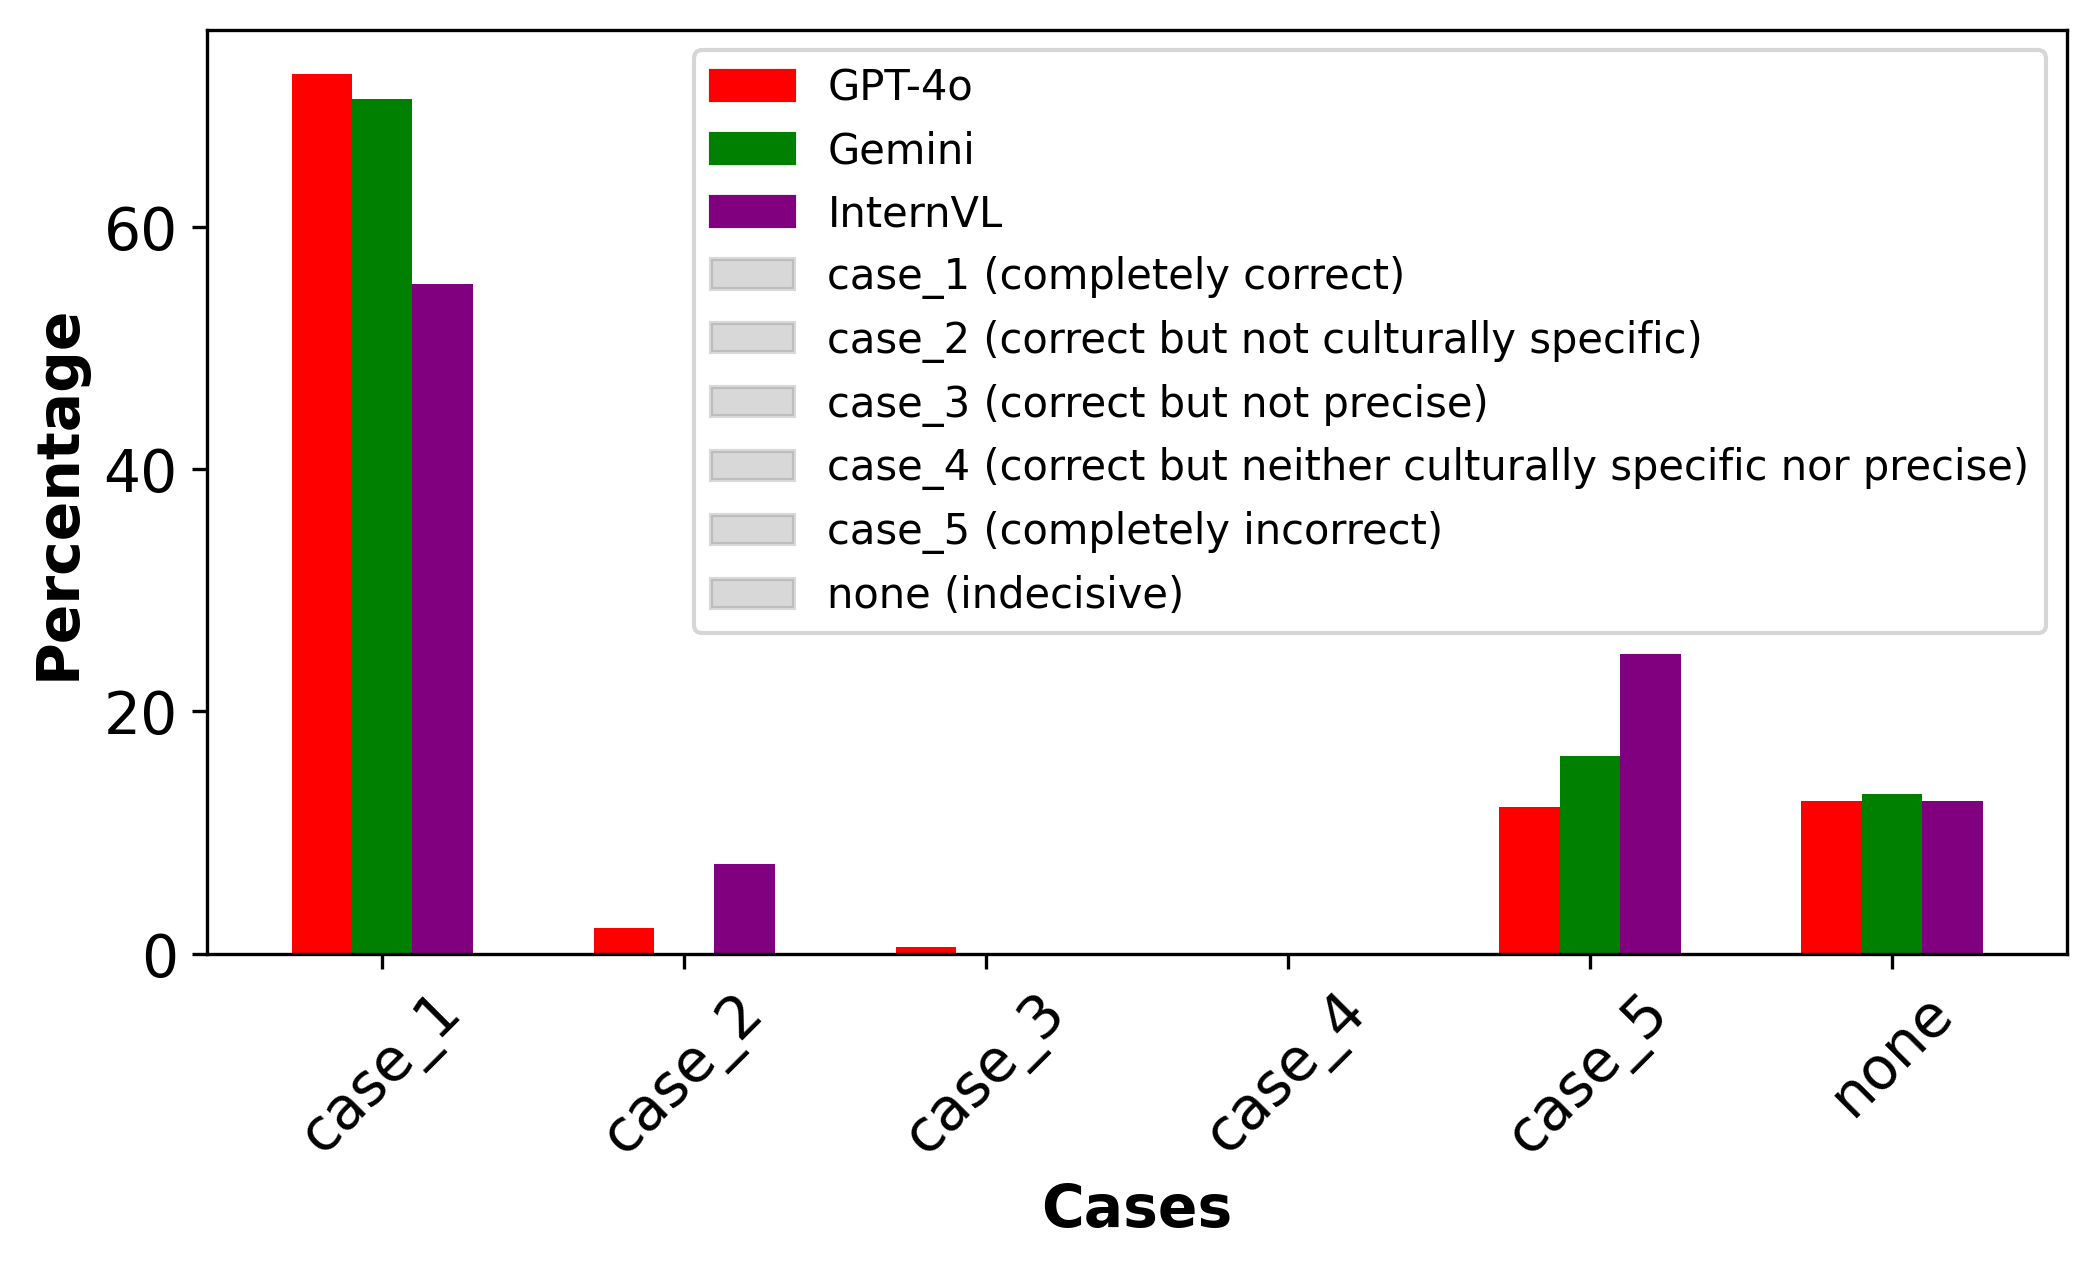
We evaluate responses from the three best-performing models, GPT-4, Gemini, and Intern-VL to questions from India, with each answer rated by 5 humans on a scale of 1 to 5, from completely correct to completely incorrect. See § K for details on the human evaluation study. Fig. 9 shows the percentage of questions that fall into each of the five scales.The models’ scores closely align with human judgments for case 1 scores, suggesting that our metric predicts answers to be correct only if they are both precise and culturally specific. We note that humans tend to rate model predictions higher than the LAVE metric. Finally, the evaluation shows that humans tend to choose the extreme ratings, considering most model responses as either fully accurate or entirely wrong.
Qualitative examples of model failures
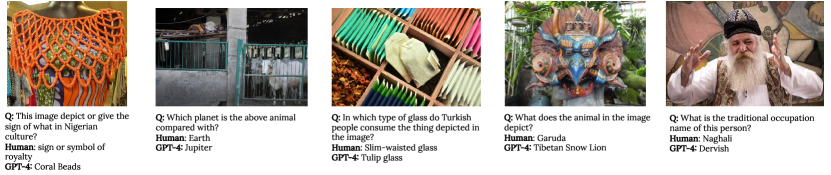
Our qualitative evaluation of the best-performing model, GPT-4, highlights its limitations in recognizing and interpreting cultural nuances. For instance, GPT-4 overlooks the cultural significance of intangible cultural concepts like coral beads in Nigeria, which symbolize wealth and heritage but are treated merely as decorative objects, as well as it fails to recognize the symbolic connection between cows and planet Earth in Indian culture (see Fig. 10). Focusing on tangible cultural concepts in Fig. 10, the model’s shortcomings are evident as it inaccurately recognizes cultural entities and objects. For instance, it mislabels Naghali, a traditional Iranian storyteller as a Dervish and mistakes a traditional Turkish tea glass for a tulip glass, commonly used for serving beer. These examples reveal how GPT-4 struggles with both tangible and intangible cultural concepts: it has difficulties distinguishing between visually similar but culturally distinct entities and objects, and it lacks a deep understanding of cultural beliefs and symbolic meanings.
6 Conclusions
In this paper, we highlight the significance of evaluating VLMs not just on general scene understanding but also on their ability to comprehend diverse cultural contexts. We introduce CulturalVQA, a novel cultural VQA benchmark for assessing VLMs on their cultural understanding. By curating a diverse collection of images from 11 countries across 5 continents and collecting 2,378 hand-crafted questions and 7,206 answers about cultural concepts presented in these images, written by annotators, we ensured a broad representation of cultural concepts pertinent to diverse cultural groups.
Benchmarking state-of-the-art models on CulturalVQA reveals notable disparities in their performance across regions. Specifically, models demonstrate substantially higher accuracy in answering questions related to North American cultures compared to African-Islamic ones. Further, we find a stark performance disparity between closed- and open-source models, with a 29.78% gap between the highest-performing proprietary model and its open-source counterpart in the country for which the models perform the worst. The benchmarked VLMs also showed varying levels of proficiency across cultural facets, performing well on questions about clothing, rituals, and traditions, but less effectively on those concerning food and drink. Our results underscore the current limitations of VLMs in achieving uniform cultural comprehension and pinpoint specific areas that require improvement.
7 Limitations
Our study faces limitations due to our data collection methods, the scope of the CulturalVQA dataset, and our focus on the English language. We approximated cultural groups using geographical regions for annotator recruitment, potentially oversimplifying cultural identities and conflating culture with nationality due to practical constraints like annotator availability. Our use of English-only data may also miss key cultural nuances available only in native languages. Although our dataset aims for cultural diversity, it does not capture the full spectrum of global cultural diversity. Future work will expand the dataset to represent diverse cultures and regions more broadly and develop multilingual datasets for greater inclusivity.
Challenges in collecting culturally informative data
Collecting culturally rich content from diverse annotators proved challenging, particularly because the images and concepts were limited to those available on English-language websites. This restriction likely omits important cultural details. Allowing annotators to skip inadequate images did not fully overcome the drawbacks of limited image quality, impacting the depth of the questions created.
8 Ethical Considerations
Our CulturalVQA benchmark involves culturally specific questions and answers, developed by professional annotators from the relevant countries. We sought wide cultural representation by engaging with three different communities, compensating annotators at $10-15 per hour for both included and excluded contributions after pilot testing. This reflects our best effort to maintain fairness and inclusivity in our data collection process.
Despite these efforts, we recognize our approach’s limitation in equating cultural groups with national borders, potentially overlooking the complex realities of minority and diaspora communities. We urge future research to explore finer distinctions within cultural groups to enhance representation. Although we have rigorously tried to remove biases, some subjective content may persist; however, a substantial portion of the dataset has been verified as unbiased (see § E). We acknowledge these constraints but are hopeful that our work will advance the understanding of cultural nuances in VLMs.
9 Acknowledgements
We would like to extend our gratitude to David Ifeoluwa Adelani for connecting us with Masakhane, Fırat Öncel for assisting with annotators in Turkey, Saba Ahamadi for securing annotators from Iran, and Qian Yang for sourcing annotators from China. We also appreciate the valuable feedback provided by Ibrahim Alabdulmohsin on the early draft. The technical support from the Mila IDT team in managing the computational infrastructure is greatly appreciated. We would also like to thank Chris Emezue for his assistance in helping with payments for the annotators. Additionally, Aishwarya Agrawal received support from the Canada CIFAR AI Chair award throughout this project. Karolina Stańczak was supported by the Mila P2v5 grant and the Mila-Samsung grant. This project was generously funded by a research grant from Google.
References
- Adilazuarda et al. (2024) Muhammad Farid Adilazuarda, Sagnik Mukherjee, Pradhyumna Lavania, Siddhant Singh, Ashutosh Dwivedi, Alham Fikri Aji, Jacki O’Neill, Ashutosh Modi, and Monojit Choudhury. 2024. Towards measuring and modeling “culture” in LLMs: A survey. Preprint, arXiv:2403.15412.
- Bender and Friedman (2018) Emily M. Bender and Batya Friedman. 2018. Data statements for natural language processing: Toward mitigating system bias and enabling better science. Transactions of the Association for Computational Linguistics, 6:587–604.
- Bugliarello et al. (2022) Emanuele Bugliarello, Fangyu Liu, Jonas Pfeiffer, Siva Reddy, Desmond Elliott, Edoardo Maria Ponti, and Ivan Vulić. 2022. IGLUE: A benchmark for transfer learning across modalities, tasks, and languages. In Proceedings of the 39th International Conference on Machine Learning, volume 162 of Proceedings of Machine Learning Research, pages 2370–2392. PMLR.
- Changpinyo et al. (2023) Soravit Changpinyo, Linting Xue, Michal Yarom, Ashish Thapliyal, Idan Szpektor, Julien Amelot, Xi Chen, and Radu Soricut. 2023. MaXM: Towards multilingual visual question answering. In Findings of the Association for Computational Linguistics: EMNLP 2023, pages 2667–2682, Singapore. Association for Computational Linguistics.
- Chen et al. (2024) Zhe Chen, Weiyun Wang, Hao Tian, Shenglong Ye, Zhangwei Gao, Erfei Cui, Wenwen Tong, Kongzhi Hu, Jiapeng Luo, Zheng Ma, et al. 2024. How far are we to GPT-4V? Closing the gap to commercial multimodal models with open-source suites. arXiv preprint arXiv:2404.16821.
- Dai et al. (2024) Wenliang Dai, Junnan Li, Dongxu Li, Anthony Meng Huat Tiong, Junqi Zhao, Weisheng Wang, Boyang Li, Pascale N Fung, and Steven Hoi. 2024. InstructBLIP: Towards general-purpose vision-language models with instruction tuning. Advances in Neural Information Processing Systems, 36.
- Gaviria Rojas et al. (2022) William Gaviria Rojas, Sudnya Diamos, Keertan Kini, David Kanter, Vijay Janapa Reddi, and Cody Coleman. 2022. The dollar street dataset: Images representing the geographic and socioeconomic diversity of the world. In Advances in Neural Information Processing Systems, volume 35, pages 12979–12990. Curran Associates, Inc.
- Gemini Team et al. (2023) Gemini Team et al. 2023. Gemini: A Family of Highly Capable Multimodal Models. arXiv e-prints, arXiv:2312.11805.
- Haerpfer et al. (2022) Christian Haerpfer, Ronald Inglehart, Alejandro Moreno, Christian Welzel, Kseniya Kizilova, Marta Lagos, Juan Diez-Medrano, Pippa Norris, Eduard Ponarin, and Bi Puranen. 2022. World Values Survey: Round seven - country-pooled datafile version 3.0. Madrid, Spain & Vienna, Austria: JD Systems Institute & WVSA Secretariat.
- Hershcovich et al. (2022) Daniel Hershcovich, Stella Frank, Heather Lent, Miryam de Lhoneux, Mostafa Abdou, Stephanie Brandl, Emanuele Bugliarello, Laura Cabello Piqueras, Ilias Chalkidis, Ruixiang Cui, Constanza Fierro, Katerina Margatina, Phillip Rust, and Anders Søgaard. 2022. Challenges and strategies in cross-cultural NLP. In Proceedings of the 60th Annual Meeting of the Association for Computational Linguistics (Volume 1: Long Papers), pages 6997–7013, Dublin, Ireland. Association for Computational Linguistics.
- Hessel et al. (2021) Jack Hessel, Ari Holtzman, Maxwell Forbes, Ronan Le Bras, and Yejin Choi. 2021. CLIPScore: A reference-free evaluation metric for image captioning. In Proceedings of the 2021 Conference on Empirical Methods in Natural Language Processing, pages 7514–7528, Online and Punta Cana, Dominican Republic. Association for Computational Linguistics.
- Hofstede et al. (2010) Geert Hofstede, Gert Jan Hofstede, and Michael Minkov. 2010. Cultures and organizations: software of the mind: intercultural cooperation and its importance for survival, 3rd edition. McGraw-Hill, New York; London.
- Laurençon et al. (2024) Hugo Laurençon, Léo Tronchon, Matthieu Cord, and Victor Sanh. 2024. What matters when building vision-language models? arXiv preprint arXiv:2405.02246.
- Li et al. (2023) Junnan Li, Dongxu Li, Silvio Savarese, and Steven Hoi. 2023. BLIP-2: Bootstrapping language-image pre-training with frozen image encoders and large language models. In International Conference on Machine Learning, pages 19730–19742.
- Lin et al. (2014) Tsung-Yi Lin, Michael Maire, Serge Belongie, James Hays, Pietro Perona, Deva Ramanan, Piotr Dollár, and C. Lawrence Zitnick. 2014. Microsoft COCO: Common objects in context. In Computer Vision – ECCV 2014, pages 740–755, Cham. Springer International Publishing.
- Liu et al. (2021) Fangyu Liu, Emanuele Bugliarello, Edoardo Maria Ponti, Siva Reddy, Nigel Collier, and Desmond Elliott. 2021. Visually grounded reasoning across languages and cultures. In Proceedings of the 2021 Conference on Empirical Methods in Natural Language Processing, pages 10467–10485, Online and Punta Cana, Dominican Republic. Association for Computational Linguistics.
- Liu et al. (2024) Haotian Liu, Chunyuan Li, Yuheng Li, Bo Li, Yuanhan Zhang, Sheng Shen, and Yong Jae Lee. 2024. LLaVA-NeXT: Improved reasoning, OCR, and world knowledge.
- Liu et al. (2023) Haotian Liu, Chunyuan Li, Qingyang Wu, and Yong Jae Lee. 2023. Visual instruction tuning. In Advances in Neural Information Processing Systems, volume 36, pages 34892–34916. Curran Associates, Inc.
- Lu et al. (2024) Yujie Lu, Dongfu Jiang, Wenhu Chen, William Wang, Yejin Choi, and Bill Yuchen Lin. 2024. WildVision Arena: Benchmarking multimodal LLMs in the wild.
- Mañas et al. (2024) Oscar Mañas, Benno Krojer, and Aishwarya Agrawal. 2024. Improving automatic VQA evaluation using large language models. In Proceedings of the AAAI Conference on Artificial Intelligence, volume 38, pages 4171–4179. AAAI.
- Nguyen et al. (2023) Tuan-Phong Nguyen, Simon Razniewski, Aparna Varde, and Gerhard Weikum. 2023. Extracting cultural commonsense knowledge at scale. In Proceedings of the ACM Web Conference, page 1907–1917.
- OpenAI (2023) OpenAI. 2023. Gpt-4v. Retrieved from https://cdn.openai.com/papers/GPTV_System_Card.pdf.
- Peng et al. (2023) Zhiliang Peng, Wenhui Wang, Li Dong, Yaru Hao, Shaohan Huang, Shuming Ma, and Furu Wei. 2023. Kosmos-2: Grounding multimodal large language models to the world. arXiv preprint arXiv:2306.14824.
- Pouget et al. (2024) Angéline Pouget, Lucas Beyer, Emanuele Bugliarello, Xiao Wang, Andreas Peter Steiner, Xiaohua Zhai, and Ibrahim Alabdulmohsin. 2024. No filter: Cultural and socioeconomic diversity in contrastive vision-language models. arXiv preprint arXiv:22405.13777.
- Radford et al. (2021) Alec Radford, Jong Wook Kim, Chris Hallacy, Aditya Ramesh, Gabriel Goh, Sandhini Agarwal, Girish Sastry, Amanda Askell, Pamela Mishkin, Jack Clark, Gretchen Krueger, and Ilya Sutskever. 2021. Learning transferable visual models from natural language supervision. In Proceedings of the 38th International Conference on Machine Learning, volume 139 of Proceedings of Machine Learning Research, pages 8748–8763. PMLR.
- Raffel et al. (2020) Colin Raffel, Noam Shazeer, Adam Roberts, Katherine Lee, Sharan Narang, Michael Matena, Yanqi Zhou, Wei Li, and Peter J. Liu. 2020. Exploring the limits of transfer learning with a unified text-to-text transformer. J. Mach. Learn. Res., 21(1).
- Romero et al. (2024) David Romero, Chenyang Lyu, Haryo Akbarianto Wibowo, Teresa Lynn, Injy Hamed, Aditya Nanda Kishore, Aishik Mandal, Alina Dragonetti, Artem Abzaliev, Atnafu Lambebo Tonja, Bontu Fufa Balcha, Chenxi Whitehouse, Christian Salamea, Dan John Velasco, David Ifeoluwa Adelani, David Le Meur, Emilio Villa-Cueva, Fajri Koto, Fauzan Farooqui, Frederico Belcavello, Ganzorig Batnasan, Gisela Vallejo, Grainne Caulfield, Guido Ivetta, Haiyue Song, Henok Biadglign Ademtew, Hernán Maina, Holy Lovenia, Israel Abebe Azime, Jan Christian Blaise Cruz, Jay Gala, Jiahui Geng, Jesus-German Ortiz-Barajas, Jinheon Baek, Jocelyn Dunstan, Laura Alonso Alemany, Kumaranage Ravindu Yasas Nagasinghe, Luciana Benotti, Luis Fernando D’Haro, Marcelo Viridiano, Marcos Estecha-Garitagoitia, Maria Camila Buitrago Cabrera, Mario Rodríguez-Cantelar, Mélanie Jouitteau, Mihail Mihaylov, Mohamed Fazli Mohamed Imam, Muhammad Farid Adilazuarda, Munkhjargal Gochoo, Munkh-Erdene Otgonbold, Naome Etori, Olivier Niyomugisha, Paula Mónica Silva, Pranjal Chitale, Raj Dabre, Rendi Chevi, Ruochen Zhang, Ryandito Diandaru, Samuel Cahyawijaya, Santiago Góngora, Soyeong Jeong, Sukannya Purkayastha, Tatsuki Kuribayashi, Thanmay Jayakumar, Tiago Timponi Torrent, Toqeer Ehsan, Vladimir Araujo, Yova Kementchedjhieva, Zara Burzo, Zheng Wei Lim, Zheng Xin Yong, Oana Ignat, Joan Nwatu, Rada Mihalcea, Thamar Solorio, and Alham Fikri Aji. 2024. CVQA: Culturally-diverse multilingual visual question answering benchmark. arXiv preprint arXiv:22406.05967, arXiv:2406.05967.
- Thapliyal et al. (2022) Ashish V. Thapliyal, Jordi Pont Tuset, Xi Chen, and Radu Soricut. 2022. Crossmodal-3600: A massively multilingual multimodal evaluation dataset. In Proceedings of the 2022 Conference on Empirical Methods in Natural Language Processing, pages 715–729, Abu Dhabi, United Arab Emirates. Association for Computational Linguistics.
- Weyand et al. (2020) T. Weyand, A. Araujo, B. Cao, and J. Sim. 2020. Google landmarks dataset v2 – a large-scale benchmark for instance-level recognition and retrieval. In 2020 IEEE/CVF Conference on Computer Vision and Pattern Recognition (CVPR), pages 2572–2581, Los Alamitos, CA, USA. IEEE Computer Society.
- Yin et al. (2021) Da Yin, Liunian Harold Li, Ziniu Hu, Nanyun Peng, and Kai-Wei Chang. 2021. Broaden the vision: Geo-diverse visual commonsense reasoning. In Proceedings of the 2021 Conference on Empirical Methods in Natural Language Processing, pages 2115–2129, Online and Punta Cana, Dominican Republic. Association for Computational Linguistics.
- Zhu et al. (2023) Wanrong Zhu, Jack Hessel, Anas Awadalla, Samir Yitzhak Gadre, Jesse Dodge, Alex Fang, Youngjae Yu, Ludwig Schmidt, William Yang Wang, and Yejin Choi. 2023. Multimodal C4: An open, billion-scale corpus of images interleaved with text. arXiv preprint arXiv:2304.06939.
Appendix
A Data Statement
We provide a data statement (Bender and Friedman, 2018) to document the generation and provenance of CulturalVQA.
Curation Rationale
CulturalVQA benchmark is designed to evaluate VLMs’ cultural understanding capacities across various cultures. The images are sourced from the CANDLE dataset (Nguyen et al., 2023), which offers a comprehensive collection of Cultural Commonsense Knowledge (CCSK) from the C4 corpus (Raffel et al., 2020), consisting of 1.1 million entries each linked to relevant CCSK data via URLs to webpages. Annotators writing questions and answers for this project are recruited through the MTurk platform, an African NLP organization, and an international academic AI research institute.
Language Variety
All texts included in the dataset are in English, primarily authored by non-native speakers, and may thus contain ungrammatical structures both in questions and answers.
Annotator Demographics
All annotators come from the following 11 countries: China, Turkey, Iran, Ethiopia, Nigeria, Rwanda, Germany, USA, Canada, Brazil, and India. Other demographics such as age and gender are unknown. All annotators were compensated at an hourly rate of 10-15$ per hour depending on a task and the number of completed HITs.
B Image Filtering
Given the potential noise inherent in an image dataset derived from web scraping, we implement a series of heuristic filters to refine our selection. First, we apply aspect ratio filtering, retaining only images with an aspect ratio between 0.5 and 2, effectively removing many banner-like advertisements. Next, we discard any images smaller than 100 pixels due to their inadequate detail for analysis. We also exclude images containing specific keywords such as “logo” and “social,” which typically denote non-relevant graphics or branding content.
To guarantee the high quality of images included in our benchmark, we first employed CLIP similarity (Hessel et al., 2021) to rank the remaining images for cultural relevance. Based on a manual annotation of images for 200 CCSK assertions, to assess their relevance to the CCSK, we set a threshold of 23 to ensure culturally relevant images (precision = 0.92, recall = 0.96). Images below this score were discarded. Higher-scoring images were more likely to be selected for question creation.
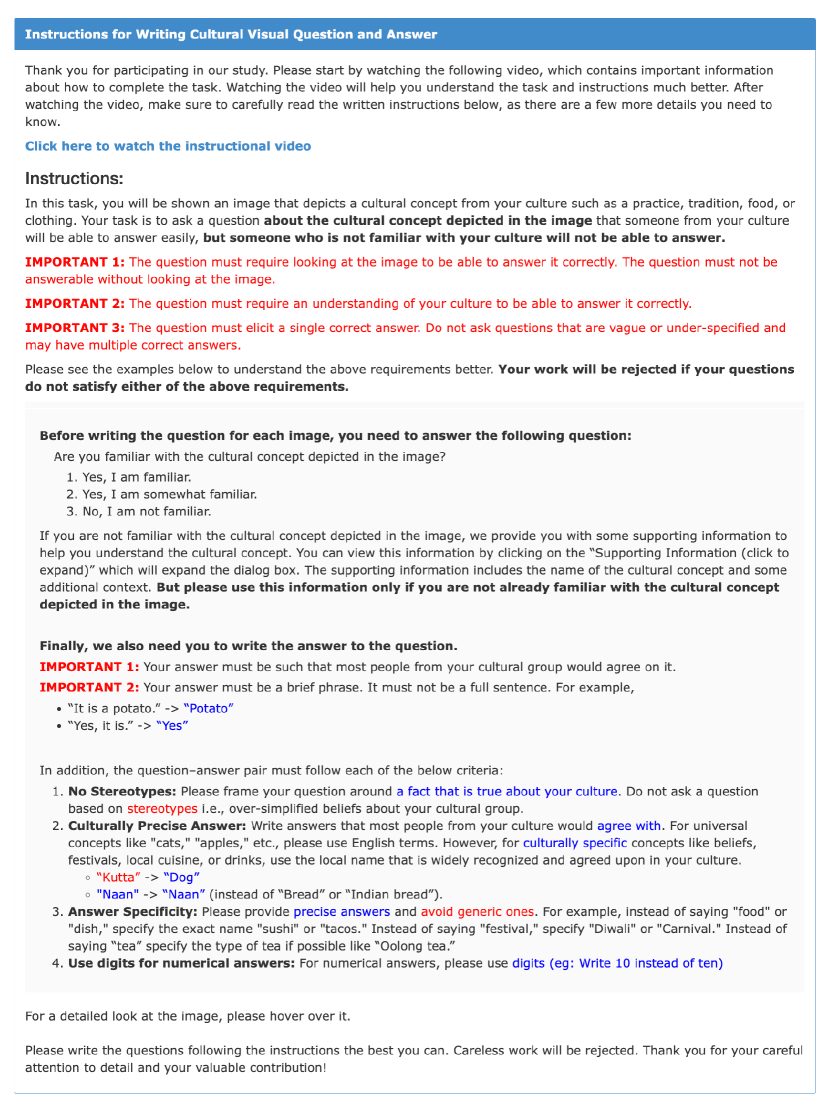
C Instructions for Human Question Generation
The detailed instructions given to the annotators for writing questions can be found in Fig. 12.
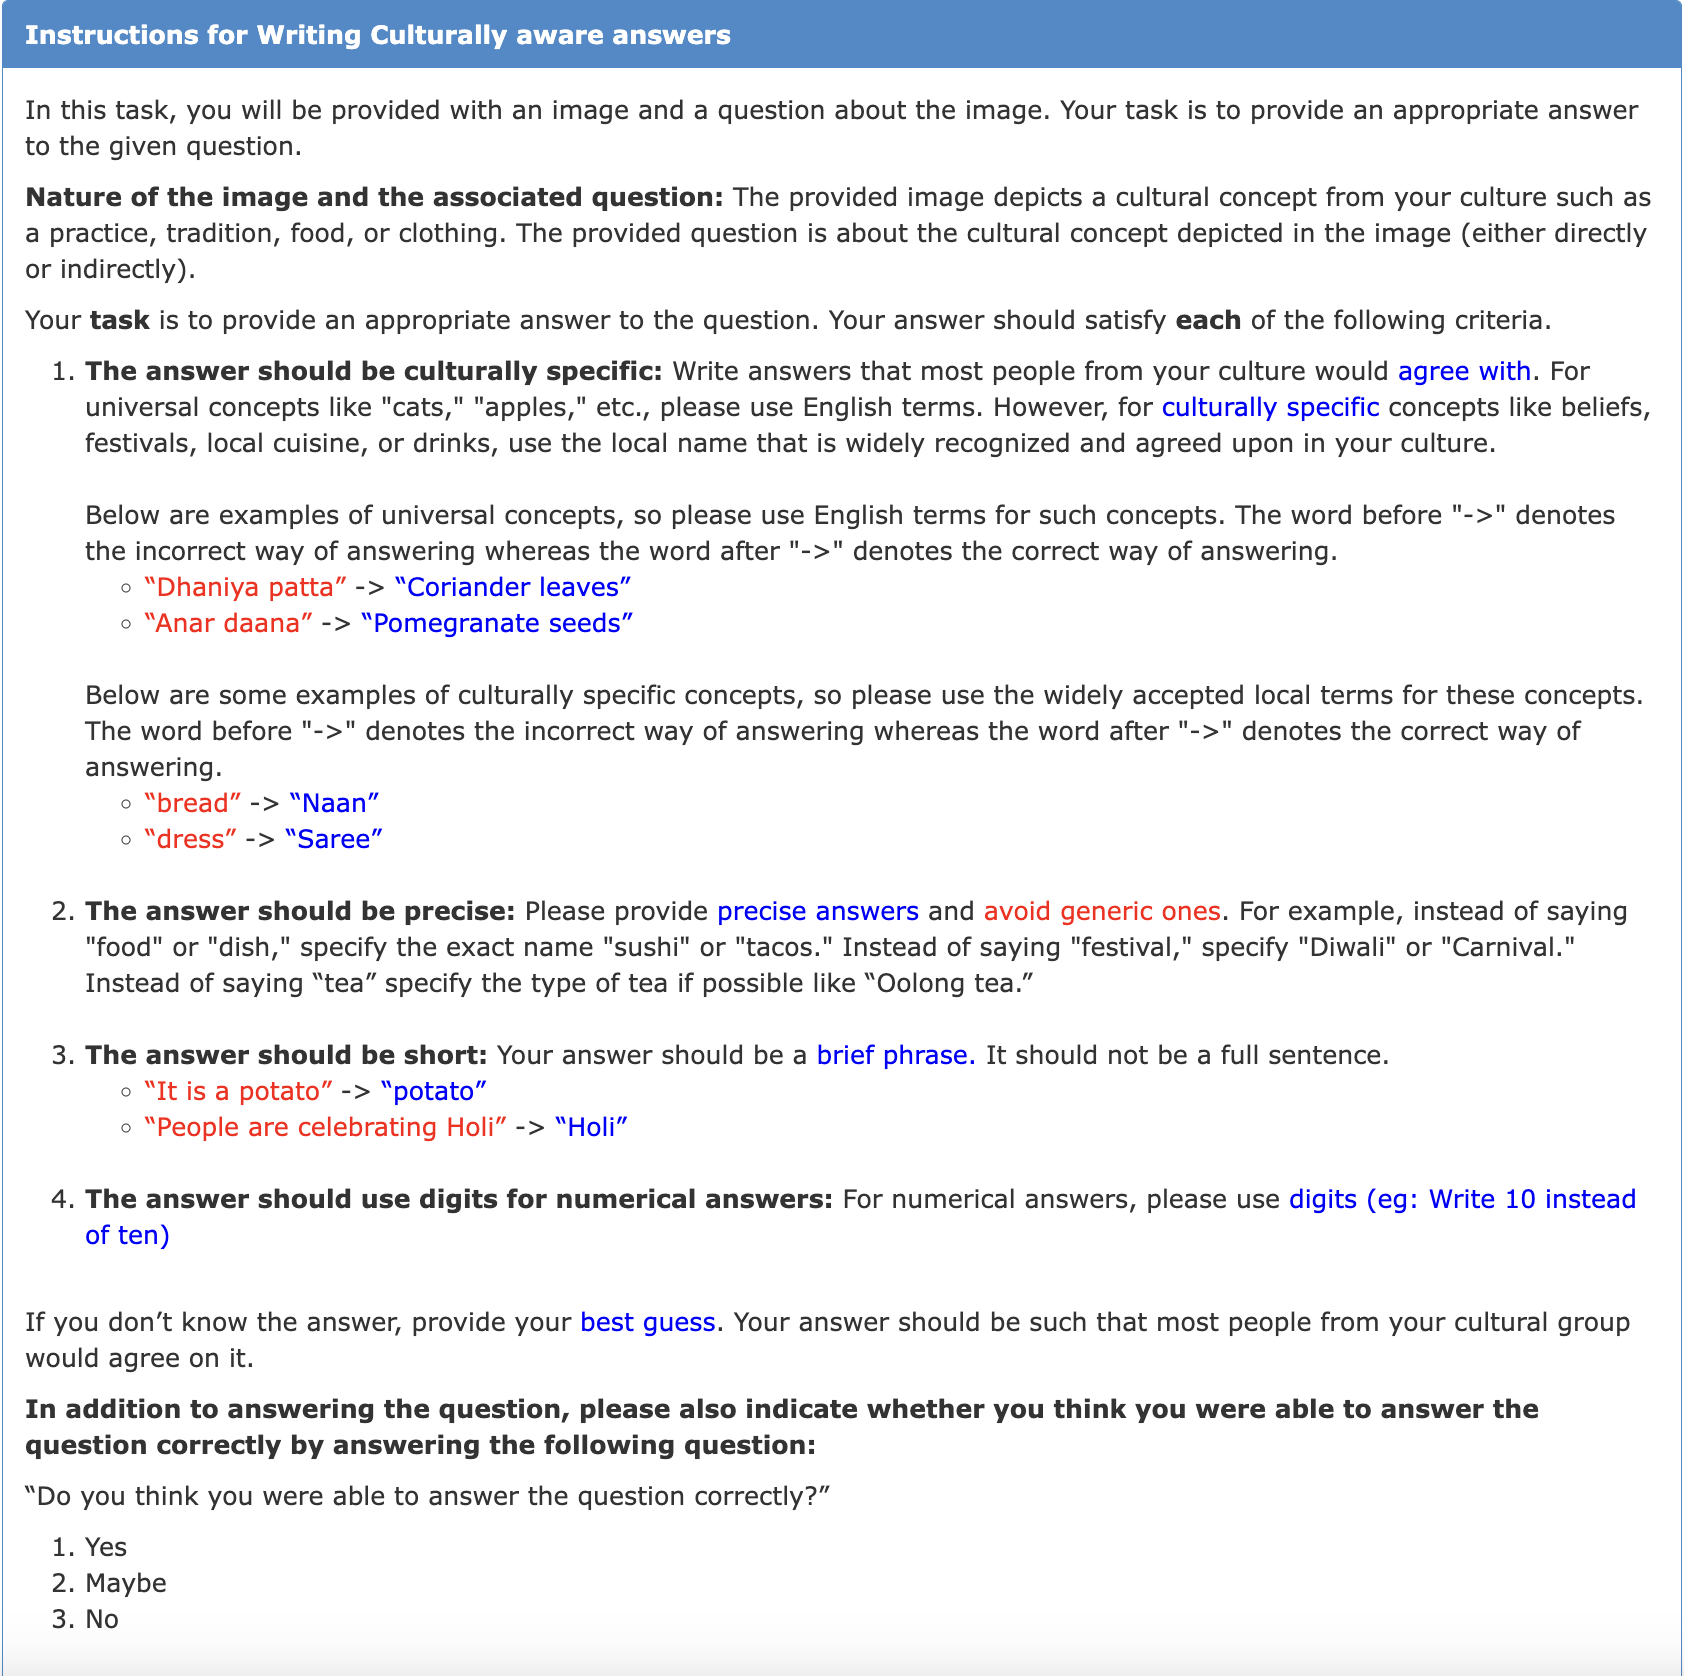
D Instructions for Human Answer Generation
The instructions provided to the annotators for collecting answers are detailed in Fig. 13.
E Stereotypes and Biases
To ascertain the representational fairness of our dataset, we implemented a Sentence-Level Stereotype Classifier,555https://huggingface.co/wu981526092/Sentence-Level-Stereotype-Detector a transformer-based model, for detecting stereotypical content within the dataset’s questions. This model’s efficacy in classifying sentences based on the presence of stereotypes or anti-stereotypes was evaluated across various dimensions including race, gender, religion, and profession. The classifier identified relatively few stereotypical instances: 69 cases pertained to race, 44 to gender, 22 to religion, and 8 to profession. In contrast, anti-stereotypical content was more prevalent, with 169 cases for race, 25 for religion, 23 for gender, and 7 for profession. A significant portion of the data, 923 instances, did not correlate with any stereotypical or anti-stereotypical categories, underscoring the minimal presence of biased content in the dataset. These findings support the dataset’s utility in facilitating unbiased and culturally comprehensive studies.
F System Prompt for the Evaluation Metric
G VLMs Used for Benchmarking
We benchmark the following state-of-the-art open-source VLMs on our proposed CulturalVQA dataset: Blip2 Li et al. (2023), InstructBlip Dai et al. (2024), Llava1.5 Liu et al. (2023), Llava_Next Liu et al. (2024), Idefics2 Laurençon et al. (2024), and Intern-VL 1.5 Chen et al. (2024). These models were selected based on their release year and parameter size (7 to 25 billion) to test how these aspects affect cultural understanding. InstructBlip, fine-tuned with instruction tuning, is compared to Blip2 to see if instruction tuning enhances cultural understanding. Idefics2, with 8 billion parameters, is evaluated for its performance on open datasets, surpassing larger models. Intern-VL 1.5, with 25 billion parameters, bridges the gap between open-source and proprietary models, showing strong multimodal benchmark performance, even outperforming proprietary models on some benchmarks. Finally, we also evaluate closed-source models – GPT-4 (GPT-4o) and Gemini (Gemini-Pro-Vision 1.0) – using their API endpoints.
H Prompt for VLM Inference
I Prompt for Few-Shot Inference using GPT-4
J Inference Using Closed-Source Models
In this section, we provide the sample code used for accessing Gemini and GPT-4.
For performing inference using Gemini, we leverage the Vertex AI API for Gemini with multimodal prompts. The code snippet for inference is provided below.
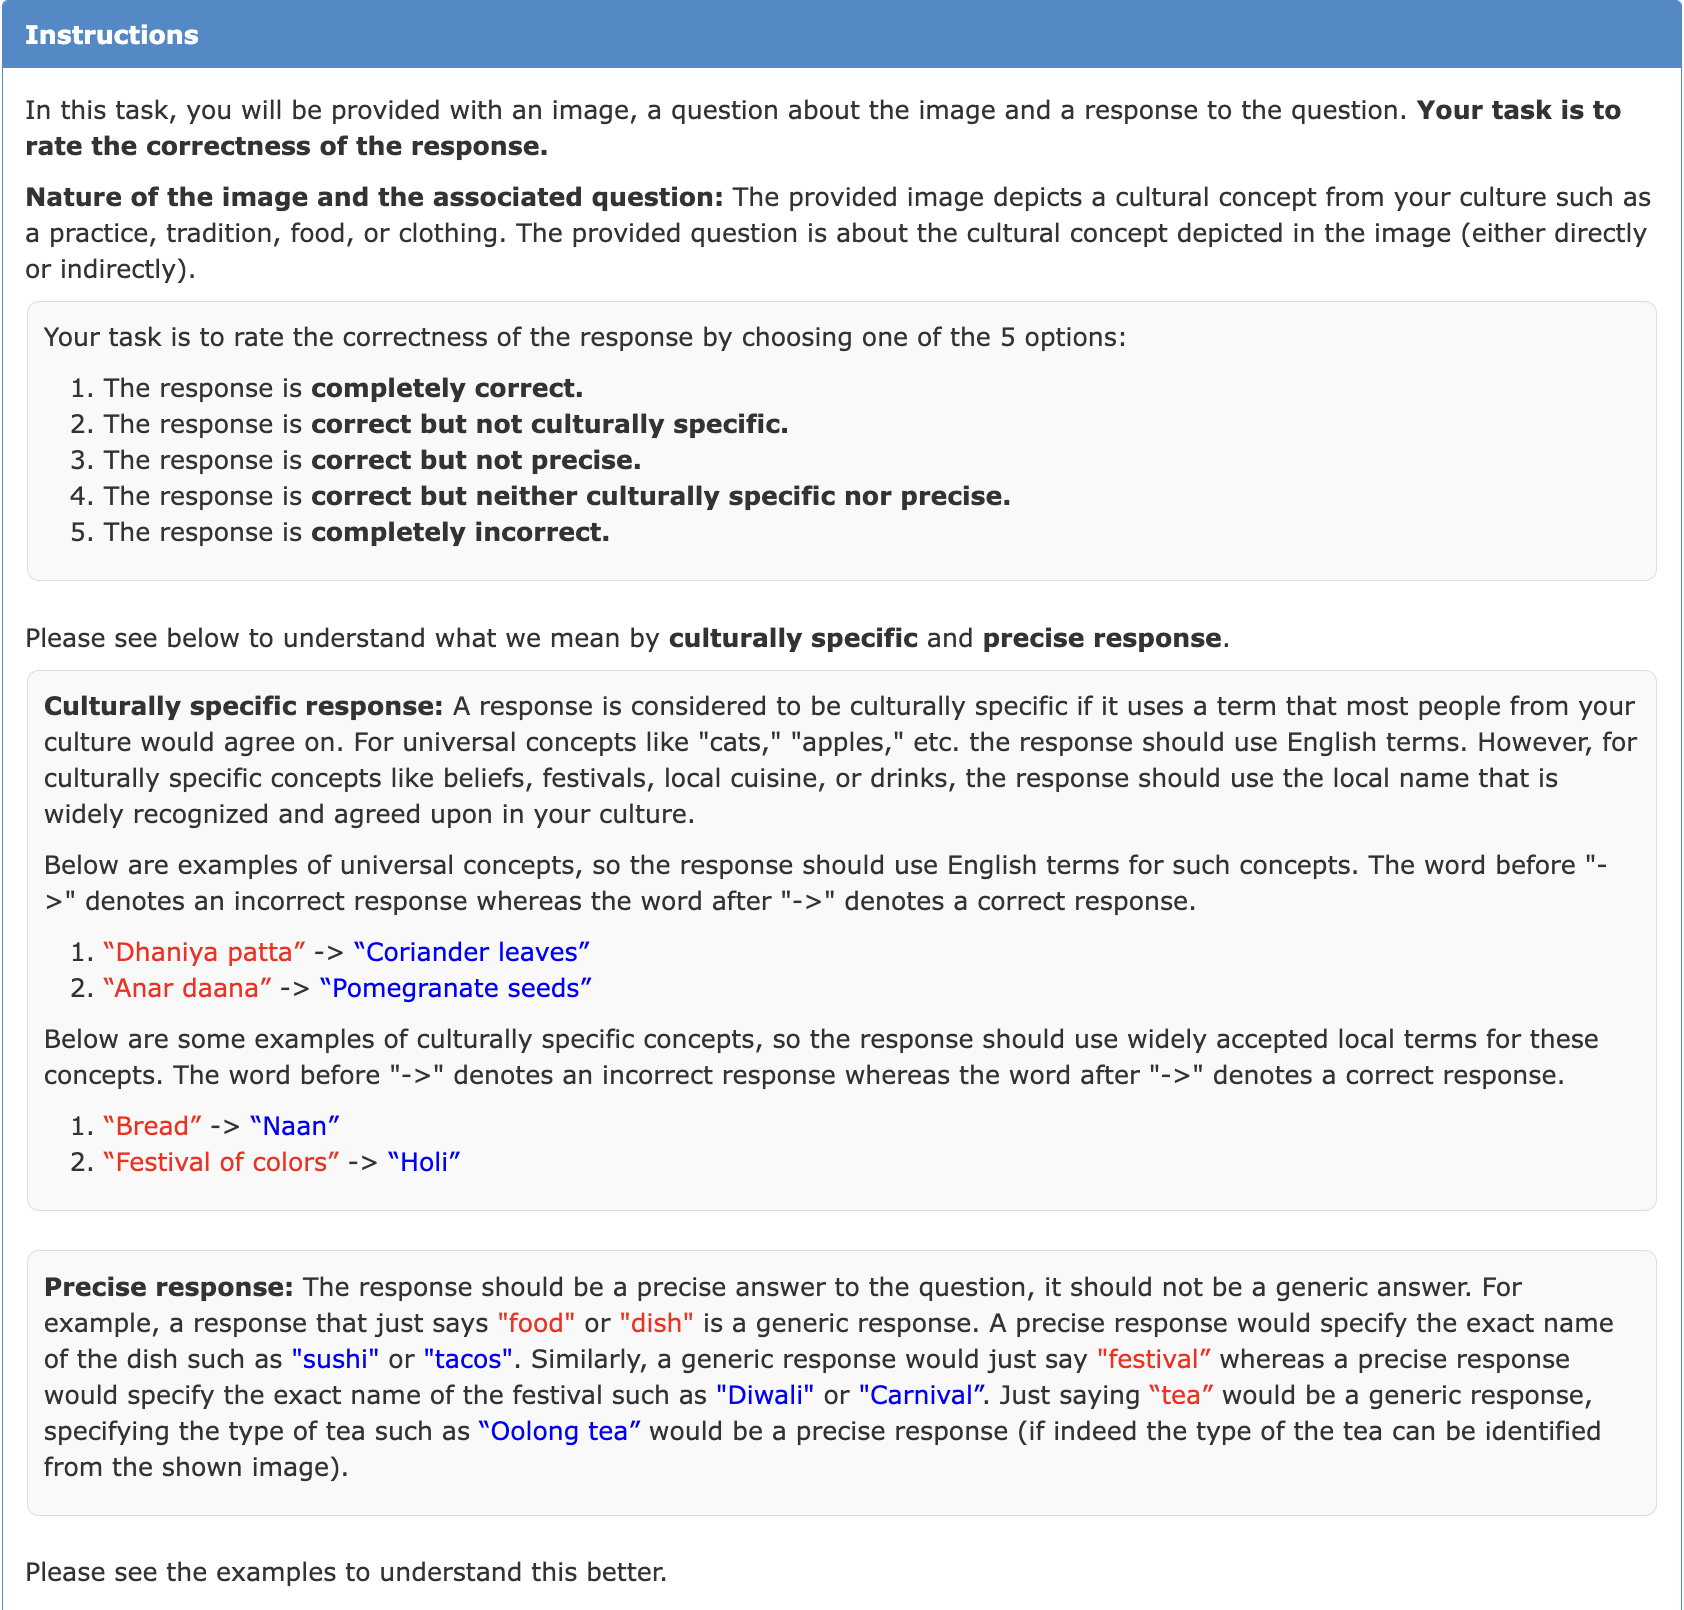
K Human Judgment of Model Predictions
We evaluate model responses for questions from India, with each answer rated by 5 humans on a scale of 1 to 5: 1 (completely correct), 2 (correct but not culturally specific), 3 (correct but not precise), 4 (correct but neither culturally specific nor precise), and 5 (completely incorrect). The detailed instructions given to the annotators can be found in Fig. 14.