Spontaneous Motion of Liquid Droplets on Soft Gradient Surfaces
Abstract
We report an experimental investigation of the spontaneous motion of liquid droplets on soft gels with a crosslinking gradient. By systematically adjusting the spatial difference in crosslinking density, we observed that millimeter-sized liquid droplets moved along the gradient of elastic modulus and even climbed tilted slopes against gravity. Unlike the wetting dynamics of micro-droplets, which are governed by elastocapillary effects, we demonstrated that the observed spontaneous movements of millimeter-sized droplets were attributed to the surface energy difference resulting from the variation in crosslinking density. Using in-situ confocal microscopy imaging, we analyzed the viscoelastic dissipation induced by the moving wetting ridges near dynamic contact lines. Based on the relationship between the crosslinking density and surface energy of soft gels, our findings reveal a new method for controlling droplet dynamics at soft and dissipative interfaces.
The dynamic wetting of droplets on soft interfaces plays a crucial role in various biological processes and engineering applications, including the mechanosensing of cells [1], tissue growth on soft substrates [2], microfluidic device design [3], and micro-scale drug delivery [4]. Moreover, moving liquid droplets have been used as probes to characterize the tribology and interfacial rheology of soft interfaces [5, 6, 7]. Therefore, a precise control of droplet motion on soft surfaces is highly desirable from both scientific and engineering perspectives.
However, the manipulation of droplet dynamics on compliant surfaces has been much less studied compared with that on rigid substrates [8, 9, 10, 11]. It is highly challenging to use traditional methods, such as chemical deposition and surface roughness patterning [12, 13], to modify the surface energy of soft surfaces due to the presence of diffusive solvents and solid capillarity. Consequently, while theoretical modelling have been employed to predict the droplet motion on soft gradient surfaces [14, 15, 16], there has been little direct experimental validation of these predictions. Previous research showed that micro-droplets can spontaneously move along thickness gradient on soft gels due to elastocapillary effects [17]. However, this spontaneous movement occurs only when the droplet sizes are as small as the elastocapillary length of the substrates, typically on the order of m.
In this work, we report an experimental observation of the spontaneous motion of millimeter-sized droplets on soft gel surfaces with a sharp gradient in crosslinking density. By combining the measurements of dynamic contact angels and confocal imaging of moving contact ridges, we demonstrated that the difference in crosslinking density leads to variations in the surface energy of soft gels. The resulting imbalance in contact forces can cause large liquid droplets to move spontaneously, thereby counter-balancing the viscoelastic dissipation from substrates and even overcoming gravity along a tilted surface.
I Experimental System
We prepared the soft substrates by mixing polydimethylsiloxane (PDMS) polymers (Gelest, DMS-V31) with dimethylsiloxane copolymer crosslinkers (Gelest, HMS-301). The resulting mixtures were cured into soft silicone gels at 40∘C for 24 hours. The elasticity of these gels was quantitatively controlled by the weight ratio of the crosslinkers () [18]. By systematically varying the crosslinking density from % to 5.0 %, the Young’s moduli of the cured gels ranged between kPa and kPa.
To create a soft gradient surface, we first fabricated a stiff gel film with a surface area of 5 cm 5 cm and a thickness of m. By maintaining %, we kept the Young‘s modulus of the stiff film in the range of kPa. We then cut out a 2 cm 1 cm rectangular piece from the center of the gel film, filled this rectangular hole with a PDMS mixture containing a low density of crosslinkers (), and cured the filled gel film. The resulting substrate comprised a soft region with a Young’s modulus of kPa was surrounded by a stiff region. To ensure that the entire substrate was flat, we precisely controlled the amount of added PDMS mixture by monitoring the interface between the soft and stiff regions using a high-resolution digital camera. Due to swelling effects, there was inevitably a 5 m deformed region near the boundary between soft and stiff gels (Supplemental Fig. S1). Nevertheless, throughout all our experiments, these boundary defects have remained substantially smaller than the sizes of droplets.
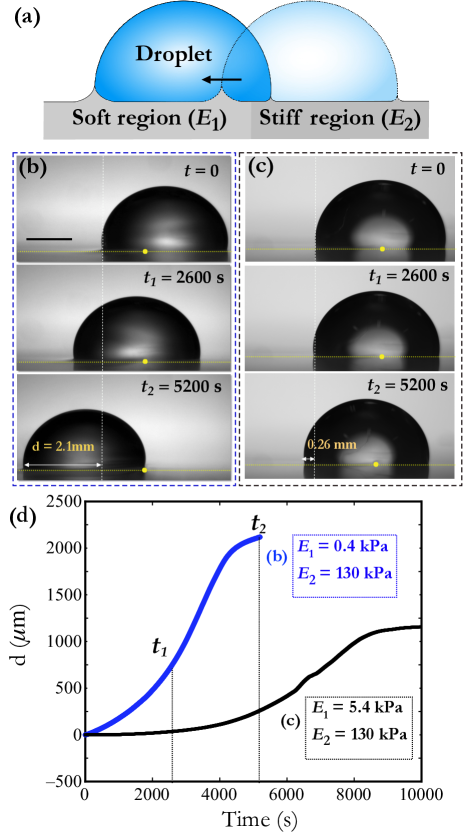
The droplets were composed of an aqueous mixture comprising % glycerol and % water, with an effective viscosity of cSt. As illustrated in Fig. 1(a), we initially placed a liquid droplet with a diameter of mm on the boundary between the soft and stiff gels ( s). By using two digital cameras, we simultaneously captured the side and bottom views of the droplet movements at s. The effective surface tension of these aqueous droplets on silicone gels was measured using the sessile droplet method [18] and found to be mN/m, . This value is significantly less than the surface tension of pure glycerol ( mN/m) due to the extraction of free chains at contact lines [19].
Figures 1(b) and (c) depict the spontaneous movements of an aqueous droplet on the substrates with different combinations of and . The white solid dots in the snapshots indicate the boundaries between gels. In both cases, the stiff regions had a constant kPa, while the Young’s moduli of soft regions varied from kPa in panel (b) to kPa in panel (c). The droplets on both substrates spontaneously moved along the gradient of crosslinking density, with the difference between and playing a crucial role in determining the moving speed. For instance, within 5200 s, the droplet in Fig. 1(b) moved a distance of 2.1 mm, while the droplet in (c) moved only 0.26 mm. The plots of displacement against time for these two droplets are presented in Fig. 1(d), which clearly demonstrate the influence of the crosslinking gradient on the droplet motion.
II Role of elastocapillarity
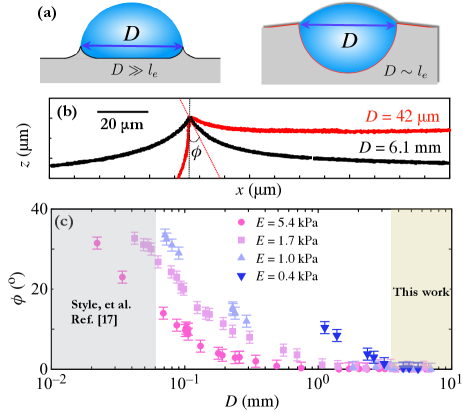
We first examined whether the elastocapillary effects of soft substrates were essential for the droplet movements that we observed. This effect is characterized by the elastocapillary length, , where is the surface stress of a soft substrate, respectively [20]. As shown in the schematic in Fig. 2(a), when the droplet diameter is close to the elasto-capillary length, , the contact line rotates by an angle relative to the non-rotating contact line of a large droplet, [20]. Given that depends on the substrate thickness, a previous study from Style et al. [17] showed that micro-droplets () spontaneously moved along soft substrates with a thickness gradient. In the present work, as the droplets were several millimeters in size, it is unlikely that the elastocapilllary effects were still crucial to the droplet movements. To confirm this assumption, we performed confocal imaging of static wetting profiles on soft gels with uniform Young’s moduli ranging from kPa to 5.4 kPa. By depositing a layer of 200 nm fluorescent particles at soft interfaces, we obtained the wetting profiles using a particle locating method [21]. For example, Fig. 2(b) shows the obtained wetting profiles induced by droplets with sizes of m and mm, respectively, on the same soft gel with kPa. As was approximately 15 m, we observed an apparent rotation of the wetting ridge for the smaller droplet ( m). The rotational angle of the contact line was quantitatively determined by comparing the two ridge profiles.
Figure 2(c) shows the plots of against on soft gels with different Young’s moduli ( kPa, 0.7 kPa, 1.5 kPa, and 5.4 kPa) and a constant sample thickness of m. For each , initially decreased with until it became negligible for large droplets. The critical droplet size that marked the crossover between the two regimes was characterized by and therefore decreased with . Across all the tested substrates, we consistently observed that as mm. Hence, for the millimeter-sized droplets in this study, we conclude that elastocapillarity played an insignificant role in driving the movements of the millimeter-sized droplets examined in this study.
III Driving forces on a moving droplet
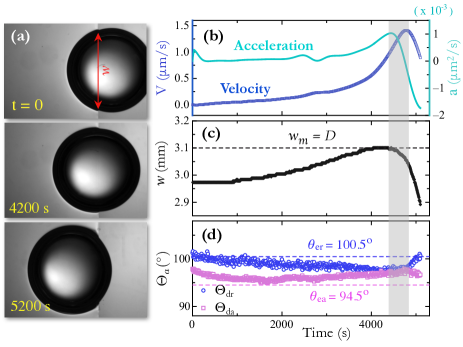
To understand the underlying mechanisms of the spontaneous droplet motion, we further measured the macroscopic shapes of a moving droplet. In Fig. 3(a), snapshots from a bottom view show a liquid droplet moving from a stiff region ( kPa) to a soft region ( kPa) over a 5200 s period. The center of this droplet was positioned in the stiff region at s. Subsequently, the droplet started moving towards the soft region and eventually came to a stop after crossing the boundary between the two regions at s. Figure 3(b) shows the changes in the velocity () and acceleration () of the center of the droplet over time. The peaks of and occurred at similar times, indicating significant dissipation force acting on the moving droplet.
We also characterized the width () of the droplet intersecting with the boundary between the two gels. Figure 3(c) shows the plot of against time, where the maximum width corresponds to the droplet diameter, . By comparing the plots in Figs. 3(b) and (c), we observed that both and reached their maximum values simultaneously. To validate the generality of this observation, we systematically varied both the droplet sizes () and the difference in the Young’s moduli between the two gels ( and ). Across all our measurements, the peak values of and were synchronized in time (Supplemental Fig. S2). This result indicates that the maximum force propelling a droplet consistently occurs when the center of the droplet reaches the boundary between the two gels.
Here, we consider the contact forces acting on the dynamic contact lines. At the advancing contact line of a moving droplet, the net lateral capillary force is given by
| (1) |
where and are the static and dynamic contact angles on the soft regions, respectively; and is a geometrical constant [6, 22]. Similarly, the lateral capillary force at the receding contact line can be written as
| (2) |
where and are the static and dynamic contact angles on the stiff regions, respectively. Therefore, the net contact force acting on the droplet becomes
| (3) |
In Eq. 3, the term in the first parenthesis represents the difference between the advancing and receding contact angles ( and ), while the term in the second parenthesis represents the difference between the equilibrium contact angles on soft and stiff gels ( and ).
To estimate , we measured the dynamic contact angles using a side camera. Figure 3(d) shows the plots of (red dots) and (blue circles) against time for the droplet shown in (a), with the solid red line and blue dashed line representing the equilibrium contact angles, and , respectively. Throughout the measurement period, and consistently, and thus both contact forces and remained positive during the droplet movement. At the boundary (), we found that . Hence, Eq. 3 gives the maximum driving force
| (4) |
As when in all the measurements (Supplemental Fig. S3), we concluded that was solely governed by the difference in equilibrium contact angles between the two gels ( and ).
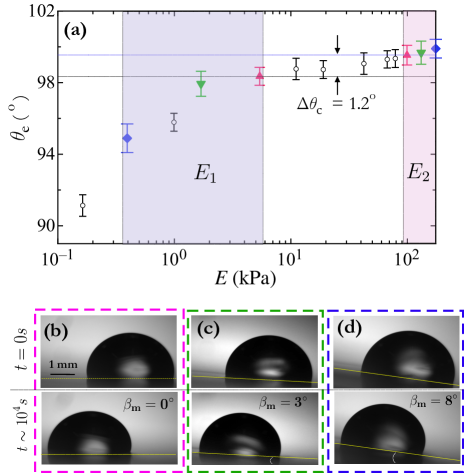
To relate and to the droplet dynamics, we systematically varied the combination of and . Figure 4(a) shows the equilibrium contact angle () of a 6-mm static droplet sitting on silicone gels with a constant thickness m but different Young’s moduli (). Considering the negligible influence of elastocapillarity on the contact angles of these large droplets, the plot indicates a decrease in surface energy of silicone gels with the reduction of crosslinking density. We focused on the ranges of and that are indicated by the two gray-shaded regions in the figure. We found that a minimum difference in the equilibrium contact angle was necessary to initiate spontaneous droplet motion.
To illustrate the tendency of these spontaneous movements, we analyzed how droplets climbed tilted surfaces against gravity. Figure 4(b) exhibits the steepest slopes, characterized by a tilted angle , for a droplet to climb spontaneously with different selections of and . For kPa and kPa, is approximately , which equals (green circles in Fig. 4(a)). Within experimental uncertainties, a 3.5-mm droplet could move only on a level substrate (). For kPa and kPa, , allowing a droplet to spontaneously climb a tilted plane with a maximum angle of . By further increasing the stiffness gradient by using kPa and kPa, the difference in equilibrium contact angle became as large as . Consequently, a droplet of the same size moved on a slope with . Thus, the behavior exhibited in Fig. 4(b) demonstrates how the difference between and controlled the spontaneous motion of droplets, as indicated by Eq. 4.
IV Dissipation from the substrates
As the droplets consistently stopped shortly after crossing the boundary between the soft and stiff regions of the substrate, we expect significant dissipations from the substrates. We first explored the viscoelastic contribution from the moving wetting ridges at contact lines [23, 24, 25]. The rheology of soft silicone gels is well described by the Chasset-Thrion model [18], as follows:
| (5) |
where is the linear shear modulus at zero frequency, and is a characteristic relaxation timescale. In a quasi-static regime () [24], the dissipative force resulting from a moving contact ridge can be estimated as [25]
| (6) |
where is the moving contact angle.
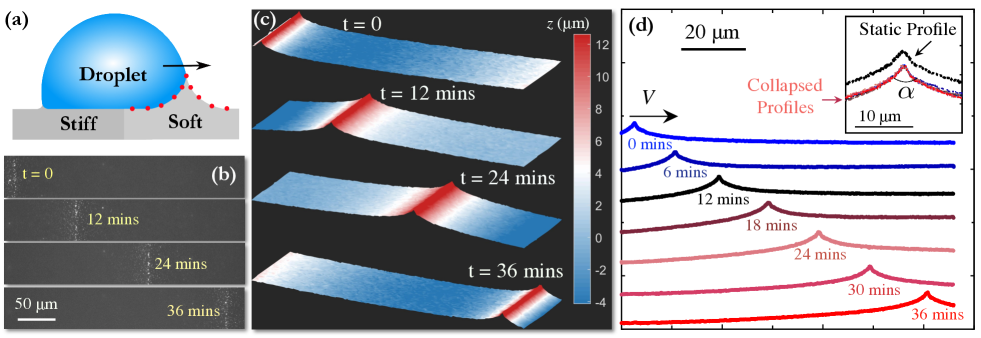
To assess the quasi-static condition assumed in Eq. 6, we employed confocal microscopy again to image a moving contact ridge in the advancing direction within the soft region. Conversely, the contact ridges within the stiff region ( kPa) were significantly smaller than 1 m, making them challenging to resolve through confocal microscopy. Figure 5(b) shows the fluorescence images of an advancing contact line on a soft region with kPa, while the Young’s modulus of the stiff region was kPa. A particle tracking method was used to obtain the reconstructed moving ridges, as shown in Fig. 5(c). Due to the azimuthal symmetry, the moving ridge profiles were further collapsed to two-dimensional plots, as depicted in Fig. 5(d). The moving speed of the droplet has been limited to the order of m/s, which was significantly lower than the critical speed m/s of the soft region (Supplemental Fig. S4). Therefore, we assumed that the quasi-static assumption of Eq. 6 remained valid. The inset in panel (d) further verifies that the local geometry of the moving ridge remained the consistent with the static profile, featuring a constant opening angle of . By considering the local stress balance determined by the Neumann triangle [20], we obtained the surface stress of the soft region, mN/m.
We quantitatively compared the maximum driving force with the dissipative force . With mm for the droplet shown in Fig. 5, we obtained N from Eq. 4. Furthermore, the viscoelasticity of the soft region was fitted to the Chasset–Thrion model with kPa, , and ms. As the maximum moving speed was less than m/s, we estimated from Eq. 6 that the dissipative force at the advancing contact line was N .
As the wetting ridges on the stiff region were too small to be imaged by confocal microscopy, we only estimated the upper bound of the dissipative force in the receding direction. A previous work has shown that the surface stress of silicone gels increases with crosslinking density, and that mN/m for kPa [18]. Hence, for the stiff region with kPa, we expect that mN/m. Moreover, fitting the complex moduli of silicone gels to the Chasset-Thrion model becomes challenging for kPa due to a short relaxation time scale, ms. By varying the crosslinking density (), we found that first decreased with for , and then asymptotically approached Pas when % (Supplemental Fig. S4). Hence, we expect that 20 Pas for kPa. By using mN/m and Pas, we estimated the upper bound of the dissipative force at the receding contact line as N from Eq. 6. Consequently, the total dissipative force induced by the moving wetting ridges, N, remains notably below the maximum driving force, N.
While we present the dissipation analysis of a representative moving droplet in Fig. 5, has consistently remained substantially less than in all our experiments. Therefore, we believe that other dissipative factors must have contributed to slowing down the droplets. Given the small capillary number of the moving droplets, , the viscous dissipation within the droplets can be neglected [22, 26]. We speculate that the pinning from the physical boundary between two gels was a significant contributor to the difference between and . Specifically, it is challenging to prevent interfacial deformations between cured gels with different crosslinking densities, and in this instance, the boundary served as a pinning defect and thus dissipated the force required for droplet movement [27].
V Conclusions
In this study, we reported an experimental observations of spontaneous droplet motion on the surfaces of soft gels (Fig. 1). The movements were induced by the contact angle difference between gels with different Young’s moduli (Fig. 3) but dissipated by the deformed substrates (Fig. 5). We experimentally demonstrated that increasing the gradient of crosslinking density enables a droplet to climb a tilted plane with a steeper slope (Fig. 4).
As the moving droplets were a few millimeters in size, the elastocapillary effects of the soft substrates, which were previously investigated [17], played an insignificant role in this study (Fig. 2). We attribute the spontaneous droplet migration to the surface energy gradient that resulted from the spatially varying crosslinking densities. This conclusion is consistent with the findings of our previous study, which explored the role of crosslinking density in the surface stress and surface energy of soft gels [18]. The present study demonstrated an effective approach for controlling droplet motion on soft interfaces. In future work, it will be appealing to realize systems with a continuous gradient of crosslinking density, as such systems may prevent dissipations from boundaries between sharply changing gel matrices. Consequently, experimental studies of such systems may yield results that can be directly compared with the existing theoretical predictions [14, 15, 16].
Acknowledgment
We thank Caishan Yan and Chang Xu for use discussions. This study was financially supported by the General Research Funds (16305821 and 16306723), the Early Career Scheme (26309620), and the Collaborative Research Fund (C6004-22Y) from the Hong Kong Research Grants Council. We also thank the support from the Department of Science and Technology of Guangdong Province Collaborative Research Grant (2023A0505030017).
References
- Trichet et al. [2012] L. Trichet, J. L. Digabel, R. J. Hawkins, S. R. K. Vedula, M. Gupta, C. Ribrault, P. Hersen, R. Voituriez, and B. Ladoux, Evidence of a large-scale mechanosensing mechanism for cellular adaptation to substrate stiffness, Proceedings of the National Academy of Sciences 109, 6933 (2012).
- Discher et al. [2005] D. E. Discher, P. Janmey, and Y. li Wang, Tissue cells feel and respond to the stiffness of their substrate, Science 310, 1139 (2005).
- Zhu and Wang [2022] P. Zhu and L. Wang, Microfluidics-enabled soft manufacture of materials with tailorable wettability, Chemical Reviews 122, 7010 (2022).
- Yuan and Zhao [2010] Q. Yuan and Y.-P. Zhao, Precursor film in dynamic wetting, electrowetting, and electro-elasto-capillarity, Phys. Rev. Lett. 104, 246101 (2010).
- Lhermerout et al. [2016] R. Lhermerout, H. Perrin, E. Rolley, B. Andreotti, and K. Davitt, A moving contact line as a rheometer for nanometric interfacial layers, Nature Communications 7, 12545 (2016).
- Gao et al. [2018] N. Gao, F. Geyer, D. W. Pilat, S. Wooh, D. Vollmer, H.-J. Butt, and R. Berger, How drops start sliding over solid surfaces, Nature Physics 14, 191 (2018).
- Khattak et al. [2022] H. K. Khattak, S. Karpitschka, J. H. Snoeijer, and K. Dalnoki-Veress, Direct force measurement of microscopic droplets pulled along soft surfaces, Nature Communications 13, 4436 (2022).
- Wong et al. [2011] T.-S. Wong, S. H. Kang, S. K. Y. Tang, E. J. Smythe, B. D. Hatton, A. Grinthal, and J. Aizenberg, Bioinspired self-repairing slippery surfaces with pressure-stable omniphobicity, Nature 477, 443 (2011).
- Chaudhury and Whitesides [1992] M. K. Chaudhury and G. M. Whitesides, How to make water run uphill, Science 256, 1539 (1992).
- Lafuma and Quéré [2003] A. Lafuma and D. Quéré, Superhydrophobic states, Nature Materials 2, 457 (2003).
- Courbin et al. [2007] L. Courbin, E. Denieul, E. Dressaire, M. Roper, A. Ajdari, and H. A. Stone, Imbibition by polygonal spreading on microdecorated surfaces, Nature Materials 6, 661 (2007).
- Coux and Kolinski [2020] M. Coux and J. M. Kolinski, Surface textures suppress viscoelastic braking on soft substrates, Proceedings of the National Academy of Sciences 117, 32285 (2020).
- Paretkar et al. [2014] D. Paretkar, X. Xu, C.-Y. Hui, and A. Jagota, Flattening of a patterned compliant solid by surface stress, Soft Matter 10, 4084 (2014).
- Bardall et al. [2020] A. Bardall, S.-Y. Chen, K. E. Daniels, and M. Shearer, Gradient-induced droplet motion over soft solids, IMA Journal of Applied Mathematics 85, 495 (2020).
- Bueno et al. [2018] J. Bueno, Y. Bazilevs, R. Juanes, and H. Gomez, Wettability control of droplet durotaxis, Soft matter 14, 1417 (2018).
- Theodorakis et al. [2017] P. E. Theodorakis, S. A. Egorov, and A. Milchev, Stiffness-guided motion of a droplet on a solid substrate, The Journal of Chemical Physics 146, 244705 (2017).
- Style et al. [2013a] R. W. Style, Y. Che, S. J. Park, B. M. Weon, J. H. Je, C. Hyland, G. K. German, M. P. Power, L. A. Wilen, J. S. Wettlaufer, et al., Patterning droplets with durotaxis, Proceedings of the National Academy of Sciences 110, 12541 (2013a).
- Zhao et al. [2022] W. Zhao, J. Zhou, H. Hu, C. Xu, and Q. Xu, The role of crosslinking density in surface stress and surface energy of soft solids, Soft Matter 18, 507 (2022).
- Xu et al. [2020] Q. Xu, L. A. Wilen, K. E. Jensen, R. W. Style, and E. R. Dufresne, Viscoelastic and poroelastic relaxations of soft solid surfaces, Phys. Rev. Lett. 125, 238002 (2020).
- Style et al. [2013b] R. W. Style, R. Boltyanskiy, Y. Che, J. S. Wettlaufer, L. A. Wilen, and E. R. Dufresne, Universal deformation of soft substrates near a contact line and the direct measurement of solid surface stresses, Phys. Rev. Lett. 110, 066103 (2013b).
- Xu et al. [2017] Q. Xu, K. E. Jensen, R. Boltyanskiy, R. Sarfati, R. W. Style, and E. R. Dufresne, Direct measurement of strain-dependent solid surface stress, Nature Communications 8, 555 (2017).
- Li et al. [2023] X. Li, F. Bodziony, M. Yin, H. Marschall, R. Berger, and H.-J. Butt, Kinetic drop friction, Nature Communications 14, 4571 (2023).
- Shanahan and Garré· [1995] M. E. Shanahan and A. Garré·, Viscoelastic Dissipation in Wetting and Adhesion Phenomena, Langmuir 11, 1396 (1995).
- Karpitschka et al. [2015] S. Karpitschka, S. Das, M. van Gorcum, H. Perrin, B. Andreotti, and J. H. Snoeijer, Droplets move over viscoelastic substrates by surfing a ridge, Nature communications 6, 7891 (2015).
- Zhao et al. [2018] M. Zhao, J. Dervaux, T. Narita, F. Lequeux, L. Limat, and M. Roché, Geometrical control of dissipation during the spreading of liquids on soft solids, Proceedings of the National Academy of Sciences of the United States of America 115, 1748 (2018).
- Li et al. [2022] X. Li, P. Bista, A. Z. Stetten, H. Bonart, M. T. Schür, S. Hardt, F. Bodziony, H. Marschall, A. Saal, X. Deng, et al., Spontaneous charging affects the motion of sliding drops, Nature Physics 18, 713 (2022).
- Guan et al. [2016] D. Guan, Y. J. Wang, E. Charlaix, and P. Tong, Asymmetric and speed-dependent capillary force hysteresis and relaxation of a suddenly stopped moving contact line, Phys. Rev. Lett. 116, 066102 (2016).