Cooling of gold cluster anions, Au, , in a cryogenic ion-beam storage ring
Abstract
We have measured the spontaneous and photo-induced decays of anionic gold clusters, Au, with sizes ranging from to 13, and 15. After production in a sputter ion source, the size-selected clusters were stored in the cryogenic electrostatic ion-beam storage ring DESIREE and their neutralization decays were measured for storage times between 0.1 and 100 s. The dimer was observed to decay by electron emission in parallel to neutral atom emission at long times, analogously to the behavior of copper and silver dimers, implying a breakdown of the Born-Oppenheimer approximation. Radiative cooling is observed for all cluster sizes except for the dimer. The decay rates of clusters show only a single radiative cooling time. For the cooling times have a strong odd-even oscillation with an amplitude that decrease with cluster size, and with the even having the fast cooling. We compare our results with previous measurements of radiative cooling rates of the corresponding cationic gold clusters, Au, which also show an odd-even effect with a similar oscillation amplitude but at orders of magnitude shorter time scales, and out of phase with the anions. The tetramer and pentamer both show two cooling times, which we tentatively ascribe to different structural forms at different ranges of high angular momenta in the Au and Au beams. For Au and Au, time-resolved studies of photo-induced decays were performed to track the evolution of the internal energy distribution. For both these cases we conclude that the radiative cooling is dominated by sequences of vibrational transitions in the IR. The laser enhanced neutralization rate of Au was exponential, in contrast to its spontaneous decay rate, indicating that the cluster had already been cooled to a very narrow internal energy distribution at 120 ms. The total laser enhanced intensity was independent of the laser firing time, corroborating this conclusion. The rate constants decreased from 500 s-1 when laser excited at 0.12 s to 40 s-1 when laser excited at 0.62 s. For Au, the shape of the decay curve suggested that the cluster cools by emission of low energy photons. The calculated limit on photon energies strongly suggest that cooling is by vibrational transitions in this case.
Introduction
Quantization of electronic energies gives rise to a number of characteristic features of metal clusters. One of the strongest manifestations of these is odd-even effects, which were first observed for the intensity distribution as a function of size for small gold clusters by Katakuse et al. [1, 2]. The gaps in the electronic excitation spectra associated with this effect, and with shell structure, decrease with increasing cluster size and ultimately give rise to thermally populated electronically excited states at some cluster size. This thermal excitation will cause a strong suppression of both the odd-even effect and the shell structure. It will also cause the appearance of the closely related effect of emission of electromagnetic radiation from thermally populated electronically excited states, known as recurrent fluorescence (RF) [3] or Poincaré radiation [4, 5].
The odd-even intensity effect is particularly strong for gold clusters, as judged by the abundances in the measured spectra of Katakuse et al. [1, 2]. Also the recurrent fluorescence is very strong for cationic gold clusters [6]. Intense RF was observed in experiments where cationic gold clusters were excited by laser light and unimolecular decays measured in a time-of-flight mass spectrometer. RF implies the presence of low energy optically active electronic states and a spectroscopic experiment confirmed the presence of such absorption features for Au [7] (cluster size 10 was the only one measured in that experiment). The radiative time constants observed in the experiments in ref. [6] were very short for clusters below , on the order of microseconds, and showed a very strong odd-even oscillation, with radiative cooling times for even-electron numbered (i.e. odd ) clusters typically an order of magnitude shorter than for the odd electron number clusters, and orders of magnitude shorter than what can be explained by infrared radiation from vibrational transitions. The correlation of radiative cooling time scales with electron number could potentially be ascribed to the higher per-atom excitation energy (effective temperature) for the even electron number (odd ) clusters. This was found not to be the case, however [8], and the main contribution to the strong even-electron radiative emission relative to the odd-electron clusters is therefore not due to their higher stability. Rather, the systematics is predominantly an intrinsic property associated with the number of valence electrons in some other way. A similar conclusion was reached for the opposite question whether the observed odd-even abundance oscillations are a radiative cooling effect. The analysis in [8] showed that also this is not the case. The radiative odd-even effect must therefore be considered an intrinsic phenomenon for cationic gold clusters.
In addition to the radiative cooling parameters for cations, a number of other relevant parameters for the energetics of gas phase gold clusters are known. These include ionization energies [9], electron affinities [10, 11, 12], and cationic dissociation energies [13, 14]. Comparing the electron affinities in [11] and the atomic binding energies in [14], it is clear that the two types of binding energies tend to be of similar magnitude for a given size, with the reservations that the atomic binding energies pertain to cations, and that the overlap in cluster size of the two studies is limited. The lowest activation energy channel determines whether electron emission or atomic evaporation dominates in statistical decays, modulo the effect of the different frequency factors for loss of atoms and of electrons. The dominant channel, in turn, sets the energy scale of the decaying clusters when decays occur from broad internal energy distributions. We therefore expect the effective temperatures of the present anionic clusters to be similar to those of the cations in the studies summarized in ref. [6]. The question then arises naturally whether the gold cluster anions will show RF and if they do, whether they will show the same odd-even systematics as the cations.
Other questions arise as well. One is whether the effects of the high angular momenta inferred for some anionic copper [15] and silver clusters [16] are also present for gold clusters. The experimental signature is a decay rate which is a sum of two separate curves reflecting different angular momenta populations, each described by a power law decay initially and modified by a radiatively generated exponential suppression at longer times.
A third question is whether the breakdown of the Born-Oppenheimer approximation recently seen for the anionic silver and copper dimers is also present for the gold dimer anion [17, 18]. The breakdown was observed for the copper and silver dimers by detection of electron emission in competition with dissociation which is the only possible decay channel within the Born-Oppenheimer description.
I Experimental procedure
The clusters were produced in a cesium sputter ion source with currents of nA for the smallest species, decreasing with size to a fraction of a pA for . The clusters were accelerated to 10 keV () or 5 keV (), limited by the maximum current in the mass-selection magnet.
Prior to injection into the ring, the mass spectrum of the ions produced in the source was measured by scanning the magnet. The spectrum showed a non-negligible presence of copper, which originated in the sputter source cathode. The combination of three atoms of the heavy copper isotope, of mass 65 u, is close enough to the mass of a single gold atom, of mass 197 u, to potentially distort the decay curves by contamination.
The amount of such contamination was probed by a combination of two procedures. One was a comparison of the decay spectra recorded after mass selection centered at three different positions of nominal gold cluster peaks in the magnet scan; one on the low side, one at the maximum, and one on the high mass side. The two spectra recorded with a setting on the maximum of the peak and on its high mass side showed identical decay curves, indicative of a pure gold cluster sample. There was no sign of hydrides. In the other procedure, a cathode with a gold surface was used. A spectrum for the trimer showed a time dependence of the decay which was identical to the two high-mass curves of the previous test with the trimer. We concluded that these two magnet setting were sufficient to ensure beam purity. Since the beam current from the gold-surface cathode was not as stable as from the standard copper cathode, the latter was used with the gold plug insert for most of the scans.
After mass selection, the cluster anions were injected into a single ring of the dual ion-beam storage ring DESIREE [19, 20], shown schematically in Fig.1. The ions are injected from top left and the neutral products from decays of all cluster sizes were detected at the right exit side of the top section. In the Au laser experiment, the laser beam crossed the ion beam at the middle of the bottom section, as indicated in the figure, and the decay rate was measured with the lower left neutrals detector.
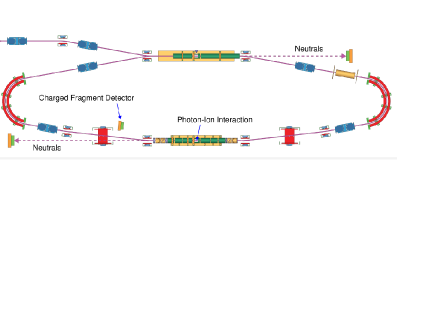
The dimer decay was measured with two detectors, viz. the detector in the upper right corner and the ’fragment detector’. The top right side detector counts all decays that produce a neutral particle and therefore gives the sum of the neutral atom emission and the electron detachment signal. The other (’charged fragment detector’) detects only the fragments produced in the decay through the atom emission channel. A comparison of the two detector signals showed the contribution from the electron emission channel. The arrangement is described in more detail in refs. [17, 18] for experiments on the copper and silver dimer anions.
Storage times varied between 100 ms and 100 s, depending on how fast the observed decay was quenched by the radiative cooling of the ions. The revolution times were s for the 10 keV beams and correspondingly longer for 5 keV ions. For most cluster sizes the ring was filled maximally, which is around 90 %, but for a few of the highest beam currents, which were seen at the smaller cluster sizes, the ring was only partly filled to avoid detector saturation.
In Figure 2 we show part of a raw data spectrum for Au as an example of the measured spontaneous decay.

In the analysis of the spectra, all counts for a turn in the ring were summed up, and these turn-by-turn count rates were then binned over several turns with a bin size that increases proportionally with time to place the points equidistantly on a logarithmic scale axis.
In addition to measurements of the spontaneous decay, the clusters and 7 were exposed to laser light and the photon-induced decays measured. The laser system is EKSPLA NT 342 C, optical parametric oscillator tunable wavelength system. The light intersected the ions in a crossed beam configuration (see Fig.1). The laser repetition rate was 10 Hz for both Au and Au. The photon energies were a single value of 2.76 eV for Au, and the series 2.48, 2.25, 2.07, 1.91, and 1.77 eV for Au. Only data recorded after the spontaneous decay was quenched by radiative cooling were used in the analysis. The laser light intensity was kept low enough to avoid a depletion of the ion beam, and the neutralization ion counts at different laser firing times can thus be compared directly.
The measured signal contains two background components besides the spontaneous or photo-induced neutralization count. One is generated by collisions with rest gas molecules. This is a minor contribution due to the low temperature of the ring and the resulting very low pressure [20, 21]. The main background contribution is the electronic noise from the detectors. To determine the detector dark count rate, the first 10% or 20% of each measurement cycle were recorded before the ions were injected. For the two neutrals detectors the dark count rates were around 5 s-1 in the experiment, similar to values seen previously in the same detectors. For the fragment detector it was somewhat higher but not prohibitively so.
II Results and analysis
II.1 Decays of
In Figure 3 we show the decay rate of the Au dimer for the all-inclusive neutral particle detector on the upper right side of Fig.1 and the fragment detector.
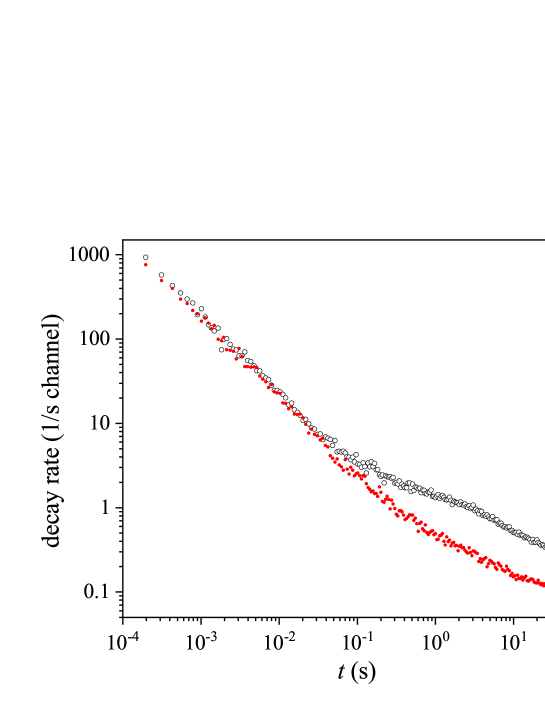
The initial decay channel is completely dominated by the loss of a neutral monomer, as seen by the fact that the two curves coincide at early times. The initial decay rate follows a time dependence. This behavior is expected for decays from an ensemble of clusters with a broad distribution of rate constants [22]. For dimers with a single vibrational degree of freedom the decays are not thermal. Instead, the dominant decay at early times (dissociation) is due to tunneling out of the angular momentum barrier in the collection of the rotationally and vibrationally highly excited clusters created in the sputter source [23]. The power law decay rate then arises as a consequence of the broad distribution of tunneling rates (matrix elements) for this process.
Around 30 ms, a difference between the two detector curves develops, indicating the appearance of a measurable contribution from the electron detachment channel, which soon after becomes dominant and remains so up to the end of storage at 80 s. The onset of a visible contribution from the electron emission channel coincides with a departure from the decay rate curve. The tunneling mechanism is not available for electron emission, which instead arises as a result of the breakdown of the Born-Oppenheimer approximation [17]. The breakdown is particularly striking for the coinage metal dimers because the diabatic potential energy curves of the anion and the neutral do not cross [10].
The behavior seen here for the gold dimer is close to identical to the ones for the copper and silver dimer anions [17, 18], for which decays were measured up to 10 s. It remains an open question why the three coinage metal dimer anions show such similarities for both the onset time of a visible contribution from electron emission, and for the electron-atom emission branching ratio as a function of time.
II.2 Decays of
The decay rates of the clusters Au, Au and Au are, unlike that of larger clusters, not well described by the combination of a single power law and radiative cooling parametrized with a time constant.
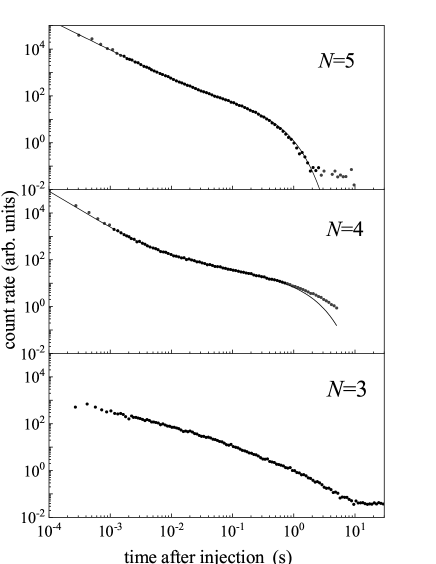
The decay curves for these three cluster, shown in Fig.4, are very similar to those seen for silver and copper anions of the corresponding sizes (see refs. [15, 16]). A significant part of the analysis of the small silver and copper clusters apply also with little change to the three gold cluster anions. Briefly, the source will produce the gold clusters with a range of states with high rotational excitations. A distribution of angular momenta can give rise to two, or a few, different geometries of the clusters that are realized at different angular momenta, as discussed in detail in [15]. Conservation of angular momentum protects such conformers from free interconversion and causes the ions to decay as an ensemble of different species with different cooling characteristics. Different geometric structures will in general have different radiative cooling rates, i.e., two or more radiation constants may be seen in the measured decay rate. We suggest that the presence of two such populations in the beam causes the structure in the decay rates of , with their first relatively steep decrease followed by a slower decrease for the intermediate times between 10 and 100 ms. This behavior is most clearly seen for the tetramer () but is also present in weaker form for the pentamer (). The suggestion is borne out by the fitted powers of the initial decay, which (numerically) exceed unity and which is then understood as the residual of a radiative cooling component which has almost quenched at the beginning of the measurement time range of a couple of hundreds microseconds. The values of the fitted powers reflect this initial cooling.
The trimer decay rate does not show the intermediate flattening of the decay curve. Another difference from the tetramer and the pentamer is that the absolute value of the power on the initial decay is significantly smaller than unity. The only possible explanation we can give for this is that the trimer decays in a manner similar to the dimer, by electron emission and for similar reasons, up to 10 ms, after which exponential quenching by radiative cooling sets in (the flat part of the spectrum after 10 s is background counts). To wit, the dimer decay rate flattens out at long times and appears to mimic a power law decay with a small power. Although the similarities are suggestive, the mechanisms behind this flattening is still unclear.
II.3 Decays of
In Figure 5 we show the measured spontaneous decay curves for . As for the dimer and , the production of the clusters in the source leaves them highly excited at the injection into the ring.
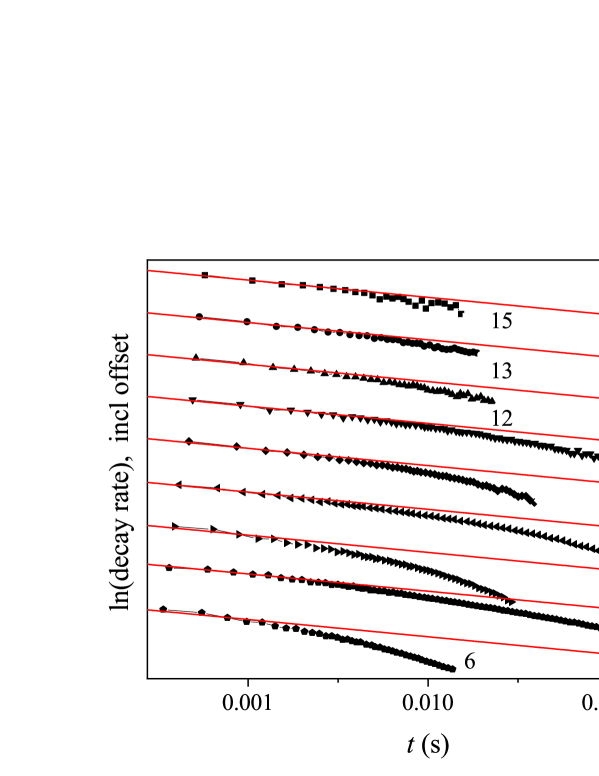
All sizes shown in Fig.5 decay initially with close to the expected law rates, but where some powers in differ significantly from . A zoomed view of the initial decays is given in Fig.6. The fitted powers are given in Table 1
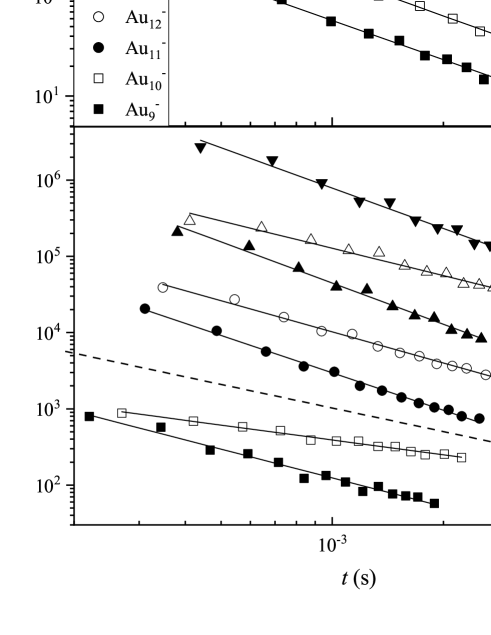
At later times the decays quench and approach a quasi-exponential form for the decay rate. This is ascribed to radiative energy dissipation. An alternative suggestion is the freezing-in of vibrational degrees of the product cluster, as seen for SF [24]. However, estimates of the level densities rule this out for the present study of gold cluster anions and we will disregard this mechanism.
The radiative time scales are clearly dependent on cluster size, but also the fitted powers of the initial decay show some variation with size. In the simplest form the quenching of the neutralization rate is described by the exponential factor in the expression
| (1) |
This equation pertains to the emission of large energy photons with rate constants ; large energy in the sense that the emission of a single photon quenches any further unimolecular decay. Eq.(1) is the expression used for the fits for most cluster sizes here. The alternative expression, given below, describes the time constant for photon energies that are so small that their effect must be described as continuous cooling of the cluster. The spontaneous decay of Au is described better by that form. A thorough discussion of the area of applicability of the large and small photon energy quenching is given in Ref. [25]. We show in Table 1 the powers and time constants from fits with Eq.(1), including a fit for the heptamer for a relatively short time range.
| (ms) | (ms) | |||
|---|---|---|---|---|
| 3 | 0.79 | 0.01 | 2800 | 200 |
| 6 | 1.49 | 0.04 | 4.5 | 0.2 |
| 7 | 1.44 | 0.01 | 120 | 12 |
| 8 | 1.48 | 0.02 | 7.0 | 0.3 |
| 9 | 1.31 | 0.01 | 50 | 1 |
| 10 | 1.15 | 0.02 | 13.0 | 0.7 |
| 11 | 1.15 | 0.02 | 42 | 3 |
| 12 | 1.22 | 0.06 | 17 | 3 |
| 13 | 1.18 | 0.05 | 24 | 7 |
| 15 | 1.16 | 0.07 | 17 | 4 |
In Figure 7 we show the fitted values of for .

There is a clear deviation from a unit power, , decreasing with size and reaching a value a little above unity for the larger cluster sizes. is expected to deviate slightly from unity due to the effect mainly of the finite heat capacity of the clusters. The expression is [26]
| (2) |
with , the canonical heat capacity, where is the observation time and the frequency factor of the observed unimolecular decay, thermionic emission or atomic evaporation, as it may be. The expression reduces to for large heat capacities. The calculated values for the clusters are 1.08 to 1.09 for and an effective heat capacity of , corresponding to thermionic emission from harmonic oscillator clusters. The observed values for are a little higher than this estimate but not unreasonably so, considering that the heat capacities are not precisely known. For the smaller clusters, , the observed values of 1.3 to 1.5 are too large to be explained in that way.
The explanation for the high values that we find most likely is that the measured power is masking the residual of a radiative cooling component which occurs so fast that it is almost over when the ions have been transferred to the ring. This explanation requires the co-existence of isomer populations in the beam, similar to those inferred previously for rotationally highly excited species for the copper and silver anion clusters [15, 16] and as discussed above for Au and Au. We consider this explanation quite plausible, but further experiments are required to clarify the picture.
In Figure 8 we show the radiative cooling time constant () for Au, , filled circles.
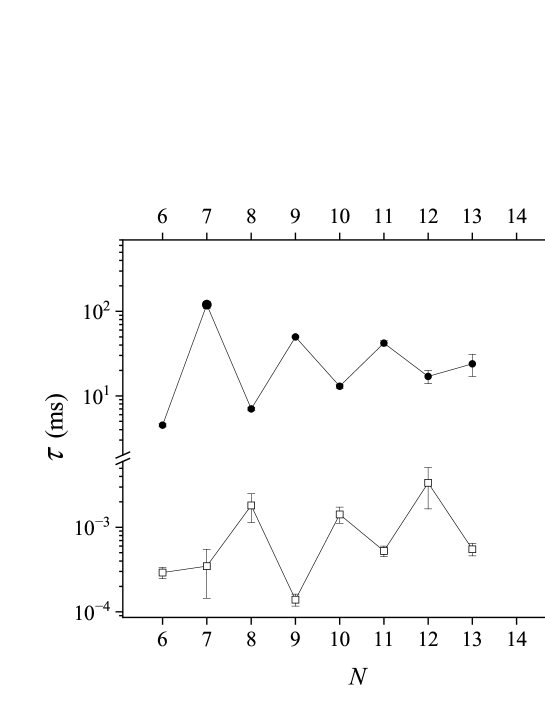
There is a striking odd-even effect, similar in magnitude to that of the cations, although with two important differences. One is that the time constants are three to four orders of magnitude longer than those for the cations [6], shown as open circles in Fig.8. The other is the fact that the effects have opposite phases for anions and cations. A similarity between anions and cations is the relative amplitude in the oscillations.
The presence of the odd-even effect in the radiative cooling of the anions has features that give conflicting indications of its origin. On one hand, the bare existence of odd-even oscillations as a function of the number of electrons indicate an electronic origin, similar to the odd-even effect in abundances and in the (cationic) binding energies. The electron spin degeneracy of single electrons summarizes this oscillationary behavior. The odd-even staggering is then the result of electronic structure. With respect to radiative cooling, this indicates RF emission, at least for the even- clusters. We also note that the amplitude in the size-to-size oscillations is of similar relative magnitude as those for the cations. Such variations in oscillator strengths in vibrational emission are not seen in other systems and then again suggest an electronic origin of the cooling.
On the other hand, the average emission rates are rather small for this type of radiation. And furthermore, the periodicity is, as noted, opposite to the cationic case. This is not expected for electronic radiation because the difference in charge state of cations and anions is two, corresponding to a full period of the oscillations. We will tentatively conclude that the radiation involves vibrational cooling in some form, although possibly not at the exclusion of electronic radiation. One possibility is that the even-electron species have access to low-lying electronic excitations that are absent for odd-electron clusters.
II.4 spontaneous decays
The fitted value for the power and radiatively cooling constant for clusters that are given in Table 1 refer to relatively short times after production in the source. Including longer times yielded systematically different parameters of the fit function . To understand this better we will analyze the decay of this cluster in more detail. One step is to consider the expression for cooling through emission of photons with small energies for which the neutralization rate becomes [25]
| (3) |
The expression describes the situation where the clusters retain enough energy to decay even after emission of one or several photons. It is derived by an expansion of the logarithm of the rate constant, , with respect to energy and by assuming that the emitted power, , is time independent [27, 25]:
| (4) |
The expression is a first order expansion and it will therefore not cover decays at all times but it is a decent approximation and it differs in an observable manner from the large photon energy limit of Eq.(1).
In order not to bias the fit, an expression for the parallel emission of both small and large photons is used:
| (5) |
The value of is the correction to the power law for non-ideal behavior, i.e., , as can be seen if the exponential in the denominator is expanded for times short relative to . The expression includes the the two reasons the neutralization decays can be suppressed by radiative cooling: One is that the population of the decaying particles decay exponentially. This gives rise to the factor . The other is that rate constants decrease exponentially. This gives rise to the factor . See ref. [25] for details and ref. [28] for an example of parallel large and small photon energy radiative channels for C.
In Figure 9 we show a fit of the decay curve with the modified, general cooling rate expression in Eq.(5).

The curve is best fitted with , ms, , compared to the values , ms from the fit above where instead was constrained to be infinite.
With some assumptions, the value of can be used to find the emitted power. Assuming a frequency factor of 1014 s-1 for thermionic emission (thermal electron emission), that the cluster is described by harmonic vibrations, gives with the electron affinity of 3.5 eV [11] the emitted power (see Eq.(15) below)
| (6) |
(The small kinetic shift of 12% that appears in Eq.(15) has been included in the calculation.) If the decay curve is to be represented by the small photon energy limit, the emitted photons must be smaller than the width of the energy distribution of the clusters that emit the electrons. This width is also calculated in the next section (Eq.(13)), which here gives
| (7) |
Using that estimate for the highest possible photon energy for which the fit is applicable, eV, gives a photon emission rate constant of no less than 0.57/0.043 s-1 = 13 s-1.
Although this lower limit for the emission constant is easy to fulfill for both types of cooling, vibrational and RF, the upper limit of the photon energy of 0.043 eV strongly suggests that the cooling is vibrational.
II.5 photo-excitation
The spontaneous decays analyzed so far explore the high energy edge of the energy distributions produced in the source. Photo-induced decays give some insights into the lower energy parts of the distributions. In the presence of radiative cooling this also allows characterization of the cooling. With this purpose the energy distribution of the size was explored by a series of laser pulses with wavelengths of 500, 550, 600, 650, 700 nm (photon energies of 2.48, 2,25, 2.07, 1.91, 1.77 eV) every 100 ms, starting at 1.30 s and ending at 10.3 s, causing single photon absorption. The starting time ensured that spontaneous decays had ceased. The neutralization yield therefore provided a measure of the energy distribution density without any need for subtraction of a spontaneous decay background.
The yield is then proportional to the energy distribution at the energy , determined as
| (8) |
where is the time after ion production in the source at which the laser was fired and is the energy of the photon absorbed. The energy does not vary very much between two consecutive turns in the ring and the yields of the first five turns were added for each laser firing time and wavelength and assigned to the laser firing time. The data for 500, 600 and 700 nm are shown in Fig.10.

The data are not easily converted to energy distributions, but some conclusions can nevertheless be drawn from them.
For the high photon energies, the traces start at low intensities which first increase with time but then starts to level out after some seconds. The increase is most pronounced for the high photon energies. This indicates that the energy distribution does not reach all the way to zero energy.
If the cooling proceeds exponentially, as is the case for infrared vibrational cooling [29], the yields is
| (9) |
where is time-independent and is the time constant. The observed flat long-time yield then shows that the internal energy varies as
| (10) |
at high energies , i.e., a fairly slow fall-off with energy.
II.6 photo-excitation
The photo-induced decay of Au was measured with 450 nm light from 0.12 s to 0.92 s, in steps of 100 ms. The energies sampled are therefore 2.76 eV below that of the spontaneous decays measured on the hundred microsecond time scale, in analogy to the logic behind Eq.(8).
The enhanced decay was integrated turn-by-turn. In Fig.11 we show the decays as functions of time after the firing of the laser pulse for different laser firing times between 0.12 s and 0.62 s.

Excluding the first peak, the decays are very well represented by single exponentials. The first peak is dominated by fast decays caused by absorption of two or more photons. The decays during the following turns in the ring must be single photon absorption to be consistent with a single exponential decay. (A mixture of single and double photon decays will give curves composed of at least two exponentials.) The fitted photon emission time constants are shown in Fig.12 vs the laser firing time.

There is a clear and smooth decrease of the time constants with laser firing time, corresponding to a rate constant that varies as . The total integrated intensities of the six spectra are identical within the uncertainties. The integrated intensity of the observed part of the distribution is therefore constant.
The exponential decay indicates that the decaying clusters are sampled from a strongly peaked part of the energy distribution, rather than from a flat energy distribution. Decay rates occur in the general case according to the right hand side of Eq.(11):
| (11) |
This is a strongly peaked distribution as a function of energy, and to observe an single exponential decay requires an even more peaked distribution.
We can calculate an estimate of the upper limit of the width of the energy distribution required to give a single exponential decay. The rate constant, , describing electron emission of a cluster with electron affinity EA, a level density of is, within the harmonic approximation,
| (12) |
The energy is an offset in the caloric curve, and is the caloric heat capacity in units of Boltzmann’s constant. Approximating the right hand side of Eq.(11) with a Gaussian, , we can estimate the standard deviation to
| (13) |
Here we will use the values eV [11], valid for harmonic oscillators of a cluster, and the frequency factor s-1. The time scale, , is the one for the measurement of the decay curves, which will summarily be set to 1 ms. To have a single exponential we need a width of the initial distribution, , that is smaller than twice , i.e., smaller than the value 0.045 eV calculated with Eq.(13).
The energy emission rate reflected in the decrease of the emission rate constant with time is calculated with the relation
| (14) |
A little algebra and setting the kinetic shift to zero, , gives
| (15) |
This is an average value over the measured time, as it is based on the average logarithmic slope of the fitted rate constant (see Fig.12).
The small observed rate constant in combination with the small heat capacity makes it likely that the energy is emitted in vibrational transitions. This is also consistent with the observation of purely exponential decay rates fitted at all six laser firing times. Larger photon energies would induce either loss of intensity, which is not seen, as mentioned, or deviations from exponential decays. In contrast to electronic transitions, vibrational transitions have a weak internal energy dependence. As shown in ref. [29], this feature conserves the shape of energy distributions in an ensemble when it cools by emission of IR photons, apart from a scale factor, except at the lowest excitation energies. Hence for such cases no width develops on the energy distribution with time, and the decay remains exponential, as observed.
III Summary and conclusions
The spontaneous decays of anionic gold clusters were measured in the DESIREE storage ring. The results showed strong similarities to the two other coinage metals, copper [15] and silver [16], in particular for the decay of the dimer, which was investigated with respect to the branching ratio of electron and atom emission.
The radiative cooling times display a strong odd-even effect for clusters , similar to the behavior previously seen for the gold cationic clusters [6] but with the striking difference that anionic odd- clusters cool slower than even-, in a reversal of the pattern seen for the cations. Time constants are three to four orders longer for anions, but the relative oscillation amplitude is quite similar for the two charge states. The fit of the decay curve of the heptamer indicates a vibrational radiative cooling. The precise reason for an odd-even effect in this cooling in the first place is still unclear, however, similar to the very large amplitude.
Photo-excitation experiments on the pentamer showed that this cluster size had cooled to a very low and well-defined internal energy already after 0.12 s, making the decays exponential. The decay constants were also found to vary exponentially with laser firing time, yielding an energy loss rate of 0.033 eV/s and a time constant of 0.20 s, indicating vibrational cooling also in this case.
In summary, the answers to the questions asked in the Introduction; ’…whether the gold cluster anions will show RF and if they do, whether they will show the same odd-even systematics as the cations’ are probably not and definitely not, respectively. The reason the first conclusion comes with a qualifier is that the strong indication of vibrational cooling is derived from the late photo-excitation experiments on cooled clusters, vs. the odd-even effect measured on the spontaneously decaying and therefore hotter clusters.
The other two questions both have clearer answers. Yes, the behavior caused by the presence of both high and low angular momenta is seen in the decay curves for the small clusters. And the dimer shows a clear signature of breakdown of the Born-Oppenheimer separation, in close analogy to the silver and copper dimer anions.
acknowledgement
This work was performed at the Swedish National Research Infrastructure, DESIREE (Swedish Research Council Contract No. 2017-00621 and No. 2021-00155). It was supported with a beam time grant to KH. HC, HZ, and HTS thank the Swedish Research Council for individual project grants (with Contracts No. 2023-03833, No. 2020-03437, and No. 2022-02822), and acknowledge the project grant ”Probing charge- and mass- transfer reactions on the atomic level” (2018.0028) from the Knut and Alice Wallenberg Foundation. This publication is based upon work from COST Action CA18212 - Molecular Dynamics in the GAS phase (MD-GAS), supported by COST (European Cooperation in Science and Technology).
IV Appendix
The fit of the spontaneous decay rates with power laws require that the time of creation of the clusters is know precisely. In this appendix we calculate the time offset and show that the value is close to zero with the preset electronic timing.
The counts in a single turn in the ring arise from ions that have been generated at different times in the source but stored equally long in the ring, modulo the spread in the decay position and the very small difference in the speed of the neutral detected. The two spreads are so small that we can assign a single time to all decays that occur and are detected in any specific turn in the ring. The binning of multiple turns improves statistics and has the added advantage that it tends to average out the already small but non-statistical betatron oscillations and related oscillations in the recorded neutralization yields that appear due to variations in detection efficencies [30].
The measured time of decay potentially differs from the time elapsed since creation of the clusters in the source, as the acquisition timer is started during ion transit through the mass selection trajectory. The time of detection refers to the neutral particle produced in a decay in the straight section of the ring in the detector side of the ring. Relative to the detection time, the decay time is earlier by the amount of time it takes to move from the decay position to the detector, . It is
| (16) |
where the length is the flight distance between decay and detector and the speed of the monomer at the acceleration energy used for this mass.
We denote the number of turns in the ring before detection by , starting the count with at the first half turn detection, corresponding to labeling the first peak seen in the spectrum as 1. The time from production to detection of a decay during turn number is then given by , by an electronic offset, which includes both operation time of detector and a delay in acquisition electronics, the circulation time , and the time from creation in the source to the arrival at the decay position in the first turn, . For the detection time of peak the time is
| (17) |
The first term is cluster size independent. All other three terms are proportional to , up to the two acceleration voltage used. In terms of the length of the ring, , and the source-to-decay point length, , the peak times are, with ,
| (18) |
The time resolved peaks for a given size allow us to plot vs. to find the parameter and the intercept given by . Once these intercepts are determined, they are plotted vs. , from which we get the value for s from the slope. The electronic offset was found to be less than 1 s, much smaller than the flight time of the first detected peak, and can be ignored. The value was found to be 86.9 s, for the acceleration energy 10 keV. The analysis then gives the true decay times in terms of the measured peak positions as
| (19) |
References
- Katakuse et al. [1985] I. Katakuse, T. Ichihara, Y. Fujita, T. Matsuo, T. Sakurai, and H. Matsuda, Int. J. Mass Spectrom. Ion Processes 67, 229–236 (1985).
- Katakuse et al. [1986] I. Katakuse, T. Ichihara, Y. Fujita, T. Matsuo, T. Sakurai, and H. Matsuda, Int. J. Mass Spectrom. Ion Proc. 74, 33 (1986).
- Nitzan and Jortner [1979] A. Nitzan and J. Jortner, J. Chem. Phys. 71, 3524 (1979).
- Leach [1987] S. Leach, in Polycyclic Aromatic Hydrocarbons and Astrophysics, edited by A. Léger, L. d’Hendecourt, and N. Boccara (1987), vol. 191 of NATO ASI Series, pp. 99–127, ISBN 978-94-010-8619-6.
- Léger et al. [1988] A. Léger, P. Boissel, and L. d’Hendecourt, Phys. Rev. Lett. 60, 921 (1988).
- Hansen et al. [2017a] K. Hansen, P. Ferrari, E. Janssens, and P. Lievens, Phys. Rev. A 96, 022511 (2017a).
- Green et al. [2021] A. E. Green, A. S. Gentleman, W. Schöllkopf, A. Fielicke, and S. R. Mackenzie, Phys. Rev. Lett. 127, 033002 (2021).
- Hansen et al. [2017b] K. Hansen, P. Ferrari Ramirez, E. Janssens, and P. Lievens, J. Phys. Chem. C 121, 10663 (2017b).
- Jackschath et al. [1992] C. Jackschath, I. Rabin, , and W. Schulze, Ber. Bunsenges. Phys. Chem 96, 1200 (1992).
- Ho et al. [1990] J. Ho, K. M. Ervin, and W. C. Lineberger, J. Chem. Phys. 93, 6987 (1990).
- Taylor et al. [1992] K. J. Taylor, C. L. Pettiette-Hall, O. Cheshnovsky, and R. E. Smalley, J. Chem. Phys. 96, 3319 (1992), URL http://scitation.aip.org/content/aip/journal/jcp/96/4/10.1063/1.461927.
- Häkkinen et al. [2003] H. Häkkinen, B. Yoon, U. Landman, X. Li, H.-J. Zhai, and L.-S. Wang, J. Phys. Chem. A 107, 6168 (2003).
- Vogel et al. [2001] M. Vogel, K. Hansen, A. Herlert, and L. Schweikhard, Phys. Rev. Lett. 87, 013401 (2001).
- Hansen et al. [2006] K. Hansen, A. Herlert, L. Schweikhard, and M. Vogel, Phys. Rev. A 73, 063202 (2006).
- Hansen et al. [2017c] K. Hansen, M. H. Stockett, M. Kaminska, R. F. Nascimento, E. K. Anderson, M. Gatchell, K. C. Chartkunchand, G. Eklund, H. Zettergren, H. T. Schmidt, et al., Phys. Rev. A 95, 022511 (2017c).
- Anderson et al. [2018] E. K. Anderson, M. Kamińska, K. C. Chartkunchand, G. Eklund, M. Gatchell, K. Hansen, H. Zettergren, H. Cederquist, and H. T. Schmidt, Phys. Rev. A 98, 022705 (2018).
- Anderson et al. [2020] E. K. Anderson, A. F. Schmidt-May, P. K. Najeeb, G. Eklund, K. C. Chartkunchand, S. Rosén, Å. Larson, K. Hansen, H. Cederquist, H. Zettergren, et al., Phys. Rev. Lett. 124, 173001 (2020).
- Anderson et al. [2023] E. K. Anderson, A. F. Schmidt-May, P. K. Najeeb, G. Eklund, K. C. Chartkunchand, S. Rosén, M. Kamińska, M. H. Stockett, R. Nascimento, K. Hansen, et al., Phys. Rev. A 107, 062824 (2023).
- Thomas et al. [2011] R. D. Thomas, H. T. Schmidt, G. Andler, M. Björkhage, M. Blom, L. Brännholm, E. Bäckström, H. Danared, S. Das, N. Haag, et al., Review of Scientific Instruments 82, 065112 (2011).
- Schmidt et al. [2013] H. T. Schmidt, R. D. Thomas, M. Gatchell, S. Rosén, P. Reinhed, P. Löfgren, L. Brännholm, M. Blom, M. Björkhage, E. Bäckström, et al., Rev. Sci. Instrum. 84, 055115 (2013).
- Bäckström et al. [2015] E. Bäckström, D. Hanstorp, O. M. Hole, M. Kaminska, R. F. Nascimento, M. Blom, M. Björkhage, A. Källberg, P. Löfgren, P. Reinhed, et al., Phys. Rev. Lett. 114, 143003 (2015), URL https://link.aps.org/doi/10.1103/PhysRevLett.114.143003.
- Hansen et al. [2001] K. Hansen, J. U. Andersen, P. Hvelplund, S. P. Møller, U. V. Pedersen, and V. V. Petrunin, Phys. Rev. Lett. 87, 123401 (2001).
- Fedor et al. [2005] J. Fedor, K. Hansen, J. U. Andersen, and P. Hvelplund, Phys. Rev. Lett. 94, 113201 (2005).
- Menk et al. [2014] S. Menk, S. Das, K. Blaum, M. W. Froese, M. Lange, M. Mukherjee, R. Repnow, D. Schwalm, R. von Hahn, and A. Wolf, Phys. Rev. A 89, 022502 (2014).
- Ferrari et al. [2019] P. Ferrari, E. Janssens, P. Lievens, and K. Hansen, Int. Rev. Phys. Chem. 38, 405 (2019).
- Hansen [2018] K. Hansen, Statistical Physics of Nanoparticles in the Gas Phase, vol. 73 of Springer Series on Atomic, Optical, and Plasma Physics (Springer, Dordrecht, 2018), ISBN 978-3-319-90061-2.
- Hansen and Campbell [1996] K. Hansen and E. E. B. Campbell, J. Chem. Phys. 104, 5012 (1996), URL http://scitation.aip.org/content/aip/journal/jcp/104/13/10.1063/1.471130.
- Hansen [2020] K. Hansen, Phys. Rev. A 102, 052823 (2020).
- Hansen et al. [2023] K. Hansen, O. Licht, A. Kurbanov, and Y. Toker, J. Phys. Chem. A 127, 2889 (2023).
- Miyamoto et al. [2008] R. Miyamoto, S. E. Kopp, A. Jansson, and M. J. Sypher, Phys. Rev. ST Accel. Beams 11, 084002 (2008).