Tracking Patterns in Toxicity and Antisocial Behavior Over User Lifetimes on Large Social Media Platforms
Abstract
An increasing amount of attention has been devoted to the problem of “toxic” or antisocial behavior on social media. In this paper we analyze such behavior at very large scales: we analyze toxicity over a 14-year time span on nearly 500 million comments from Reddit and Wikipedia, grounded in two different proxies for toxicity.
At the individual level, we analyze users’ toxicity levels over the course of their time on the site, and find a striking reversal in trends: both Reddit and Wikipedia users tended to become less toxic over their life cycles on the site in the early (pre-2013) history of the site, but more toxic over their life cycles in the later (post-2013) history of the site. We also find that toxicity on Reddit and Wikipedia differ in a key way, with the most toxic behavior on Reddit exhibited in aggregate by the most active users, and the most toxic behavior on Wikipedia exhibited in aggregate by the least active users. Finally, we consider the toxicity of discussion around widely-shared pieces of content, and find that the trends for toxicity in discussion about content bear interesting similarities with the trends for toxicity in discussion by users.
Introduction
Antisocial behavior on social media is recognized as an increasingly important problem for the experience of users on many large platforms. It has been implicated in patterns of online harassment,[1, 2] outcomes of civic processes,[3, 4, 5, 6] and physical violence.[7, 8] However, its underlying mechanisms are still poorly understood. One reason for this challenge is that the culture and dynamics of social media are also constantly changing, both within and across platforms.[9, 10] Users also influence and are influenced by the communities they interact with. [11, 12]
The present work is interested in whether patterns of toxicity change over time, not just globally across a platform, but particularly within individual users. We analyze trajectories across four dimensions: activity level (lifetime number of comments), two different metrics of antisocial behavior (Perspective API toxicity score and “downvote score”, discussed below), two different social media sites (Reddit and Wikipedia), and two types of histories (people/users and information/URLs).
In nearly all cases, we observe a striking reversal: users do change over their lifetimes, but the direction of that change hasn’t been stable over time. Before 2013, the longer a user spent on a social media site, the less toxic they became. After 2013, the longer they spent on the site, the more toxic they became.111This pattern appears for both metrics used, but for the downvote metric, the reversal happens slightly later - around 2015.
We also observe another pattern: First, low-activity users are generally separable from higher-activity users in their toxicity behavior. On Reddit, higher-activity users have higher toxicity scores; on Wikipedia, the reverse is true. This raises the question of how this difference comes about: one possibility is that high-activity users start out looking exactly like low-activity users and gradually reach their final level of toxicity; a second possibility is that they have different toxicity from the beginning. We find that the data is more consistent with the latter principle: Low- and high-activity users have different average toxicity metrics from their very first post. That is, it doesn’t seem that users start out the same, then only become more or less toxic the more they comment. Instead, they’re distinct from each other from the beginning.
We note at the outset that it’s worth being critical of the term “toxicity”. The term is commonly assumed to need no definition,[13, 14] and often used without explanation. But some think it’s too vague to be meaningful, or even that it’s used to avoid responsibility or to avoid more uncomfortable topics such as radicalization or identity-based hatred.[13, 15] It is therefore important to discuss the sense in which we will use it in our work.
Google’s Jigsaw, the makers of the Perspective API,[16, 17, 18] give a practical reason for choosing the term: when training humans to annotate their training data for generally problematic text, they found that “toxic” was the easiest concept to understand and find an agreed-on definition for. That is, they tried various terms for various forms of problematic behavior, and the annotators were more likely to disagree on which comments met the definitions of any of the other terms.[19] For the API metric used in this work, “severe toxicity”, the specific definition they used was: “a hateful, aggressive, disrespectful comment or otherwise very likely to make a user leave a discussion or give up on sharing their perspective”.[20]
Whether or not we agree with their definition,[21, 22, 23] the model is clearly measuring some signal. And since we’re interested in patterns at large scale over long time periods, we think it can give us useful information. Plus, the fact that it’s commonly used in research[23] makes it easier to put results in context, and its use in real-world applications[24, 25] means that it’s worth studying.
Another way to address the subtlety of the underlying concepts is to quantify them in multiple disjoint ways. Accordingly, we also supplement the Perspective API score with a completely unrelated metric: a “downvote score”, which also measures some kinds of antisocial behavior. Reddit’s content ranking depends on user voting, where any user can “upvote” or “downvote” a post or comment. Reddit asks users to vote based on whether a comment “contributes to conversation”, and is on-topic to the community it’s posted in.[26] (There’s no enforcement, however, and users sometimes vote based on other factors, such as whether they agree with the comment.) A comment’s score is a direct measure of how much its audience thinks it should be seen by others. Comments with a negative score, meaning they got more downvotes than upvotes, were likely judged in the eyes of their community to be antisocial in some way. As we will see, the broad conclusions we draw hold under both numerical metrics, despite the fact that they are based on essentially disjoint sources of information in the underlying data.
Many works look at online toxicity and antisocial behavior, many specifically using the Perspective API toxicity score.[27, 28, 29, 30] Other metrics of “toxicity” or “antisocial behavior” include banned users,[31] hand-coded “civility”,[32, 33] and alternate toxicity or hate speech classifiers.[34, 35] However, most of these are interested in conversation-level[30, 27, 35, 36, 32, 37, 38] or community-level[39, 40, 41, 42, 29] patterns.
Of the few that look at individual trajectories over time, Cheng et al[31] analyze users who will go on to be banned from a community. Similar to this work, they find that “future banned users” are different from “never-banned users” from their very first post, and that these users’ behavior changes over time according to their main metrics: post deletion rate and text quality. They also measure slopes in users’ post deletion rates over time, though focus on whether the slopes change between the first and second half of a user’s lifetime. Almerekhi et al[34] follow user change at a more local level, using a binary definition of “toxicity” and counting events where a user made a “toxic” comment after a “non-toxic” comment or vice versa. Waller and Anderson[39] also find a temporal shift in other characteristics at a similar time to the shift found in this work. They found a sharp change in user polarization, measured by the partisanship of communities that users commented in. However, this polarization event wasn’t relative to user lifetimes; existing users all polarized at approximately the same time, though most of the polarization was driven by new users.
Results
Definitions
We use two metrics: toxicity and downvote scores. We also use three separate datasets. See the Methods section for a more detailed description.
Toxicity score
The toxicity score is from the Perspective API,[43] a machine learning model that assigns a piece of text a score between 0 and 1, where 1 is most toxic. The API defines “toxicity” as “a very hateful, aggressive, disrespectful comment or otherwise very likely to make a user leave a discussion or give up on sharing their perspective”.[20]
Downvote score
The downvote score comes from the Reddit voting system, where any user can “upvote” or “downvote” a comment based on whether it “contributes to conversation”.[26] Here “downvote score” for a group of comments denotes the percentage of comments that were downvoted, meaning they received more downvotes than upvotes.
Datasets
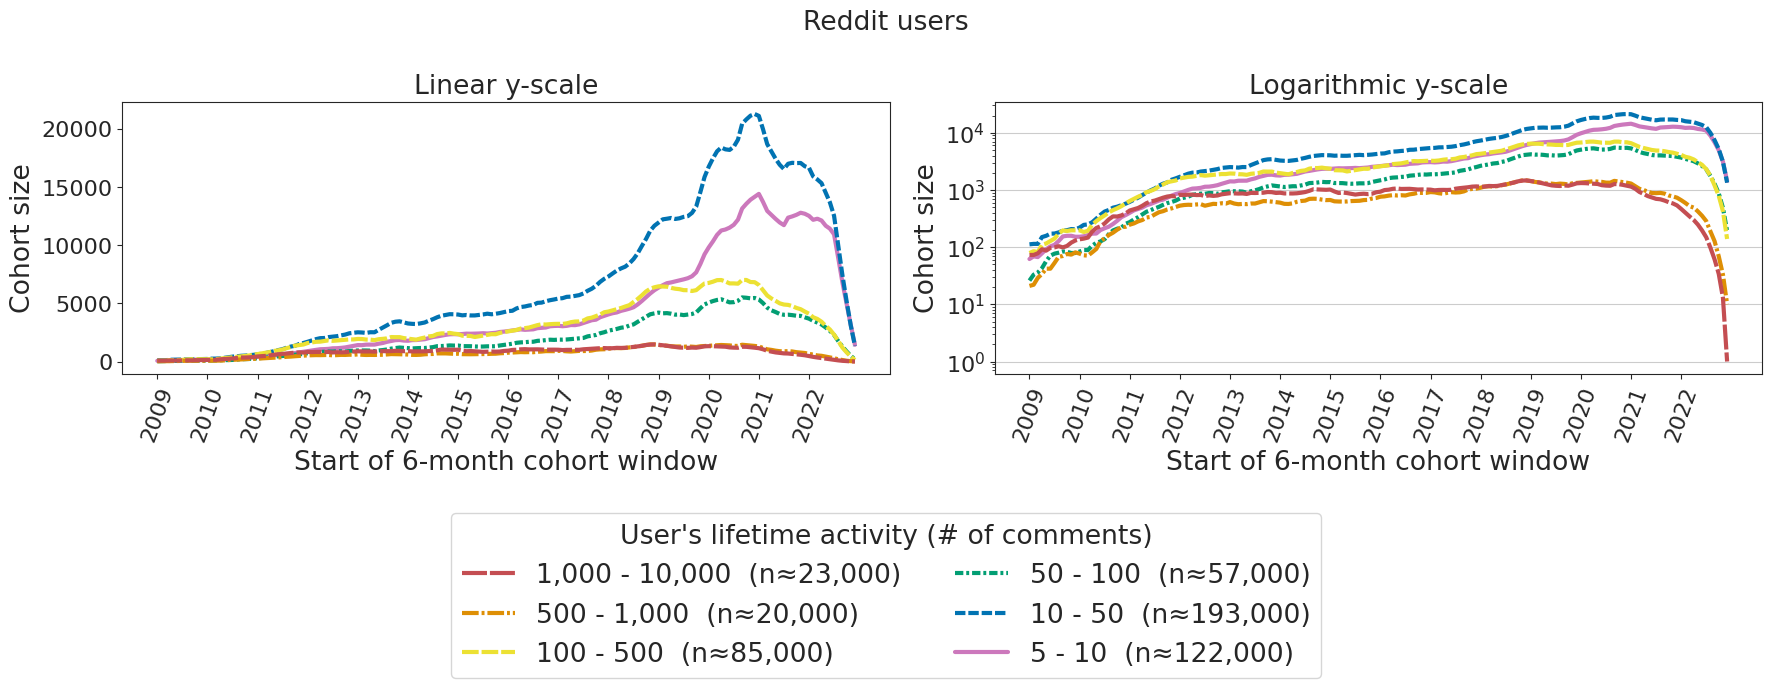
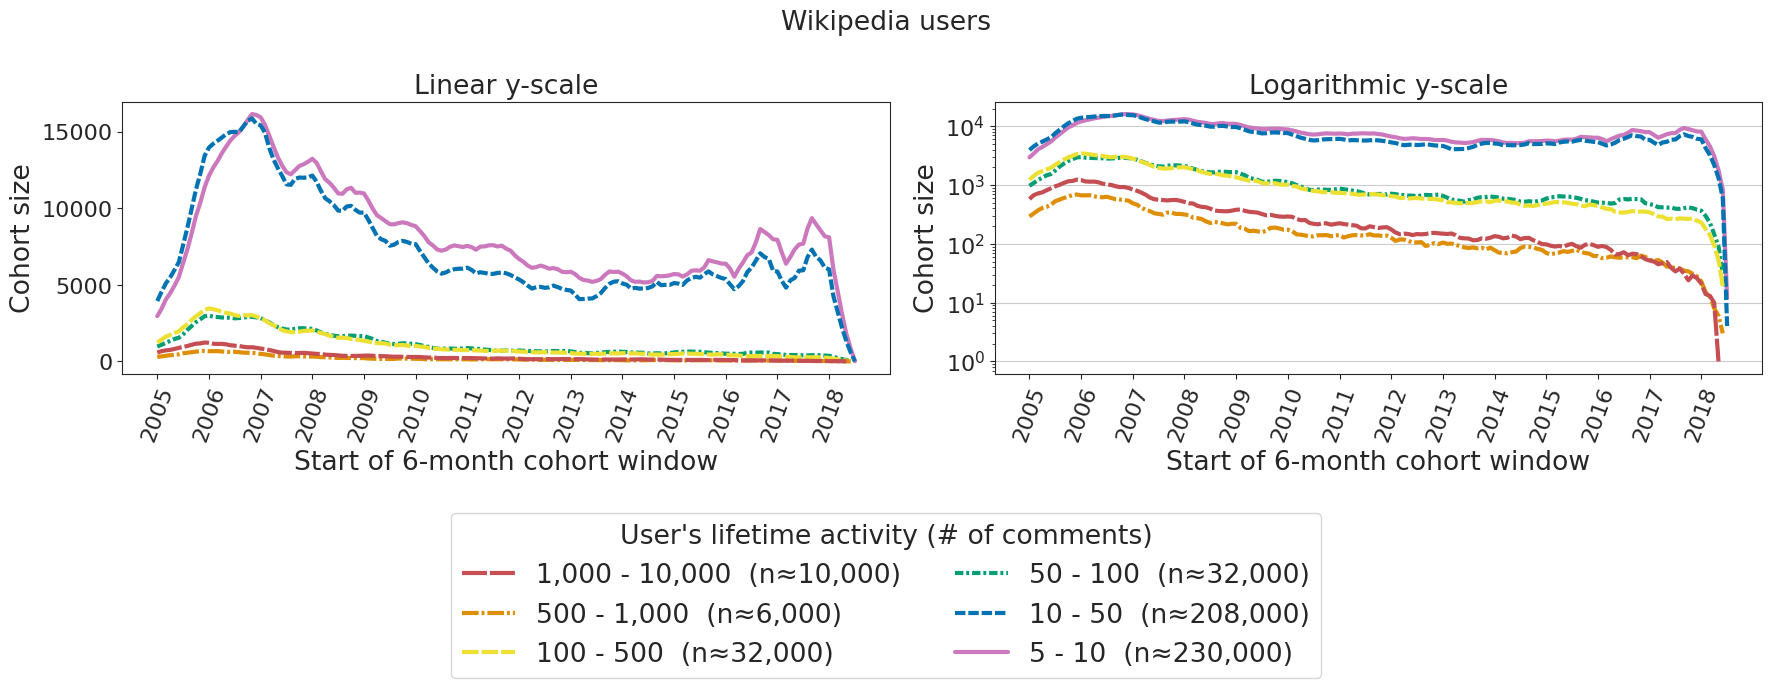
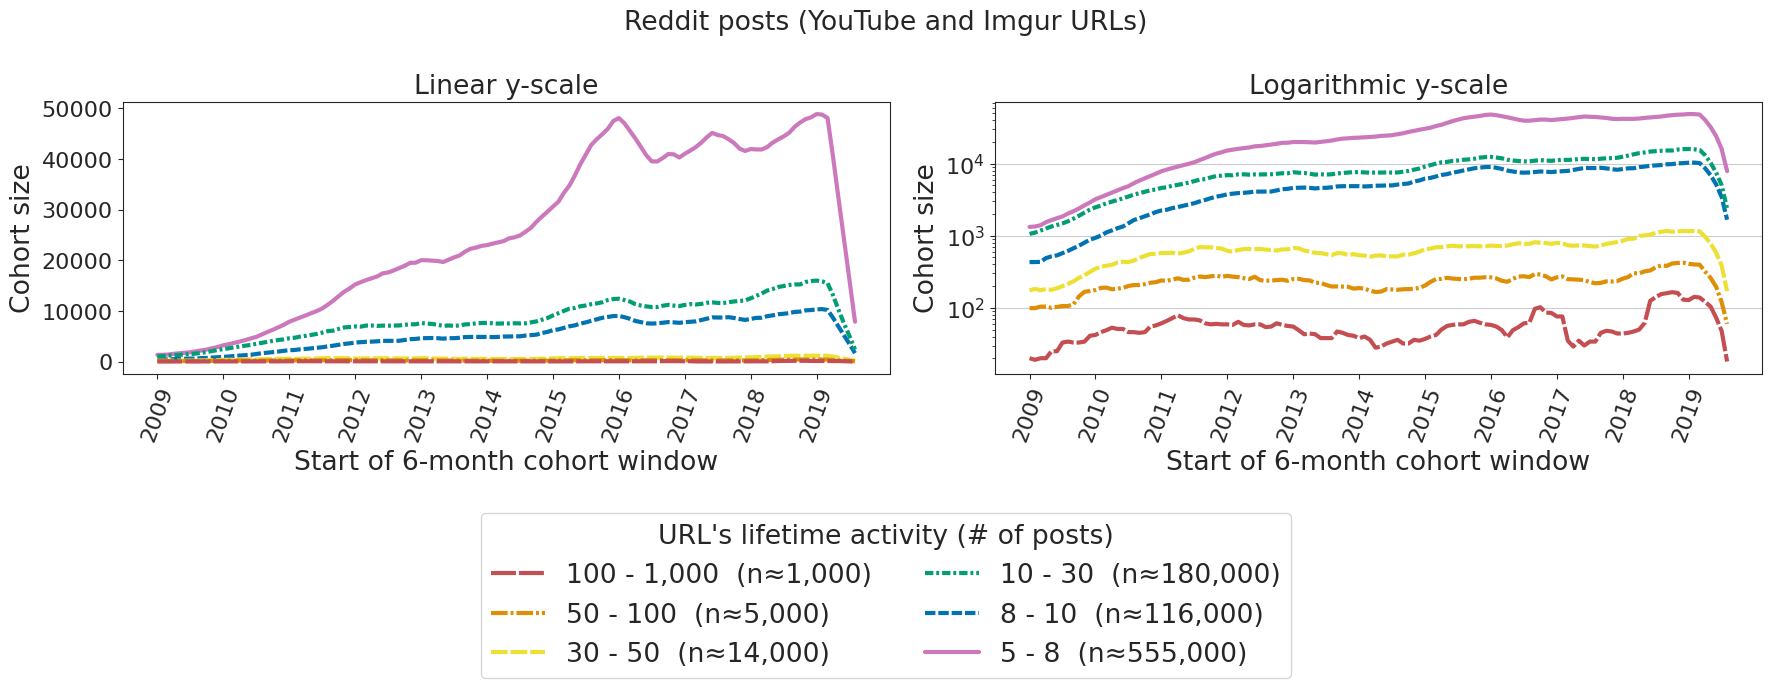
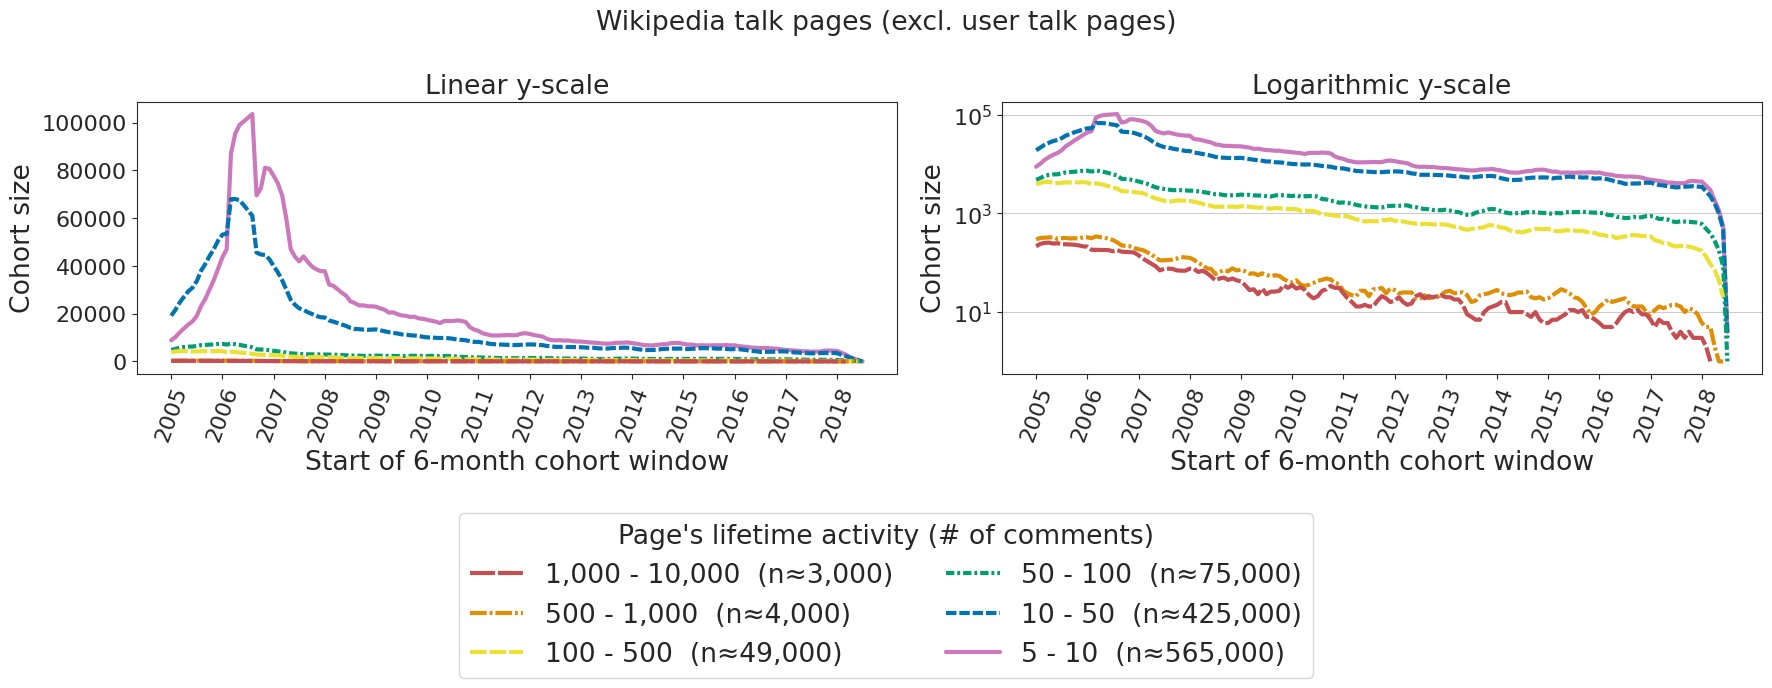
The Reddit user dataset contains all comments made by a random sample of 1 million users (), for a total of 123 million comments. The Wikipedia dataset contains all edits made to Wikipedia talk pages, after filtering out bot accounts, for a total of 122 million edits from 2.8 million accounts, on 21.8 million talk pages. Supplementary Section S.G shows the number of accounts made in different years.
The Reddit URL dataset consists of all Reddit posts of YouTube or Imgur URLs. Scores for each post were calculated as the mean of scores for all comments on the post. Downvote score for each post was defined as the percent of comments that were downvoted.
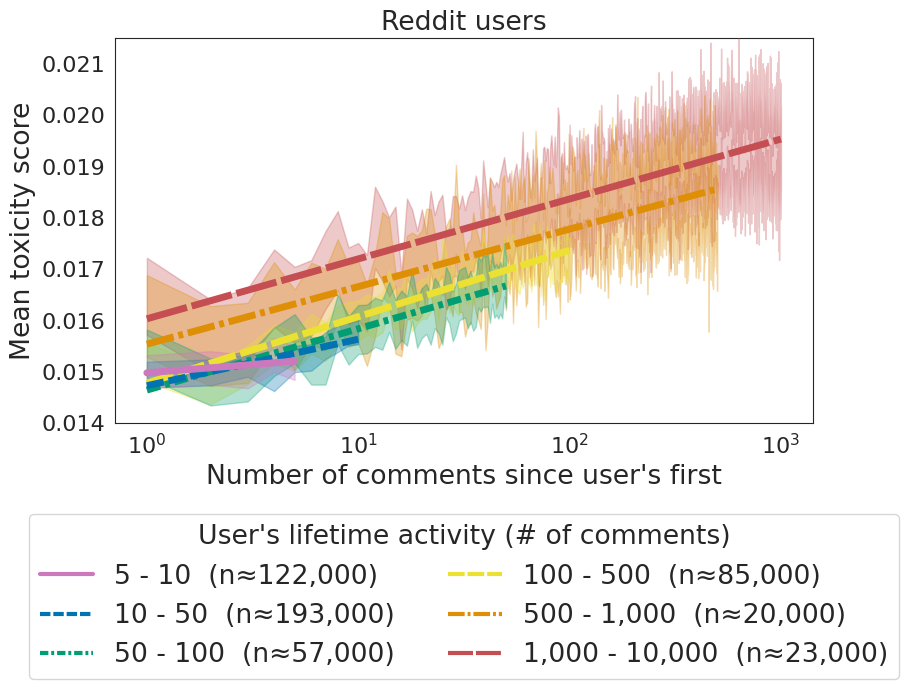
Reddit users
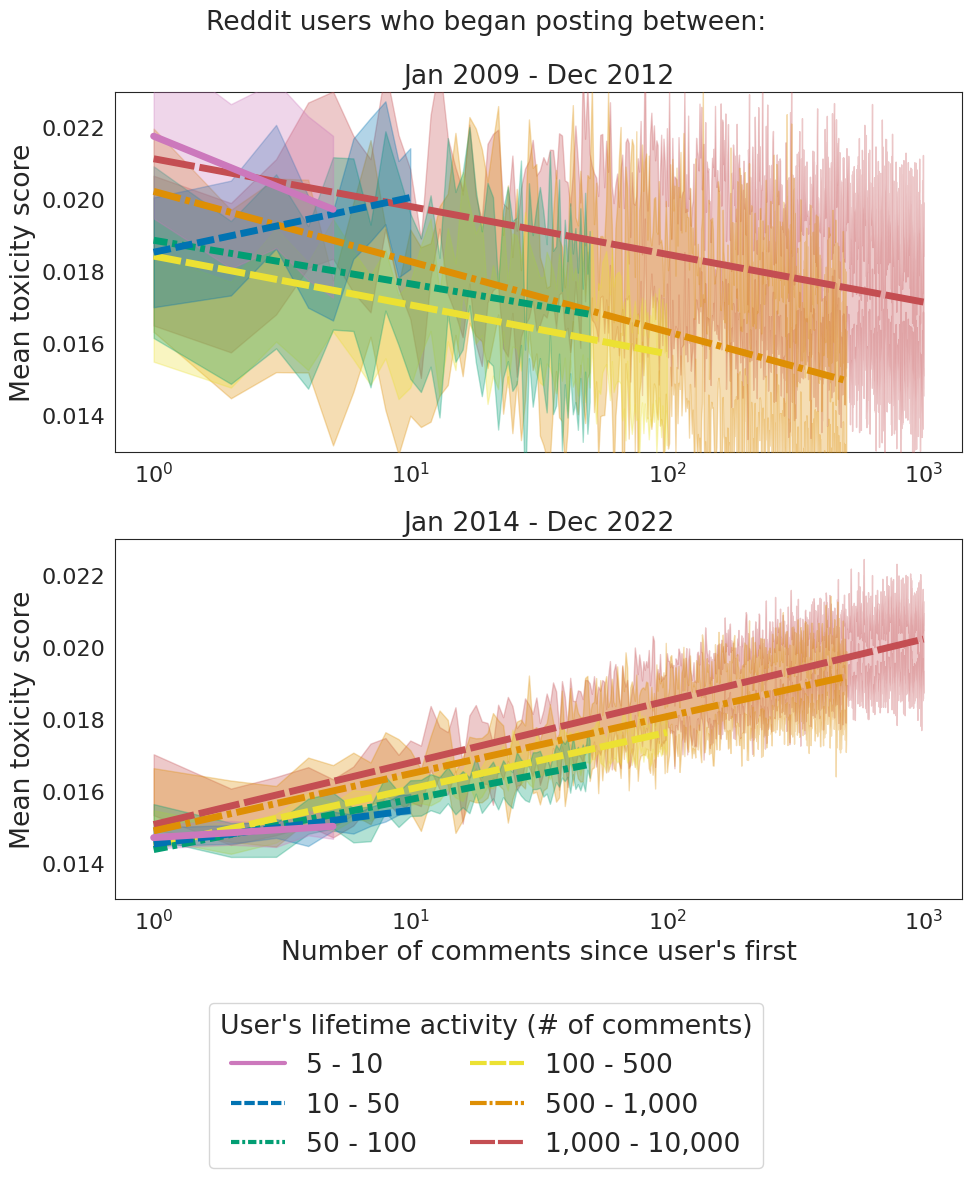
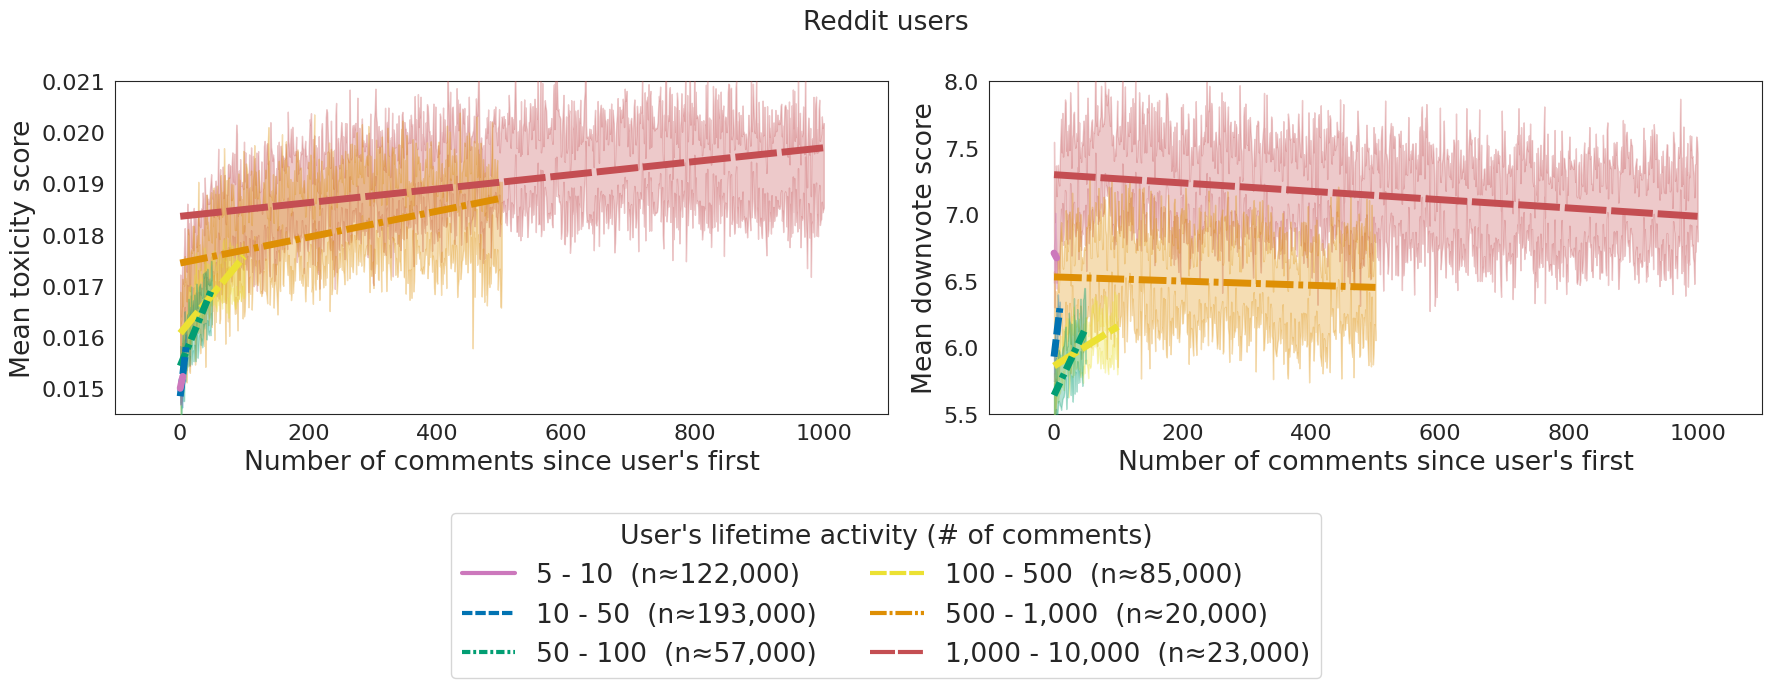
As a first question, we consider whether users who comment often are different from more casual users in the metrics we study (Fig 1). On average, they are indeed different, with the most prolific users showing the highest average for both toxicity and downvote scores. For toxicity scores, there is a clear upward trend as we move towards more active users.
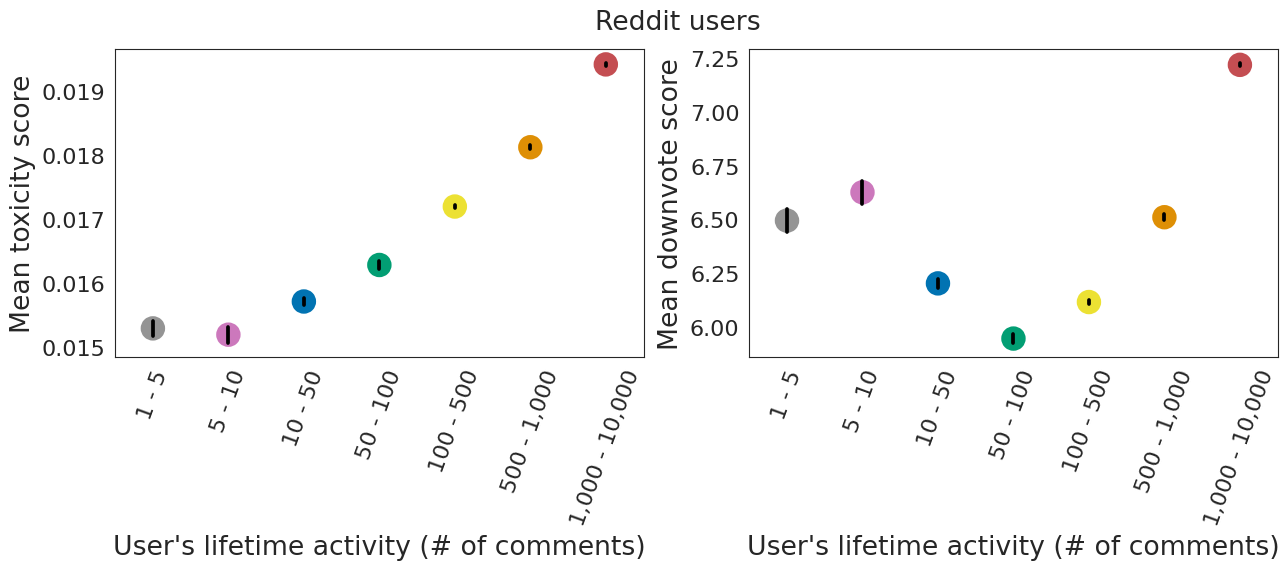
Black bars represent 95% confidence intervals from 1,000 bootstrap runs.
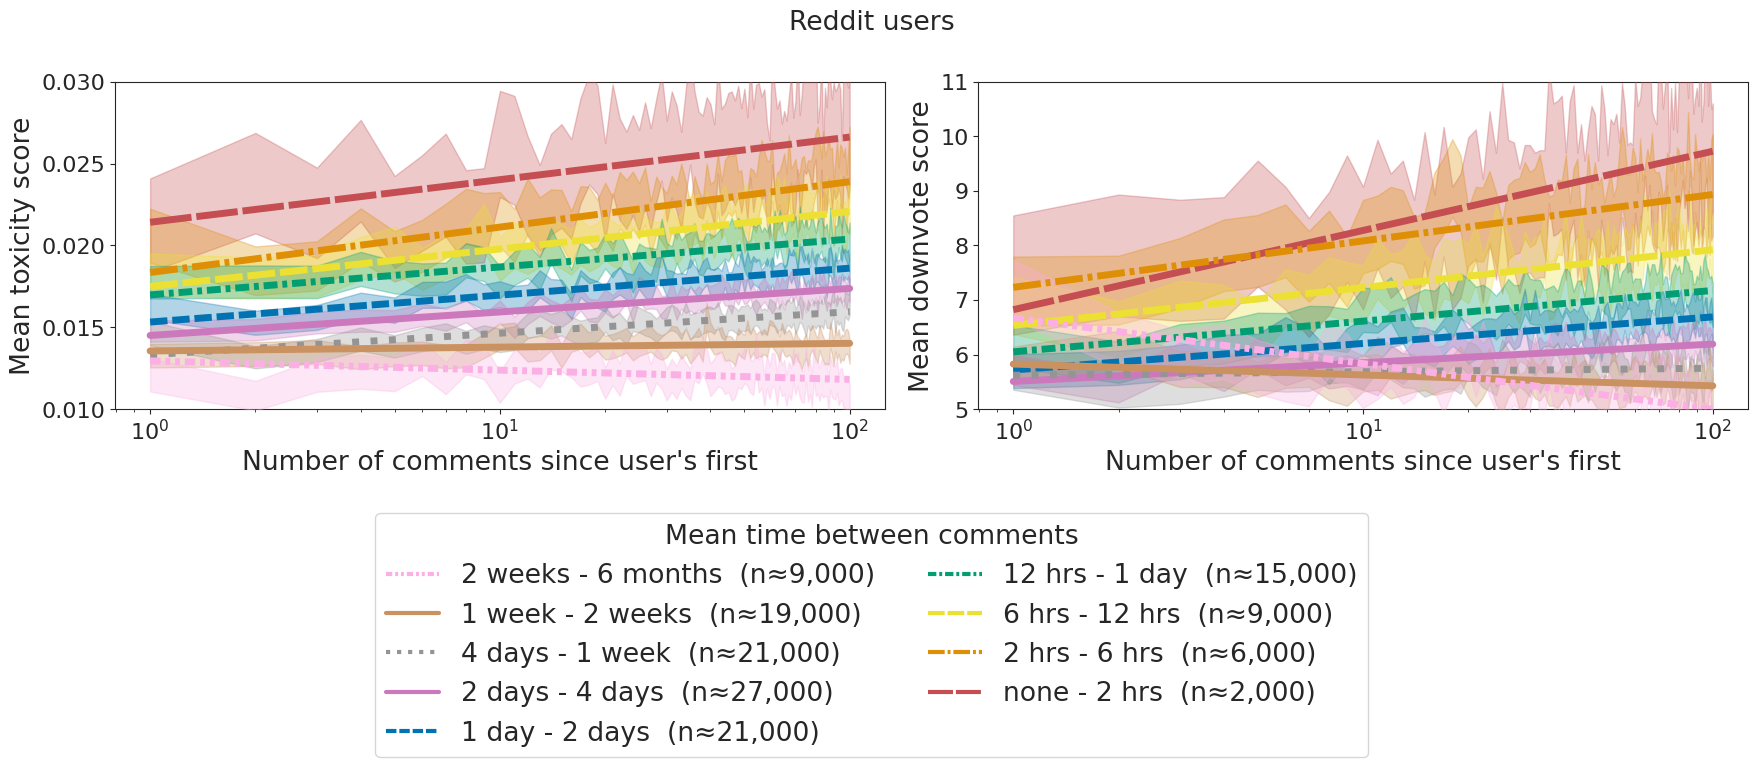
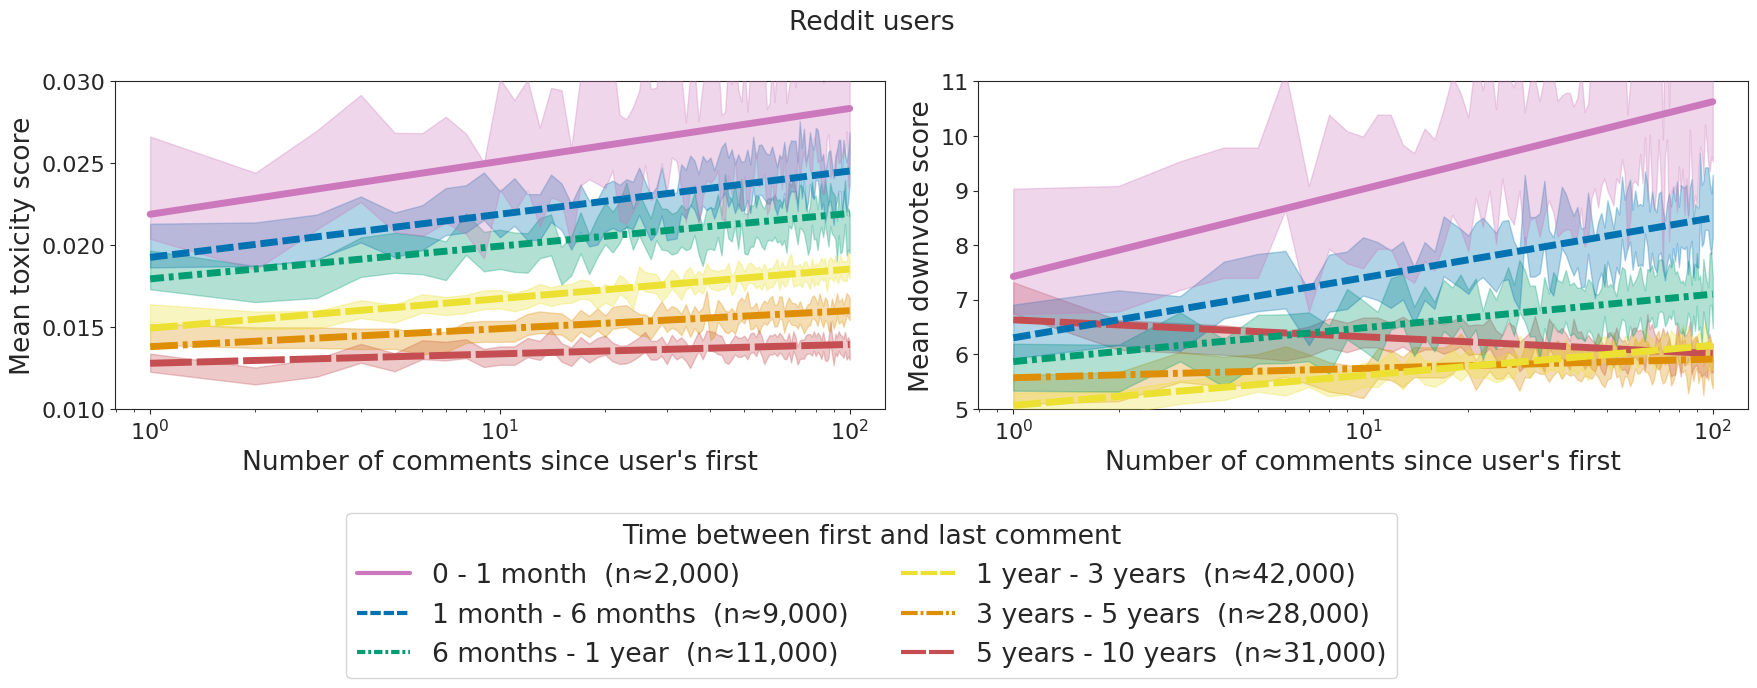
(To note, there are a number of options for stratifying users by activity. We use the lifetime number of comments, but we could also have used time between first and last post, or mean time between posts. We find that any of the three metrics shows roughly the same result, with more-active users more toxic on average (see Supplementary Section S.F). The number-of-comments method also has the advantage that each user contributes roughly the same number of comments to their bucket’s average.)
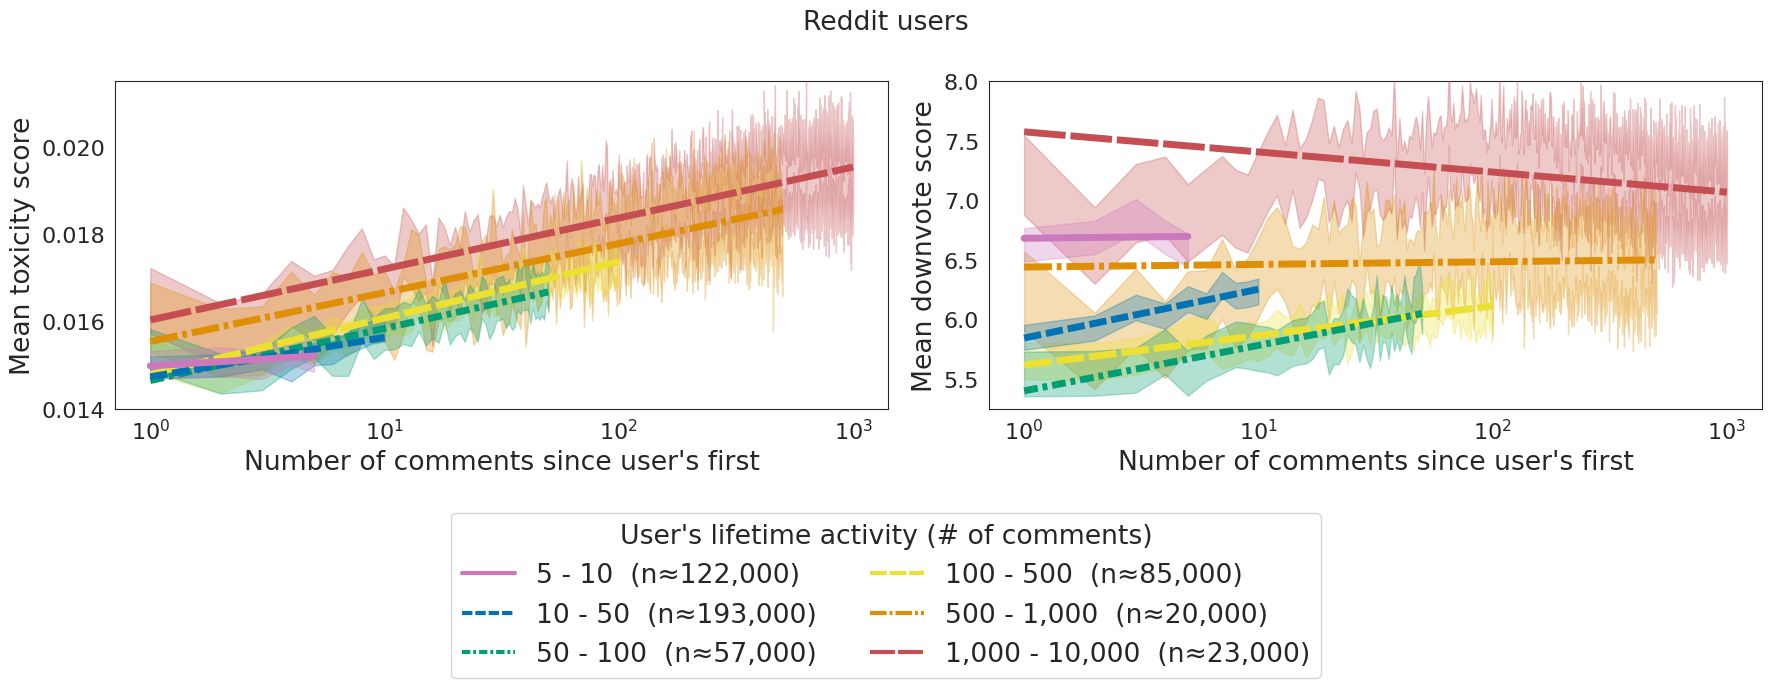
Shaded bands are 95% confidence intervals over all users in the relevant activity bucket. Trend lines are fit to the means over all users in an activity bucket.
The x-axis is logarithmic, for visibility of shorter activity buckets. For a linear x-axis scale and fit line, see Supplementary Section S.C.
A natural next question is whether the more active users made more toxic comments from the beginning, or if they became more toxic over their lifetime on the site.

Individual plots have the same structure as Fig. 2, with 95% confidence intervals and trend lines fitted to bucket means.
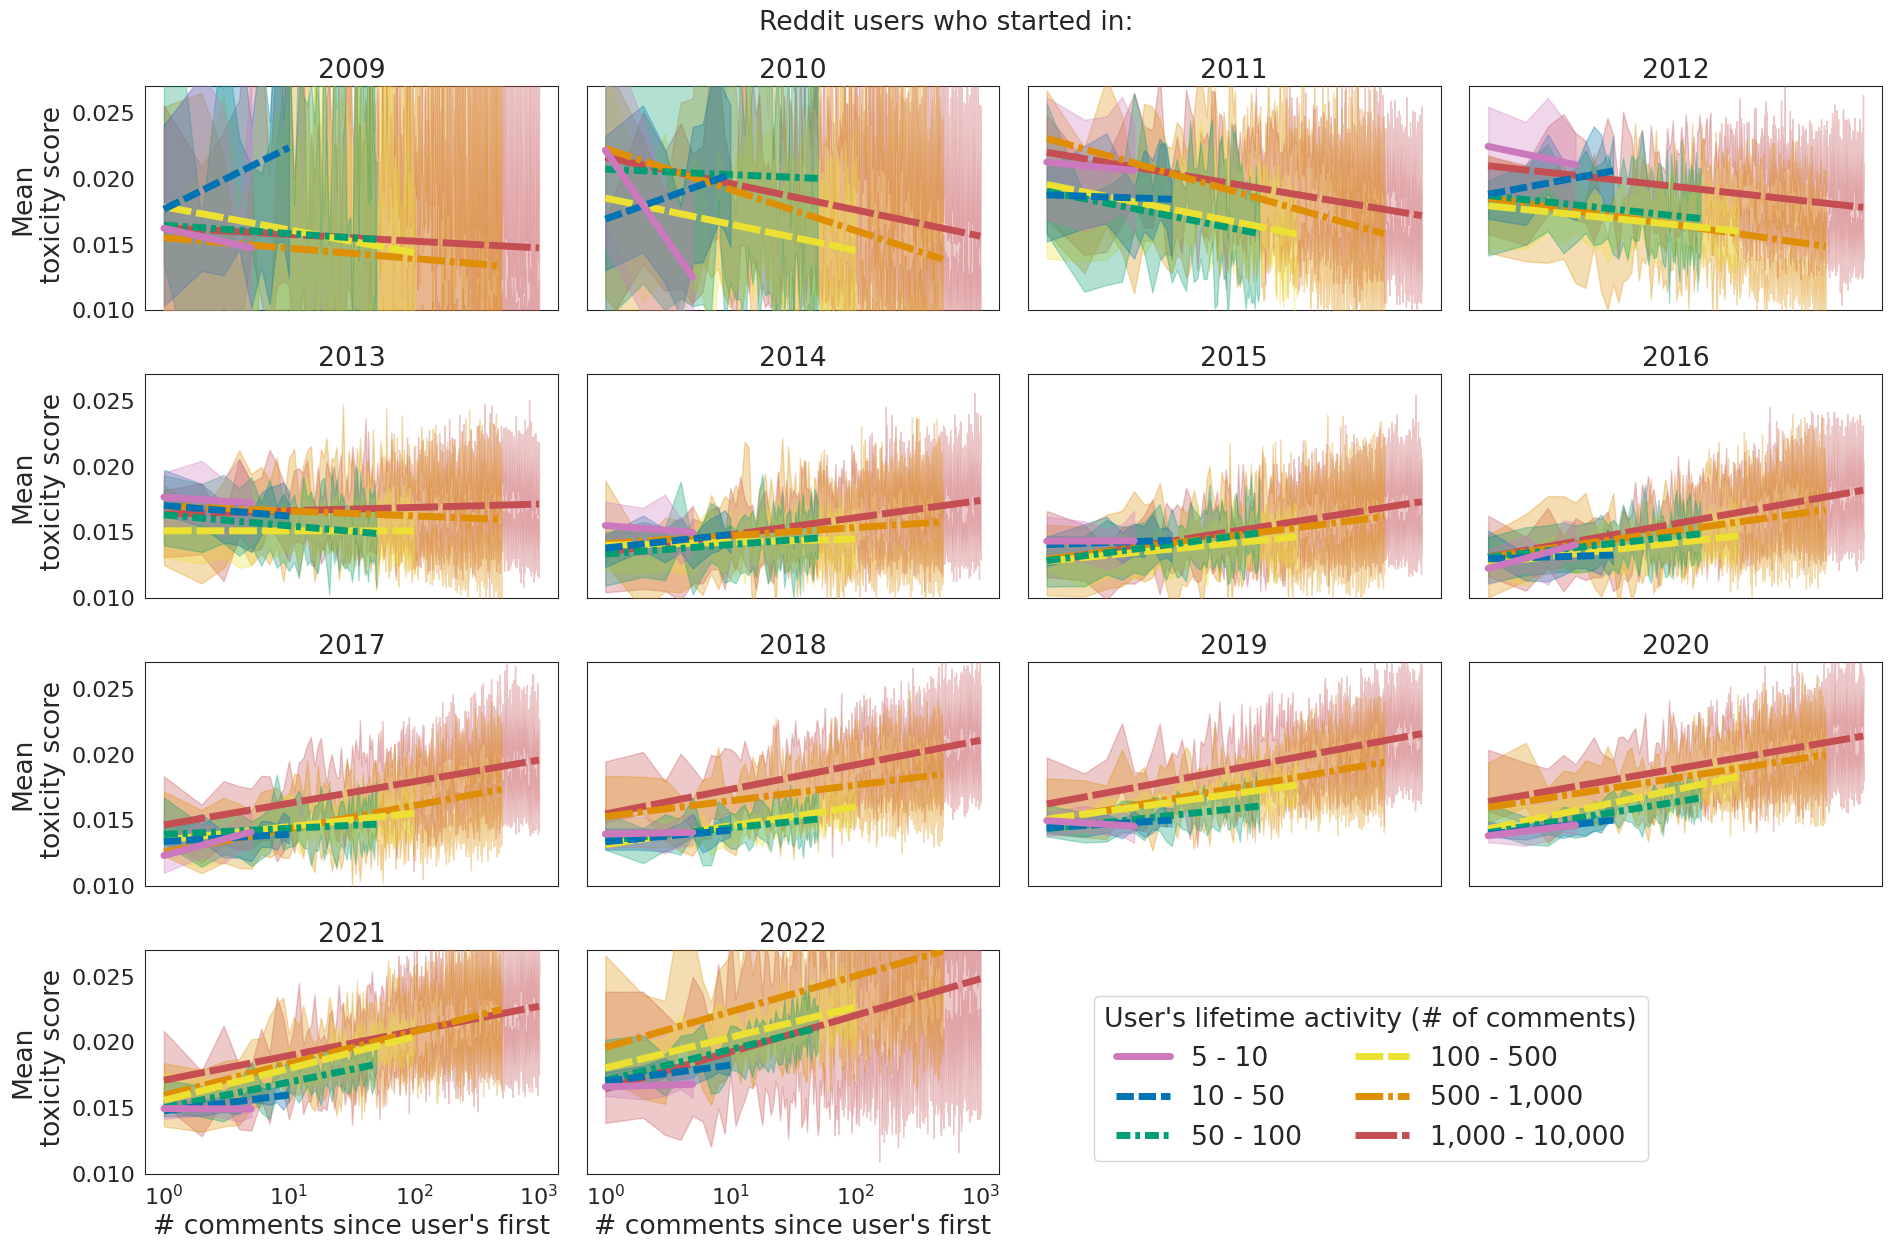
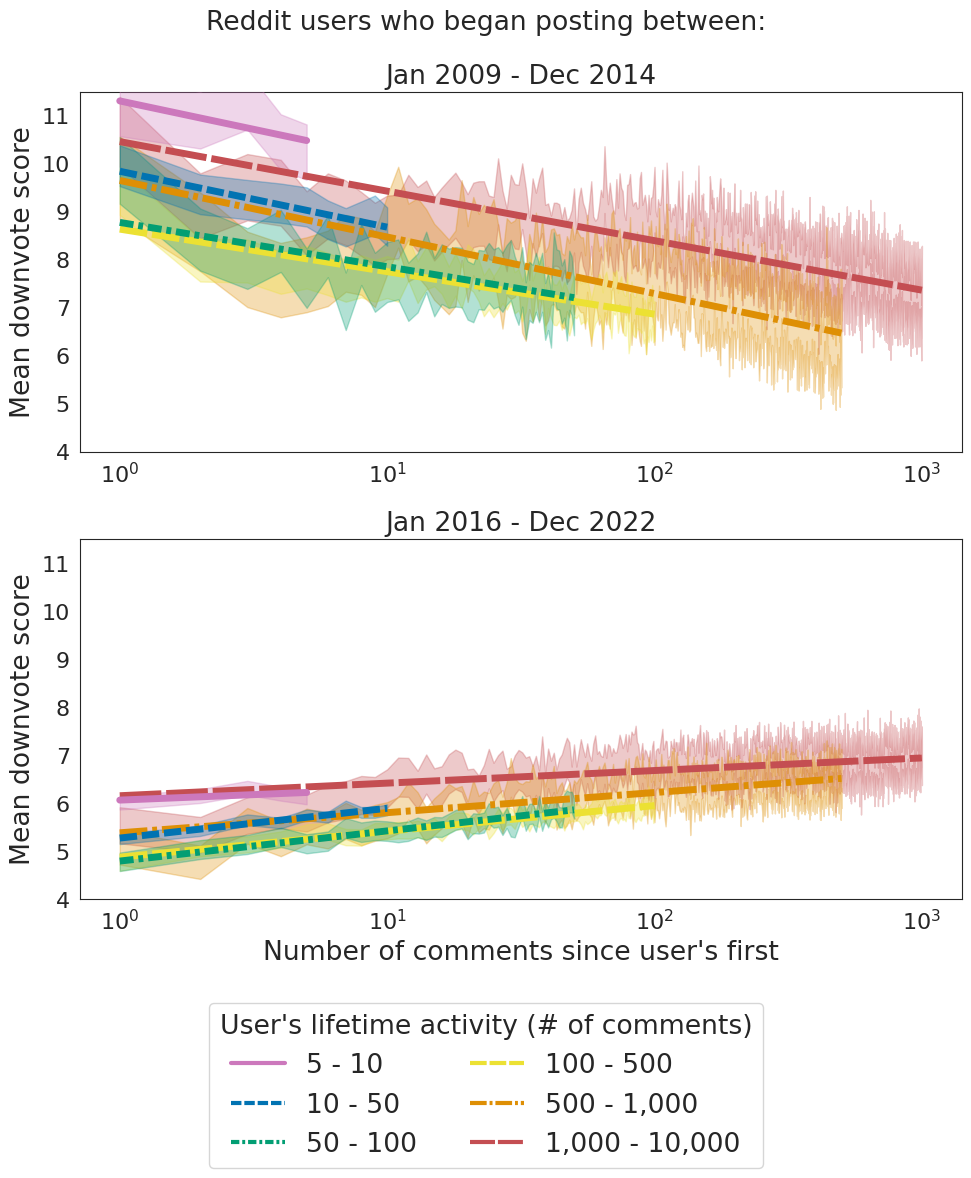
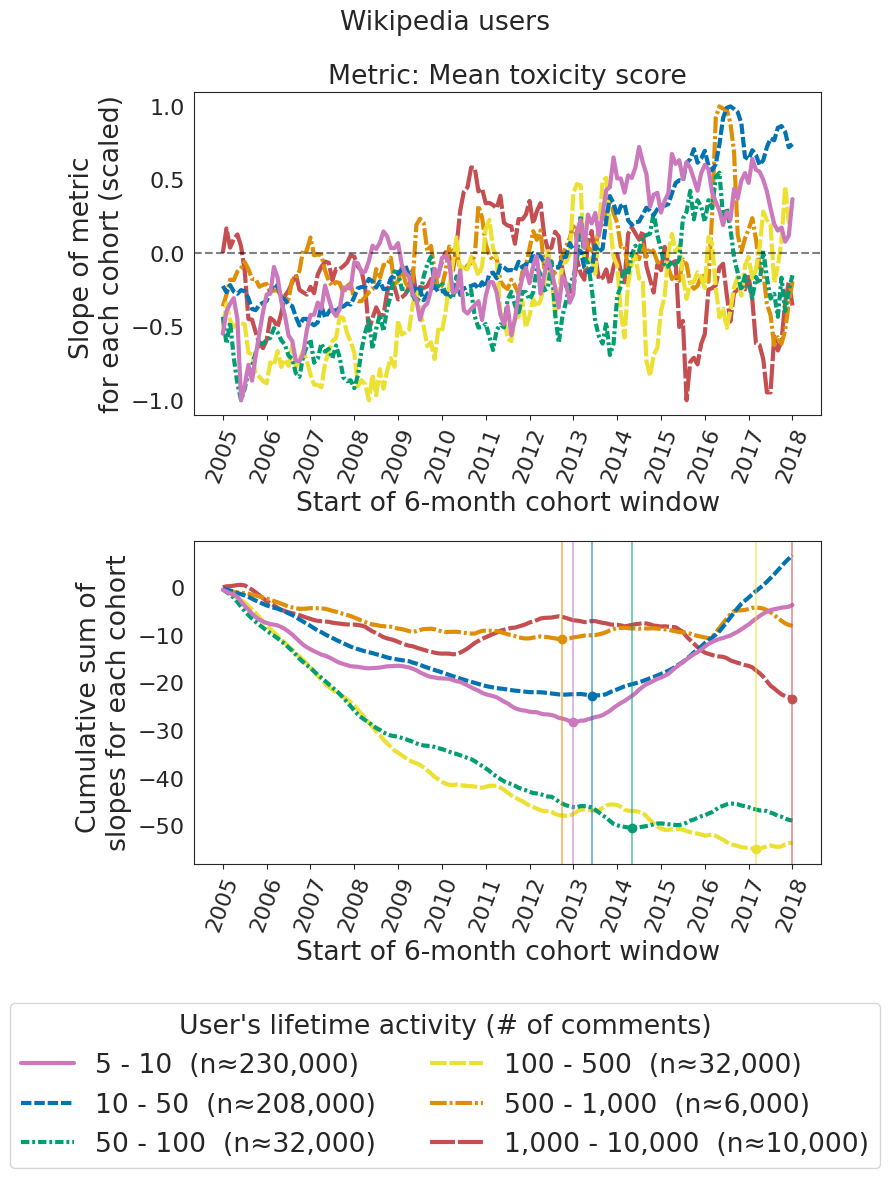
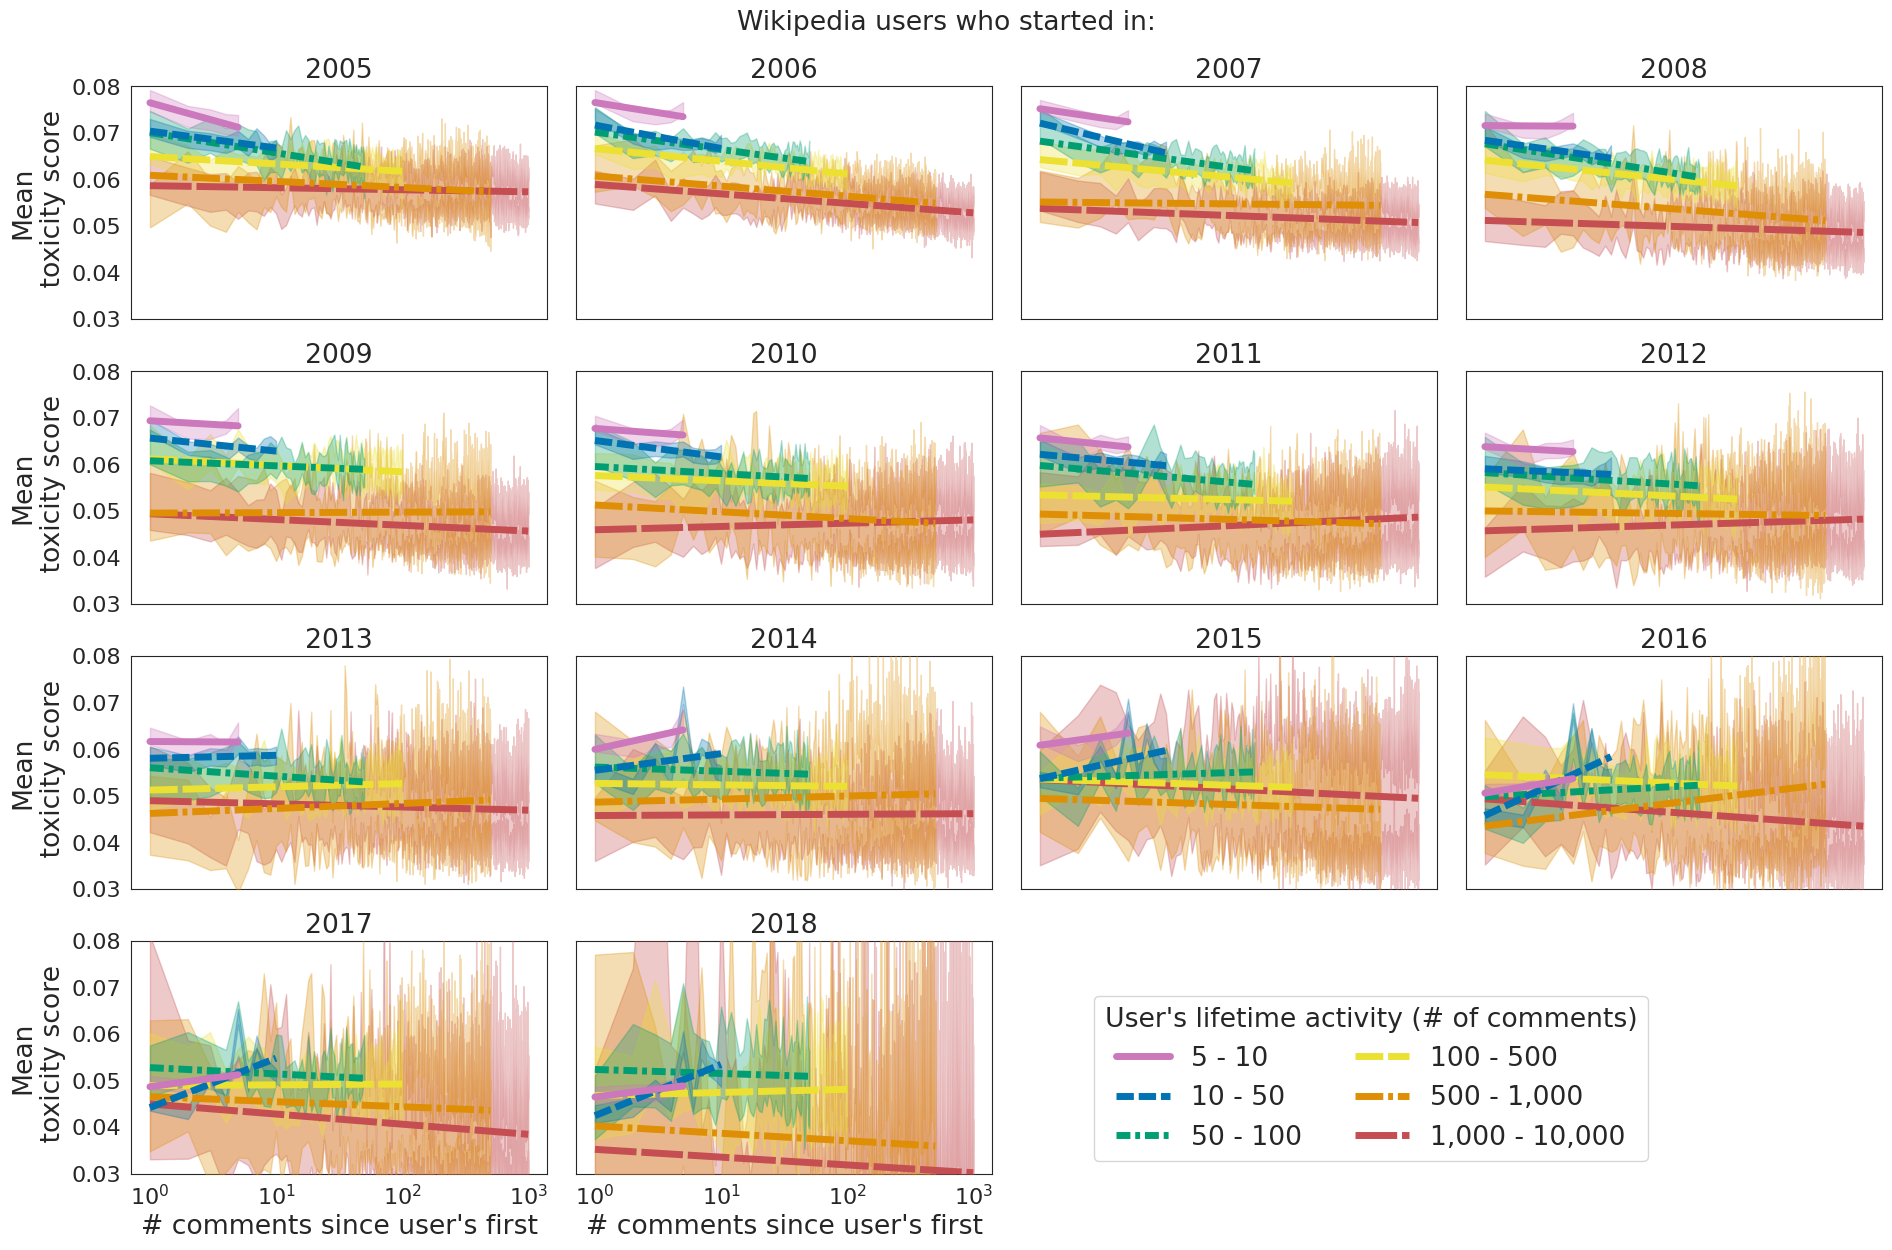
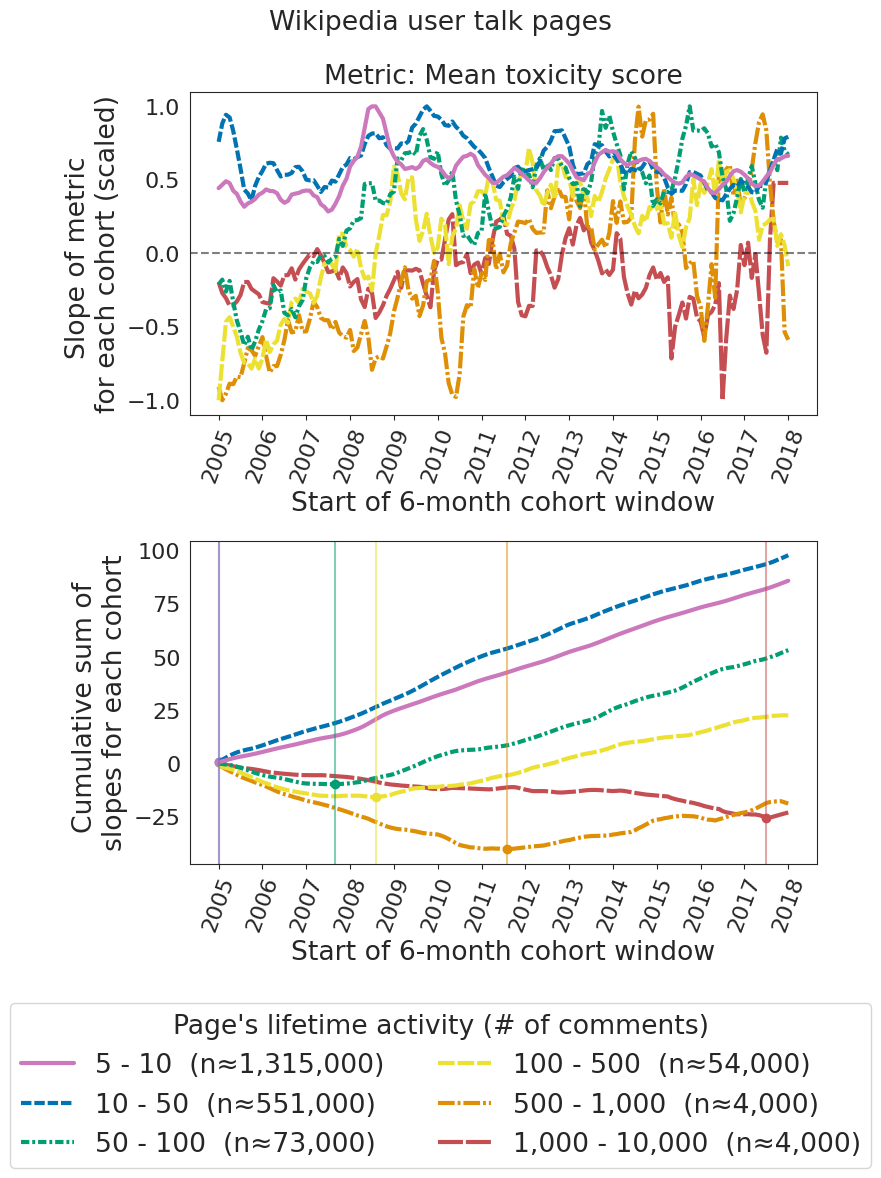
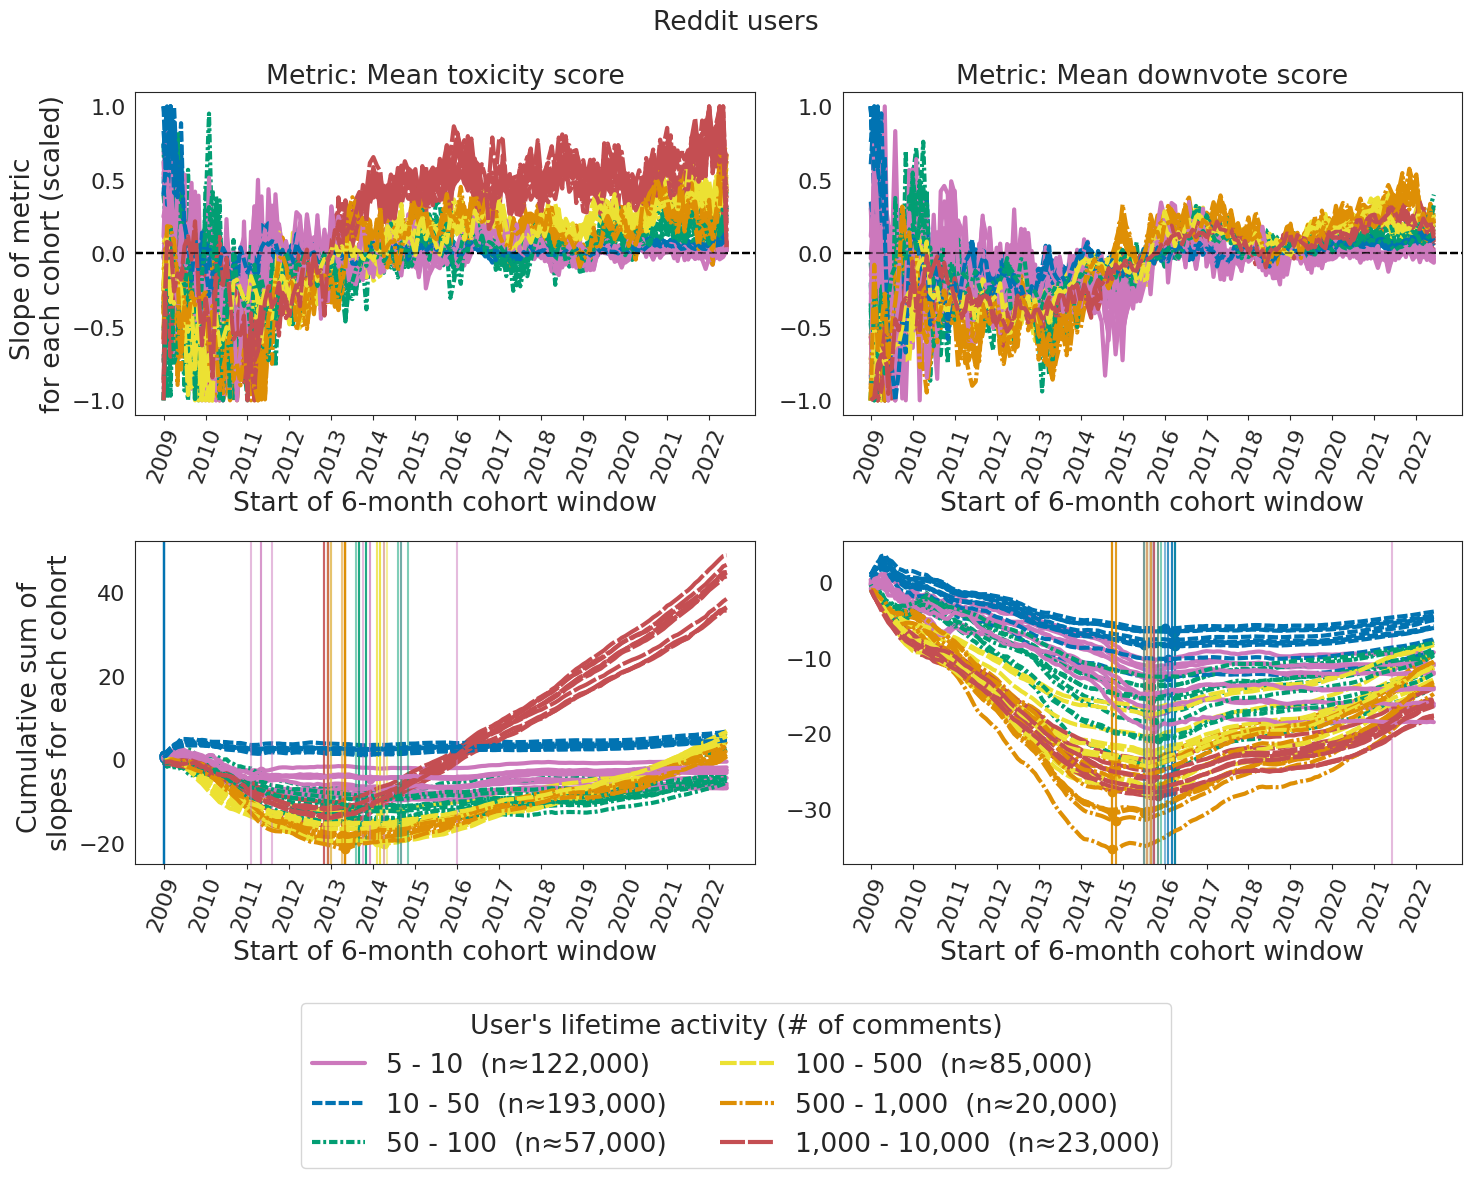
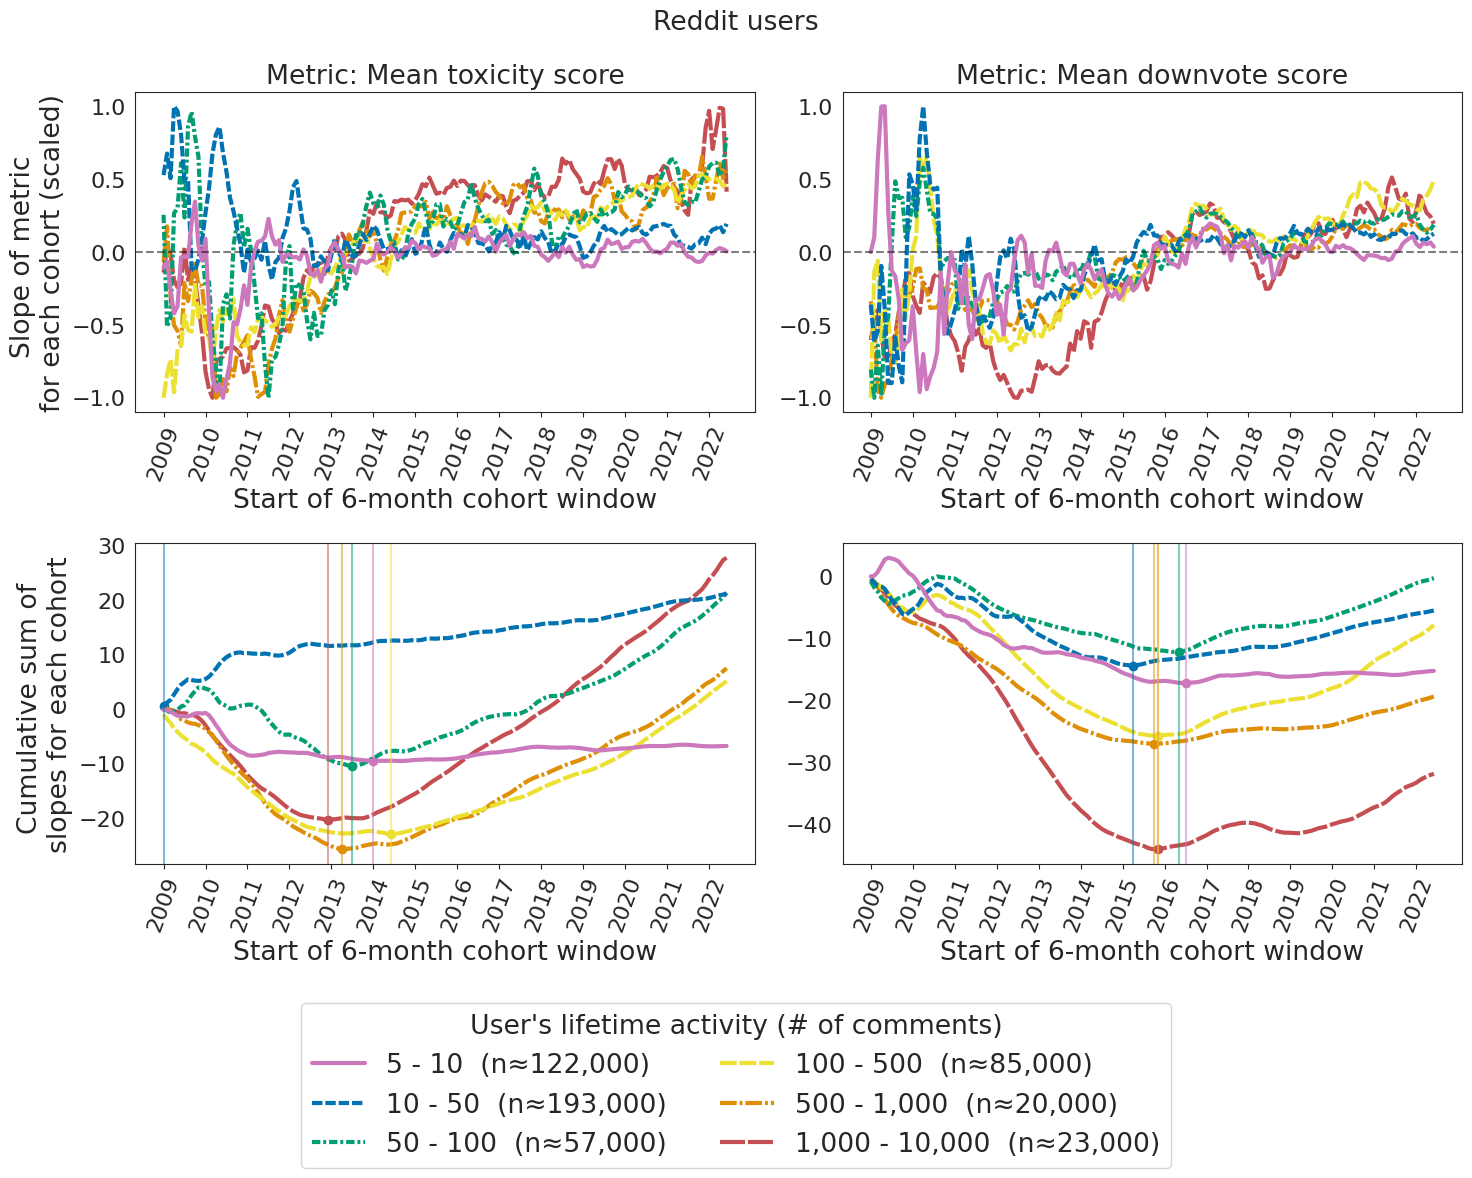
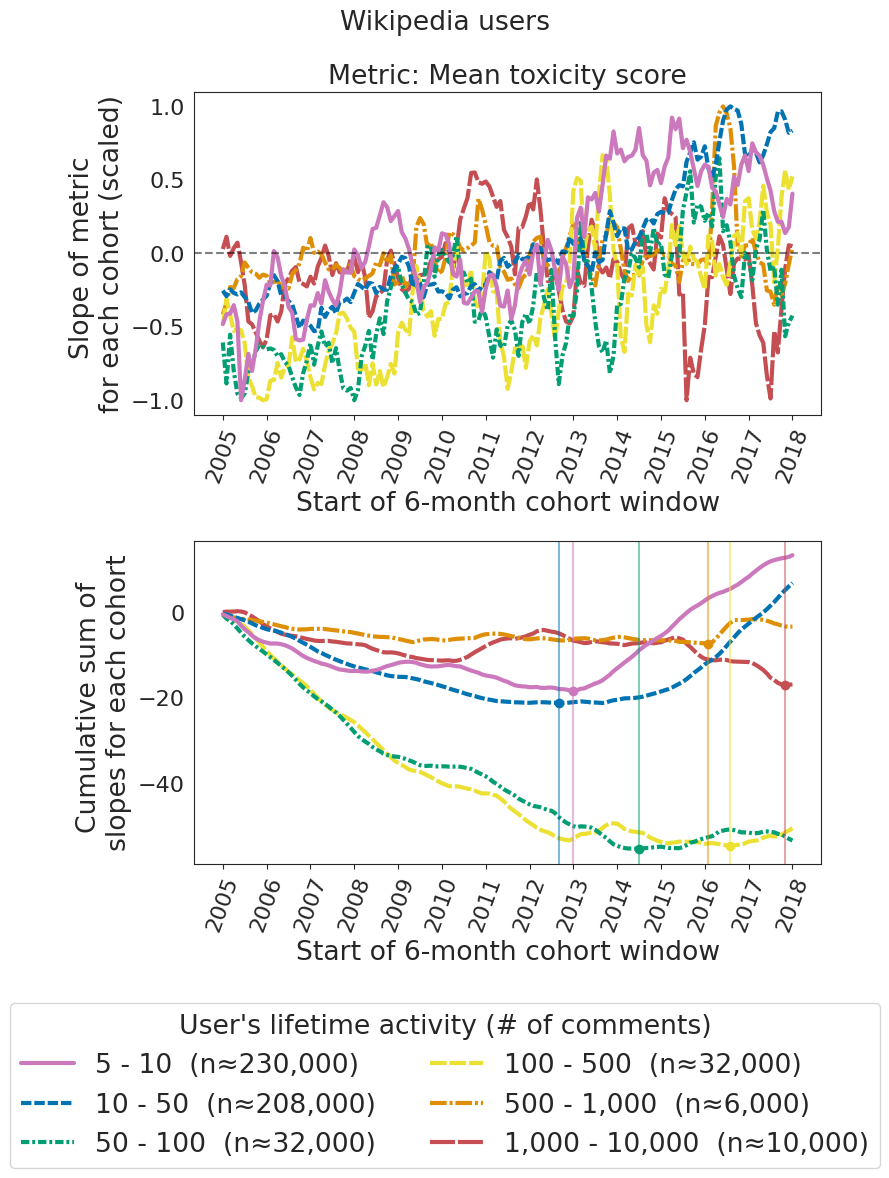
We also see a consistent increase in toxicity score over users’ lifetimes. But knowing that our user sample spans over a decade of time, we might wonder if this effect was consistent over Reddit’s lifespan as well. In Figure 3, we separate users into cohorts based on the year in which they began commenting. This separation highlights one of the key findings from our analysis: in the earlier years, there is a downward trend for both toxicity and downvote scores, meaning that users become less toxic over time; but the trend gradually reverses over the years until, by 2022, there’s a clear upward slope, meaning that users become more toxic over time. (Patterns appear roughly the same whether the x-axis is logarithmic or linear - see Supplementary Section S.C.)
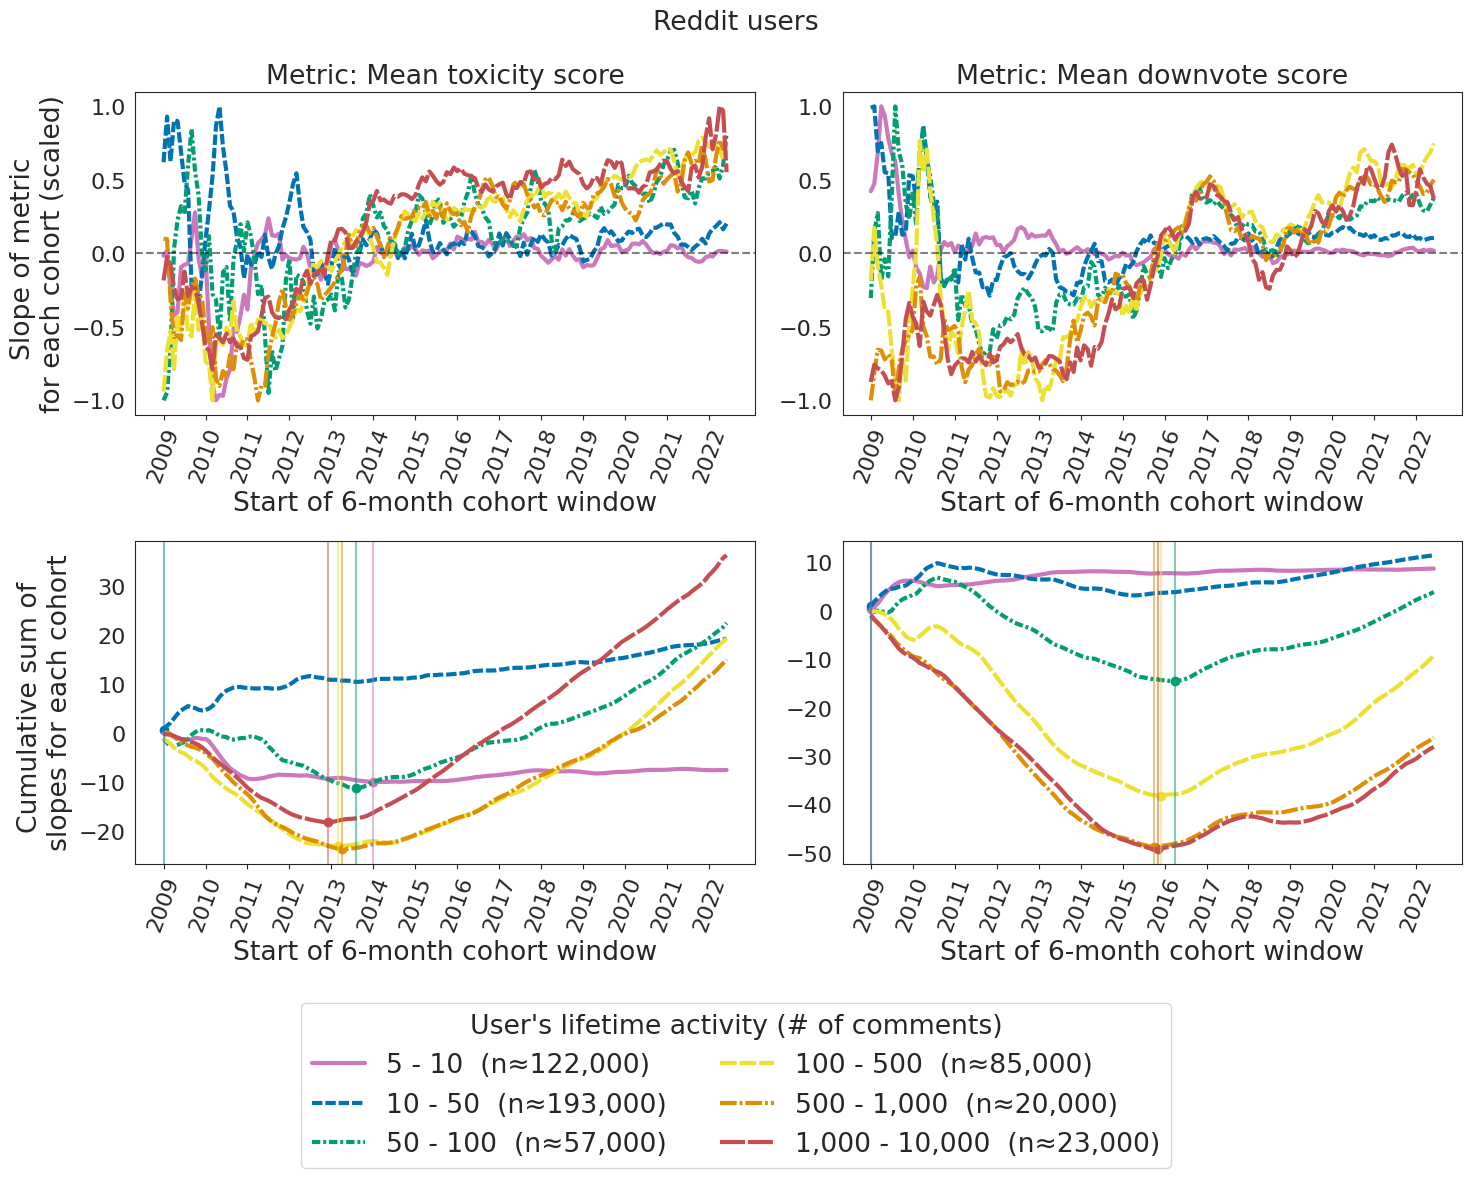
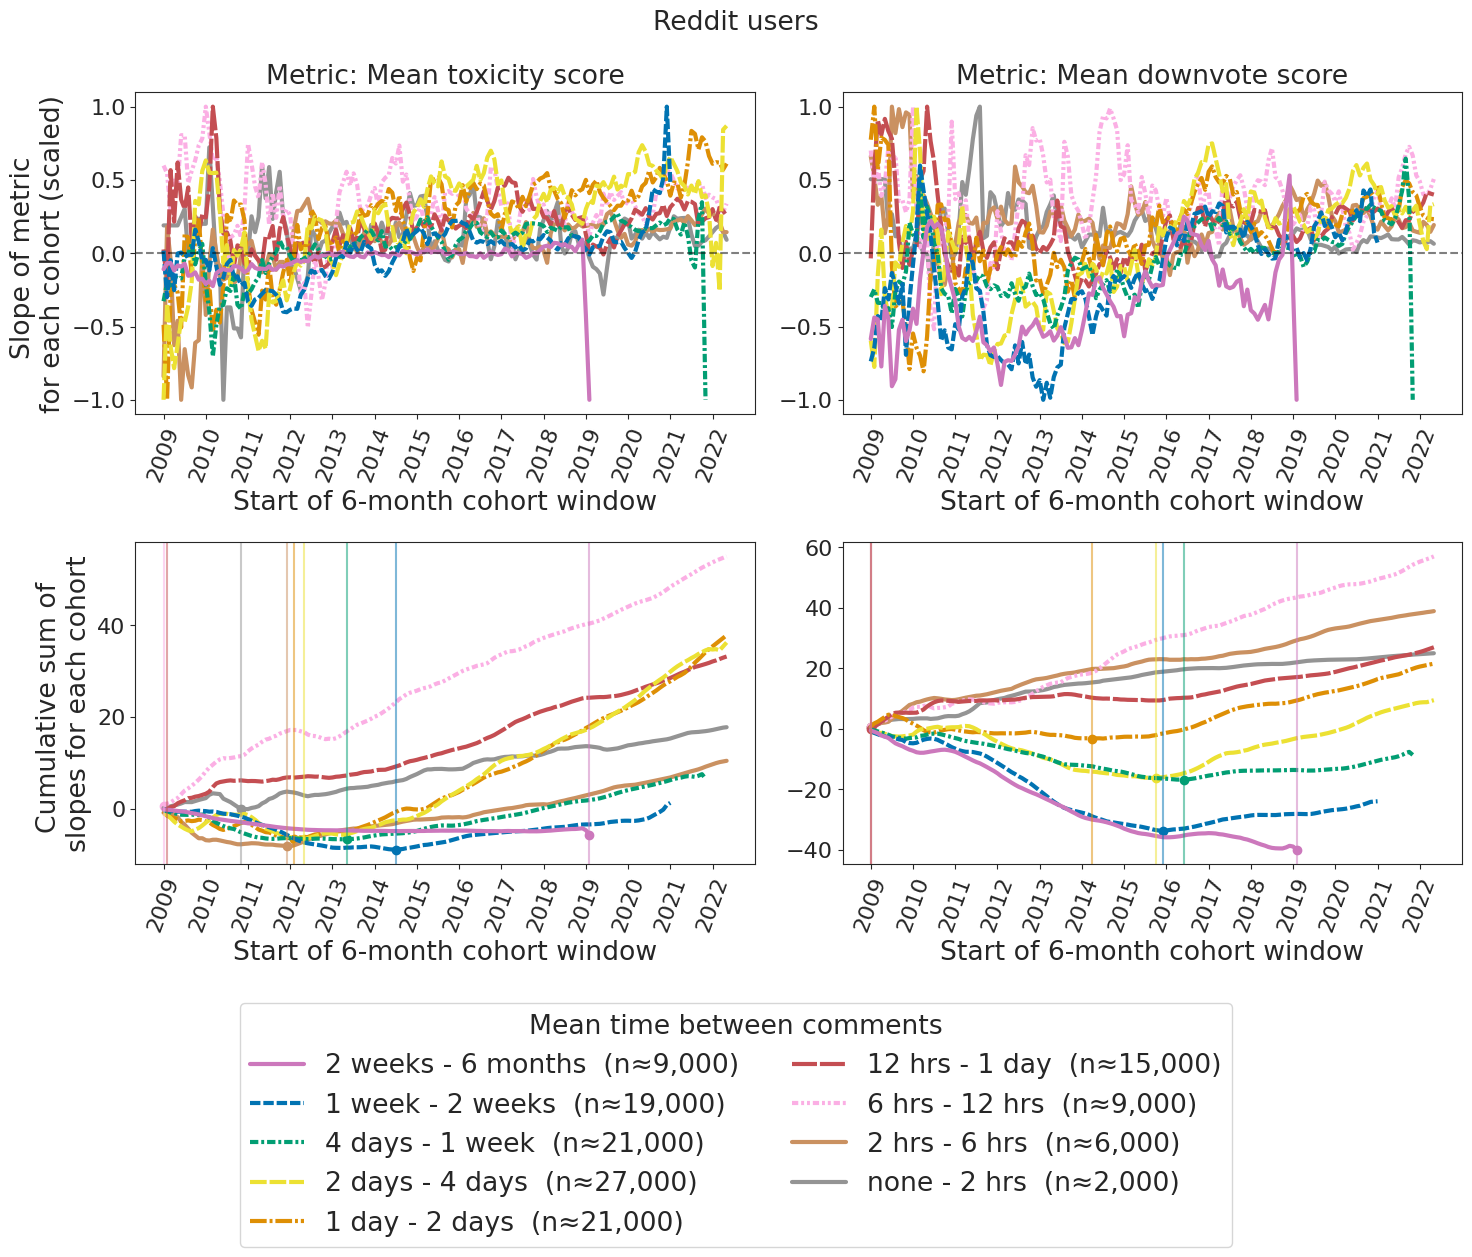
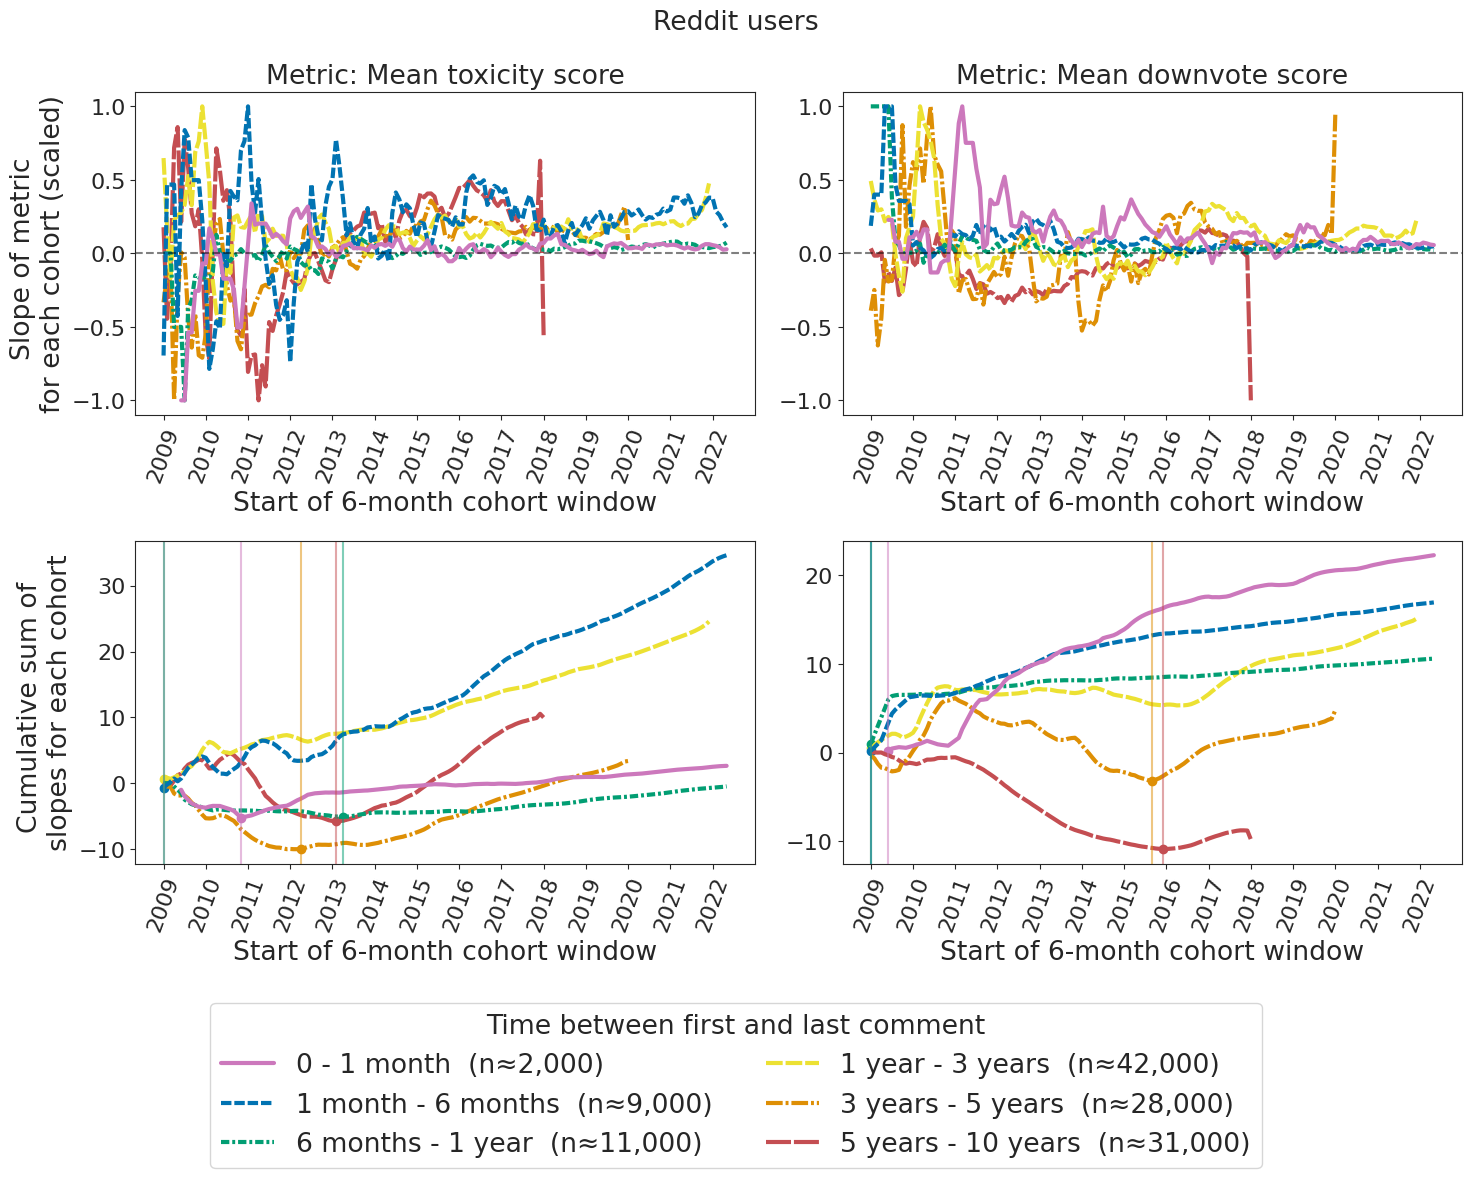
The lower plots show the cumulative sum of the upper plots, in order to more clearly see when lines on the upper plot cross zero; that is, when the metric slopes become more positive than negative. The minimum value for each lifetime activity bucket is marked by a vertical line. This is the point where the slopes can be said to cross zero. Users who begin commenting after this point will tend to become more toxic over their lifetimes, rather than less.
For visibility, the slopes are scaled so that the maximum absolute value is 1 for each lifetime activity bucket.
A more granular view of these trends can be seen in Figure 4, where each point represents the slope of an entire lifetime trend line such as those in Figure 3. Here the trend is even more clear: lifetime toxicity slopes are negative in earlier years, and become positive in later years. When plotting them (upper plots), we see that the lines all cross 0 at around the same point. We can estimate the exact place where each line crosses zero using the cumulative sums (the lower plots); the minimums on these plots show the point where the values on the upper plots switch from being mostly negative to mostly positive.
We can thus see a clear shift from negative to positive lifetime slope in the mid-2010s. For the toxicity score, this occurs around 2013. For the downvote score, the shift happens later, in 2015. (This time estimate is also robust to bootstrapping - see Fig. S14).
The structure is the same as Fig. 2, with 95% confidence intervals and trend lines fitted to bucket means.
Figure 5 sums up what we’ve learned so far. First, before the mid-2010s, users’ comments, on average, become less toxic the longer they’ve been on the site. Users who begin commenting after this point, however, make more toxic comments the longer they’ve been commenting. Second, more prolific users make more toxic comments than lower-activity users, though this effect is less strong when limiting to users from the same time period. Third, more prolific users score higher than others from their very first comment, rather than becoming toxic later in their lifetimes.
Wikipedia: a second set of users
6(b)) is a reproduction of Fig. 2 for ease of comparison.
The structure is the same as Fig. 4. The lower plot shows the cumulative sum of the upper plot, in order to more clearly see when lines on the upper plot cross zero. The minimum value for each lifetime activity bucket is marked by a vertical line. This is the point where the slopes can be said to cross zero. For visibility, the slopes are scaled so that the maximum absolute value is 1 for each lifetime activity bucket.
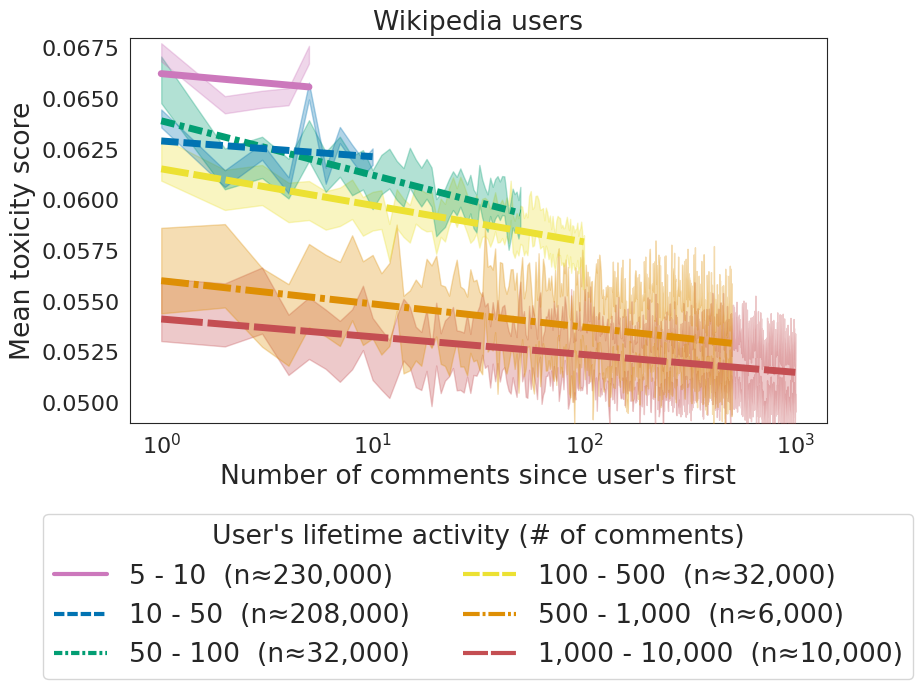
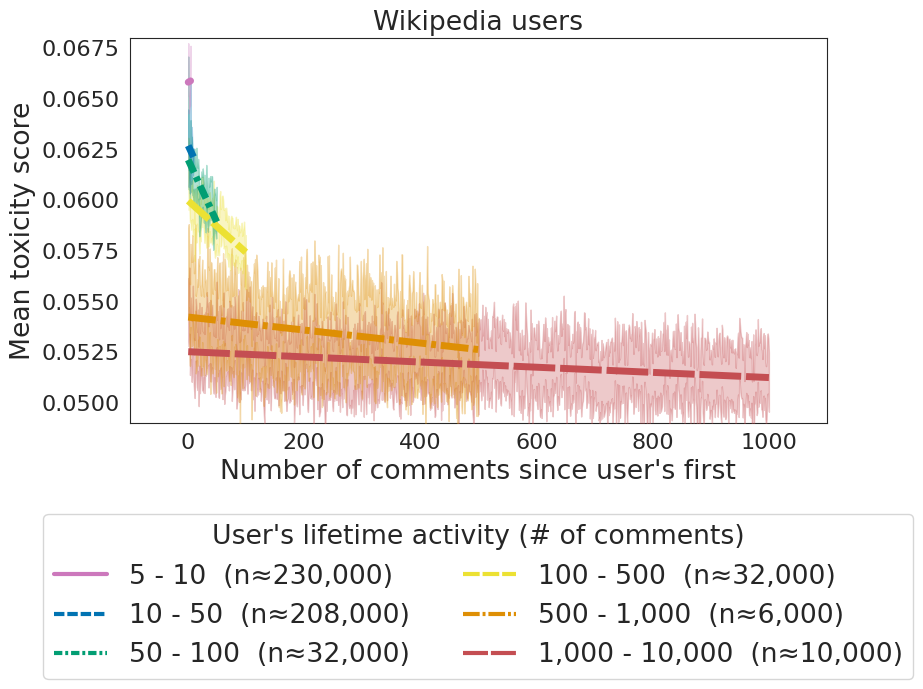
Reddit, like most social media sites, has undergone many changes since its inception. To see if this was simply an artifact of culture change on a particular site, we can apply the same analysis to a second site: Wikipedia. While Wikipedia isn’t primarily a social media site, it has vigorous discussions between editors and is known for strongly enforced cultural norms.[44] As an analogy to Reddit comments, we use edits to Wikipedia “talk pages”, which are pages attached to Wikipedia articles or user accounts for discussion of edits to the relevant page. In Figure 6, we compare lifetime toxicity scores for Wikipedia users and Reddit users. The two are similar in many ways: there’s a clear ordering of users with different lifetime comment counts, and different groups on the same site show similar lifetime trends. But there’s also a striking difference: on Wikipedia, high-activity users are less toxic than less-active ones.
Figure 7 shows that there’s also a similar change from negative to positive slope in 2013. That is, as on Reddit, pre-2013 Wikipedia users became less toxic of their life cycles on the site, but post-2013 they became more toxic over their life cycles. (This is only apparent in the shortest-lived user buckets, but note how much smaller the other buckets are; the difference between bucket sizes is larger than on Reddit, especially when considering bucket sizes in the earlier history of the site, as in Supplementary Section S.G.)
It is interesting to ask how these findings about the contrast in toxicity by activity level — first for Reddit, then for Wikipedia — accord with intuition about social media. Earlier, it may have seemed obvious that the most active users were the most toxic, given social media’s reputation for toxic behavior. When Figure 6(a) shows the opposite, it might seem equally obvious that people with toxic behavior by definition don’t follow norms and can’t last long. But the point is that both of these “obvious” outcomes are observed, in different settings. To quote Duncan Watts in Everything is Obvious, “When every answer and its opposite appears equally obvious, then, as Lazarsfeld put it, ‘something is wrong with the entire argument of “obviousness".’”[45]
The question is thus not which tendency is true of social media in general - whether high- or low-activity users are more toxic - but which, if any, is characteristic of a particular community. Viewed this way, as a comparison across different sites, it accords with some underlying intuition that high-activity Wikipedia users are less toxic than low-activity ones. Indeed, Wikipedia is known for its strongly enforced social norms, and is often favorably compared to other social media giants; Wikipedia has been described as “one of the few remaining places that retains the faintly utopian glow of the early World Wide Web”.[44]
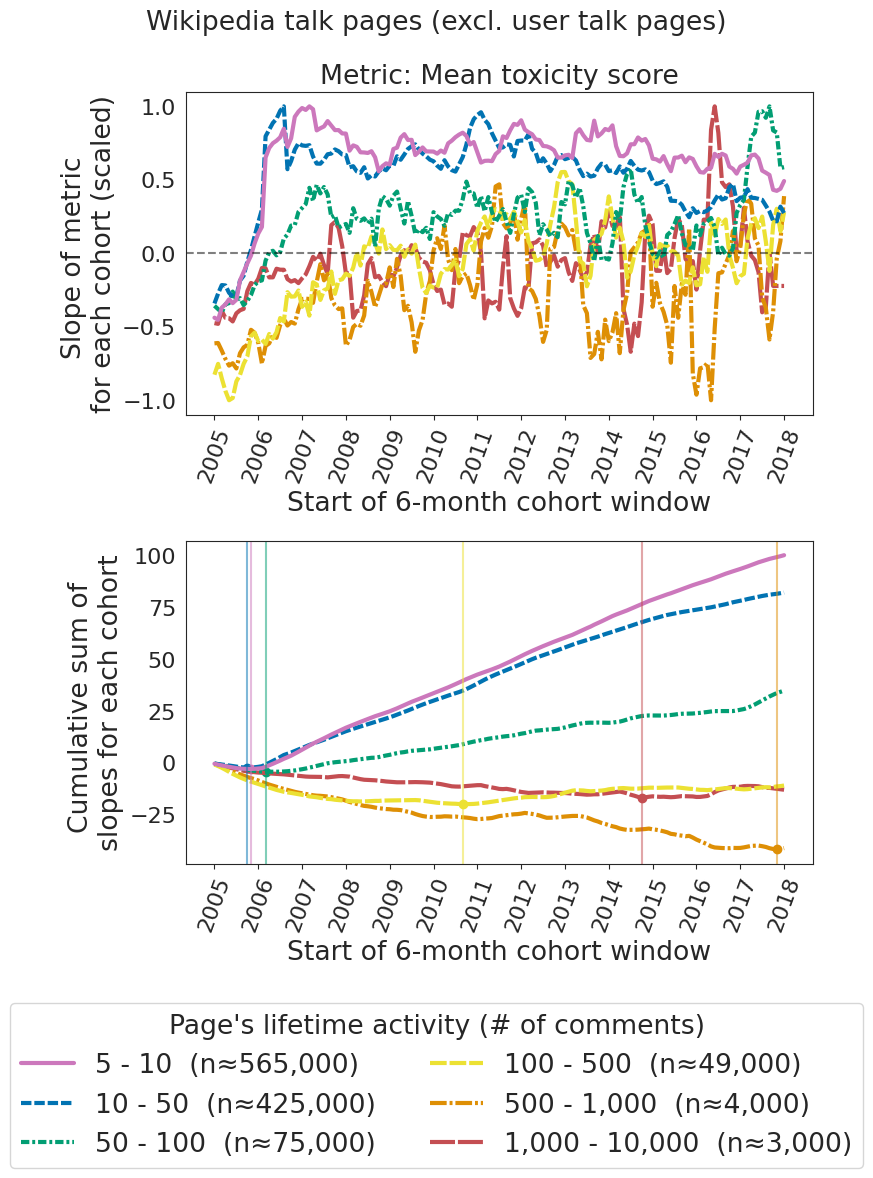
Toxicity involving links and pages: does information behave like people?
We can follow other entities over time, not just users. Discourse around a particular idea can change over time, just as people do. Many pieces of content are commented on many times in the same dataset.
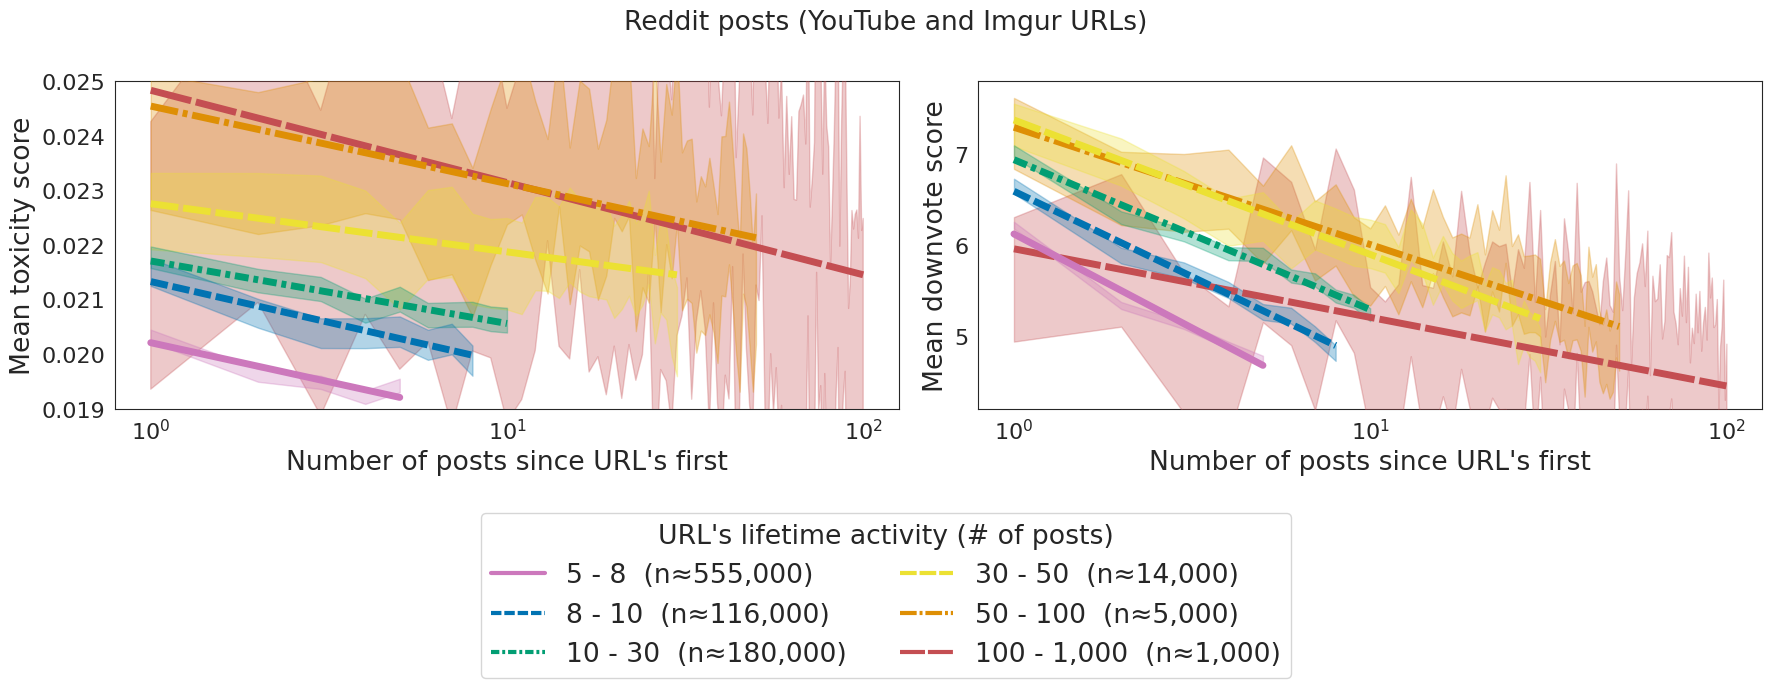
Shaded bands are 95% confidence intervals over the mean post scores for each time a URL was posted, calculated as the mean score for all comments on that post. Trend lines are fit to the means over all URLs in a bucket.
The structure is similar to Fig. 2, except that a URL’s score at each time point is now the mean of all comment scores on a given post, rather than the score of a single comment.
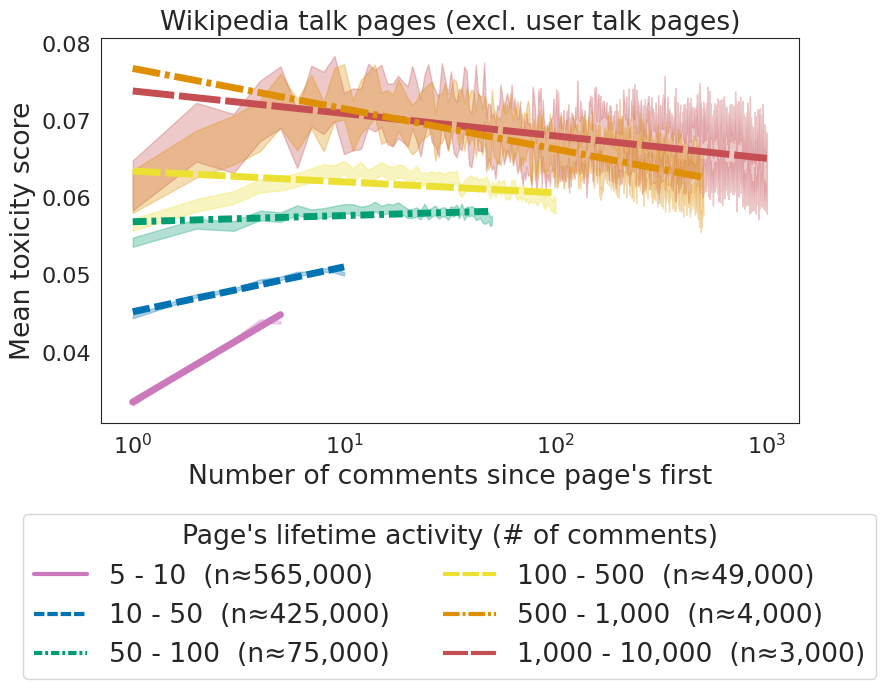
The structure is the same as Fig. 2. Shaded bands are 95% confidence intervals over the score for the nth comment on each talk page. Trend lines are fit to the means over all pages in a bucket.
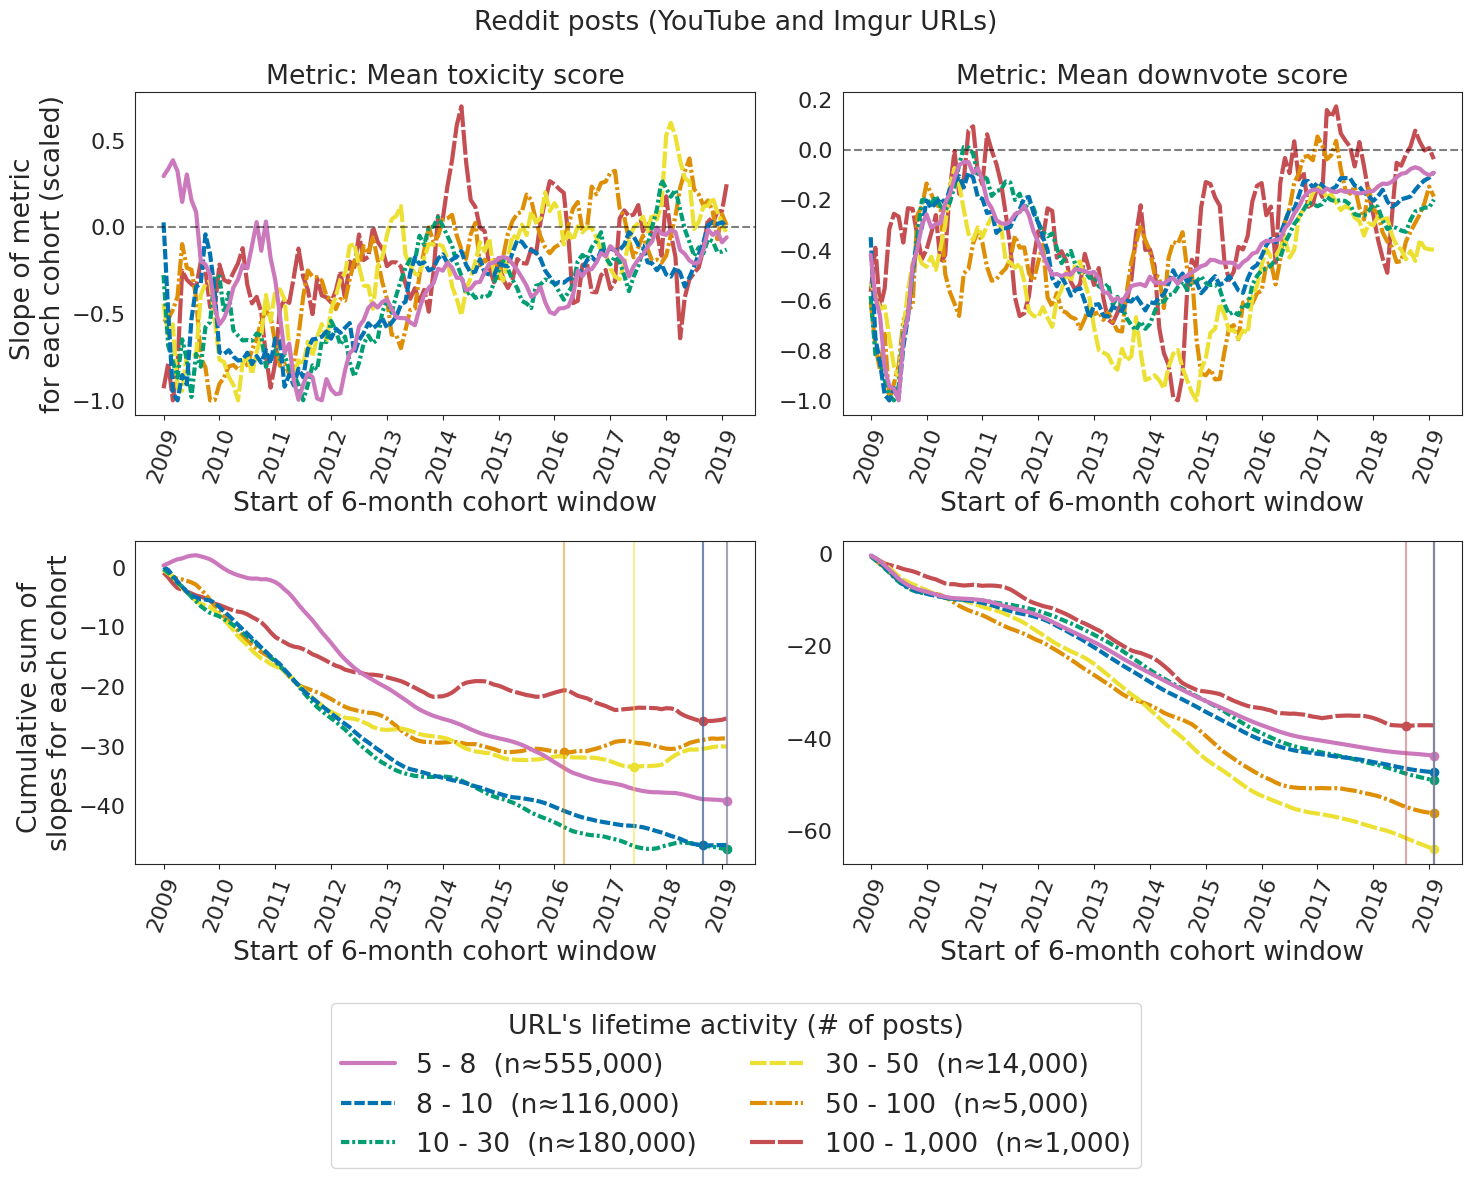
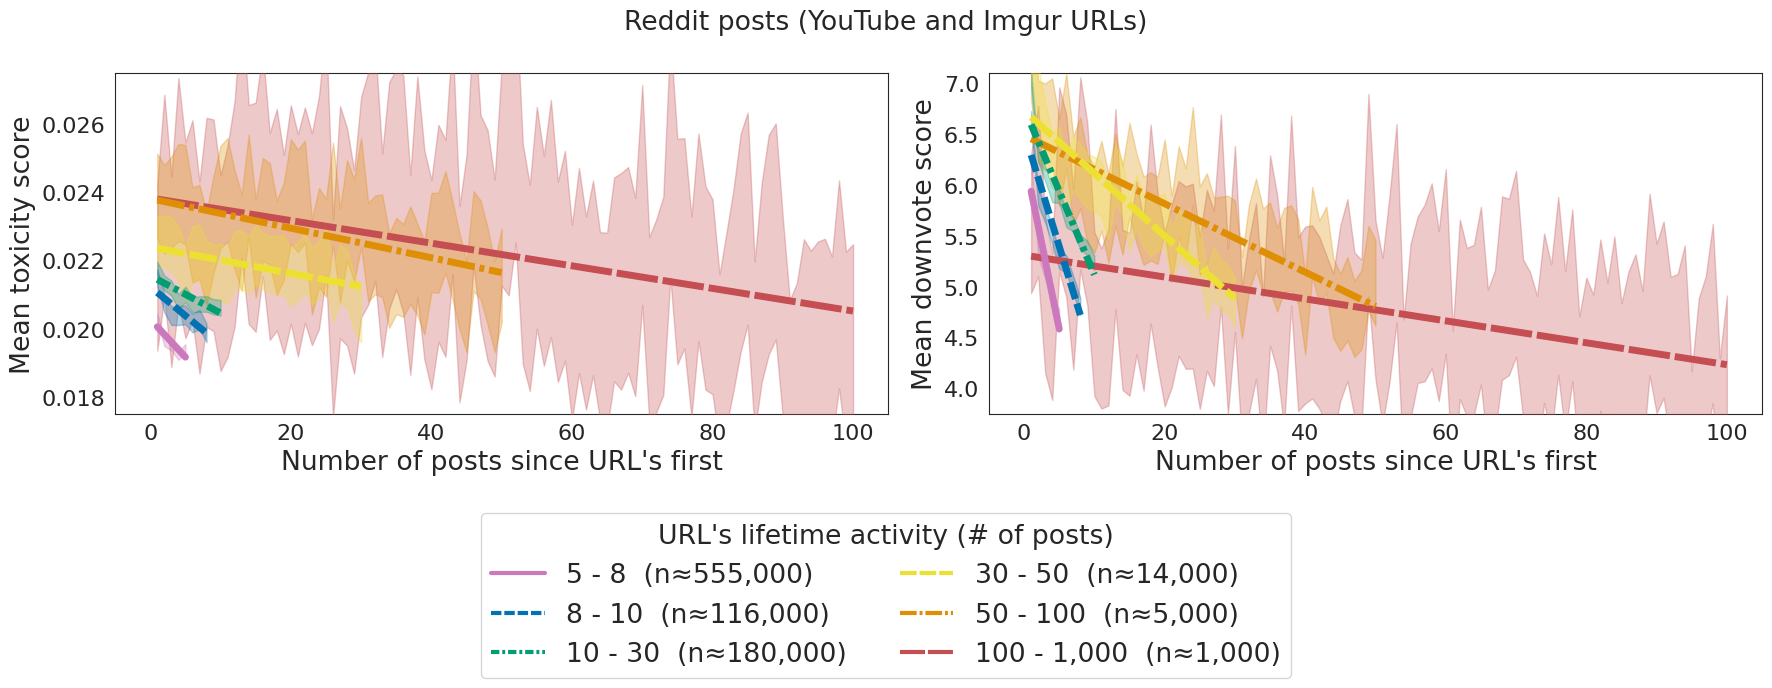
In the case of Reddit, we can follow specific URLs that are posted many times as top-level link posts. We focus on YouTube and Imgur URLs, since each points to to a fixed video or image, and both sites make it easy to detect different URLs that point to the same item. As with users, we order posts of the same URL in chronological order, from the first time the URL was posted to the last. When we apply a score intended to quantify toxicity, the score for each post is the mean score over all comments on the post.
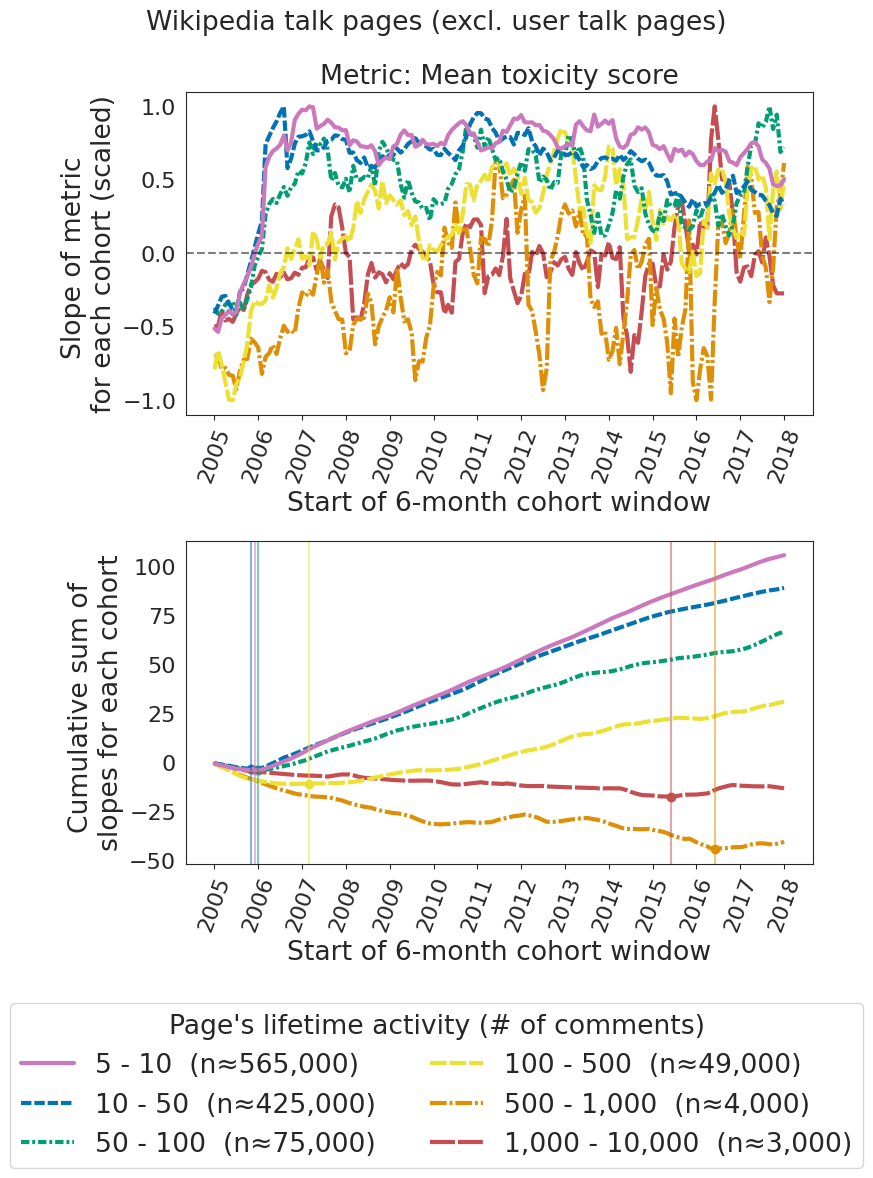
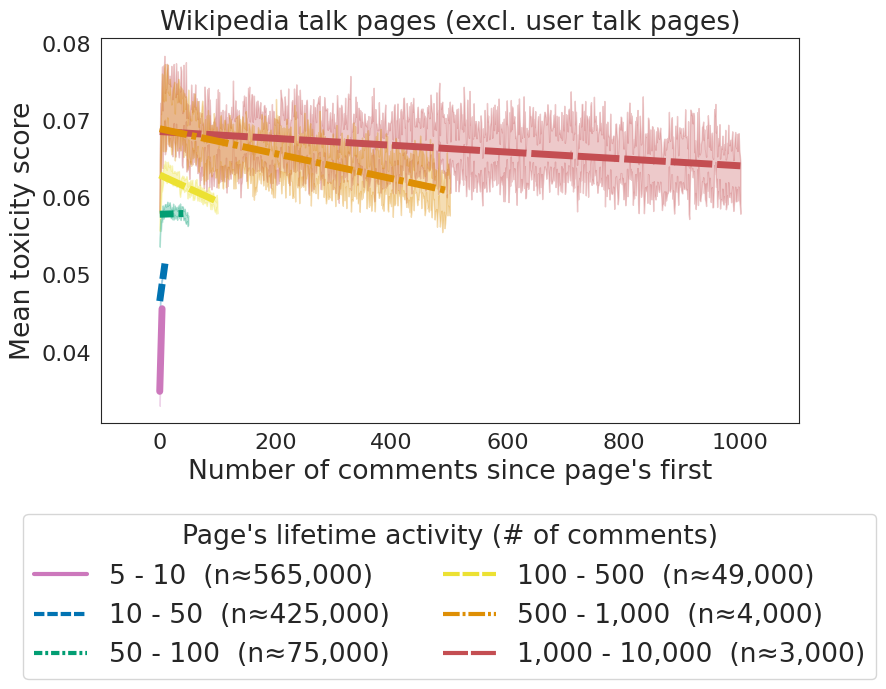
For Wikipedia, we use article “talk pages”: pages attached to each article used for editor discussion. Here a “comment” is an edit to a talk page, and we again arrange comments in chronological order. Using these definitions, Figure 8 and 9 look strikingly similar to Figure 2. As with users, more-active discussions tend to be more toxic, and Figure 8 shows a general downward trend over time. (However, Figure 9 shows less consistent trends).
Interestingly, Wikipedia pages look more similar to Reddit users than Wikipedia users: Wikipedia users are the only set where higher activity corresponds to lower toxicity. Reddit users, Reddit content, and Wikipedia content all follow the opposite pattern. Trajectories are also roughly similar between buckets, at least for Reddit URLs. However, there’s not as much of a clear pattern over time for URLs, unlike for users as in Figures 4 and 7. The corresponding figures for URLs are in the supplement, Figures S12-S13.
Other metrics: Are these patterns universal?
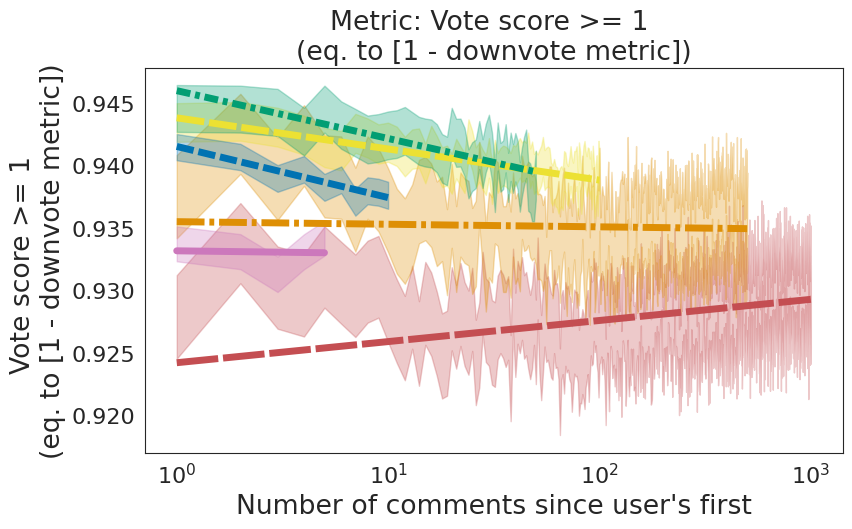
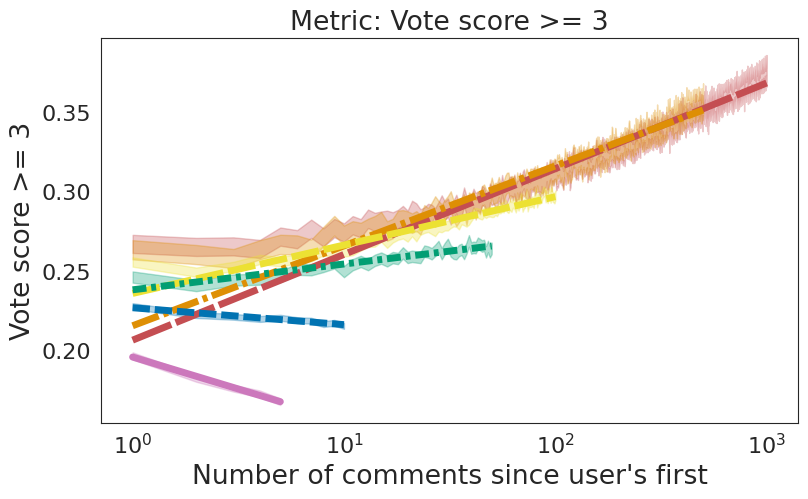
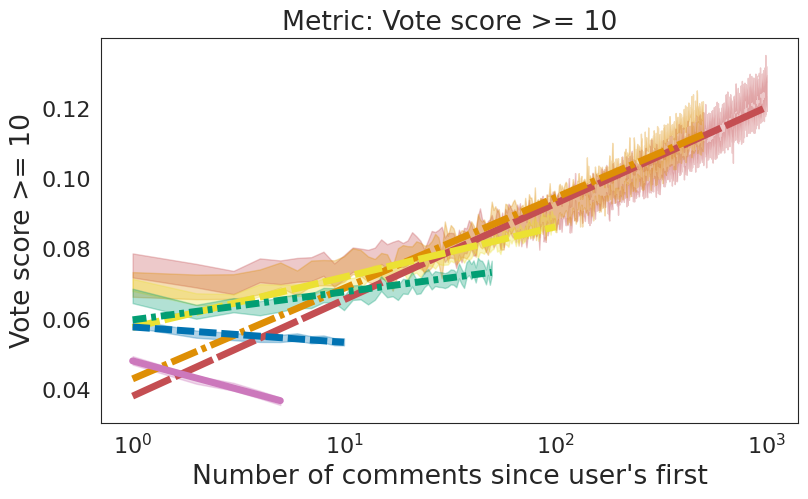
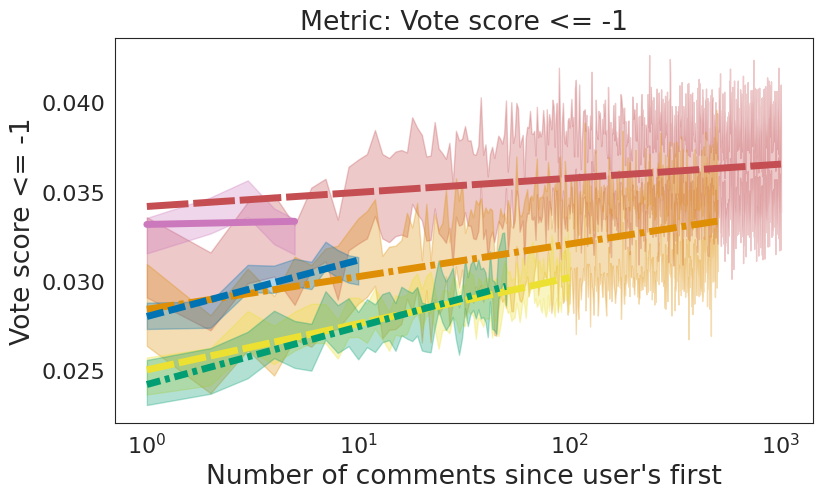
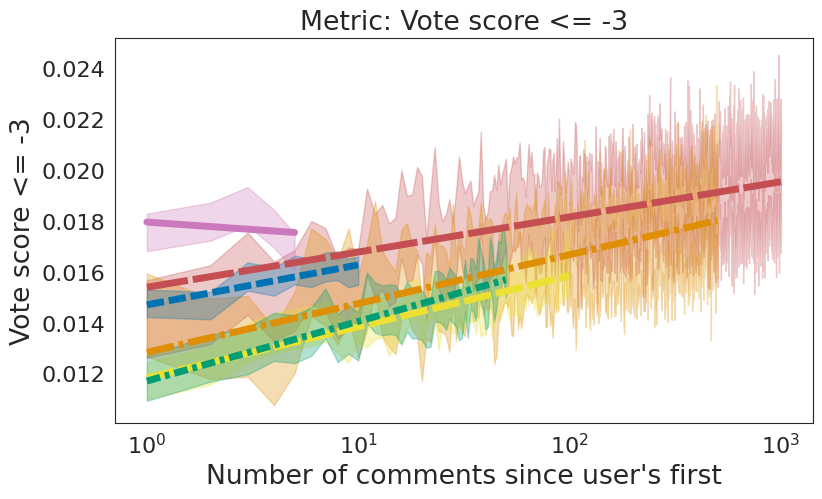
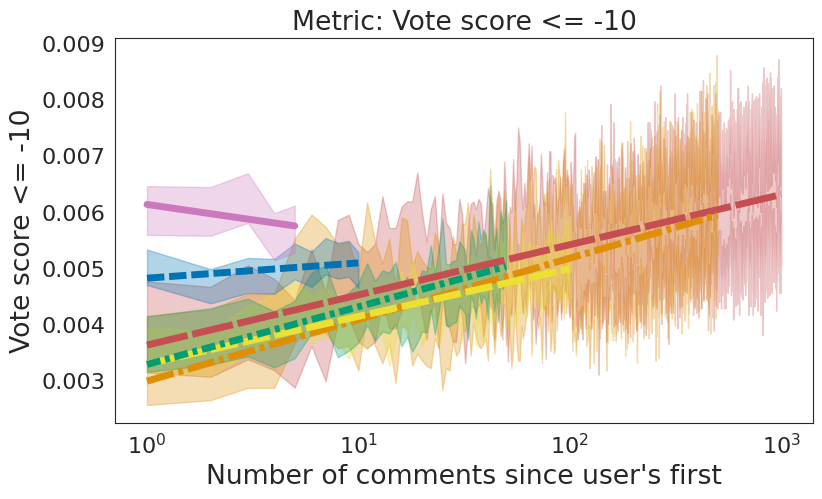
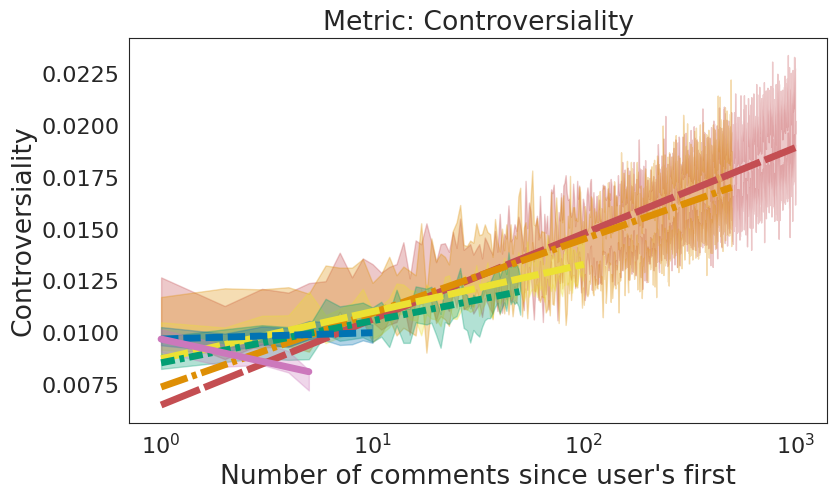
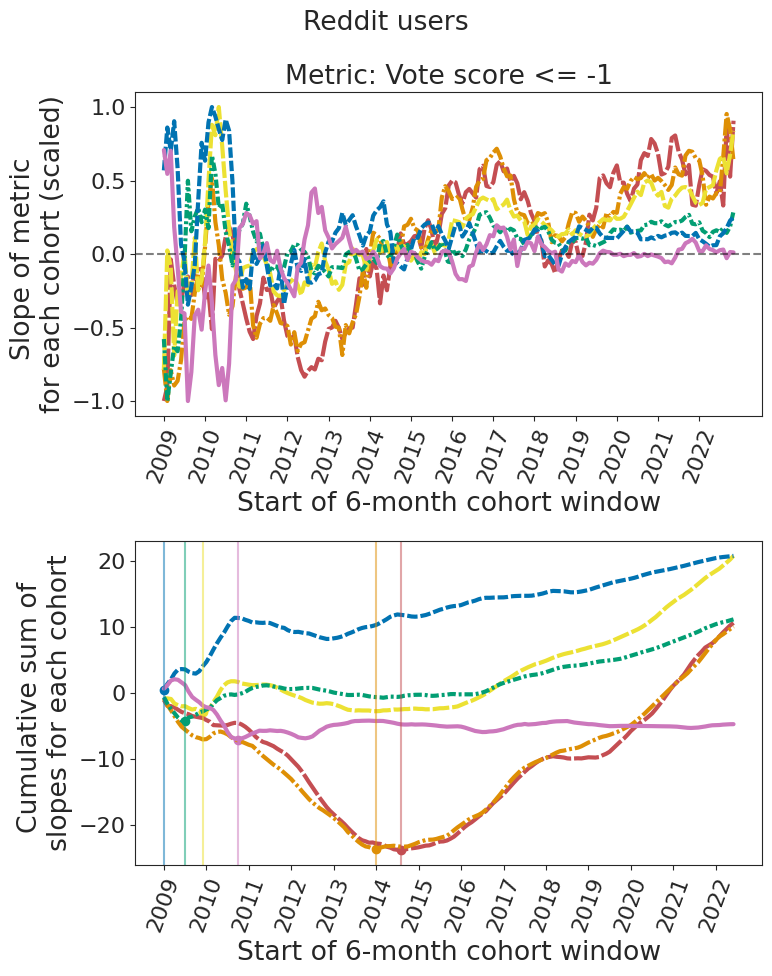
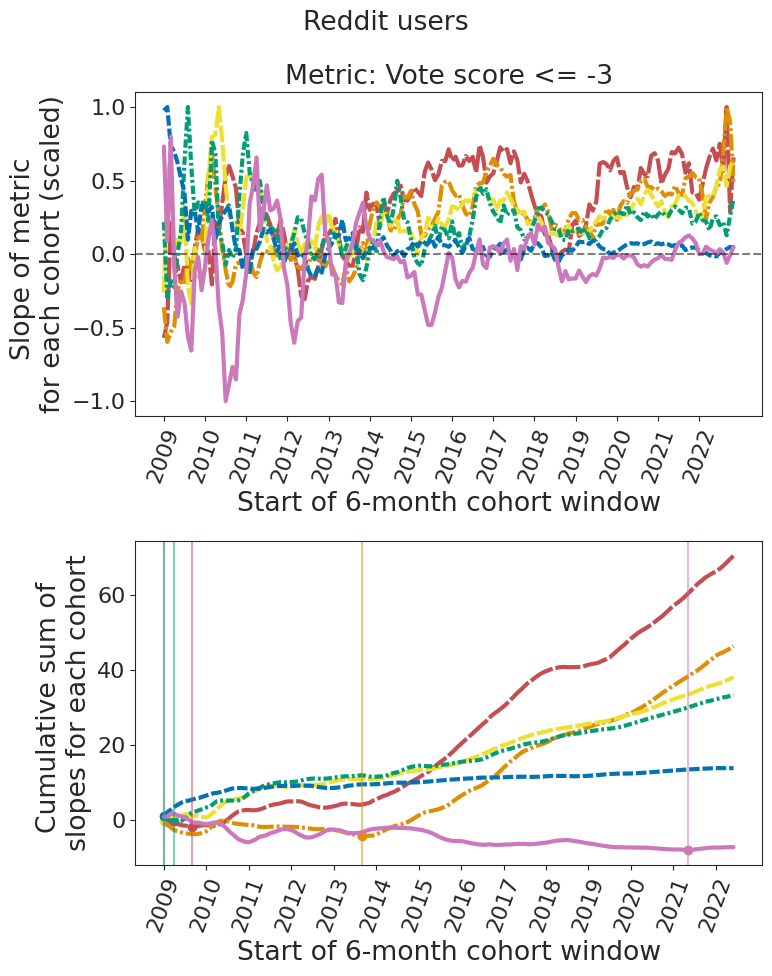
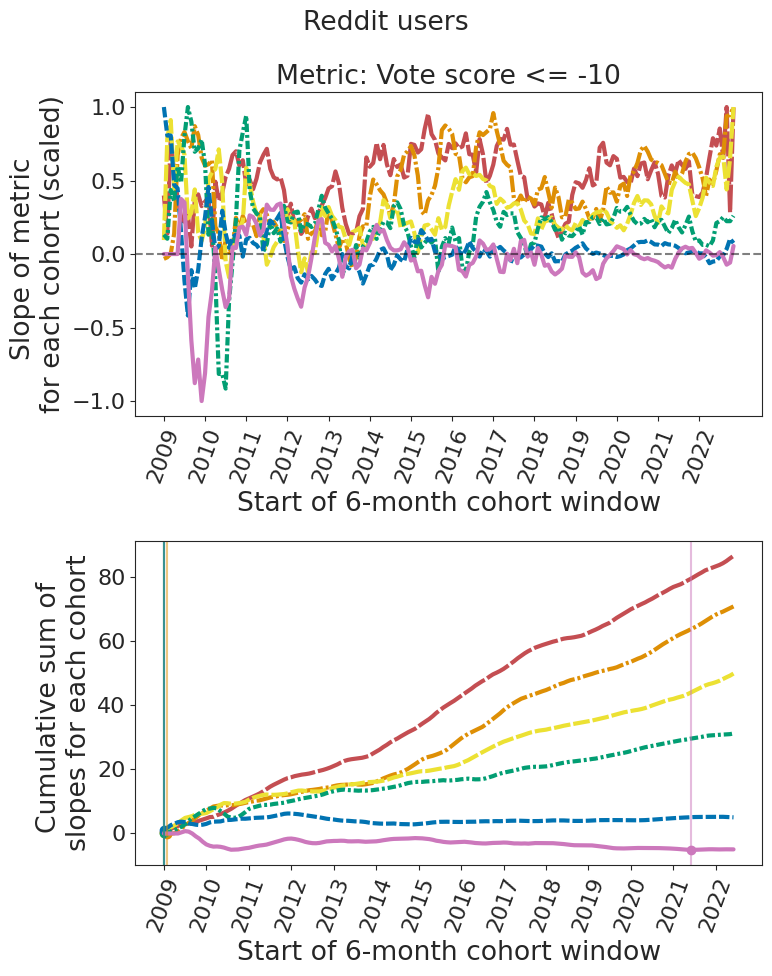
We’ve seen that similar patterns hold across two different metrics and two different datasets. Are these patterns specific to antisocial behavior, or would any metric of user behavior look similar? Are there metrics that don’t show the same patterns? In fact, every other metric we tried does look different from the patterns we’ve observed. In Supplementary Section S.E, we examine two kinds of scores for Reddit users: various binary thresholds on a comment’s upvote score, and “controversiality”, a binary measure defined by Reddit as comments with upvote/downvote ratios close to 0.5.[46] Recall the three main findings: users’ mean toxicity is correlated with their activity level; users change over their lifetimes; and the direction of change reverses in the mid-2010s.
For positive vote thresholds, there’s correlation between mean score and activity level, though the shape of user trajectories is clearly different (Fig S28). Lifetime slopes also don’t change much over time, though it’s interesting to note that lower-activity users have consistently negative trends, and higher-activity users consistently positive trends (Fig S32). For negative vote thresholds, there’s still some correlation between mean score and activity level, except for the least active users (Fig S29). However, different activity levels no longer have similar slopes, and except for the least extreme threshold, slopes don’t change over time (Fig S33). Controversiality, the metric that’s most orthogonal to our toxicity and downvote scores, also looks the most different from the patterns we found. It doesn’t show much of a difference between mean score for different activity levels (Fig S30). Slopes also show little difference between activity buckets and over time, and are generally positive (Fig S34).
Discussion
In summary, we’ve seen that users, on average, show different amounts of antisocial behavior depending on how long they’ve been posting. However, the direction of change depends on when they’re posting: before 2013-2015, users get less toxic over their lifetimes, while after that time, users got more toxic over their lifetimes. Also, users who would go on to post more were different from their very first post. On Reddit, high-activity users are more toxic than lower-activity users, whereas on Wikipedia, higher-activity users were less toxic. When tracking lifetimes of information instead of users, URLs that would go on to draw more discussion (higher-activity information) generally had more toxic discussion from the beginning, similar to the pattern for Reddit users.
Given that our work describes a change happening in 2013-2015, it’s useful to note other works that have observed changes around the mid-2010s. Waller and Anderson[39] find a shift in polarization of Reddit communities in 2016, and Haidt’s new book[47] discusses a “tidal wave” of adolescent mental illness around 2013, which he suggests is due to the rise of smartphones.[48] Connections between these and other potential factors may be an interesting avenue for future research.
Using the methodology in this paper, we have surfaced several related patterns in social media data: that users stratify by activity with respect to toxicity level, that this toxicity level changes over user lifetimes, and that these trends have not been stable over the history of the platform. This methodology may also be useful to form the basis for other investigations of how social media can affect user behavior.
Methods
Metric: Perspective API “toxicity” score
We used the Perspective API[43] “SEVERE_TOXICITY” score as our toxicity metric. The API defines “SEVERE_TOXICITY” as “A very hateful, aggressive, disrespectful comment or otherwise very likely to make a user leave a discussion or give up on sharing their perspective”,[20] and uses machine learning to assign text a score between 0 and 1 based on how well it fits that definition. Scores were generated for the text of each comment in the dataset, or in the case of Wikipedia, for the text of each talk page edit. The Perspective model is regularly updated, so scores for the same piece of text will change over time. Scores for the Reddit data were generated between August 2023 and February 2024. Scores for the Wikipedia data were included with the Wikiconv dataset,[49] and generated sometime before 2018.
Metric: Downvote score
Reddit’s content ranking depends on user voting, where any user can “upvote” or “downvote” a post or comment. Reddit asks users to vote based on whether a comment “contributes to conversation”, and is on-topic to the community it’s posted in.[26] To prevent manipulation, Reddit only publishes the total score (upvotes minus downvotes), and some “fuzzing” is applied. By “downvote score”, we mean the percentage of comments that are downvoted in a given set of comments. The downvote score is a binary value for each Reddit comment: a comment is considered “downvoted” if it got more downvotes than upvotes, meaning its vote score is 0 or lower (since all comments start with a vote score of 1.) Vote score thresholds of -1, -2, -3, -5, and -10 were qualitatively similar; see Supplementary Section S.E. (Positive thresholds, however, were different.)
Dataset: Reddit user sample
Reddit data was obtained from the Pushshift archive of all comment and posts on Reddit.[50] The Reddit user sample consists of all comments made by a sample of 1 million user accounts between January 2005 and December 2022. This represents roughly 1% of the 98.6 million users who commented on Reddit during that period. Users were randomly sampled from all users who had made at least one, but less than 50,000, comments.
The 50,000-comment threshold was chosen to avoid bots and other unusual accounts after a rough analysis of high-volume users: 27% of accounts with > 100,000 comments have “bot” in their name, while only 0.25% of accounts with < 10,000 comments do. In our sample, only 1,200 users (0.12%) have more than 10,000 comments. Of those, seven have “bot” in the name, and on inspection six of those seven are actually bots.
Initial analysis of the dataset showed that data from 2005-2009 was noisy, due to the sparseness of data from when the Reddit user base was very small. We removed all users who had begun commenting before 2009, roughly 1,500 users (0.15%).
After filtering, our dataset had 123 million comments.
Dataset: Wikipedia talk page edits
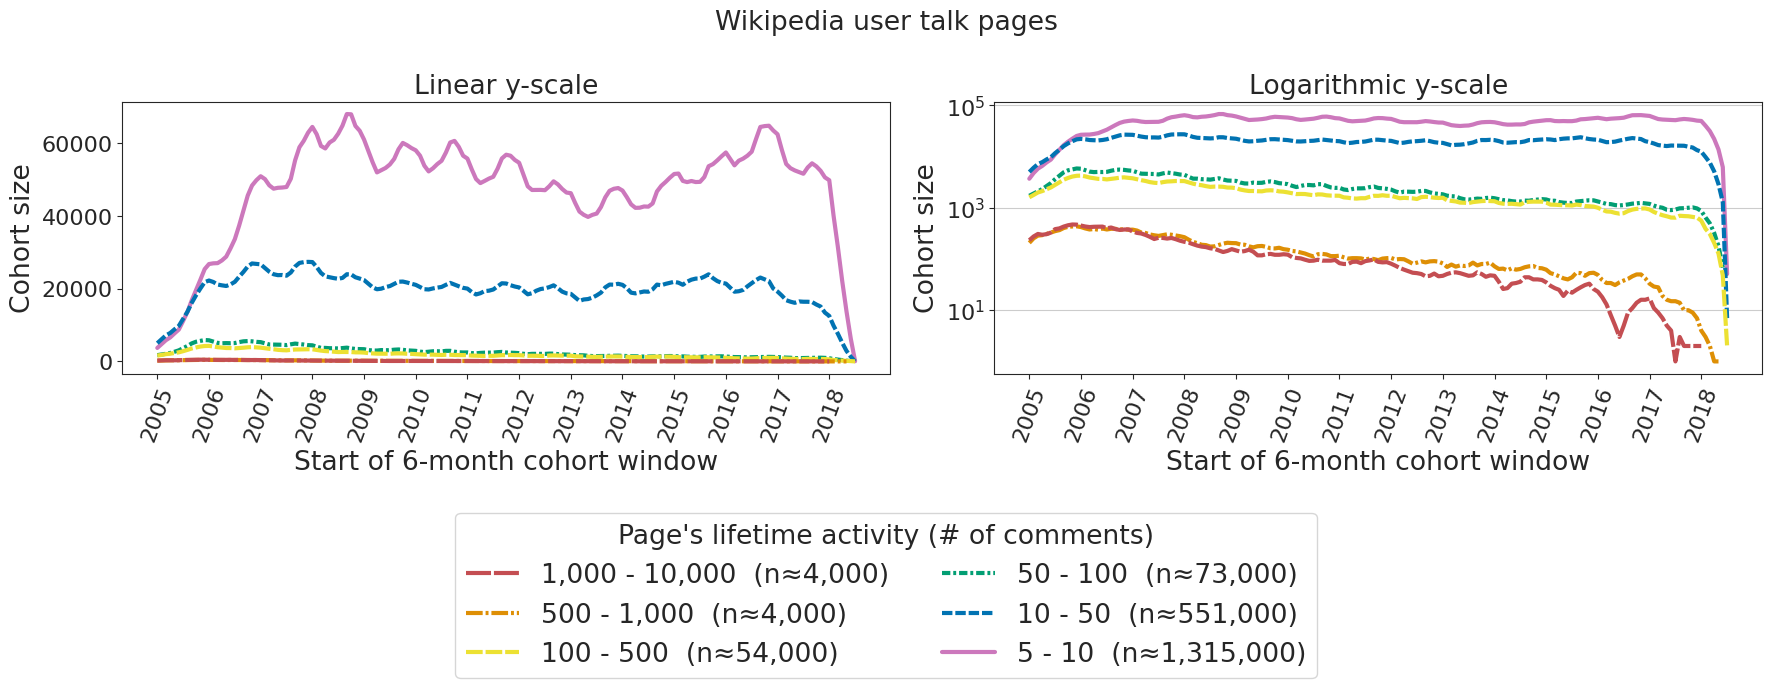
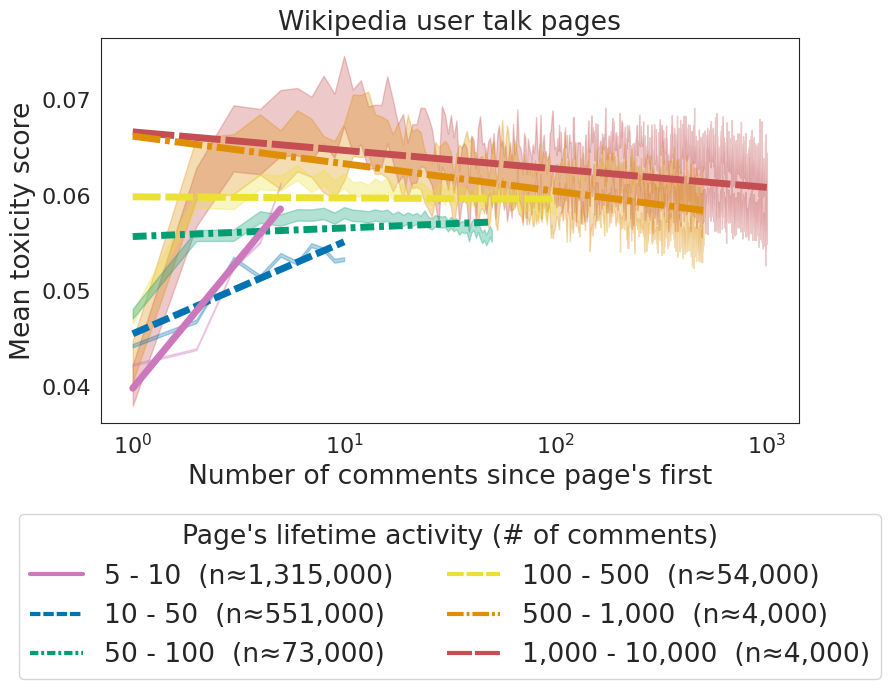
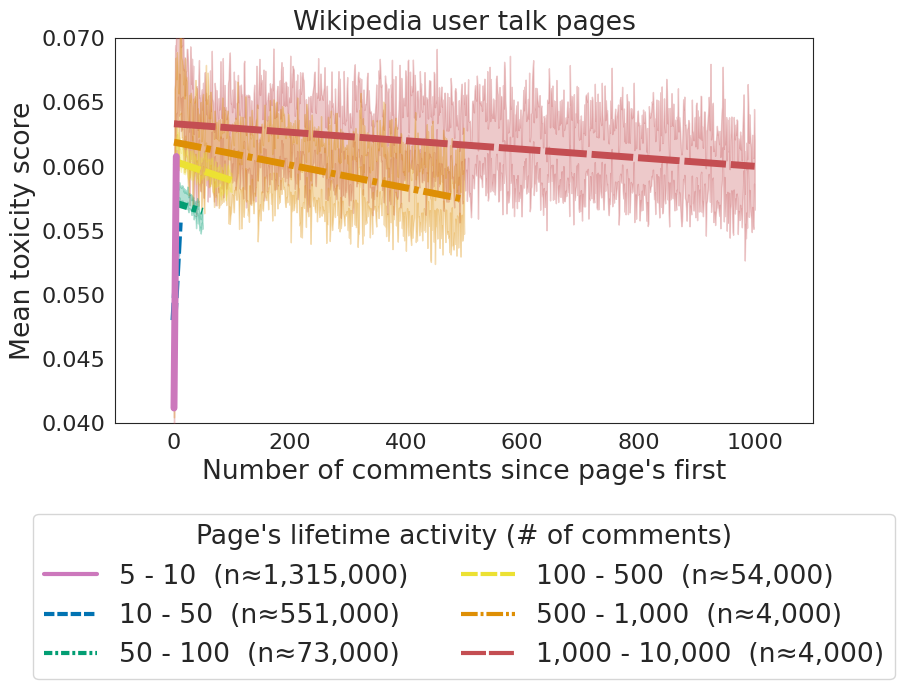
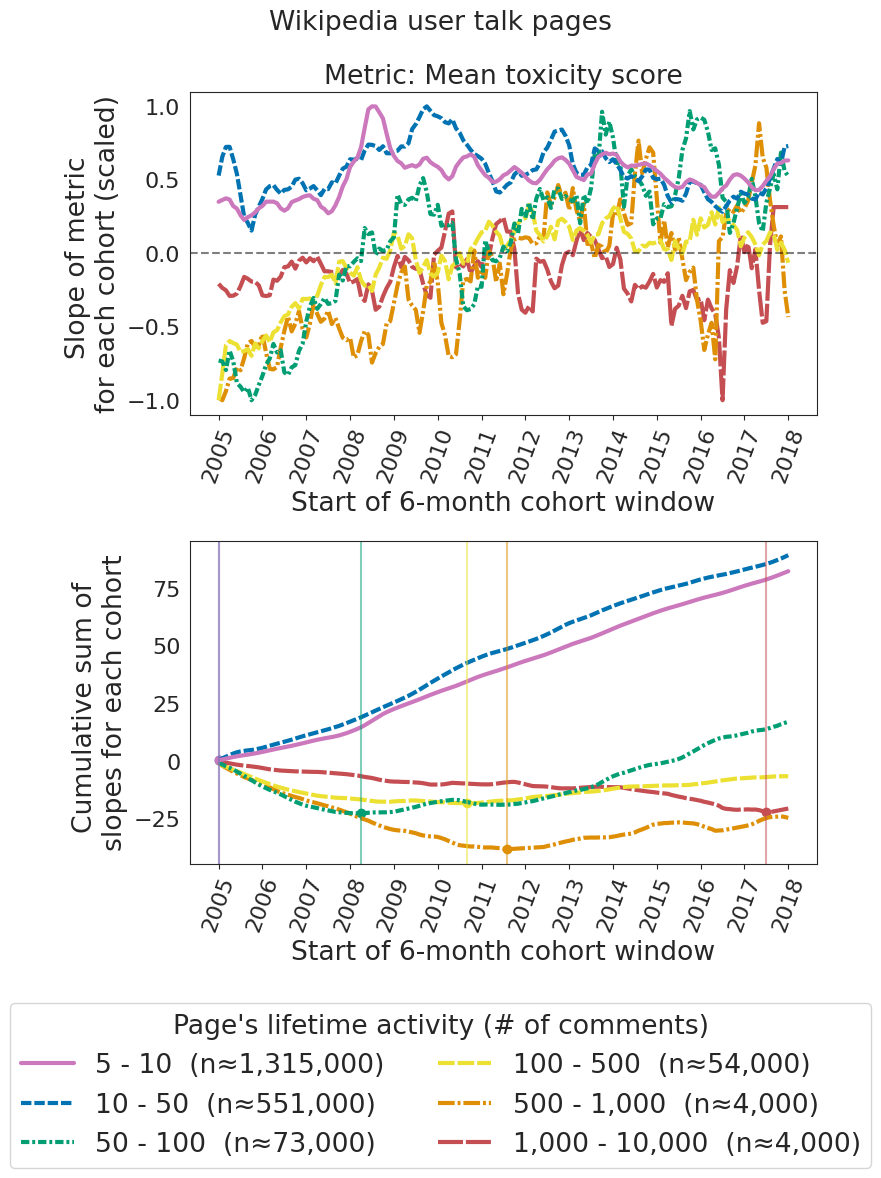
Wikipedia analysis used the Wikiconv dataset[49] of all Wikipedia talk page edits. Bot accounts were roughly filtered out by removing any account with a name ending with “bot” (case-insensitive), as Wikipedia policy recommends for bot accounts.[51] Accounts containing “MediaWiki” in the name were also removed. After filtering, the dataset had 122 million edits from 2.8 million authors. When analyzing by pages, we ignore edits to user talk pages, which generally contain interpersonal conversations rather than discussion of a specific topic. User talk pages comprise of edits in the dataset; versions of Figures 2 and 4 for user talk pages can be found in Supplementary Section S.A.2.
Dataset: Reddit post URLs
Reddit posts can either be text, images, videos, or URLs. To compare conversations about the same topic over time, we chose a subset of URL posts: YouTube and Imgur links. This choice was made since these URLs are easily canonicalized, meaning that links that point to the same page can be identified. Canonicalization means we can be more confident that we’ve collected all discussions of the same URL into one group. The post dataset consists of all posts of YouTube and Imgur URLs that were posted at least 5 times; only posts with at least one comment were counted. The dataset has 104 million comments on 11 million posts. For each post, an average score for each metric was calculated using all comments on that post.
| Dataset | Comments | Authors | Pages / Posts | Date tox scores collected |
|---|---|---|---|---|
| Reddit users | 123,564,988 | 998,472 | - | Aug - Oct 2023 |
| Reddit URLs | 239,797,094 | - | 10,973,235 | Jan - Feb 2024 |
| Wikipedia users and pages | 122,890,496 | 2,881,627 | 21,801,067 | 2018 |
Author contributions statement
K.B. and J.K. conceived the experiment(s), K.B. analyzed the data. All authors reviewed the manuscript.
Additional information
Competing interests The authors declare no competing interests.
Data availability All data used is publicly available.
References
- [1] Castaño-Pulgarín, S. A., Suárez-Betancur, N., Vega, L. M. T. & López, H. M. H. Internet, social media and online hate speech. Systematic review. \JournalTitleAggression and Violent Behavior 58, 101608, DOI: 10.1016/j.avb.2021.101608 (2021).
- [2] Gagliardone, I., Gal, D., Alves, T. & Martinez, G. Countering Online Hate Speech (UNESCO Publishing, 2015).
- [3] Tucker, J. A. et al. Social Media, Political Polarization, and Political Disinformation: A Review of the Scientific Literature, DOI: 10.2139/ssrn.3144139 (2018).
- [4] Haidt, J. Yes, Social Media Really Is Undermining Democracy. \JournalTitleThe Atlantic (2022).
- [5] Wike, R. et al. Social Media Seen as Mostly Good for Democracy Across Many Nations, But U.S. is a Major Outlier. Tech. Rep., Pew Research Center (2022).
- [6] González-Bailón, S. & Lelkes, Y. Do social media undermine social cohesion? A critical review. \JournalTitleSocial Issues and Policy Review 17, 155–180, DOI: 10.1111/sipr.12091 (2023).
- [7] Gallacher, J. D., Heerdink, M. W. & Hewstone, M. Online Engagement Between Opposing Political Protest Groups via Social Media is Linked to Physical Violence of Offline Encounters. \JournalTitleSocial Media + Society 7, 2056305120984445, DOI: 10.1177/2056305120984445 (2021).
- [8] Bhavnani, R., Findley, M. G. & Kuklinski, J. H. Rumor Dynamics in Ethnic Violence. \JournalTitleThe Journal of Politics 71, 876–892, DOI: 10.1017/S002238160909077X (2009).
- [9] Eternal September lives on. \JournalTitleThe Economist (2012).
- [10] Kiene, C., Monroy-Hernández, A. & Hill, B. M. Surviving an "Eternal September": How an Online Community Managed a Surge of Newcomers. In Proceedings of the 2016 CHI Conference on Human Factors in Computing Systems, CHI ’16, 1152–1156, DOI: 10.1145/2858036.2858356 (Association for Computing Machinery, New York, NY, USA, 2016).
- [11] Danescu-Niculescu-Mizil, C., West, R., Jurafsky, D., Leskovec, J. & Potts, C. No country for old members: User lifecycle and linguistic change in online communities. In Proceedings of the 22nd International Conference on World Wide Web, WWW ’13, 307–318, DOI: 10.1145/2488388.2488416 (Association for Computing Machinery, New York, NY, USA, 2013).
- [12] Cheng, J., Danescu-Niculescu-Mizil, C. & Leskovec, J. How Community Feedback Shapes User Behavior. \JournalTitleProceedings of the International AAAI Conference on Web and Social Media 8, 41–50, DOI: 10.1609/icwsm.v8i1.14518 (2014).
- [13] Gillespie, T. Content moderation, AI, and the question of scale. \JournalTitleBig Data & Society 7, 2053951720943234, DOI: 10.1177/2053951720943234 (2020).
- [14] Arouh, M. Toxic Fans: Distinctions and Ambivalence. \JournalTitleEx-centric Narratives: Journal of Anglophone Literature, Culture and Media 67–82, DOI: 10.26262/exna.v0i4.7917 (2020).
- [15] Matias, J. N. Can We Explain Online Toxicity When We Don’t Know What it Is? https://web.archive.org/web/20240325203339/https://natematias.medium.com/can-we-explain-online-toxicity-when-we-dont-know-what-it-is-441911d64eb0 (2024).
- [16] Lees, A. et al. A New Generation of Perspective API: Efficient Multilingual Character-level Transformers, DOI: 10.48550/arXiv.2202.11176 (2022). 2202.11176.
- [17] Wulczyn, E., Thain, N. & Dixon, L. Ex Machina: Personal Attacks Seen at Scale. In Proceedings of the 26th International Conference on World Wide Web, WWW ’17, 1391–1399, DOI: 10.1145/3038912.3052591 (International World Wide Web Conferences Steering Committee, Republic and Canton of Geneva, CHE, 2017).
- [18] Rieder, B. & Skop, Y. The fabrics of machine moderation: Studying the technical, normative, and organizational structure of Perspective API. \JournalTitleBig Data & Society 8, 20539517211046181, DOI: 10.1177/20539517211046181 (2021).
- [19] Toxicity. https://jigsaw.google.com/the-current/toxicity/.
- [20] Google Jigsaw. About the API - Attributes and Languages. https://developers.perspectiveapi.com/s/about-the-api-attributes-and-languages.
- [21] Sheth, A., Shalin, V. L. & Kursuncu, U. Defining and detecting toxicity on social media: Context and knowledge are key. \JournalTitleNeurocomputing 490, 312–318, DOI: 10.1016/j.neucom.2021.11.095 (2022).
- [22] Arora, A. et al. Detecting Harmful Content on Online Platforms: What Platforms Need vs. Where Research Efforts Go. \JournalTitleACM Computing Surveys 56, 72:1–72:17, DOI: 10.1145/3603399 (2023).
- [23] Fortuna, P., Soler, J. & Wanner, L. Toxic, Hateful, Offensive or Abusive? What Are We Really Classifying? An Empirical Analysis of Hate Speech Datasets. In Calzolari, N. et al. (eds.) Proceedings of the Twelfth Language Resources and Evaluation Conference, 6786–6794 (European Language Resources Association, Marseille, France, 2020).
- [24] Lee, D. Alphabet-made Chrome extension is designed to tune out toxic comments. \JournalTitleThe Verge (2019).
- [25] Guo, Z. et al. Evaluating Large Language Models: A Comprehensive Survey, DOI: 10.48550/arXiv.2310.19736 (2023). 2310.19736.
- [26] Reddiquette – Reddit Help. https://support.reddithelp.com/hc/en-us/articles/205926439-Reddiquette.
- [27] Xia, Y., Zhu, H., Lu, T., Zhang, P. & Gu, N. Exploring Antecedents and Consequences of Toxicity in Online Discussions: A Case Study on Reddit. \JournalTitleProceedings of the ACM on Human-Computer Interaction 4, 108:1–108:23, DOI: 10.1145/3415179 (2020).
- [28] Cambo, S. A. & Gergle, D. Model Positionality and Computational Reflexivity: Promoting Reflexivity in Data Science. In Proceedings of the 2022 CHI Conference on Human Factors in Computing Systems, CHI ’22, 1–19, DOI: 10.1145/3491102.3501998 (Association for Computing Machinery, New York, NY, USA, 2022).
- [29] Mamakos, M. & Finkel, E. J. The social media discourse of engaged partisans is toxic even when politics are irrelevant. \JournalTitlePNAS Nexus 2, pgad325, DOI: 10.1093/pnasnexus/pgad325 (2023).
- [30] Avalle, M. et al. Persistent interaction patterns across social media platforms and over time. \JournalTitleNature 628, 582–589, DOI: 10.1038/s41586-024-07229-y (2024).
- [31] Cheng, J., Danescu-Niculescu-Mizil, C. & Leskovec, J. Antisocial Behavior in Online Discussion Communities. \JournalTitleProceedings of the International AAAI Conference on Web and Social Media 9, 61–70, DOI: 10.1609/icwsm.v9i1.14583 (2015).
- [32] Coe, K., Kenski, K. & Rains, S. A. Online and Uncivil? Patterns and Determinants of Incivility in Newspaper Website Comments. \JournalTitleJournal of Communication 64, 658–679, DOI: 10.1111/jcom.12104 (2014).
- [33] Papacharissi, Z. Democracy online: Civility, politeness, and the democratic potential of online political discussion groups. \JournalTitleNew Media & Society 6, 259–283, DOI: 10.1177/1461444804041444 (2004).
- [34] Almerekhi, H., Kwak, H. & Jansen, B. J. Investigating toxicity changes of cross-community redditors from 2 billion posts and comments. \JournalTitlePeerJ Computer Science 8, e1059, DOI: 10.7717/peerj-cs.1059 (2022).
- [35] Cinelli, M. et al. Dynamics of online hate and misinformation. \JournalTitleScientific Reports 11, 22083, DOI: 10.1038/s41598-021-01487-w (2021).
- [36] Saveski, M., Roy, B. & Roy, D. The Structure of Toxic Conversations on Twitter. In Proceedings of the Web Conference 2021, WWW ’21, 1086–1097, DOI: 10.1145/3442381.3449861 (Association for Computing Machinery, New York, NY, USA, 2021).
- [37] Young Reusser, A. I., Veit, K. M., Gassin, E. A. & Case, J. P. Responding to Online Toxicity: Which Strategies Make Others Feel Freer to Contribute, Believe That Toxicity Will Decrease, and Believe That Justice Has Been Restored? \JournalTitleCollabra: Psychology 10, 92328, DOI: 10.1525/collabra.92328 (2024).
- [38] Fariello, G., Jemielniak, D. & Sulkowski, A. Does Godwin’s law (rule of Nazi analogies) apply in observable reality? An empirical study of selected words in 199 million Reddit posts. \JournalTitleNew Media & Society DOI: 10.1177/14614448211062070 (2021).
- [39] Waller, I. & Anderson, A. Quantifying social organization and political polarization in online platforms. \JournalTitleNature 600, 264–268, DOI: 10.1038/s41586-021-04167-x (2021).
- [40] Lupu, Y. et al. Offline events and online hate. \JournalTitlePLOS ONE 18, e0278511, DOI: 10.1371/journal.pone.0278511 (2023).
- [41] Chandrasekharan, E., Jhaver, S., Bruckman, A. & Gilbert, E. Quarantined! Examining the Effects of a Community-Wide Moderation Intervention on Reddit. \JournalTitleACM Transactions on Computer-Human Interaction 29, 29:1–29:26, DOI: 10.1145/3490499 (2022).
- [42] Johnson, N. F. et al. Hidden resilience and adaptive dynamics of the global online hate ecology. \JournalTitleNature 573, 261–265, DOI: 10.1038/s41586-019-1494-7 (2019).
- [43] Google Jigsaw. Perspective API. https://www.perspectiveapi.com/ (2017).
- [44] Cooke, R. Wikipedia Is the Last Best Place on the Internet | WIRED. \JournalTitleWired Magazine (2020).
- [45] Watts, D. J. Everything Is Obvious : Once You Know the Answer (Crown Business, 2011).
- [46] justachetan. What is the definition of controversiality in the API? https://web.archive.org/web/20230610220309/https://old.reddit.com/r/redditdev/comments/akbbfp/what_is_the_definition_of_controversiality_in_the/ (2019).
- [47] Haidt, J. The Anxious Generation: How the Great Rewiring of Childhood Is Causing an Epidemic of Mental Illness (Penguin, 2024).
- [48] Remnick, D. Jonathan Haidt Wants You to Take Away Your Kid’s Phone. \JournalTitleThe New Yorker (2024).
- [49] Hua, Y. et al. WikiConv: A Corpus of the Complete Conversational History of a Large Online Collaborative Community. In arXiv.Org (2018).
- [50] Baumgartner, J., Zannettou, S., Keegan, B., Squire, M. & Blackburn, J. The Pushshift Reddit Dataset, DOI: 10.48550/arXiv.2001.08435 (2020). 2001.08435.
- [51] Wikipedia:Bot policy. https://en.wikipedia.org/wiki/Wikipedia:Bot_policy#Bot_accounts.
- [52] Holbert, C. Problems Fitting a Nonlinear Model Using Log-Transformation. https://www.cfholbert.com/blog/logtransform-nonlinear-regression/ (2018).
- [53] Clauset, A., Shalizi, C. R. & Newman, M. E. J. Power-law distributions in empirical data. \JournalTitleSIAM Review 51, 661–703, DOI: 10.1137/070710111 (2009). 0706.1062.
Appendix S.A Redundant figures from the main text: datasets, metrics that were excluded for space
S.A.1 Wikipedia users
Structure is the same as Fig. 3; individual plots have the same structure as Fig. 2, with 95% confidence intervals and trend lines fitted to bucket means.
S.A.2 URLs
The structure is the same as Fig. 2, with 95% confidence intervals and trend lines fitted to bucket means.
The structure is the same as Fig. 4. The lower plots show the cumulative sum of the upper plots. The minimum value for each lifetime activity bucket is marked by a vertical line. If there were an internal minimum, that would be the point where the slopes could be said to cross zero. For visibility, the slopes are scaled so that the maximum absolute value is 1 for each lifetime activity bucket.
The structure is the same as Fig. 7. The lower plots show the cumulative sum of the upper plots. The minimum value for each lifetime activity bucket is marked by a vertical line. If there were an internal minimum, that would be the point where the slopes could be said to cross zero. For visibility, the slopes are scaled so that the maximum absolute value is 1 for each lifetime activity bucket.
Appendix S.B Bootstrapping: robustness check for date of trend reversal
Appendix S.C Linear instead of log scale for comment order (x-axis)
S.C.1 Mean score figures
S.C.2 Slope figures
For slope plots (figures similar to Fig. 4) in the main text, the “slope” is of a line fitted to a logarithmic x-axis, for consistency with the mean score figures such as Figures 2 and 3. (To be exact, the line is not fit using linear regression on a log-transformed x-axis, since the error would be off.[52, 53] Instead, we used nonlinear least squares regression to fit the function .)
In this section, slopes are instead fit to the data without log-transforming, simply fitting to .

Appendix S.D Metrics: Are toxicity and downvote scores correlated?
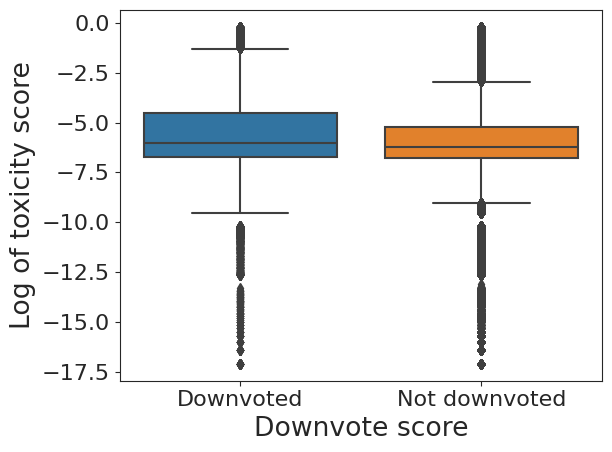
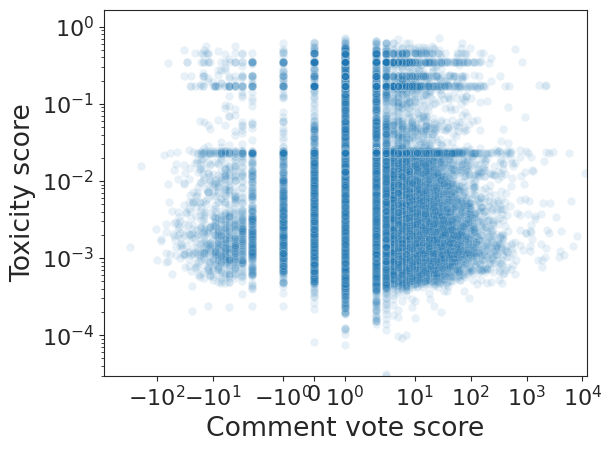
Note that “comment vote score” here is different from “downvote score”. “Comment vote score” is the vote score for a comment as displayed on Reddit, calculated as total number of upvotes minus downvotes. “Downvote score” measures the percentage of comments that were “downvoted” (received more downvotes than upvotes), calculated as whether the comment’s vote score was 0 or lower. The downvote score threshold is 0, rather than -1, because all comments start with a score of 1 (representing an upvote from the author’s own account).
Appendix S.E Alternate metrics: negative “control”
In this section are versions of Figures 2 and 4, for various metrics besides the toxicity and downvote scores.
Note that all of these metrics are binary, so aggregations over groups of comments are expressed as fractions between 0 and 1. The downvote score from the main text is also a binary vote score threshold, but is expressed as a percentage out of 100, i.e., a fraction similar to these metrics but multiplied by 100.
S.E.1 Mean score figures
Legends omitted for space, as they’re identical to that in Figure S27.
Legends omitted for space, as they’re identical to that in Figure S27.
Legends omitted for space, as they’re identical to that in Figure S27.
S.E.2 Slope figures
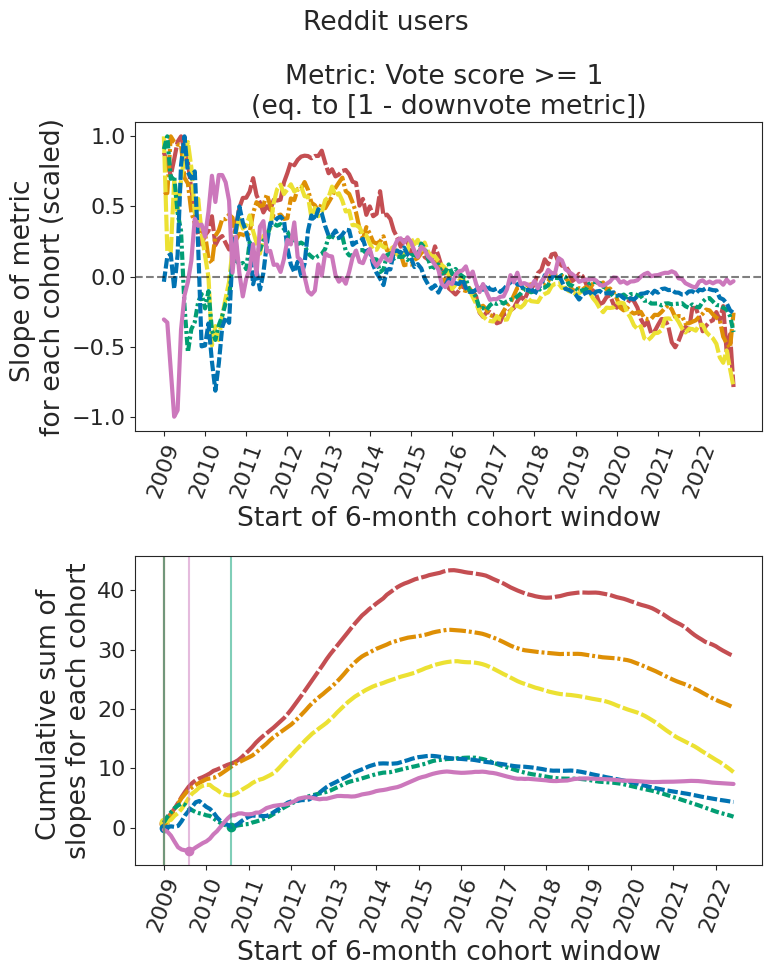
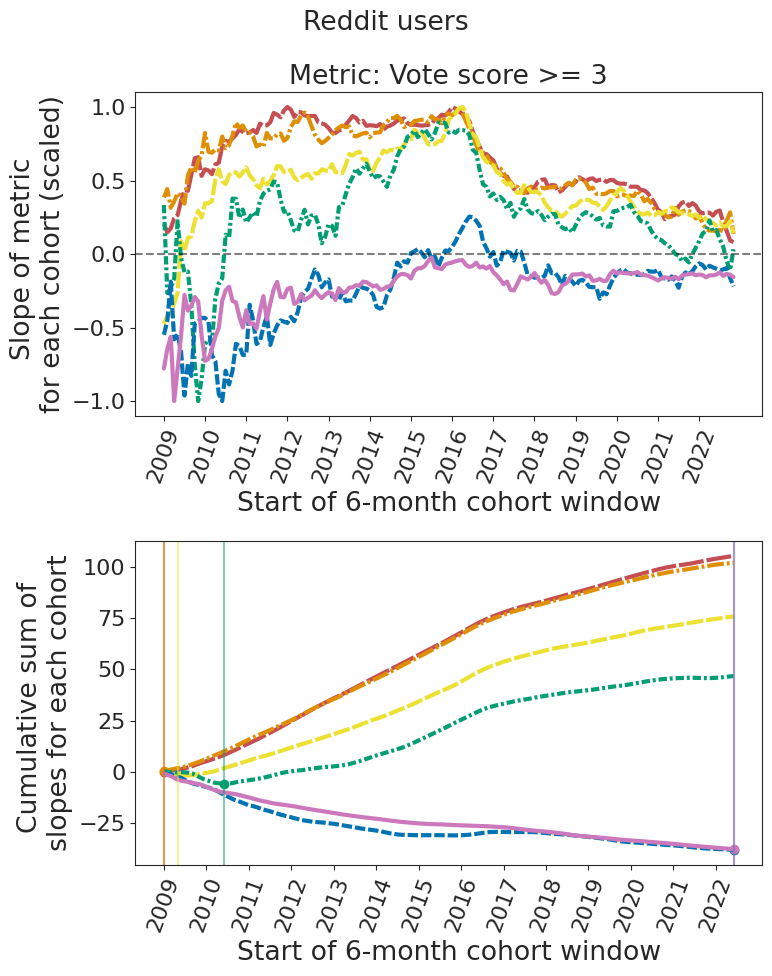
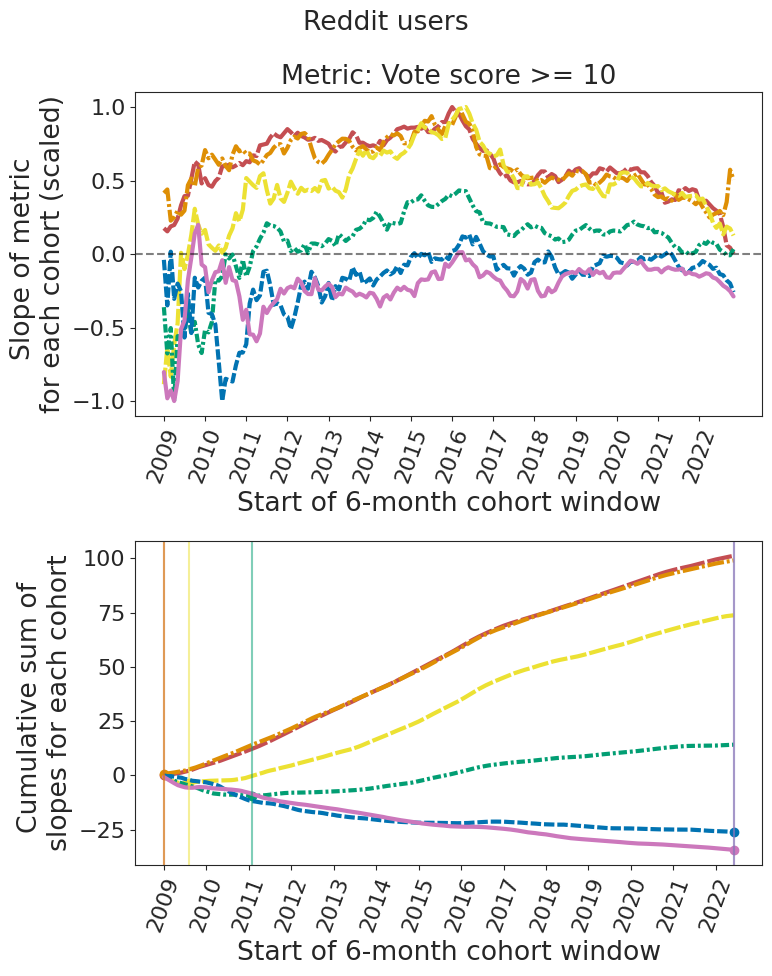
Note that absolute distance from 0 shouldn’t be compared between activity level buckets, as each bucket is scaled so that the maximum absolute value is 1.
Legends omitted for space, as they’re identical to that in Figure S31.
Legends omitted for space, as they’re identical to that in Figure S31.
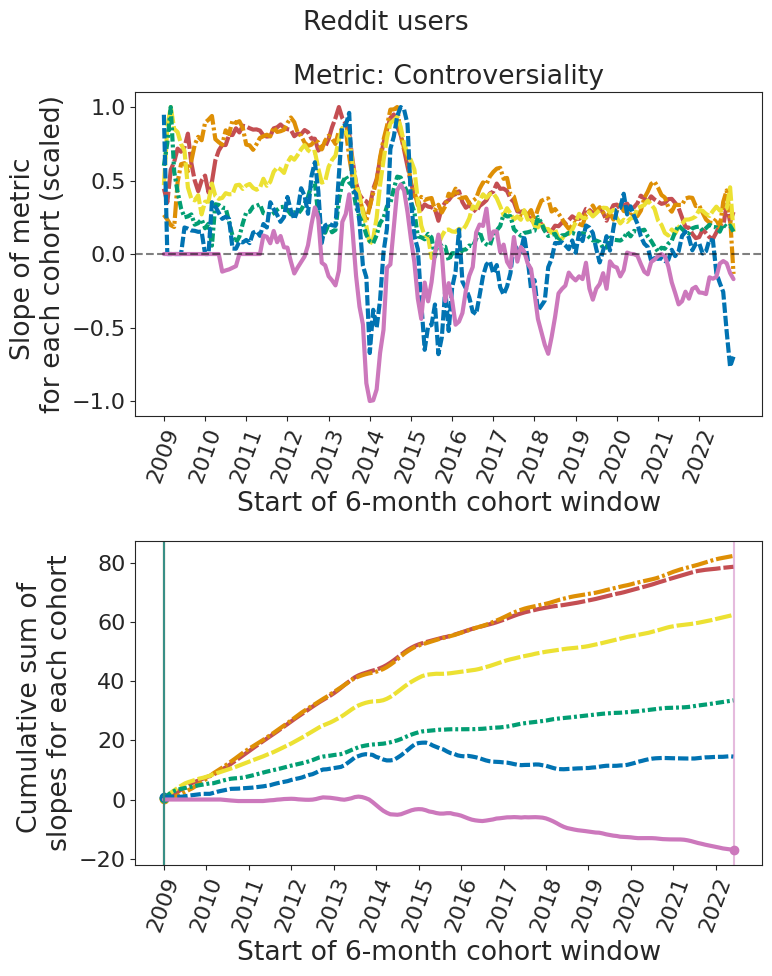
Controversiality is defined by Reddit, and the exact definition is proprietary and subject to change. The metric was only reported sporadically before 2015, which likely explains the sharp dip just before then.
Legends omitted for space, as they’re identical to that in Figure S31.
Appendix S.F Alternate activity-bucketing metrics
Note that users with only one comment are omitted from most subplots, as they have no valid (log) value for “time between first and last comment” and “time between comments”.
S.F.1 Mean score figures with alternate buckets
Note that, since we’re limiting to users who made at least 100 comments, short-lived users are in some ways more likely to be “active” than longer-lived users, since they must have been commenting rapidly in order to make 100 comments in a shorter time span.
S.F.2 Slope figures with alternate buckets
Appendix S.G Sizes of datasets over time