AstroSat Observations of the Dipping Low Mass X-ray Binary XB 1254690
Abstract
XB 1254690 is a neutron star low-mass X-ray binary with an orbital period of 3.88 hrs, and it exhibits energy-dependent intensity dips, thermonuclear bursts, and flares. We present the results of an analysis of a long observation of this source using the AstroSat satellite. The X-ray light curve gradually changed from a high-intensity flaring state to a low-intensity one with a few dips. The hardness intensity diagram showed that the source is in a high-intensity banana state with a gradually changing flux. Based on this, we divide the observation into four flux levels for a flux-resolved spectral study. The X-ray spectra can be explained by a model consisting of absorption, thermal emission from the disc and non-thermal emission from the corona. From our studies, we detect a correlation between the temperature of the thermal component and the flux and we examine the implications of our results for the accretion disc geometry of this source.
keywords:
accretion, accretion discs – methods: data analysis – stars: neutron – X-rays: binaries – X-rays: bursts – X-rays: individual: XB 12546901 Introduction
Low Mass X-ray Binary sources containing neutron stars (NS-LMXBs) are known for their variable nature. In X-rays, they exhibit dips, Quasi-Periodic Oscillations (QPOs), bursts, flares and coherent millisecond-period X-ray pulsations. Dips in soft X-rays are seen in a few NS-LMXBs (called the dippers), and in a few black hole LMXBs (D’Aì et al., 2014). These dips are thought to be caused by the periodic obscuration of X-rays by the accretion stream when it strikes the structures above the accretion disc. Such obscurations are possible only if the LMXBs are high inclination systems so that the line of sight passes through these structures (White & Swank, 1982). The dips may recur at the system’s orbital period, and the change in the X-ray spectrum during a dip is complex. The structure and location of emitting and absorbing components in NS-LMXBs can be well studied by modelling these spectral changes. The dippers sometimes exhibit low frequency (1 Hz) quasi periodic oscillations (QPOs), called “dipper QPOs”, at low intensities (Homan et al., 1999; Jonker et al., 1999, 2000; Bhattacharyya et al., 2006). Hence, dippers allow us to constrain the properties of the accretion discs and the polarized plasma above them (Jimenez-Garate et al., 2003) and the QPOs help us understand the innermost region of the accretion disc (Jonker et al., 2000).
Another X-ray variability that is mainly observed in NS-LMXBs is X-ray bursts. X-ray bursts are characterized by an increase in the intensity of the emission of X-rays with a short rise time of about a few seconds and a longer decay time. Unstable nuclear burning on the neutron star’s surface could lead to such X-ray bursts (Lewin & van der Klis, 2010). In the past few years, burst oscillations have been observed from several X-ray sources. The discovery of burst oscillations at the spin frequencies of the accreting millisecond pulsars SAX J1808.4–3658 and XTE J1814–338 (Chakrabarty et al., 2003; Strohmayer et al., 2003) has conclusively linked these oscillations to neutron star spin. Indeed, the detection of burst oscillations has facilitated the spin frequency measurements of neutron stars in more than a dozen NS-LMXBs. Detection of a low spin frequency neutron star from NS-LMXBs can be beneficial. Besides, in addition to measuring spin rates, the modelling of burst oscillation light curves can be necessary for the measurements of stellar mass and radius (Bhattacharyya et al., 2005), and for understanding the thermonuclear flame spreading on neutron stars (Bhattacharyya & Strohmayer, 2006).
X-ray flaring in NS-LMXBs has been known for many years. It was first observed in Sco X-1, which took place during both quiescent and active states of the source (Canizares et al., 1975). White et al. (1985) observed a notable increase in the black body temperature during flaring along with an increase in the emitting area. Later it was observed that many other bright NS-LMXBs exhibit flares similar to Sco X-1. Nevertheless, not much work has been done to develop a physical understanding of the flaring phenomenon. The alteration between flaring in brighter sources and bursting in less bright sources is also not understood. Balucińska-Church et al. (2001) reported the study of flaring in the big dipper X 1624-490. They proposed that the flaring consists of the superposition of X-ray bursts which occurs rapidly because of the higher (10 times) mass accretion rate.
XB 1254690 is an NS-LMXB showing several of the above features. It is a dipping source and has a 19th magnitude blue star called GR Mus as an optical counterpart (Griffiths et al., 1978). The detection of Type \Romannum1 X-ray bursts confirmed that the compact object in this source is a neutron star (Mason et al., 1980). XB 1254690 is known for exhibiting energy dependant X-ray dips with an orbital period of 3.88 0.15 hrs (Courvoisier et al., 1986). Motch et al. (1987) reported the modulation in the optical light curve with the period same as the X-ray dips, with a temporal offset of 0.2 cycles after the X-ray dips. The presence of dips and the absence of eclipse in this source lead to constraining the inclination angle, i, to be between 65∘ and 73∘ (Courvoisier et al., 1986; Motch et al., 1987).
While studying the timing properties of XB 1254690, Bhattacharyya (2007) established that it is an atoll source by calculating the color-color diagram using RXTE observation and correlating the timing properties with the different sections of it. The authors also mentioned that the source was always found in the banana state and never found in low intensity spectrally hard island state. The first evidence of QPOs from XB 1254690 was presented by Mukherjee & Bhattacharyya (2011) at frequencies 48.63 Hz and 64.01 Hz. The suggestive evidence of 95 Hz oscillations from a thermonuclear burst from XB 1254690 indicated that the central compact object is spinning with a frequency of 95 Hz (Bhattacharyya, 2007). However, further confirmation of both QPOs and thermonuclear burst oscillations is yet to be done.
XB 1254690 has shown a typical variation in the dip depth in the earlier observations, which makes it different from other dipping NS-LMXBs. Ginga observations of the source in 1990 showed deep dips in the light curve (Uno et al., 1997). However, dips were absent during the BeppoSAX observations in 1998 (Iaria et al., 2001) and in RXTE observations in 1997. In 1997 optical observations revealed that the amplitude of the optical variability was reduced by V 0.1 mag with mean V magnitude unchanged (Smale & Wachter, 1999). Non-detection of dips indicated that the angular size of the disc edge decreased to less than 10∘ from between 17∘ to 25∘ (Smale & Wachter, 1999). The dips were detected again during the XMM-Newton observation in January 2001 and during RXTE observation in May 2001 and were again undetected in the December 2001 observation (Smale et al., 2002), in February 2002 observation (Boirin & Parmar, 2003) and in October 2003 observation (Iaria et al., 2007). Once again, the deep dipping was observed in the May 2004 RXTE observation of the source (Barnes et al., 2007).
Along with energy-dependent intensity dips and thermonuclear X-ray bursts, the source also exhibits flares. Smale et al. (2002) reported flaring along with dips (see figure 1 of Smale et al. (2002)) and bursts (see figure 2 of Smale et al. (2002)).
In this paper, we present the results of an analysis of a long observation of the dipping NS-LMXB XB 1254690 using AstroSat carried out between 2018 May 03 and 2018 May 05. We observed flares and dips in the X-ray light curve during this observation. However, we did not detect any thermonuclear bursts. We studied the X-ray spectra of this dipping source using data from two instruments on board AstroSat, namely Soft X-ray Telescope (SXT) and Large Area X-ray Proportional Counter (LAXPC), using detailed spectral models. The structure of the paper is as follows. In section 2 we describe the data reduction procedure of both SXT and LAXPC instruments. In section 2.4, we describe the HID generation and formation of four sections for flux resolved spectroscopy based on intensity. We present a detailed spectral analysis of AstroSat data in section 3 along with details of constraining disc inner edge radius in section 3.2. Finally, we epitomize the results and discuss their implications in section 4.
2 Observation and Analysis
The Indian astronomical observatory AstroSat (Agrawal, 2006; Singh et al., 2014) observed XB 1254690 between 2018 May 03 and 2018 May 05 (ObsID: 9000002074). We analysed the data from two instruments onboard AstroSat namely SXT and LAXPC. The details of the observation with exposure time for both SXT and LAXPC are given in the table 1.
| Obs ID | Obs. time (UT) | Exposure (s) | ||
| (yyyy-mm-dd) | ||||
| 9000002074 | 2018-05-03 |
|
2.1 SXT
The Soft X-ray Telescope (SXT; Singh et al., 2016, 2017) on board AstroSat was the primary instrument for the observation, and the data were acquired in the Photon Counting (PC) mode. The source light curve and spectrum are extracted using the XSELECT tool in HEASoft (version 6.26.1) from circular region, which includes 94 of the total source photons and is suitable for the lowest possible systematic. For the background light curve, we consider a annular region. For spectral analysis, we use the response matrix file (RMF), deep blank sky background spectrum and an auxiliary response file (ARF) provided by the SXT payload operation team111https://www.tifr.res.in/~astrosat_sxt/dataanalysis.html.
2.2 LAXPC
The Large Area X-ray Proportional Counter (LAXPC, Yadav et al., 2016) data are analysed using the tools from LAXPCSoft222http://astrosat-ssc.iucaa.in/uploads/laxpc/LAXPCsoftware_Aug4.zip. By the time of the present observation, LAXPC10 showed unforeseeable variations in HV, and LAXPC30 suffered a gas leakage which caused gain instability. Hence, we are using only LAXPC20 data for spectral studies. However, we use both LAXPC10 and LAXPC20 for timing studies as the HV variations do not significantly affect the power density spectra (PDS). The background is dominating beyond 20.0 keV in LAXPC hence, we consider the 4.0 – 20.0 keV energy range and extract photons from the top layer of the unit to achieve a better signal-to-noise ratio (S/N).
2.3 Light curve
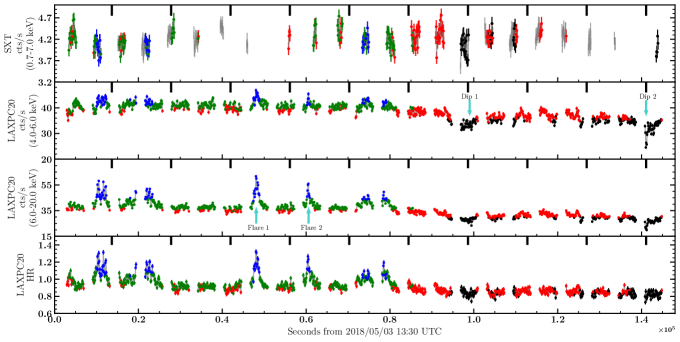
Figure 1 shows the background-subtracted light curves with a bin size of 100 s in different energy ranges: 0.7 – 7.0 keV (SXT, top panel), 4.0 – 6.0 keV (LAXPC20, second panel), 6.0 – 20.0 keV (LAXPC20, third panel). The fourth panel in the figure shows the hardness ratio (counts in the 6.0 – 20.0 keV energy range divided by those between the 4.0 – 6.0 keV band). The count rate in the SXT light curve is normalised with respect to the detection area. The data points in the figure are coded in four different colors (black, red, green and blue), representing the sections we are considering for flux-resolved spectroscopy. The grey data points represent the total observation. These intensity-dependent sections are discussed in section 2.4 in detail. Gambino et al. (2017) reported the new linear orbital ephemeris (see equation 5 in (Gambino et al., 2017)) with 11931.8069(16) TJD as a newly corrected reference epoch and 14160.004(6) s orbital period. The thick vertical tick marks on the top X-axis of each panel represent the expected dip times using this ephemeris.
XB 1254690 shows a decrease in its intensity during the present observation. Interestingly, several flare-like features are seen at the beginning of the observation, particularly in the first half. These flares are prominently seen in the 6.0 – 20.0 keV energy band of LAXPC20 light curve (pointed with the arrows in the third panel of Figure 1) and in the hardness ratio plot (fourth panel of Figure 1). We detected two dips after the flaring episode towards the end of the observation. Both are evident in the 4.0 – 6.0 keV energy band of LAXPC20 (pointed with the arrows in the second panel of Figure 1). To characterise dips we followed the definition of “deep”, “shallow” and “undetected” dips given in Díaz Trigo et al. (2009). The AstroSat data have gaps due to Earth occultation and South Atlantic Anomaly (SAA). While calculating the reduction of the flux during dips compared to the persistent emission, we considered the light curves between these data gaps. The dip 1 is a “shallow” dip (near 1.0 s) with 9.7% reduction of 4.0 – 20.0 keV flux and the dip 2 is a “deep” dip (near 1.4 s) with 15.9% reduction in the flux when compared to the persistent emission. The appearance of these dips coincides with the expected dip times derived from the new linear orbital ephemeris given by Gambino et al. (2017)
the reference epoch of deep dip observed during XMM-Newton observation (Díaz Trigo et al., 2009).
2.4 Hardness Intensity Diagram
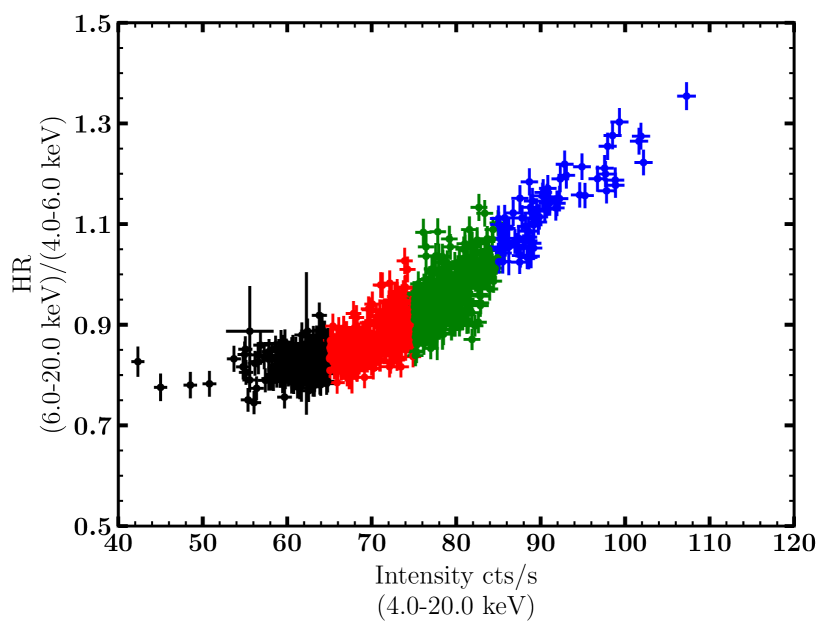
The Hardness Intensity Diagram (HID) for XB 1254690 is generated using LAXPC20 data from the top layer of the detector (Figure 2). The hardness ratio is the ratio of background-corrected counts between 6.0 – 20.0 keV to the counts between 4.0 – 6.0 keV, and the intensity is the total background-corrected counts between 4.0 – 20.0 keV.
Based on the intensity, we divided the HID into four sections (marked in different colors in Figure 2) to perform flux resolved spectroscopy of XB 1254690. The selection of sections is made so that each section will have at least 10000 data points. We used laxpc_fluxresl_gti tool from LAXPCSoft to generated Good Time Intervals (GTIs) for these sections. The GTIs generated from this tool are then used to generate both SXT and LAXPC20 spectra.
Figure 2 distinctly indicates that both intensity and hardness are high during flaring (see the blue points in Figure 1) as flaring is high energy phenomenon and are low during the dips (see the black points in Figure 1) as dipping is a low energy phenomenon.
2.5 Dips and Flares Light curve
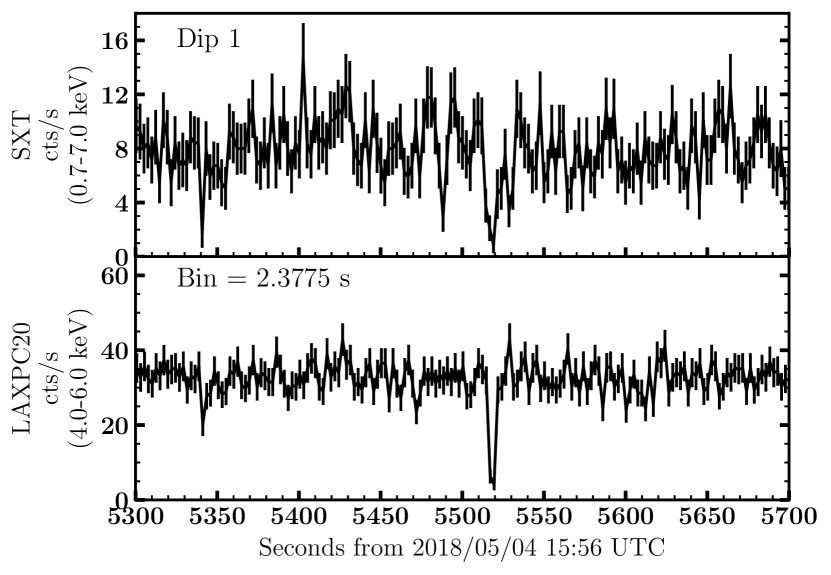
The shallow dip is observed in both SXT and LAXPC20, while the deep dip is observed only in the LAXPC20 data as SXT have a data gap during this time. Figure 3 shows the SXT and LAXPC20 background-corrected light curve for the shallow dip with the time bin 2.3775 s (a minimum time resolution of SXT).
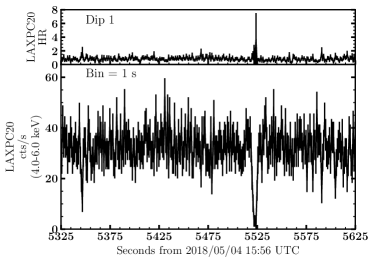
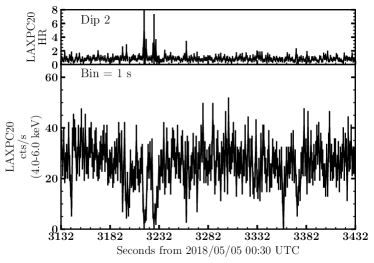
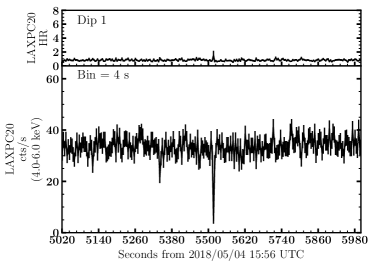
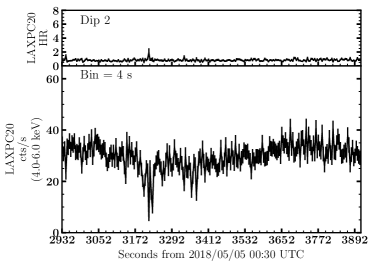
The LAXPC20 4.0 – 6.0 keV background-corrected light curve and the hardness ratio (counts between 6.0 – 20.0 keV energy band divided by the counts between 4.0 – 6.0 keV energy band) plot of a shallow dip with a time resolution of 1 s is shown in the upper left panel of Figure 4. The part of the same dip with 4 s time resolution is shown in the lower-left panel of the figure. Light curve and hardness ratio for the deep dip are shown in the right panel of Figure 4 (upper right panel is with 1 s time resolution and the lower right panel is with 4 s time resolution). If we examine the plot of deep dip with 1 s time resolution, in the beginning, the intensity is decreasing slightly (known as the shoulder of the deep dip). In contrast, the hardness ratio is not varying much, and after some point, both light curve and hardness ratio vary extensively. The strongest hardening corresponds to the deepest segment of the dips. In these figures, we can observe that the shallow dip’s depth and hardness ratio is similar to the deep dip, as it comprises many very short duration deep dips.
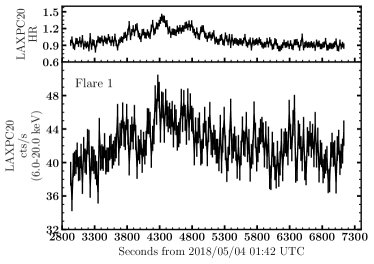
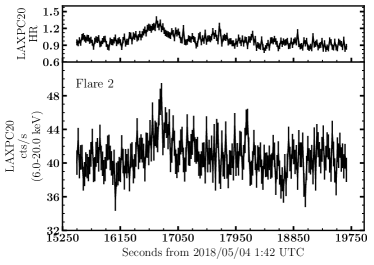
The two prominent flares observed in XB 1254690 during this observation are shown in Figure 5. The left panel is flare 1, and the right panel is flare 2. The lower section of each panel is the 6.0 – 20.0 keV LAXPC20 light curve, and the upper section is the hardness ratio (counts between 6.0 – 20.0 keV divided by counts between 4.0 – 6.0 keV). Both light curve and hardness ratio are binned over 20 s.
2.6 Power Spectral Density (PSD)
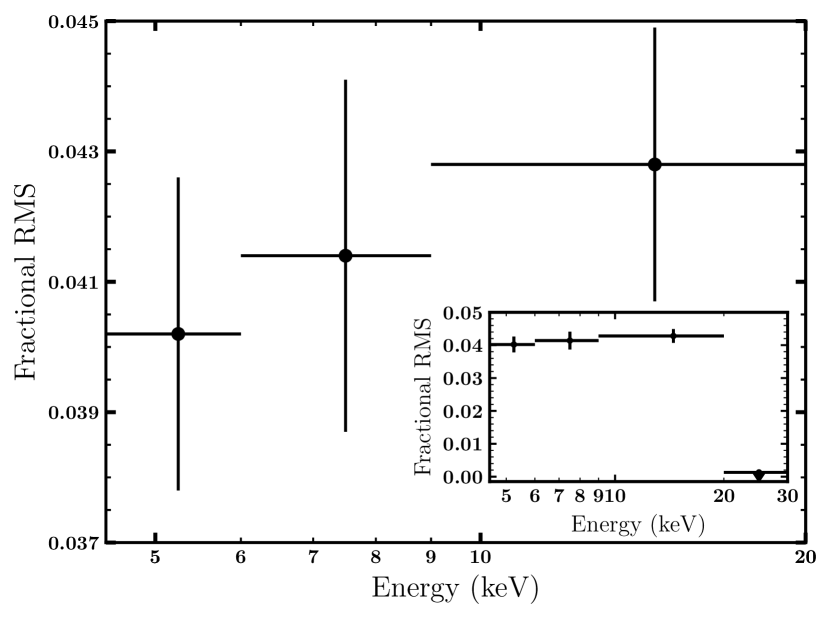
We used the LAXPC10 and LAXPC20 observations to extract the Power Density Spectra (PDS), using the General High-energy Aperiodic Timing Software ()333http://astrosat.iucaa.in/~astrosat/GHATS_Package/Home.html. We extracted PDS in the energy range 3.0 – 20.0 keV with Nyquist frequency up to 3000 Hz using intervals of 10 s. Inspection of the PDS in various energy bands as well as the sections based on intensity (see Figure 6) does not reveal the presence of high frequency candidate Quasi Periodic Oscillations (QPOs) reported in Mukherjee & Bhattacharyya (2011). We also examined the dynamic PDS during the flares but did not detect any significant high frequency QPOs. To examine the low frequency variability, we extracted a PDS with Nyquist frequency extending up to 10 Hz using 50 s intervals of the light curve and fit it using a zero centered Lorentzian and a Lorentzian for the QPO. The PDS of the complete light curve in the 3.0 – 20.0 keV energy range indicates the presence of a QPO with frequency 0.65 Hz (Figure 6) with low statistical significance (2 ). Examination of the PDS in narrower energy bands indicates the presence of the feature but the statistical significance falls rapidly and there is no conclusive rms–energy relation due to the resulting large uncertainties. A correlation of rms and energy for the QPO can identify it as a 1 Hz QPO usually seen in dipping LMXBs (Homan, 2012). Up to 20 keV the rms of the low frequency noise (LFN) and the energy have a Pearson correlation coefficient (Figure 7). Beyond 20.0 keV the rms drops rapidly and we can only estimate upper limits, this is seen from the inset of Figure 7.

3 Spectral Analysis
The joint SXT and LAXPC20 spectral fitting for each of the four sections of the HID is carried out using XSPEC v-12.13.1 (Arnaud, 1996). The energy ranges used for SXT and LAXPC20 spectra are between 0.7 – 7.0 keV and 4.0 – 20.0 keV, respectively. The counts below 0.7 keV and above 7.0 keV for SXT and above 20.0 keV for LAXPC20 are avoided to minimise the large systematic errors. Also, counts below 4.0 keV for LAXPC20 are ignored due to the uncertainty in the response matrix. For SXT the ARF file sxt_pc_excl00_v04_20190608.arf, RMF file sxt_pc_mat_g0to12.rmf and the background file SkyBkg_comb_EL3p5_Cl_Rd16p0_v01.pha are used. The RMF file lx20cshp01L1v1.0.rmf is used for LAXPC20. All these files are obtained from the payload operation center (POC) of SXT444https://www.tifr.res.in/~astrosat_sxt/dataanalysis.html and LAXPC555https://www.tifr.res.in/~astrosat_laxpc/LaxpcSoft.html. The background spectrum for LAXPC20 is generated using laxpc_make_backspectra tool of LAXPCSoft. For the ease of fitting in joint spectral analysis, the re-binning of the channels is performed to match the intrinsic spectral resolution of SXT666Page 52 of AstroSat Handbook Ver : 1.11 http://www.iucaa.in/~astrosat/AstroSat_handbook.pdf and LAXPC777Page 6 of AstroSat Handbook Ver : 1.11 http://www.iucaa.in/~astrosat/AstroSat_handbook.pdf. A systematic uncertainty of 3% is added while performing the spectral fitting. The SXT data are corrected for the gain; we used gain fit command in XSPEC, keeping slope fixed to unity. We also included cross-normalisation constant using constant model in XSPEC for the joint spectral fitting, considering it to be unity for SXT and allowing to vary for the LAXPC20 spectrum. This help us to account for the cross-calibration normalisation uncertainties in the fit. We also excluded dips while performing the spectral fitting of section 1 for the source.
The spectra from SXT LAXPC20 data are jointly fitted with two sets of models. The first model [cons*(tbabs*warmabs*(diskbb+comptt)+ tbabs*(gau1+gau2))], called M1 here, is the one used by Díaz Trigo et al. (2009) to analyse the and data of XB 1254690. Some of the parameters in this model, however, could not be constrained and had to be held constant to the values reported in Díaz Trigo et al. (2009). Hence, we also used a second more generic model [cons*tbabs*simpl*diskbb], called M2, to elicit the source behaviour.
3.1 Flux Resolved Spectroscopy
3.1.1 Model M1
The spectra are generated using GTIs for each of the HID sections (mentioned in section 2.4). We fit the joint SXT+LAXPC20 spectra in the energy range 0.7 – 20.0 keV for all four intensity dependent sections for XB 1254690 using the model M1, which is used by Díaz Trigo et al. (2009) to fit XMM-Newton and INTEGRAL data. The model M1 is consisting of a disc blackbody (diskbb) and a thermal comptanization component (comptt). Both these components are modified by neutral photo-electric absorption (N) and ionised photo-electric absorption using warmabs model, along with two Gaussian emission components. The warmabs model is consisting of column density of absorber (N), ionisation parameter = L/nR2 (L is the luminosity of the incident radiation, n is the gas density and R is the distance from the radiation source), turbulent velocity broadening v, and the average systematic velocity shift of the absorber . The warmabs is used to model the photo-ionised plasma absorption in the line of sight. While fitting the SXT+LAXPC20 spectra we kept the warmabs and both Gaussian component parameters fixed to that of the XMM-Newton and INTEGRAL parameters reported in Díaz Trigo et al. (2009). Also to make a reasonable comparison between our results and XMM-Newton and INTEGRAL results, we calculated the flux between 0.6 – 10.0 keV range by standardising the energy range using the energies command within XSPEC while fitting.
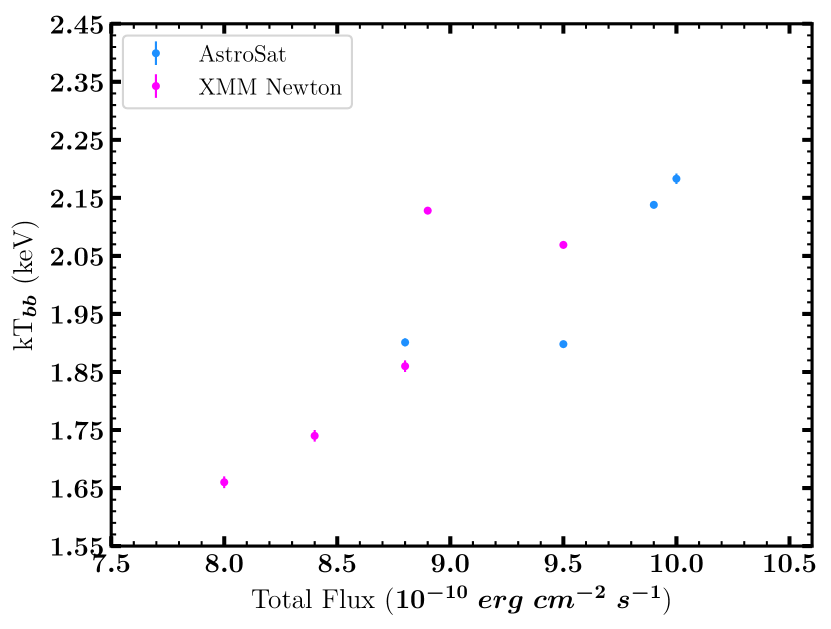
A significant change in the disc blackbody component is observed when we fitted the spectra by keeping warmabs and Gaussian parameters consistent with the XMM-Newton and INTEGRAL results. The detailed best fit spectral parameters using M1 for HID sections 1 to 4 (sections given in Figure 2) are given in Table 2. The disc blackbody temperature (kTbb) as a function of flux is shown in Figure 8, along with the XMM-Newton and INTEGRAL values reported in Table 4 of Díaz Trigo et al. (2009). We found that the change in the disc blackbody temperature is consistent with that of the XMM-Newton and INTEGRAL values. We observe the shift in the flux values for AstroSat results as we are considering the entire observation for our study without excluding flares; though, we are not considering the dips while fitting the spectra. Note that Díaz Trigo et al. (2009) have considered only persistent emission from all 5 observations (2 observations with deep dips, 1 with shallow dip and 2 without dips) excluding dips and bursts.
| AstroSat | XMM Newton & | |||||
| HID Section | 1 | 2 | 3 | 4 | INTEGRAL† | |
| Comp. | ||||||
| Parameter | ||||||
comptt |
||||||
| kT0 (keV) | 0.222 0.008 | 0.261 0.015 | 0.216 0.015 | 0.231 0.013 | 0.173 0.001 | |
| kTcomptt (keV) | 4.61 0.06 | 3.34 0.03 | 3.65 0.04 | 3.28 0.03 | 3.06 0.03 | |
| 4.42 0.06 | 7.44 0.10 | 7.09 0.11 | 7.90 0.10 | 6.07 0.05 | ||
| kcomptt | 0.0287 0.0008 | 0.0191 0.0006 | 0.0165 0.0007 | 0.0325 0.0009 | 0.0763 | |
dbb |
||||||
| kTbb (keV) | 1.901 0.007 | 1.898 0.005 | 2.138 0.006 | 2.183 0.009 | 1.86 0.01 | |
| kbb [(Rin/D10)2 cos] | 2.78 0.04 | 3.32 0.04 | 2.29 0.02 | 1.78 0.03 | 1.76 | |
gau1
|
||||||
| Egau (keV) | 6.8 0.3 | 7.0 0.2 | 6.9 0.3 | 7.0 0.2 | 6.59 0.05 | |
| (keV) | 0.53f | 00.53f | 0.53f | 0.53f | 0.53 0.06 | |
| (10-4 ph cm-2 s-1) | 2.0 0.5 | 2.2 0.5 | 2.3 0.6 | 2.9 0.7 | 3.3 0.3 | |
gau2
|
||||||
| Egau (keV) | 0.85 0.04 | 0.92 0.09 | <1.73 | 0.84 | 1.046 0.004 | |
| (keV) | 0.1f | 0.1f | 0.1f | 0.1f | 0.1 | |
| kgau (10-3 ph cm-2 s-1) | 1.2 | 2.3 0.1 | <0.67 | 3.9 0.2 | 1.69 | |
tbabs |
||||||
| N (1022 cm-2) | 0.20 0.01 | 0.19 0.01 | 0.15 0.01 | 0.22 0.01 | 0.220 0.001 | |
warmabs |
||||||
| N (1022 cm-2) | 2.0f | 2.0f | 2.0f | 2.0f | 2.0 0.3 | |
| log() (erg cm s-1) | 3.95f | 3.95f | 3.95f | 3.95f | 3.95 | |
| v (km s-1) | 2600f | 2600f | 2600f | 2600f | 2600 | |
| (km s-1) | -1400 780 | |||||
| (d.o.f.) | 0.99 (53) | 1.13 (56) | 0.90 (56) | 1.09 (56) | 1.51 (1147) | |
| F ( erg ) | 8.8 | 9.5 | 9.9 | 10.0 | 8.8 | |
| (0.6 – 10.0 keV) | ||||||
| Fdbb ( erg ) | 7.1 | 8.0 | 9.1 | 8.6 | 4.1 | |
| (0.6 – 10.0 keV) | ||||||
| Exposure (ks) | 6.1s/19.1l | 12.9s/33.6l | 11.3s/35.6l | 3.5s/7.2l | 26.6 | |
True Inner Disc Radius |
||||||
| rin (km)†† | 6.12 0.04 | 6.69 0.04 | 5.55 0.02 | 4.90 0.03 | ||
Note: f represents that the parameters are fixed to the values reported in Díaz Trigo et al. (2009) while fitting SXT & LAXPC20 joint spectra. s and l denotes the exposure time for SXT and LAXPC20 corresponding to each HID section. Note ††f = 1.7, color or correction factor.
†Díaz Trigo et al. (2009)
3.1.2 Model M2
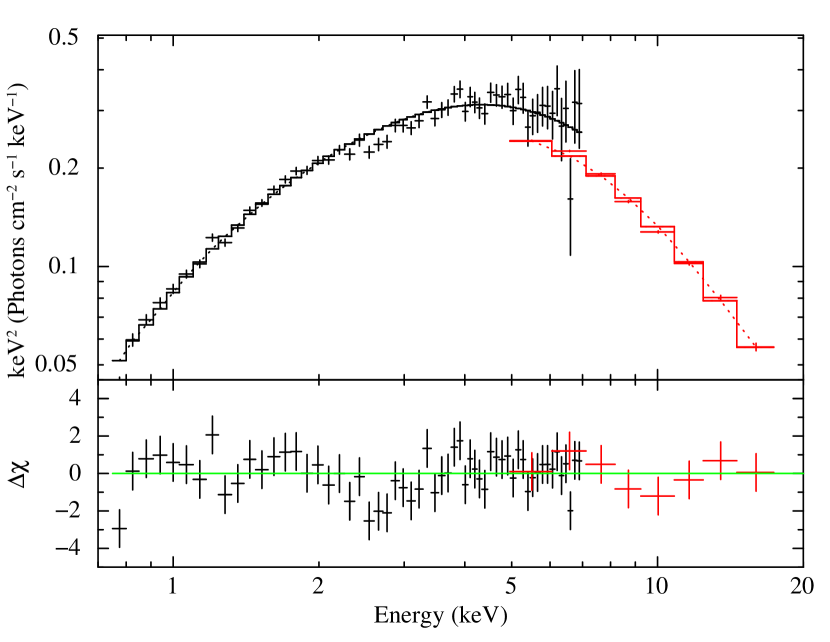
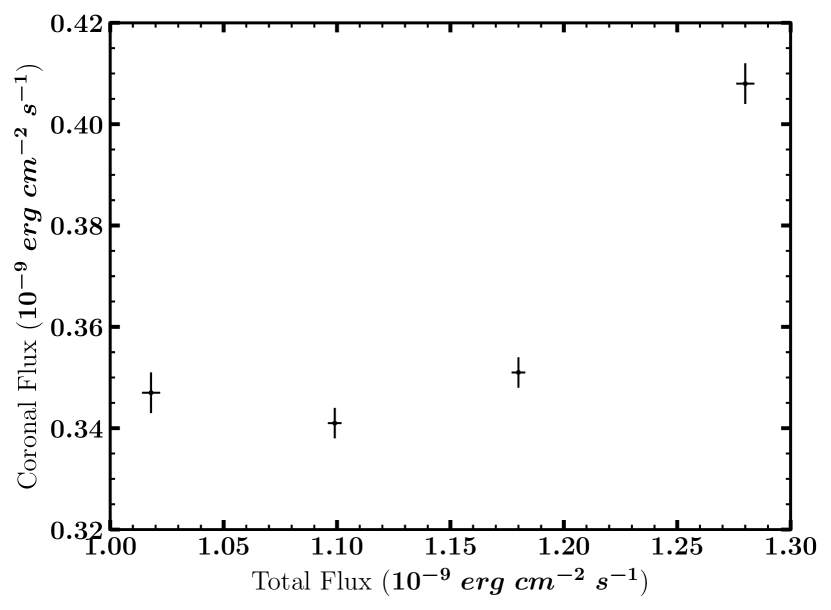
The joint spectra of SXT & LAXPC20 in the energy range of 0.7 – 20.0 keV are fitted with the model M2 consisting of a combination of Comptonization (simpl: Steiner et al. (2009)) and a multicoloured disc blackbody (diskbb: Mitsuda et al. (1984), Makishima et al. (1986)) along with Galactic absorption (TBabs). We implemented the convolution model cflux in this model, to estimate the total flux and disc flux for the energy range 0.7 – 20.0 keV and calculated the coronal flux of the source (Figure 12). The best-fit spectra for the first HID section (section 1 (black) given in Figure 2) are shown in Figure 9, along with the residuals. The detailed best-fit spectral parameters for HID sections 1 to 4 are given in Table 3.
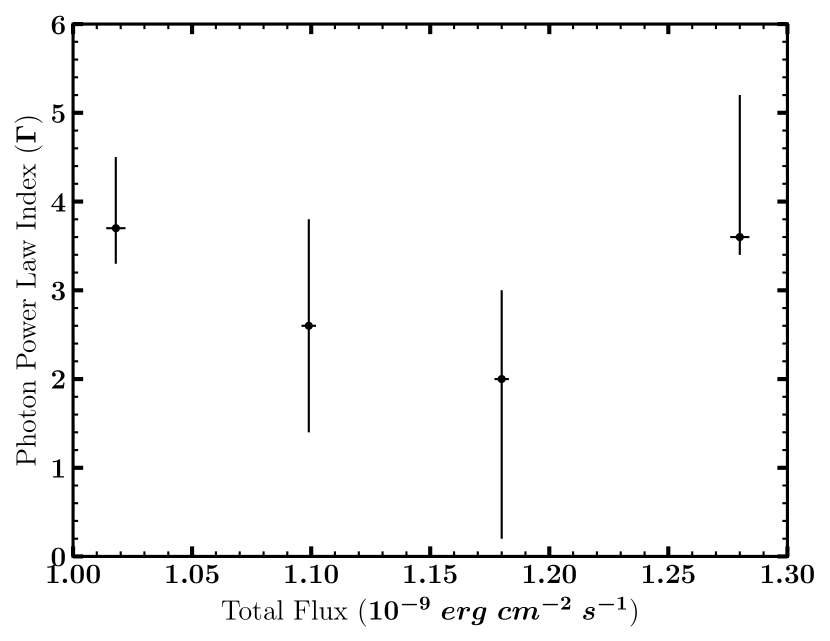
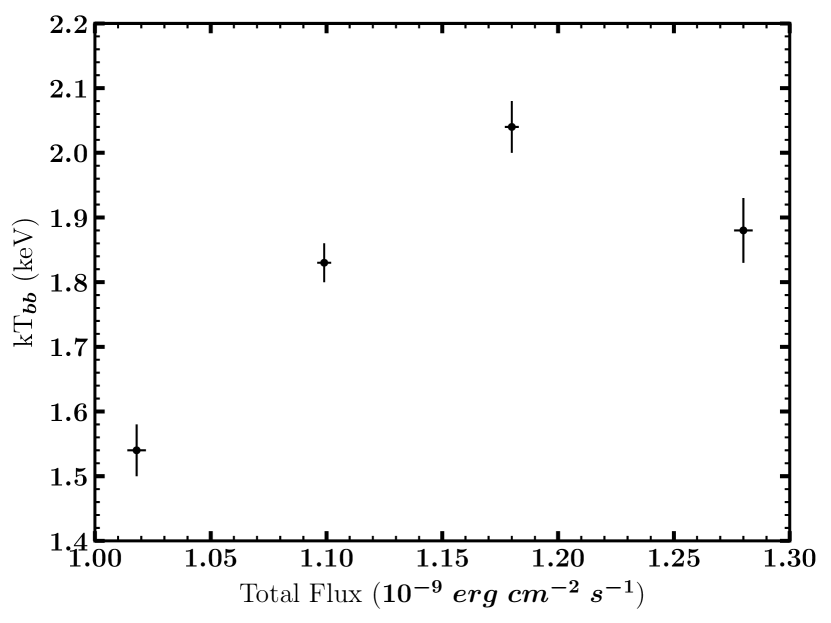
We observed the variations in the inner disc temperature (kTbb) as a function of total flux (Figure 11). We did not observe significant variations in the photon power-law index () (Figure 10). The best-fit offset values for the SXT gain fit were found to be 42.41 eV, 34.26 eV, 53.88 eV and 44.33 eV for sections 1, 2, 3 and 4, respectively. Furthermore, we did not observe improvement in the fitting parameter values by adding an iron line to the spectral model.
| AstroSat | |||||
| HID Section | 1 | 2 | 3 | 4 | |
| Comp. | |||||
| Parameter | |||||
tbabs |
|||||
| N (1022 cm-2) | 0.08 0.02 | 0.10 0.01 | 0.08 0.01 | 0.09 0.01 | |
Total Flux |
|||||
| (0.7 – 20.0 keV) | |||||
cflux (10-9 erg cm-2 s-1) |
1.018 0.004 | 1.099 0.003 | 1.180 0.003 | 1.280 0.004 | |
simpl |
|||||
| 3.7 | 2.6 1.2 | 2.0 | 3.6 | ||
FracSctr |
0.46 | 0.17 0.02 | 0.10 0.01 | 0.61 | |
dbb |
|||||
| kTbb (keV) | 1.54 0.04 | 1.83 0.03 | 2.04 0.04 | 1.88 0.05 | |
| kbb [(Rin/D10)2 cos] | 7.3 | 4.4 0.7 | 3.1 | 3.8 | |
dbb Flux |
|||||
| (0.7 – 20.0 keV) | |||||
cflux (10-9 erg cm-2 s-1) |
0.671 0.005 | 0.758 0.001 | 0.829 0.001 | 0.872 0.001 | |
Coronal Flux |
|||||
| (0.7 – 20.0 keV) | |||||
cflux (10-9 erg cm-2 s-1) |
0.347 0.004 | 0.341 0.003 | 0.351 0.003 | 0.408 0.004 | |
| (d.o.f.) | 1.16 (60) | 1.15 (58) | 1.16 (60) | 1.13 (60) | |
True Inner Disc Radius |
|||||
| rin (km)† | 9.91 0.02 | 7.66 0.01 | 6.42 0.01 | 7.26 0.02 | |
Note †f = 1.7, color or correction factor. Parameter 3: of the simpl model is frozen to unity during spectral fitting.
3.2 Constraining Disc Inner Edge Radius
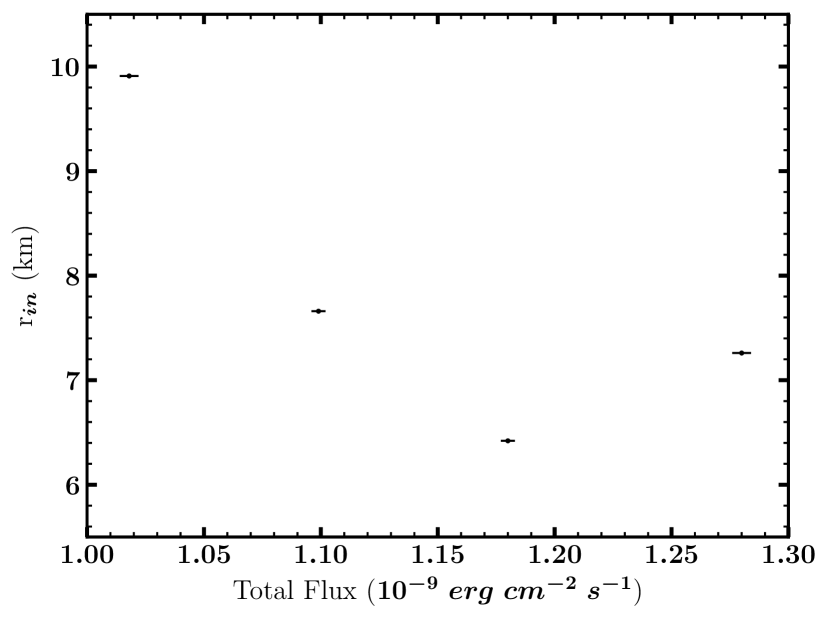
The normalization parameter of diskbb model is defined as (Rin/D10)2 , where Rin is the apparent inner disc radius in km, D10 is the distance to the source in 10 kpc units, and is the angle of the disc with respect to the observer. In our spectral fitting using M1 and M2, we observed the variation in the diskbb normalization (kbb) for section 1, section 2, section 3 and section 4 of HID. We calculated the Disc Inner Edge Radius (rin) using diskbb normalization from both M1 and M2 (Figure 13). We considered distance to source as 7.6 0.8 kpc (Gambino et al., 2017), inclination angle between 65∘ – 73∘ (Motch et al., 1987; Díaz Trigo et al., 2009) and a color or a correction factor () as 1.7 (Shimura & Takahara, 1995). The Disc Inner Edge Radius (rin) is found to be decreasing as the source became harder from section 1 to section 4 (Figure 13). The calculated values of rin in km for each section are given in Table 3.
4 Discussion
In this paper, we report the results of the flux resolved spectroscopy of XB 1254690 data observed with AstroSat between 2018 May 03 and 2018 May 05. We have utilised the data from two pointing instruments (SXT and LAXPC) onboard AstroSat. The hardness ratio of the source is variable. XB 1254690 is found to be exhibiting flares at the beginning of this observation. The flaring phenomenon is a high energy phenomenon dominated by hard X-rays and hence were found to be associated with the hardness ratio and intensity. We observe two dips after the flaring episodes during this observation. The first dip we observed is a “shallow” dip, and the second is a “deep” dip. Dips are related to an increased absorption at low energies and, therefore, with an anti-correlation between hardness and intensity. The first dip with 100 s time resolution is identified as “shallow”, is consisting of a few rapid, deep variations with a time resolution of 1 s. The characteristics of dips are consistent with that observed in the earlier observations (Díaz Trigo et al., 2009). The presence of flares, along with dips and thermonuclear X-ray bursts, has been reported earlier (Smale et al., 2002; Mukherjee & Bhattacharyya, 2011). This is the first time we observed strong flares in XB 1254690 at the beginning, which is followed by two dips. The X-ray dipping properties of the source have been studied extensively in earlier observations (Iaria et al., 2001; Smale et al., 2002; Iaria et al., 2007; Mukherjee & Bhattacharyya, 2011). Most of the studies have reported the properties of persistent emission alone. Nevertheless, a detailed study of XB 1254690 data inclusive of flares (and excluding dips) have not been done earlier.
XB 1254690 was found to be in a banana state during this observation. Bhattacharyya (2007) established that XB 1254690 is an atoll source. In the island state, an atoll source does not move up and down so fast, and the track is not as well-defined as in the banana state (see review by \textcolorblueLewin & van der Klis (\textcolorblue2006)). The shape of the track in the HID, after comparing with the HID tracks of atoll sources (e.g., in \textcolorblueLewin & van der Klis (\textcolorblue2006)), including the HID track of XB 1254690 given in Bhattacharyya (2007), strongly indicates that the source is in the banana state during this observation.
We have performed a flux resolved spectroscopy on the spectra extracted at the different intensity levels with changing hardness. Mukherjee & Bhattacharyya (2011) reported the systematic continuum (excluding flares, dips, and bursts) spectral analysis of XB 1254690 using observations. They performed analysis using 19 various combinations of continuum spectral models (see Table 1 of Mukherjee & Bhattacharyya (2011)) on the upper banana state and lower banana state of the source and suggested that the bknpower+comptt is the preferred model for the continuum. In our study, we considered the observation, which includes flares but excludes dips (note that thermonuclear bursts were not observed) and extracted the spectra from four different sections of HID. The joint SXT and LAXPC20 spectra with total energy of 0.7 to 20.0 keV for each of the HID sections were well fitted with two sets of models—M1: cons*tbabs*warmabs*(diskbb+comptt)+tbabs*(gau1+gau2) and M2: cons*tbabs*cflux*simpl*diskbb. Model M1 consists of a disc blackbody (diskbb) and thermal comptanization component (comptt), along with neutral photo-electric absorption (N) and ionised photo-electric absorption using warmabs model and two Gaussian emission components. Model M2 consists of Comptonization model and a multicoloured disc blackbody model along with Galactic absorption. In M2, we tried replacing diskbb model with the blackbody model, which resulted in a much higher reduced (3.4). Therefore, we suggest that simpl*diskbb is a non-complex model, suitable for the spectra (which includes flares) of XB 1254690 in 0.7 – 20.0 keV energy range.
In model M1 (see Table 2), we have kept the warmabs parameters identical with XMM-Newton parameters (Díaz Trigo et al., 2009), to measure the disc blackbody temperature (kTbb) and flux using the Soft X-ray Telescope (SXT). This allowed us to discover the kTbb and flux correlation for XB 1254690 for the first time. The disc blackbody temperature is lower for section 1 (1.883), increased gradually for the sections that do not have dips or flares (2.005 and 2.134), and highest for the section which has flares (2.386). The change in the disc blackbody temperature we observed is consistent with the trend observed in the Díaz Trigo et al. (2009). The significant increase in the blackbody temperature during the flares has been observed in the Z-source Sco X–1 (White et al., 1985) and the systematic increase in the inner disc temperature of the big dipper has also been previously reported (Balucińska-Church et al., 2001).
In model M2 (see Table 3), the lower energy coverage of SXT allowed us to constrain Galactic column density for the source. The photon power-law index as a function of total flux (Figure 10) does not show a significant trend given the uncertainties. In M2, the inner disc temperature (kTbb) is found to increase from Section 1 to Section 3 (Figure 11) with a minimum value of 1.54 0.04 and a maximum value of 2.04 0.04. However, it decreases slightly for section 4. We computed the Coronal flux for XB 1254690 and plotted it as a function of the total flux (Figure 12). The Coronal flux was found to be increasing as the total source flux increased. The disc inner edge radius (rin) (Figure 13) calculated using the values of diskbb normalization (kbb) and are given in Table 2 and Table 3.
Although XB 1254690 has been the target of many X-ray missions since its discovery in 1984, timing characteristics were not reported until 2011, in the RXTE observations of January 6 to March 13, 2008 (Mukherjee & Bhattacharyya, 2011). In these observations Mukherjee & Bhattacharyya (2011) detected high-frequency QPOs 96 Hz. In the AstroSat observations we did not detect the 96 Hz QPO or the high frequency QPOs reported by Mukherjee & Bhattacharyya (2011). This is probably because the source was in the high-intensity upper banana state (UB), which is also indicated by the very low-frequency noise (VLFN) detected in the PDS (van der Klis, 2004, 2006). The RMS of the VLFN tends to increase with energy as seen in Figure 7 where we show the relation up to the energy range 20 keV. Beyond 20 keV, the RMS drops as shown in the inset of Figure 7, indicating that the VLFN up to 20 keV is related to the unstable accretion dynamics of matter falling onto the neutron star. The presence of VLFN (3 Hz) also indicates that the source was in the UB during this observation (van der Klis, 2004, 2006; Bhattacharyya, 2007). LFQPOs, called 1 Hz QPOs, are usually seen in dipping LMXBs like XB 1254690. These LFQPOs have not been reported so far in XB 1254690 (Homan, 2012; Bhattacharyya, 2007; Mukherjee & Bhattacharyya, 2011). In our analysis of the AstroSat observation, we detect a 0.65 Hz signal with low significance ( 2.7 ) that can be confirmed with longer observations.
In summary, for the first time we have found a kTbb and flux correlation for NS-LMXB XB 1254690. We have also given a constraint on the disc inner edge radius and tried to understand its evolution during flares using SXT and LAXPC on board AstroSat data through the flux-resolved spectroscopy. Future observation of the source with AstroSat, simultaneously with NuSTAR (for the hard band) and NICER (for the soft band), can be used to study the source in detail and to give better constraints to the parameters. Recurrent monitoring of the source can provide a distinctive opportunity to study the evolution of these parameters, and it will help us correlate them.
Acknowledgements
NRN and DP acknowledge the financial support from the Indian Space Research Organisation (ISRO) under the AstroSat archival Data utilization program. This publication uses data from the AstroSat mission of the Indian Space Research Organization (ISRO), archived at the Indian Space Science Data Center (ISSDC). The authors acknowledge the LAXPC and SXT Payload Operations Centers (POCs) for providing us with essential input and the necessary tools for data analysis. This research has made use of software provided by the High Energy Astrophysics Science Archive Research Center (HEASARC), which is a service of the Astrophysics Science Division at NASA/GSFC. This work has made use of the GHATS package developed by Late Prof. Tomaso Belloni at INAF-OAB, Merate, Italy. NRN and DP are thankful to the Department of Physics, Ramniranjan Jhunjhunwala College and University of Mumbai, for providing the necessary facilities to carry out the work. NRN and DP are also grateful to the Tata Institute of Fundamental Research (TIFR), Inter University Center for Astronomy and Astrophysics (IUCAA), and AstroSat Science Support Cell (ASSC) hosted by IUCAA and TIFR for their support in the work. NRN thank Dr. Sunil Chandra for important suggestions regarding the data normalisation method, Dr. Navin Sridhar for valuable suggestions in the data grouping technique and Dr. Yash Bhargava for valuable comments regarding and spectral fitting. The authors thank the referees for providing their suggestions and guidance for this work.
Data Availability
The observational data utilised in this article are publicly available at ISRO’s Science Data Archive for AstroSat Mission (https://astrobrowse.issdc.gov.in/astro_archive/archive/Home.jsp). The additional information regarding data and data analysis will be available upon reasonable request.
References
- Agrawal (2006) Agrawal P. C., 2006, Advances in Space Research, 38, 2989
- Arnaud (1996) Arnaud K. A., 1996, in Jacoby G. H., Barnes J., eds, Astronomical Society of the Pacific Conference Series Vol. 101, Astronomical Data Analysis Software and Systems V. p. 17
- Balucińska-Church et al. (2001) Balucińska-Church M., Barnard R., Church M. J., Smale A. P., 2001, A&A, 378, 847
- Barnes et al. (2007) Barnes A. D., Casares J., Cornelisse R., Charles P. A., Steeghs D., Hynes R. I., O’Brien K., 2007, MNRAS, 380, 1182
- Bhattacharyya (2007) Bhattacharyya S., 2007, MNRAS, 377, 198
- Bhattacharyya & Strohmayer (2006) Bhattacharyya S., Strohmayer T. E., 2006, ApJ, 642, L161
- Bhattacharyya et al. (2005) Bhattacharyya S., Strohmayer T. E., Miller M. C., Markwardt C. B., 2005, ApJ, 619, 483
- Bhattacharyya et al. (2006) Bhattacharyya S., Miller M. C., Lamb F. K., 2006, ApJ, 644, 1085
- Boirin & Parmar (2003) Boirin L., Parmar A. N., 2003, A&A, 407, 1079
- Canizares et al. (1975) Canizares C. R., et al., 1975, ApJ, 197, 457
- Chakrabarty et al. (2003) Chakrabarty D., Morgan E. H., Muno M. P., Galloway D. K., Wijnands R., van der Klis M., Markwardt C. B., 2003, Nature, 424, 42
- Courvoisier et al. (1986) Courvoisier T. J. L., Parmar A. N., Peacock A., Pakull M., 1986, ApJ, 309, 265
- D’Aì et al. (2014) D’Aì A., Iaria R., Di Salvo T., Riggio A., Burderi L., Robba N. R., 2014, A&A, 564, A62
- Díaz Trigo et al. (2009) Díaz Trigo M., Parmar A. N., Boirin L., Motch C., Talavera A., Balman S., 2009, A&A, 493, 145
- Gambino et al. (2017) Gambino A. F., Iaria R., Di Salvo T., Matranga M., Burderi L., Pintore F., Riggio A., Sanna A., 2017, Research in Astronomy and Astrophysics, 17, 108
- Griffiths et al. (1978) Griffiths R. E., Gursky H., Schwartz D. A., Schwarz J., Bradt H., Doxsey R. E., Charles P. A., Thorstensen J. R., 1978, Nature, 276, 247
- Homan (2012) Homan J., 2012, ApJ, 760, L30
- Homan et al. (1999) Homan J., Jonker P. G., Wijnands R., van der Klis M., van Paradijs J., 1999, ApJ, 516, L91
- Iaria et al. (2001) Iaria R., Di Salvo T., Burderi L., Robba N. R., 2001, ApJ, 548, 883
- Iaria et al. (2007) Iaria R., di Salvo T., Lavagetto G., D’Aí A., Robba N. R., 2007, A&A, 464, 291
- Jimenez-Garate et al. (2003) Jimenez-Garate M. A., Schulz N. S., Marshall H. L., 2003, ApJ, 590, 432
- Jonker et al. (1999) Jonker P. G., van der Klis M., Wijnands R., 1999, ApJ, 511, L41
- Jonker et al. (2000) Jonker P. G., van der Klis M., Homan J., Wijnands R., van Paradijs J., Méndez M., Kuulkers E., Ford E. C., 2000, ApJ, 531, 453
- Lewin & van der Klis (2010) Lewin W., van der Klis M., 2010, Compact Stellar X-ray Sources
- Makishima et al. (1986) Makishima K., Maejima Y., Mitsuda K., Bradt H. V., Remillard R. A., Tuohy I. R., Hoshi R., Nakagawa M., 1986, ApJ, 308, 635
- Mason et al. (1980) Mason K. O., Middleditch J., Nelson J. E., White N. E., 1980, Nature, 287, 516
- Mitsuda et al. (1984) Mitsuda K., et al., 1984, PASJ, 36, 741
- Motch et al. (1987) Motch C., Pedersen H., Beuermann K., Pakull M. W., Courvoisier T. J. L., 1987, ApJ, 313, 792
- Mukherjee & Bhattacharyya (2011) Mukherjee A., Bhattacharyya S., 2011, MNRAS, 411, 2717
- Shimura & Takahara (1995) Shimura T., Takahara F., 1995, ApJ, 445, 780
- Singh et al. (2014) Singh K. P., et al., 2014, in Takahashi T., den Herder J.-W. A., Bautz M., eds, Society of Photo-Optical Instrumentation Engineers (SPIE) Conference Series Vol. 9144, Space Telescopes and Instrumentation 2014: Ultraviolet to Gamma Ray. p. 91441S, doi:10.1117/12.2062667
- Singh et al. (2016) Singh K. P., et al., 2016, in den Herder J.-W. A., Takahashi T., Bautz M., eds, Society of Photo-Optical Instrumentation Engineers (SPIE) Conference Series Vol. 9905, Space Telescopes and Instrumentation 2016: Ultraviolet to Gamma Ray. p. 99051E, doi:10.1117/12.2235309
- Singh et al. (2017) Singh K. P., et al., 2017, Journal of Astrophysics and Astronomy, 38, 29
- Smale & Wachter (1999) Smale A. P., Wachter S., 1999, ApJ, 527, 341
- Smale et al. (2002) Smale A. P., Church M. J., Bałucińska-Church M., 2002, ApJ, 581, 1286
- Steiner et al. (2009) Steiner J. F., Narayan R., McClintock J. E., Ebisawa K., 2009, PASP, 121, 1279
- Strohmayer et al. (2003) Strohmayer T. E., Markwardt C. B., Swank J. H., in’t Zand J., 2003, ApJ, 596, L67
- Uno et al. (1997) Uno S., Mitsuda K., Aoki T., Makino F., 1997, PASJ, 49, 353
- White & Swank (1982) White N. E., Swank J. H., 1982, ApJ, 253, L61
- White et al. (1985) White N. E., Peacock A., Taylor B. G., 1985, ApJ, 296, 475
- Yadav et al. (2016) Yadav J. S., et al., 2016, ApJ, 833, 27
- van der Klis (2004) van der Klis M., 2004, arXiv e-prints, pp astro–ph/0410551
- van der Klis (2006) van der Klis M., 2006, in , Vol. 39, Compact stellar X-ray sources. pp 39–112