Effect of Burn Parameters on PAH Emissions at Conditions Relevant for Prescribed Fires
Abstract
Wildfire smoke is a health hazard as it contains a mixture of carcinogenic volatile compounds and fine particulate matter. In particular, exposure to polycyclic aromatic hydrocarbons (PAHs) is a major concern, since these compounds have been recognized as important contributors to the overall carcinogenic risk of smoke exposure. In this work, gas and particle-phase PAH emissions from the combustion of Eastern White Pine (pinus strobus) were quantified using time-of-flight mass spectrometry over a range of burn conditions representative of wildfires and prescribed fires. These experiments allow for controlling conditions of fuel moisture, heat flux, and oxygen concentration to understand their impact on PAH emissions. We find that optimal conditions for fuel moisture content of , heat load onto the sample of , and oxygen concentrations of the burn environment of can reduce the emissions of the heavy molar weight PAHs by up to 77%. Our analysis shows that the relative carcinogenic risk can be reduced by more than 50% under optimal conditions, offering a way for reducing emission exposure from forest treatment activities.
keywords:
protron-transfer-reaction time-of-flight mass spectrometry , high-resolution time-of-flight soot-particle aerosol mass spectrometry , biomass combustion , polycyclic aromatic hydrocarbon (PAH) emissions , heat load , fuel moisture content[Stanford] organization=Department of Mechanical Engineering, Stanford University, addressline=440 Escondido Mall, city=Stanford, postcode=94305, state=California, country=United States \affiliation[PULSE] organization=Stanford PULSE Institute, Department of Applied Physics, Stanford University, city=Stanford, postcode=94305, state=California, country=United States \affiliation[Aerodyne] organization=Aerodyne Research Inc., city=Billerica, postcode=01821, state=Massachusetts, country=United States \affiliation[SLAC] organization=Department of Photon Science, SLAC National Accelerator Laboratory, city=Menlo Park, postcode=94025, state=California, country=United States \affiliation[StanfordMed] organization=Sean N. Parker Center for Allergy & Asthma Research, city=Palo Alto, postcode=94304, state=California , country=United States \affiliation[Harvard] organization=Department of Environmental Health, Harvard T.H. Chan School of Public Health, city=Boston, postcode=02115, state=Massachusetts, country=United States
1 Introduction
With climate change as a major driving factor (Westerling et al., 2006), wildfires have increased in severity and frequency over the past decades (Spracklen et al., 2009) and are considered a major public health issue (Gould et al., 2024). Growing evidence suggests that extended periods of exposure to wildfire smoke cause respiratory morbidity and increased mortality (Reid et al., 2016; Gould et al., 2024). Volatile organic compounds (VOCs) are among the primary pollutants in wildfire smoke (Karl et al., 2007; Yokelson et al., 2013; Koss et al., 2018; Sekimoto et al., 2018; Jaffe et al., 2020; Majluf et al., 2022). Polycyclic aromatic hydrocarbons (PAHs) constitute a subset of organic toxins with links to cancer (Boström et al., 2002), respiratory morbidity (Godish, 2004), and suppressed immune functions (Liu et al., 2013; Hew et al., 2015). PAHs are formed during incomplete combustion and pyrolysis of biomass, and may be present in both the gas (Samburova et al., 2016) and particle-phase (Eriksson et al., 2014; Jen et al., 2019).
To mitigate the risk of severe wildfires, efforts to reduce excessive fuel buildup have been intensified in recent years (Melvin, 2020). Among the main tools for this important task are controlled and low-intensity prescribed fires, i.e., deliberate ignition of fuel to serve forest management objectives. Beyond their potential benefits to ecosystem health (Kalies and Yocom Kent, 2016), they constitute an effective approach to reduce fuel loads, specifically of surface fuels (Agee and Skinner, 2005). This forest management practice also aims at reducing the intensity and spread rate of potential future wildfires in order to facilitate their suppression (Hunter and Robles, 2020).
Prescribed fire treatments may also be viewed as a tool to mitigate harmful smoke exposure from wildfires (Kiely et al., 2024), but, in that regard, their overall effectiveness and benefits to human health and air pollution remain inconclusive (Jones et al., 2022). Despite this knowledge gap, prescribed fire activity is growing considerably: in the United States, the U.S. Forest Service has announced a 10-year plan to treat up to an additional 8 million hectares of National Forest System land by 2032 (USDA, 2022). This continues a past effort which saw an increase of the total area subjected to prescribed fire treatment from 1 to over 2.5 million hectares from 2010 – 2018, albeit with substantial variations by region, in part due to public concerns over potential negative health outcomes associated with air pollution and smoke exposure (Kolden, 2019). Therefore, to support these scaling efforts, there is an urgent need for better understanding the health impacts of such forest management practices, which are not well documented in the literature (Williamson et al., 2016; Prunicki et al., 2019; Jaffe et al., 2020; Schollaert et al., 2023).
Primary emissions from wildfires and prescribed fires depend on factors such as fuel type and conditions, fuel consumption rates, topography, and weather. An advantaged of prescribed burns is that some of these factors (e.g., fuel conditions, consumption rates, fuel moisture…) can be manipulated, controlled, or deliberately selected to some extent, which may result in reduced air pollution compared to wildfires (Liu et al., 2017). More specifically, portable devices such as incinerators offer extensive control over the combustion process compared to larger broadcast burns (Lee and Han, 2017), and may be utilized for forest management in areas where tight control over pollutant emissions is critical, such as in the vicinity of densely populated areas. These devices allow for a modulation of air flow rates, which has been observed to govern heat transfer, combustion efficiency, and consumption rates, alongside other parameters including fuel type and moisture content (Porteiro et al., 2010). Pre-burn fuel manipulation is an alternative approach to influence fire spread rates or fire line intensities during broadcast burns, which can be beneficial to dispose of thinning residue and thereby reduce the fuel bed depth when incinerators cannot be used (Piqué and Domènech, 2018).
The formation and growth of PAHs is affected by many factors at different scales, with precursors typically formed during pyrolysis (Richter and Howard, 2000). Increased aromatization is observed with increasing temperature, promoting the formation of benzene and naphthalene depending on the relative abundances of biopolymers in a given fuel sample (Sekimoto et al., 2018). Subsequent heat addition by exothermic combustion can provide sufficient energy for cyclization reactions (Frenklach and Warnatz, 1987) to form heavier PAHs. However, above a certain temperature, PAH fragmentation becomes the dominant process (Saggese et al., 2013). Partitioning between the gas and particle-phase correlates with the vapor pressure of a given compound, resulting in smaller PAHs being preferentially emitted into the gas-phase, while heavier PAHs tend to condensate onto the particle phase (Lima et al., 2005). Different oxidation pathways in the atmosphere further affect the concentrations and lifetime of PAHs (O’Dell et al., 2020), which may lead to the formation of even more harmful compounds (Albinet et al., 2008).
Laboratory-scale experiments (Jen et al., 2019), pile burns (Aurell et al., 2017), and sampling of wildfire smoke plumes (Permar et al., 2021) have underscored a prevailing negative correlation between PAH emissions and modified combustion efficiency (MCE), highlighting the influence of burning regimes (flaming vs. smoldering combustion) (Gilman et al., 2015; Kortelainen et al., 2018; Koss et al., 2018). Beyond MCE, fuel moisture content (FMC) directly affects a sample’s temperature evolution and dry time (Di Blasi et al., 2003), and is positively correlated with PAH emissions from biomass combustion (Shen et al., 2013). The fuel type also constitutes an important parameter governing PAH emissions (Jenkins et al., 1996).
Despite these efforts, substantial differences persist in reported PAH emission factors, even when considering a single fuel type (Yokelson et al., 2013; Prichard et al., 2020). As an example, the SERA database (Prichard et al., 2020), which compiles emission factors from a wide range of literature sources, reports the emission factor for phenanthrene as , with a standard deviation of 69 % across published studies which utilized laboratory burns to quantify these emissions. This is in part due to complications in precisely controlling and characterizing the burn environment. Another difficulty is controlling for PAH oxidation in the atmosphere, which affects measurements differently depending on the burn configuration of the experiment (Lima et al., 2005; Aurell et al., 2017; O’Dell et al., 2020; Juncosa Calahorrano et al., 2021). These parameters add to the uncertainties associated with assessing potential health outcomes from prescribed fires.
Our objective is thus to isolate the effect of individual parameters of the burn environment on PAH emissions, and investigate the extent to which a more optimal control of the local burn environment could offer a pathway for reducing PAH emissions in prescribed fires. We demonstrate that an optimal burn environment contributes to reducing negative health impacts from PAH exposure and is thus conducive to improving strategies for prescribed burns. We aim at reducing emissions of higher-weight PAHs identified among the U.S. Environmental Protection Agency’s (EPA) priority pollutant PAHs (Yan et al., 2004), as carcinogenic risk tends to increase with the mass of a given PAH (Boström et al., 2002).
Unlike prior studies, we precisely control the heat load and oxygen content of the combustion environment, as well as the FMC in a laboratory-scale combustor. The investigated conditions represent a subset of all possible burn conditions that are likely to occur in real prescribed fires. These parameters were intentionally chosen to create repeatable burn environments, enabling a clearer understanding of how altering a single parameter influences the resulting PAH concentration profiles. Additional factors, such as the species of biomass, can influence PAH emissions, but are not considered in the present work as they have been studied elsewhere (Jenkins et al., 1996; Koval et al., 2022). Considering both gas-phase and particle-phase data, we highlight a specific burn parameter range which minimizes overall PAH emissions. Ultimately, we discuss implications for prescribed fire activities in the wild, including their assessment in terms of overall benefits and potential health risks, as well as limitations of the present approach.
2 Materials and methods
2.1 Biomass samples
Combustion of Eastern White Pine samples (pinus strobus)–a representative fuel for the Eastern U.S.–was conducted in a tunable combustion chamber (adapted from previous work by Boigné et al. (2021)) at Aerodyne Research, Billerica, MA, USA. This fuel type will likely be affected by increased forest treatment activities, including prescribed fires, and shows comparably high PAH emissions among Eastern American fuels (Fine et al., 2001).
2.2 Experimental setup
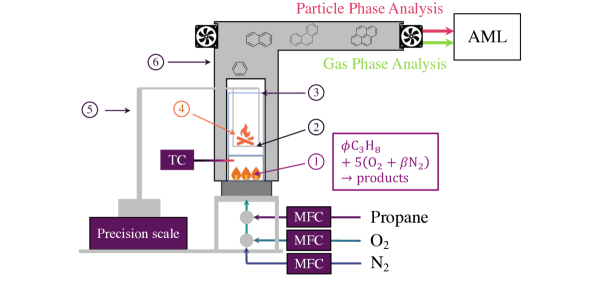
To characterize the burn emissions, the combustion chamber was interfaced with the Aerodyne Mobile Laboratory (AML, see Fig. 1), the details of which have been described elsewhere (Kolb et al., 2004; Herndon et al., 2005). Briefly, the AML is a truck outfitted with atmospheric and aerosol spectrometers, including a proton-transfer time-of-flight mass spectrometer (PTR-ToF-MS, henceforth Vocus) to analyze VOCs in the gas phase. Particle-phase aerosols are characterized by a High-Resolution Time-of-Flight Soot-Particle Aerosol Mass Spectrometer (HR-ToF-SP-AMS (DeCarlo et al., 2006; Canagaratna et al., 2007)).
Unlike other experiments that investigate emissions from multiple fuel types at fixed burn conditions, we hold the fuel type constant to observe the effect of the burn environment on PAH emissions. In suspending individual biomass samples (labeled as (4) in Fig. 1) in a homogeneous stream of oxygen-deprived gases originating from a tunable premixed \ceC3H8/\ceO_2/\ceN_2 matrix flame (1), we have direct control over heat flux and -depletion of the flow around the sample, emulating fire conditions in a well-controlled and repeatable burn environment. This is achieved by independently adjusting the equivalence ratio and the oxygen dilution ratio of the premixed matrix flame to yield the desired heat flux and -depletion. The flow rates of \ceC_3H_8, \ceO_2, and \ceN_2 were controlled independently.
Additionally, fuel moisture content was modulated prior to combustion by pre-drying the samples in an oven. These three parameters constitute the burn environment that was selected through high-coverage sampling of the three-dimensional parameter space. The specific heat flux from the oxygen-deprived gas stream of \ceC_3H_8/\ceO_2/\ceN_2 combustion onto the sample was varied between , in a range representative of realistic fires (Silvani and Morandini, 2009; Cruz et al., 2011; Frankman et al., 2013). The oxygen concentration was varied between , and fuel moisture content (FMC) was varied between (based on the undried sample weight). The flow velocity around the sample was held constant. A total of 23 samples were burned (sample length: , diameter: ). The sample size was dictated by the burner diameter () and the weight limit of the scale. Each burn took approximately 5 – 10 minutes to proceed to completion, which was defined as the state at which the measured mass loss rate reached zero. Because of the high sensitivity of the utilized instruments for gas and particle-phase characterization, the exhaust stream was diluted with ambient air as it passed through an exhaust pipe () from which emissions were sampled by the AML.
2.3 Instrumentation
2.3.1 Gas-phase analysis
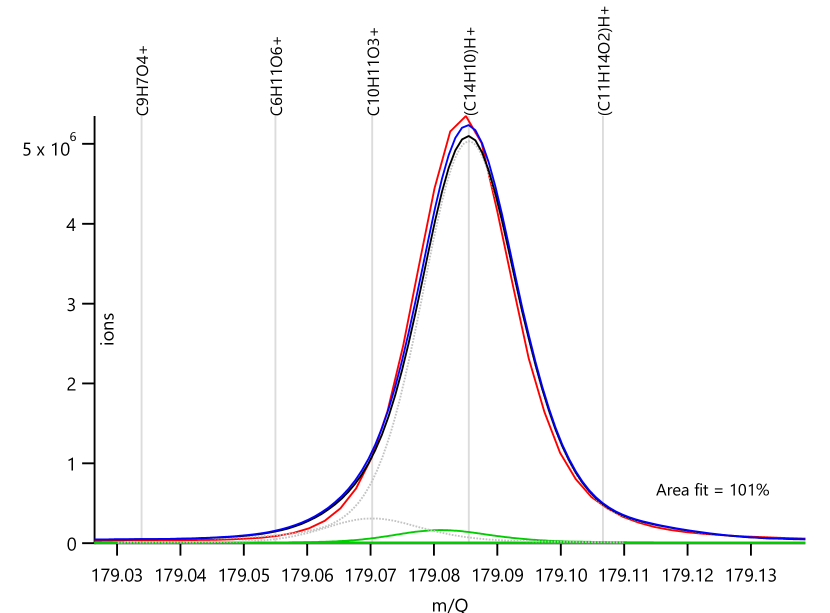
The Vocus employed a high-resolution ToF mass analyzer (Aerodyne Research Inc., USA, and TofWerk, Switzerland) at a mass resolution of greater than FWHM , and a temporal resolution of . The time-resolved mass spectra were analyzed using Tofware v3.3.0 (Stark et al., 2015) with IgorPro v9.0.2.4. Automated calibrations were performed every with a reference mixture of VOCs taken from a calibration tank (Apel-Riemer Environmental Inc, Broomfield, CO), while instrument backgrounds were taken by overflowing the Vocus inlet with ultra-zero air. Calibration factors for molecules in the calibration tank were inferred through correlation of their concentrations to ion intensities of the calibration periods. In turn, calibration factors for the PAHs were estimated using a correlation with their respective reaction rate constant with (Zhao and Zhang, 2004; Sekimoto et al., 2017), and subsequent normalization to the calibration factor of . An example of the fully constrained peak fit is shown in Fig. 1 for , which we have tentatively identified as phenanthrene/anthracene (PH/AN).
For each burn condition, corresponding background measurements were taken with the \ceC_3H_8/\ceO_2/\ceN_2 flame ignited, but without a biomass sample. PAH emissions from the \ceC_3H_8/\ceO_2/\ceN_2 were at least one order of magnitude lower than emissions during biomass combustion, and deemed negligible. The modified combustion efficiency (Ward and Radke, 1993), , was obtained from background-subtracted measurements via tunable infrared laser differential absorption spectroscopy (TILDAS) (McManus et al., 2011). Finally, we computed burn-averaged concentrations for each PAH to investigate how a changing burn environment affects the mean emission of a given PAH. For three characteristic burn conditions (discussed later), we also present a particle-phase analysis. Due to varying dilution of the burn emissions with ambient air, we report PAH concentrations normalized to benzene to compare emissions from different burns (see Sec. 3.1).
2.3.2 Particle-phase analysis
An Aerodyne Soot Particle Aerosol Mass Spectrometer (SP-AMS) measured the size () and bulk chemical composition of sub-micrometer non-refractory particulate matter and black carbon. Details of the SP-AMS are described elsewhere (Lee et al., 2015; Onasch et al., 2012; Willis et al., 2016). Briefly, aerosols are sampled with a volumetric flow rate of and focused into a narrow beam by an aerodynamic particle focusing lens. Particle sizing was determined as particles pass a chopper when the AMS was in particle time-of-flight (PToF) mode. Non-refractory organics, nitrate, sulfate, ammonium, and chloride were vaporized by surface impaction on a heater at . Refractory black carbon-containing particles were heated and vaporized by passing through a laser beam reaching temperatures exceeding . Once vaporized, resulting gas phase molecules were ionized with 70 eV electron impact ionization. Ions formed were detected by a time-of-flight mass spectrometer. The AMS was typically run in Fast Mass Spec (FMS) mode, producing time-resolved mass concentrations () for organics, nitrate, sulfate, ammonium, chloride, and black carbon. The SP-AMS was operated in FMS primarily with a PToF sizing mode interval occurring occasionally. A PM2.5 inlet was installed on this SP-AMS allowing for the detection of larger particles relative to the standard lens typically used with the AMS. The inlet from the front of the AML to the SP-AMS had a flow rate of 5 LPM with a residence time in the inlet of approximately .
2.4 Computation of heat fluxes onto the samples
The heat flux from the oxygen-deprived hot gas stream onto the sample is computed as a “gauge heat flux” (the amount of energy that would be absorbed if the sample was cold):
| (1) |
where denotes the temperature of the gas stream resulting from \ceC_3H_8/\ceO_2/ \ceN_2 combustion, and the initial temperature of the sample, assumed to be . The heat transfer coefficient is determined as
| (2) |
using the thermal conductivity of the gas and the diameter of the sample (assumed to be cylindrical). The Nusselt number, Nu, is obtained from a standard correlation (Bergman et al., 2011) for cylindrical objects as a function of the flow Reynolds number Re inside the combustion chamber and the Prandtl number Pr of the gas stream. We compute bulk gas properties with Cantera (Goodwin et al., 2022) using the GRI3.0 mechanism (Smith et al., 1999) for each burn condition to determine the gas stream’s density , its viscosity , Pr, and temperature at equilibrium. With the flow velocity defined as we evaluate the flow Reynolds number , and ultimately obtain the Nusselt number as (Bergman et al., 2011)
| (3) |
Note that the mass flux and the cross-sectional area where held constant for all conditions.
2.5 Estimation of carcinogenic risk
The estimated risk of developing lung cancer from inhalation of PAHs in the atmosphere can be computed based on an approach proposed by the World Health Organization (WHO) (WHO, 2010). Benzo(a)pyrene (B[a]P) is used as a surrogate for PAHs, since it has been extensively studied in the literature and is considered carcinogenic to humans (WHO, 2010): chronic exposure to B[a]P over a lifetime of 70 years is associated with a unit risk (UR) of (in units ), implying that 8.7 out of people may develop lung cancer from this exposure level. However, estimating the carcinogenic risk of PAH mixtures is less well established. A common approach relies on assessing the potency of PAHs relative to B[a]P (e.g., Ramírez et al. (2011)). Similar to the calculation by the WHO, we thus estimate the lifetime carcinogenic risk as:
| (4) |
where are individual (dimensionless) concentrations of PAHs normalized to benzene, and denotes the toxic equivalent factor (TEF) for a given PAH relative to B[a]P (Ramírez et al., 2011). By definition, B[a]P has a TEF of one, while other PAHs may have a fractional (lower potency compared to B[a]P) or larger (higher potency) value. Further, we assume that the cancer risk of PAH mixtures is additive. Using the TEFs proposed by Nisbet and LaGoy (1992) (see Tab. 1), we obtain a relative carcinogenic risk of the sampled wildfire smoke in units , since we use PAH concentrations that are normalized to benzene. Ultimately, we divide the resulting relative carcinogenic risk by its maximum value to obtain a normalized, and dimensionless carcinogenic risk.
| Compound | Abbreviation | TEF |
|---|---|---|
| Naphthalene | NAP | 0.001 |
| Acenaphthylene | ACY | 0.001 |
| Acenaphthene | ACE | 0.001 |
| Fluorene | FLE | 0.001 |
| Phenanthrene/Anthracene | PH/AN | 0.001 |
| Pyrene/Fluoranthene | PY/FLA | 0.001 |
| Benz(a)anthracene/Chrysene | B[a]A/CHR | 0.1 |
| Benzo(b)fluoranthene/Benzo(a)pyrene | B[b]F/B[a]P | 1 |
3 Results
3.1 Gas-phase analysis
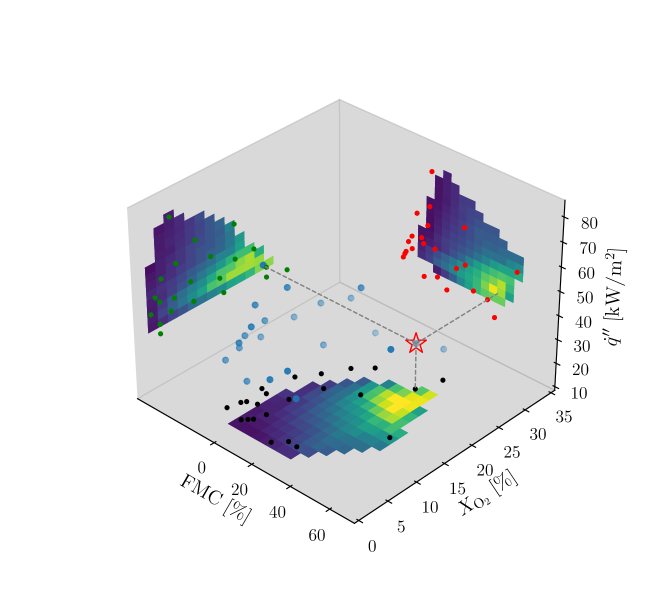
All fuel samples considered in this work are visualized as blue circular markers in Fig. 2 as a function of their local burn conditions.
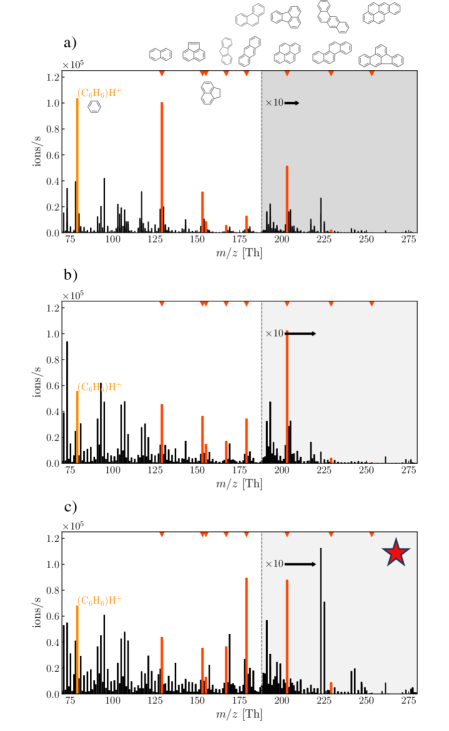
For each burn, a burn-averaged mass spectrum is computed, from which average PAH concentrations are subsequently extracted. The burn-averaged gas-phase mass spectra for three samples with distinctly different burn environments are shown in Fig. 3. We refer to Tab. 2 for a specification of their burn conditions.
| Sample | FMC | ||
|---|---|---|---|
| A | 14.3 | 3.7 | 80.2 |
| B | 33.6 | 14.4 | 63.9 |
| C | 44.0 | 19.8 | 39.0 |
A major part of the detected peaks can be associated with VOCs typically observed during biomass burns (Koss et al., 2018). For the purpose of this work, however, we intentionally limit our gas-phase analysis to individual peaks between (highlighted bars in the mass spectrum of Fig. 3) which we have tentatively identified as compounds listed in Tab. 3 (Koss et al., 2018).
| Peak | Ion formula | Main VOC contributor | Abbreviation |
|---|---|---|---|
| Benzene | |||
| Naphthalene | NAP | ||
| Acenaphthylene | ACY | ||
| Acenaphthene | ACE | ||
| Fluorene | FLE | ||
| Phenanthrene/Anthracene | PH/AN | ||
| Pyrene/Fluoranthene | PY/FLA | ||
| Benz(a)anthracene/Chrysene | B[a]A/CHR | ||
| Benzo(b)fluoranthene/ | B[b]F/B[a]P | ||
| Benzo(a)pyrene |
Except for benzene, these compounds are considered as Priority PAHs by the U.S. EPA (Yan et al., 2004). Note that the Vocus does not differentiate between isomers at a given peak, thus we assume that all isomers contribute to the total ion count at their corresponding . We will henceforth refer to the detected ions by their assumed VOC contributor (Koss et al., 2018).
A distinct pattern can be observed across most burn-averaged spectra when comparing concentrations of individual PAHs for a given burn environment: emission profiles are dominated by NAP and PH/AN (among the considered PAHs), reaching averaged intensities that are of the same order of magnitude as benzene under most conditions, as illustrated for samples B and C (Fig. 3b and c). For the remaining PAHs, intensities decrease with increasing values, with ACY, ACE, FLE showing consistently lower concentrations relative to benzene than the more stable NAP, PH/AN. For and above, ion intensities in the gas-phase are very low and virtually indistinguishable from background noise. In turn, sample A deviates from this pattern, as NAP is found to be most dominant compared to all other PAHs. Note, however, that ion counts for a single PAH cannot be compared directly across different burn conditions (represented by the spectra in Fig. 3), since the dilution with ambient air is not kept constant for each burn. Therefore, we normalize PAH concentrations with benzene concentrations of the same burn (similar to the approach by O’Dell et al. (2020)), before comparing burn-to-burn variations of PAH emissions. This procedure facilitates an unbiased evaluation of a given burn environment in terms of the generated PAH emissions, and can further aid an assessment of potential health risks. We compared benzene normalization to HCN normalization which did not change our conclusions.
In Fig. 4, we investigate whether normalized PAH concentrations correlate with the instantaneous MCE as an overall characterization of the combustion process. Each bar is obtained by averaging the emissions from all samples that fall into a given bin (bin width is of the indicated value).
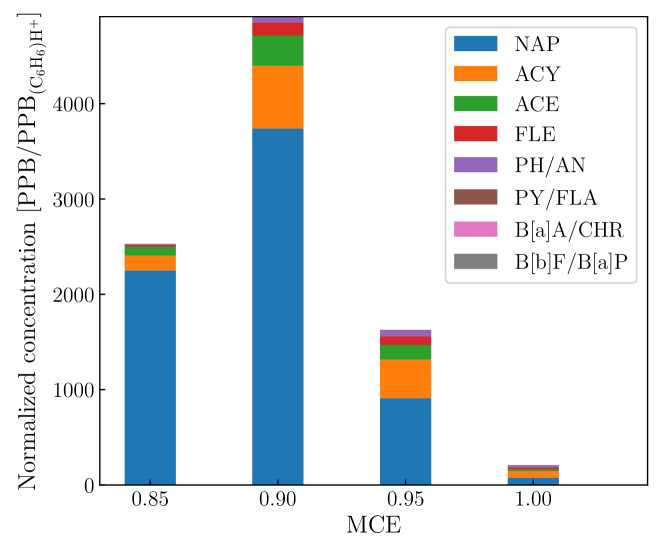
Highest PAH concentrations are found during periods of low MCE values (i.e., ) at the beginning of each burn, suggesting that a predominantly smoldering combustion regime enhances PAH formation.
In general, precursors for PAH formation are formed during pyrolysis, in reactions that occur within a temperature range of (Anca-Couce, 2016). Despite the much higher burn environment temperatures considered in this study (), the pyrolysis process may be characterized by the thermally thick regime (Anca-Couce, 2016) due to comparably large sample diameters and large Biot numbers (). Therefore, the reaction rate of pyrolysis is controlled by internal heat transfer, which we can influence by controlling the heat load onto a sample.
Increasing the pyrolysis temperature by increasing the heat load onto the sample enhances aromatization of pyrolyzates (Sekimoto et al., 2018), contributing to the generation of light cyclic hydrocarbons such as benzene and NAP. The thermally thick regime also promotes the formation of tars (Bennadji et al., 2013) containing important precursors, such as phenyl radicals (Liu et al., 2019), from which higher-weight PAHs can be formed. Finally, the subsequent combustion process of the pyrolizate critically impacts the fate of the initial products depending on the chemical reaction pathways (Wang, 2011) controlling the growth of hydrocarbons. Therefore, we anticipate PAH emissions to be primarily governed by (i) the heat load onto the sample, and (ii) the combustion temperature indirectly controlled by the sample’s FMC.
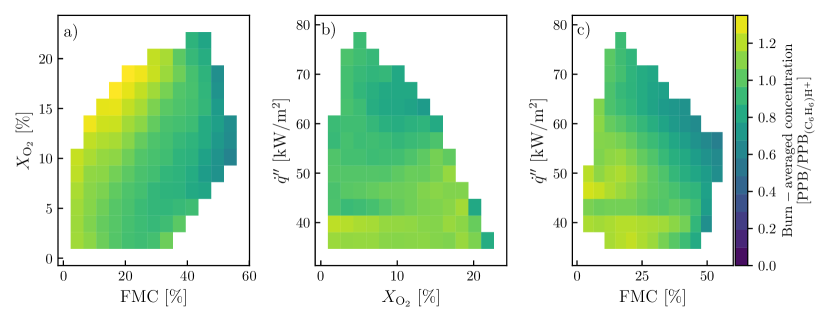
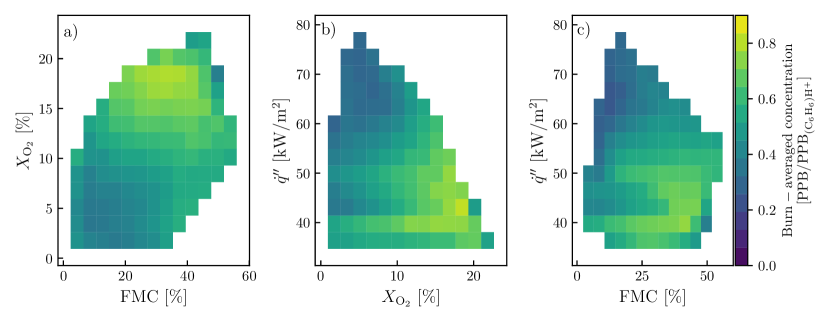
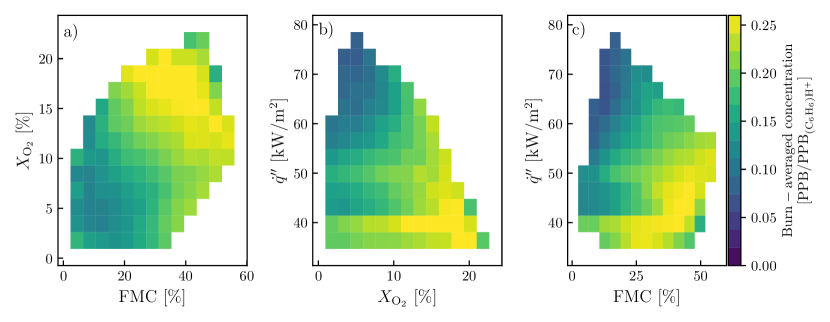
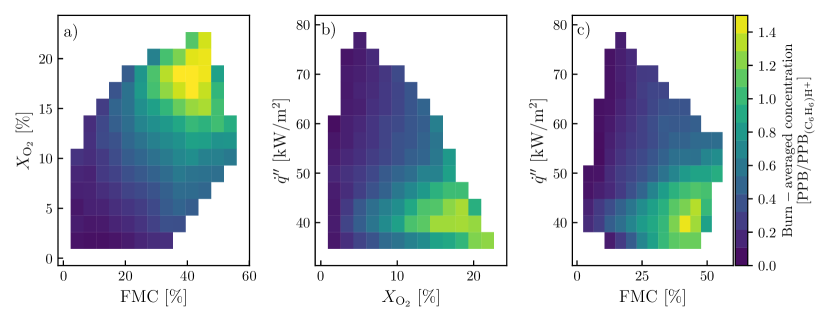
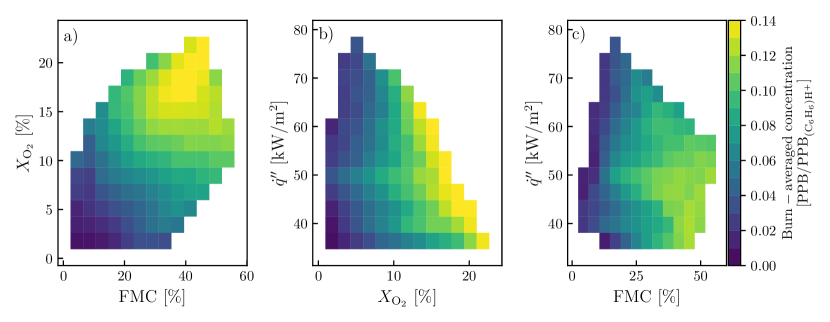
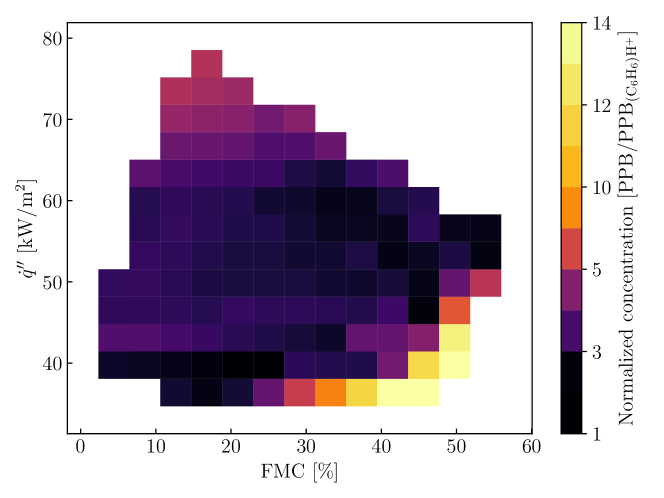
To reveal the effect of these parameters on resulting PAH concentrations we compute “emission maps” as follows: for each PAH, we compute normalized burn-averaged concentrations as a function of the corresponding burn conditions. We then project the concentrations onto a two-dimensional parameter sub-space given by vs. , vs. FMC, and FMC vs. , corresponding to the projected green, red and black markers in Fig. 2, respectively, to facilitate our analysis. Ultimately, the emission maps are obtained by interpolating the projected data. We focus on PH/AN in Fig. 5 for clarity, although very similar patterns can be observed for ACY to PY/FLA (see Fig. 2 to 6). From a health perspective, PH exposure deserves particular attention as it alters the immunologic response (Liu et al., 2013).

From Fig. 5, we first observe that the burn-averaged emissions of PH/AN span a range of 76:1 within the parameter space considered in our work. The effect of FMC, heat flux, and oxygen deprivation on PAH emissions therefore appears to be significantly stronger than the more widely studied effect of fuel type: Jenkins et al. (1996) report a factor of 2 across 4 species of woody biomass studied, while Fine et al. (2001) observed a variation by a factor of 8 across 6 species.
Inspecting the burn-averaged emissions as a function of the heat flux onto the sample and FMC (Fig. 5c), two distinct regions become apparent: tends to enhance PH/AN (relative to benzene) if the heat flux remains sufficiently low (), suggesting competing effects between both parameters. In this regime, a high FMC leads to lower combustion temperatures due to evaporation, attenuating PAH fragmentation (Wang, 2011), and thus enhancing the generation of higher-weight PAHs from their precursors. Conversely, an augmented heat flux to the sample () resulting in faster evaporation and stronger fragmentation substantially reduces the concentrations of higher-weight PAHs relative to benzene. This suggests that burn environments with a heat flux greater than are beneficial for attenuating normalized emissions of PH/AN by 77% compared to burn environments characterized by lower heat fluxes. A similar trend is also observed for the remaining PAHs, albeit with a lower emission reduction (see B).
At FMC below 20%, the impact of evaporation becomes weaker within the explored parameter range. Consequently, high heat loads lead to a reduced formation of larger PAHs from their pyrolysis precursors. NAP (see Fig. 1) deviates from the trends described above, exhibiting the least variability across the explored parameter range. Its formation is likely facilitated by the abundance of benzene originating from pyrolysis.
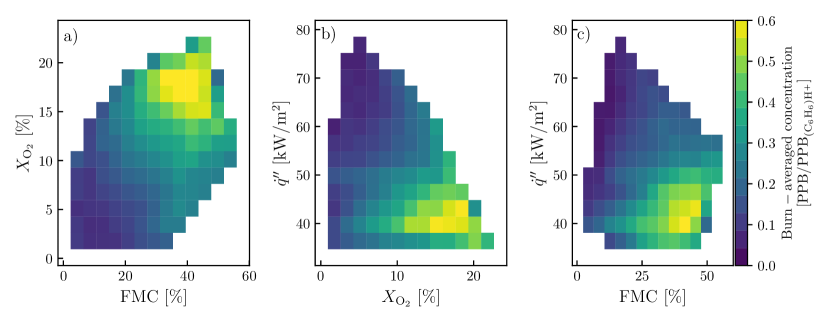
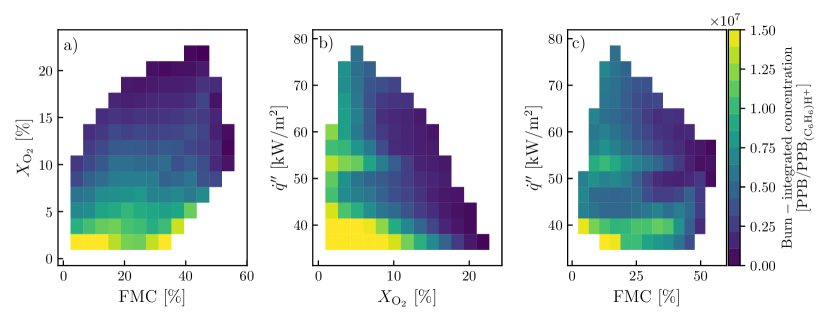
Apart from the effect of FMC, other mechanisms could be invoked to explain the decrease of PAH emissions with increasing heat load. Figure 6 shows the concentration of acetylene (, measured using TILDAS, normalized to benzene), exhibiting a distinct peak at high FMC and low heat loads, which coincides with the high-emission region of ACY and higher molar weight PAHs, i.e., and . Acetylene is a pyrolysis product (Martin et al., 2022) and may form in significant quantities during biomass pyrolysis (Zhang et al., 2007) at temperatures above . Since the presence of acetylene may facilitate the formation and growth of PAHs (Frenklach et al., 1985), it can also explain the observed peak PAH emissions in this region. Moreover, normalized concentrations reach a minimum at intermediate heat loads, but increase again at . This region of increased concentrations could explain observed particle-phase emission patterns discussed in the following section.
3.2 Particle-phase analysis
A significant fraction of the PAHs condensates onto the particle-phase, which must therefore be studied alongside the gas-phase to provide a comprehensive assessment of PAH emissions in a given burn environment. This is particularly true for higher molecular weight PAHs (Lima et al., 2005). Thus, for samples A, B, and C, corresponding to low, intermediate, and high FMC (see Tab. 2), we investigated particle-phase compositions with HR-ToF-SP-AMS. Concentrations normalized to gas-phase benzene are shown in Fig. 7.
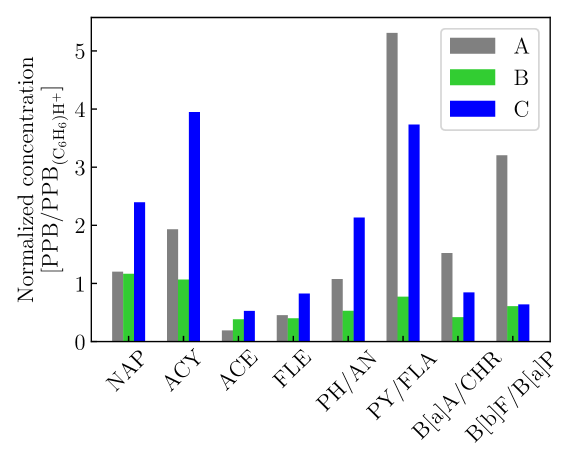
Two major conclusions can be drawn: (i) normalized signal intensities of PY/FLA and higher molar weight PAHs are at least one order of magnitude larger compared to their gas-phase counterparts (for sample C: 3.68 PPB/PPB in the particle-phase, Fig. 7, versus 0.16 PPB/PPB in the gas phase, Fig. 6), indicating that these compounds are formed during the combustion process, but tend to condensate onto the particle phase unlike low molar weight PAHs; (ii) concentrations of particle-phase PAHs are noticeably low at intermediate fuel moisture (sample B), but increase towards lower FMC (sample A), as well as higher FMC (sample C).
4 Discussion
4.1 Implications for selecting an optimal burn environment based on carcinogenic risk
The combined gas-phase and particle-phase PAH emission data allows us to evaluate burn environments in terms of overall PAH emissions and expected health impacts from smoke inhalation.
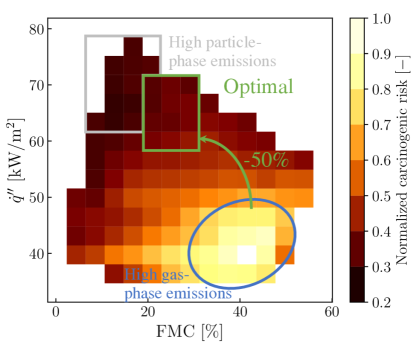
As detailed in Sec. 2.5, we have converted the gas-phase PAH emissions from all samples into a normalized carcinogenic risk (see contour plot in Fig. 8) to aid the selection of an optimal burn environment. The region at and shows the overall highest carcinogenic risk within the explored parameter range (blue ellipse in Fig. 8), associated with peak emissions of the investigated gas-phase PAHs. Since burn environments in this region also promote high particle-phase PAH concentrations (inferred from sample C, see Fig. 7), they are expected to be most concerning from a health perspective. In turn, while the formation of most gas-phase PAHs is attenuated at low FMC and high heat flux (grey rectangle in Fig. 8), this regime should be avoided due to its elevated particle-phase emissions (inferred from sample A). This leaves an optimal parameter range for the burn environment found within , (see green rectangle in Fig. 8), and an oxygen concentration between and for the considered fuel species. Burn environments within this parameter range simultaneously achieve low gas and particle-phase (inferred from sample B) emissions, which could contribute to reducing the carcinogenic risk associated with inhalation of PAHs from prescribed fires. Other factors not considered in our idealized setup could however alter the above parameter range, the resulting carcinogenic risk, or both. Future studies should therefore investigate the parametric sensitivities of additional factors affecting PAH formation, with the present work being a first step in that direction.
Despite these limitations, the present approach can aid a more comprehensive evaluation of benefits of a planned prescribed fire activity by including expected PAH emissions as an additional criterion, alongside variations in the local burn environment. Similarly, if burn conditions are expected to be outside the optimal parameter range, additional pre-burn fuel manipulation could be considered to perform the prescribed burn at more desirable conditions. Our insights could further influence the selection of the most appropriate treatment (e.g., broadcast burn, pile burn, or pit burners), since different burn types offer a varying degree of control over the burn environment.
Although larger broadcast burns offer the least amount of direct control over the resulting burn environment, burn parameters may still be adjusted through indirect measures: weather forecasts can provide sufficiently accurate FMC data, allowing to plan the day-of-burn when fuel moisture is expected to be within the optimal parameter range. This is already today an established procedure for planning prescribed fires and mitigating fire escape (Hardy et al., 2001). The heat flux onto the fuel could be affected more indirectly by altering the available fuel density through appropriate pre-burn manipulation attempting to change the fuel arrangement or size with mechanical tools (Piqué and Domènech, 2018). These measures may also be beneficial for ensuring a sufficient oxygen flux into the burn environment.
If broadcast burns are deemed unfeasible or unsafe, pile burns could be considered as an alternative as they can increase the degree of control over the burn environment, as demonstrated by e.g., Aurell et al. (2017). Prior to pile burning, fuel is often processed by mechanical or power tools to generate the desired fuel arrangement and size, and thereby more directly the resulting heat flux during the burn.
Lastly, mobile applications such as pit burners (Miller and Lemieux, 2007), incinerators, or air-curtain burners (Lee and Han, 2017) offer the highest degree of control over the burn environment as they closely resemble the laboratory-scale burner presented in this work. This type of burn would be most attractive in the vicinity of densely populated areas, where excessive air pollution should be avoided to the maximum extent possible in those areas.
4.2 Limitations of the present work
Although the above recommendations offer considerable reductions of expected PAH emissions, they should not be considered in an isolated manner or as sole criterion to evaluate the benefits of planned prescribed fire activities. We have intentionally limited our study to a subset of carcinogenic air pollutants to observe the effect of the burn environment on expected concentration levels. Other pollutants with negative health outcomes have not been considered in the present work, and optimal burn conditions for minimal PAH emissions do not necessarily coincide with optimal conditions for other pollutants. Further studies are needed to investigate the emission behavior of other pollutants as a function of the underlying burn environment.
Apart from the inherent health risk, other social factors not discussed in this work should be included in the overall evaluation of prescribed burns. We reiterate that prescribed fire activities contribute to air pollution and may expose some parts of the population to unhealthy air quality more often than others due to socio-economic factors (Afrin and Garcia-Menendez, 2021). However, prescribed burns are commonly planned several days or weeks in advance and timely alerts can be issued to affected communities, alongside recommendations to stay indoors, wear masks, or pursue active measures to improve indoor air quality (Liang et al., 2021).
5 Conclusions
Prescribed fire activity constitutes an important cornerstone of forest management and wildfire risk mitigation. In light of an increased use of controlled burns, populations are more likely to be exposed to unhealthy levels of air pollution, highlighting the need to improve our understanding of potential health risks arising from toxic and carcinogenic pollutants found in the smoke of biomass combustion. Thus, we have performed laboratory-scale burns of Eastern White Pine under relevant burn conditions to demonstrate that an optimal burn environment can reduce pollutant emissions and thereby limit negative health outcomes. We have focused our analysis on polycyclic aromatic hydrocarbons (PAHs), which have significant detrimental health impacts. Further, there remains significant variability in their emission levels from biomass combustion reported in the literature.
Our well-controlled laboratory-scale combustor setup allows for independent variation of the heat load onto the sample, oxygen concentration in the burn environment, and sample fuel moisture content. Gas-phase burn emissions were sampled via a time-resolved proton-transfer time-of-flight mass spectrometer (PTR-ToF-MS), while particle-phase emissions were characterized by a High-Resolution Time-of-Flight Soot-Particle Aerosol Mass Spectrometer (HR-ToF-SP-AMS).
Our results suggest that the sample fuel moisture content, the heat load onto the sample, and the oxygen concentration in the burn environment have a very significant impact on the emission levels of PAHs, with emissions of phenanthrene varying over a span of 76:1 in our experiments. This observed variability is an order of magnitude larger than the variability originating from the species of biomass in Jenkins et al. (1996) or Fine et al. (2001). Burns conducted within the optimal burn parameter range have the potential to reduce normalized emissions by up to 77%, corresponding to a reduction of the normalized carcinogenic risk by more than 50%. We then discuss viable strategies to apply our findings in real-world scenarios within the limitations of other factors, which we have not varied in this work. Future work will focus on extending the present methodology to other types of fuels.
Acknowledgements
Financial support through the Stanford Sustainability Accelerator, the Google Research Scholar program, and the Moore Foundation is gratefully acknowledged. MFK’s work at SLAC is supported by the U.S. Department of Energy, Office of Science, Basic Energy Sciences, Scientific User Facilities Division, under Contract No. DE-AC02-76SF00515. The authors thank Andrew Lambe, Megan Claflin, and Brian Lerner (Aerodyne Research) for their support during the experiment and helpful discussions.
References
- Afrin and Garcia-Menendez (2021) Afrin, S., Garcia-Menendez, F., 2021. Potential impacts of prescribed fire smoke on public health and socially vulnerable populations in a Southeastern U.S. state. Sci. Total Environ. 794, 148712.
- Agee and Skinner (2005) Agee, J.K., Skinner, C.N., 2005. Basic principles of forest fuel reduction treatments. For. Ecol. Manage. 211, 83–96.
- Albinet et al. (2008) Albinet, A., Leoz-Garziandia, E., Budzinski, H., Villenave, E., Jaffrezo, J.L., 2008. Nitrated and oxygenated derivatives of polycyclic aromatic hydrocarbons in the ambient air of two French alpine valleys Part 1: Concentrations, sources and gas/particle partitioning. Atmos. Environ. 42, 43–54.
- Anca-Couce (2016) Anca-Couce, A., 2016. Reaction mechanisms and multi-scale modelling of lignocellulosic biomass pyrolysis. Prog. Energy Combust. Sci. 53, 41–79.
- Aurell et al. (2017) Aurell, J., Gullett, B.K., Tabor, D., Yonker, N., 2017. Emissions from prescribed burning of timber slash piles in Oregon. Atmos. Environ. 150, 395–406.
- Bennadji et al. (2013) Bennadji, H., Smith, K., Shabangu, S., Fisher, E.M., 2013. Low-temperature pyrolysis of woody biomass in the thermally thick regime. Energy Fuels 27, 1453–1459.
- Bergman et al. (2011) Bergman, T.L., Incropera, F.P., Dewitt, D.P., Lavine, A.S., 2011. Fundamentals of Heat and Mass Transfer. John Wiley & Sons.
- Boigné et al. (2021) Boigné, E., Bennett, N.R., Wang, A., Mohri, K., Ihme, M., 2021. Simultaneous in-situ measurements of gas temperature and pyrolysis of biomass smoldering via X-ray computed tomography. Proc. Combust. Inst. 38, 3899–3907.
- Boström et al. (2002) Boström, C.E., Gerde, P., Hanberg, A., Jernström, B., Johansson, C., Kyrklund, T., Rannug, A., Törnqvist, M., Victorin, K., Westerholm, R., 2002. Cancer risk assessment, indicators, and guidelines for polycyclic aromatic hydrocarbons in the ambient air. Environ. Health Perspect. 110, 451–488.
- Canagaratna et al. (2007) Canagaratna, M., Jayne, J., Jimenez, J., Allan, J., Alfarra, M., Zhang, Q., Onasch, T., Drewnick, F., Coe, H., Middlebrook, A., Delia, A., Williams, L., Trimborn, A., Northway, M., DeCarlo, P., Kolb, C., Davidovits, P., Worsnop, D., 2007. Chemical and microphysical characterization of ambient aerosols with the Aerodyne aerosol mass spectrometer. Mass Spec. Rev. 26, 185–222.
- Cruz et al. (2011) Cruz, M.G., Butler, B.W., Viegas, D.X., Palheiro, P., 2011. Characterization of flame radiosity in shrubland fires. Combust. Flame 158, 1970–1976.
- DeCarlo et al. (2006) DeCarlo, P.F., Kimmel, J.R., Trimborn, A., Northway, M.J., Jayne, J.T., Aiken, A.C., Gonin, M., Fuhrer, K., Horvath, T., Docherty, K.S., Worsnop, D.R., Jimenez, J.L., 2006. Field-deployable, high-resolution, time-of-flight aerosol mass spectrometer. Anal. Chem. 78, 8281–8289.
- Di Blasi et al. (2003) Di Blasi, C., Branca, C., Sparano, S., Mantia, B.L., 2003. Drying characteristics of wood cylinders for conditions pertinent to fixed-bed countercurrent gasification. Biomass Bioenergy 25, 45–58.
- Eriksson et al. (2014) Eriksson, A.C., Nordin, E.Z., Nyström, R., Pettersson, E., Swietlicki, E., Bergvall, C., Westerholm, R., Boman, C., Pagels, J.H., 2014. Particulate PAH emissions from residential biomass combustion: Time-resolved analysis with Aerosol Mass Spectrometry. Environ. Sci. Technol. 48, 7143–7150.
- Fine et al. (2001) Fine, P.M., Cass, G.R., Simoneit, B.R.T., 2001. Chemical characterization of fine particle emissions from fireplace combustion of woods grown in the Northeastern United States. Environ. Sci. Technol. 35, 2665–2675.
- Frankman et al. (2013) Frankman, D., Webb, B.W., Butler, B.W., Jimenez, D., Forthofer, J.M., Sopko, P., Shannon, K.S., Hiers, J.K., Ottmar, R.D., 2013. Measurements of convective and radiative heating in wildland fires. Int. J. Wildland Fire 22, 157.
- Frenklach et al. (1985) Frenklach, M., Clary, D.W., Gardiner, W.C., Stein, S.E., 1985. Detailed kinetic modeling of soot formation in shock-tube pyrolysis of acetylene. Symp. Int. Combust. 20, 887–901.
- Frenklach and Warnatz (1987) Frenklach, M., Warnatz, J., 1987. Detailed modeling of PAH profiles in a sooting low-pressure acetylene flame. Combust. Sci. Technol. 51, 265–283.
- Gilman et al. (2015) Gilman, J.B., Lerner, B.M., Kuster, W.C., Goldan, P.D., Warneke, C., Veres, P.R., Roberts, J.M., De Gouw, J.A., Burling, I.R., Yokelson, R.J., 2015. Biomass burning emissions and potential air quality impacts of volatile organic compounds and other trace gases from fuels common in the US. Atmos. Chem. Phys. 15, 13915–13938.
- Godish (2004) Godish, T., 2004. Air Quality. 4th ed., Lewis Publishers, Boca Raton.
- Goodwin et al. (2022) Goodwin, D.G., Moffat, H.K., Schoegl, I., Speth, R.L., Weber, B.W., 2022. Cantera: An object-oriented software toolkit for chemical kinetics, thermodynamics, and transport processes. https://www.cantera.org, Version 2.6.0.
- Gould et al. (2024) Gould, C.F., Heft-Neal, S., Johnson, M., Aguilera, J., Burke, M., Nadeau, K., 2024. Health effects of wildfire smoke exposure. Ann. Rev. Med. 75, 277–292.
- Hardy et al. (2001) Hardy, C.C., Ottmar, R.D., Peterson, J.L., Core, J.E., Seamon, P., 2001. Smoke management guide for prescribed and wildland fire. Technical Report. Fire Use Working Team, National Wildfire Coordination Group, U.S.A.
- Herndon et al. (2005) Herndon, S.C., Jayne, J.T., Zahniser, M.S., Worsnop, D.R., Knighton, B., Alwine, E., Lamb, B.K., Zavala, M., Nelson, D.D., McManus, J.B., Shorter, J.H., Canagaratna, M.R., Onasch, T.B., Kolb, C.E., 2005. Characterization of urban pollutant emission fluxes and ambient concentration distributions using a mobile laboratory with rapid response instrumentation. Faraday Discuss. 130, 327.
- Hew et al. (2015) Hew, K.M., Walker, A.I., Kohli, A., Garcia, M., Syed, A., McDonald-Hyman, C., Noth, E.M., Mann, J.K., Pratt, B., Balmes, J., Hammond, S.K., Eisen, E.A., Nadeau, K.C., 2015. Childhood exposure to ambient polycyclic aromatic hydrocarbons is linked to epigenetic modifications and impaired systemic immunity in T cells. Clin. Exp. Allergy 45, 238–248.
- Hunter and Robles (2020) Hunter, M.E., Robles, M.D., 2020. Tamm review: The effects of prescribed fire on wildfire regimes and impacts: A framework for comparison. For. Ecol. Manage. 475, 118435.
- International Agency for Research on Cancer (2010) International Agency for Research on Cancer, 2010. Some non-heterocyclic polycyclic aromatic hydrocarbons and some related occupational exposures. volume 92 of IARC Monographs on the Evaluation of Carcinogenic Risks to Humans. IARC Press ; Distributed by World Health Organization, Lyon, France.
- Jaffe et al. (2020) Jaffe, D.A., O’Neill, S.M., Larkin, N.K., Holder, A.L., Peterson, D.L., Halofsky, J.E., Rappold, A.G., 2020. Wildfire and prescribed burning impacts on air quality in the United States. J. Air Waste Manag. Assoc. 70, 583–615.
- Jen et al. (2019) Jen, C.N., Hatch, L.E., Selimovic, V., Yokelson, R.J., Weber, R., Fernandez, A.E., Kreisberg, N.M., Barsanti, K.C., Goldstein, A.H., 2019. Speciated and total emission factors of particulate organics from burning western US wildland fuels and their dependence on combustion efficiency. Atmos. Chem. Phys. 19, 1013–1026.
- Jenkins et al. (1996) Jenkins, B.M., Jones, A.D., Turn, S.Q., Williams, R.B., 1996. Emission factors for polycyclic aromatic hydrocarbons from biomass burning. Environ. Sci. Technol. 30, 2462–2469.
- Jones et al. (2022) Jones, B.A., McDermott, S., Champ, P.A., Berrens, R.P., 2022. More smoke today for less smoke tomorrow? We need to better understand the public health benefits and costs of prescribed fire. Int. J. Wildland Fire 31, 918–926.
- Juncosa Calahorrano et al. (2021) Juncosa Calahorrano, J.F., Lindaas, J., O’Dell, K., Palm, B.B., Peng, Q., Flocke, F., Pollack, I.B., Garofalo, L.A., Farmer, D.K., Pierce, J.R., Collett, J.L., Weinheimer, A., Campos, T., Hornbrook, R.S., Hall, S.R., Ullmann, K., Pothier, M.A., Apel, E.C., Permar, W., Hu, L., Hills, A.J., Montzka, D., Tyndall, G., Thornton, J.A., Fischer, E.V., 2021. Daytime oxidized reactive nitrogen partitioning in Western U.S. wildfire smoke plumes. J. Geophys. Res. Atmos. 126, 1–22.
- Kalies and Yocom Kent (2016) Kalies, E.L., Yocom Kent, L.L., 2016. Tamm Review: Are fuel treatments effective at achieving ecological and social objectives? A systematic review. For. Ecol. Manage. 375, 84–95.
- Karl et al. (2007) Karl, T., Guenther, A., Yokelson, R.J., Greenberg, J., Potosnak, M., Blake, D.R., Artaxo, P., 2007. The tropical forest and fire emissions experiment: Emission, chemistry, and transport of biogenic volatile organic compounds in the lower atmosphere over Amazonia. J. Geophys. Res. 112, D18302.
- Kiely et al. (2024) Kiely, L., Neyestani, S.E., Binte-Shahid, S., York, R.A., Porter, W.C., Barsanti, K.C., 2024. California case study of wildfires and prescribed burns: PM2.5 emissions, concentrations, and implications for human health. Environ. Sci. Technol. 58, 5210–5219.
- Kolb et al. (2004) Kolb, C.E., Herndon, S.C., McManus, J.B., Shorter, J.H., Zahniser, M.S., Nelson, D.D., Jayne, J.T., Canagaratna, M.R., Worsnop, D.R., 2004. Mobile laboratory with rapid response instruments for real-time measurements of urban and regional trace gas and particulate distributions and emission source characteristics. Environ. Sci. Technol. 38, 5694–5703.
- Kolden (2019) Kolden, C., 2019. We’re not doing enough prescribed fire in the Western United States to mitigate wildfire risk. Fire 2, 30.
- Kortelainen et al. (2018) Kortelainen, M., Jokiniemi, J., Tiitta, P., Tissari, J., Lamberg, H., Leskinen, J., Grigonyte-Lopez Rodriguez, J., Koponen, H., Antikainen, S., Nuutinen, I., Zimmermann, R., Sippula, O., 2018. Time-resolved chemical composition of small-scale batch combustion emissions from various wood species. Fuel 233, 224–236.
- Koss et al. (2018) Koss, A.R., Sekimoto, K., Gilman, J.B., Selimovic, V., Coggon, M.M., Zarzana, K.J., Yuan, B., Lerner, B.M., Brown, S.S., Jimenez, J.L., Krechmer, J., Roberts, J.M., Warneke, C., Yokelson, R.J., De Gouw, J., 2018. Non-methane organic gas emissions from biomass burning: Identification, quantification, and emission factors from PTR-ToF during the FIREX 2016 laboratory experiment. Atmos. Chem. Phys. 18, 3299–3319.
- Koval et al. (2022) Koval, L.E., Carberry, C.K., Kim, Y.H., McDermott, E., Hartwell, H., Jaspers, I., Gilmour, M.I., Rager, J.E., 2022. Wildfire variable toxicity: Identifying biomass smoke exposure groupings through transcriptomic similarity scoring. Environ. Sci. Technol. 56, 17131–17142.
- Lee et al. (2015) Lee, A.K.Y., Willis, M.D., Healy, R.M., Onasch, T.B., Abbatt, J.P.D., 2015. Mixing state of carbonaceous aerosol in an urban environment: Single particle characterization using the soot particle aerosol mass spectrometer (SP-AMS). Atmos. Chem. Phys. 15, 1823–1841.
- Lee and Han (2017) Lee, E., Han, H.S., 2017. Air curtain burners: A tool for disposal of forest residues. Forests 8, 296.
- Liang et al. (2021) Liang, Y., Sengupta, D., Campmier, M.J., Lunderberg, D.M., Apte, J.S., Goldstein, A.H., 2021. Wildfire smoke impacts on indoor air quality assessed using crowdsourced data in California. Proc. Natl. Acad. Sci. U.S.A. 118, e2106478118.
- Lima et al. (2005) Lima, A.L.C., Farrington, J.W., Reddy, C.M., 2005. Combustion-derived polycyclic aromatic hydrocarbons in the environment—a review. Environ. Forensics 6, 109–131.
- Liu et al. (2013) Liu, J., Zhang, L., Winterroth, L.C., Garcia, M., Weiman, S., Wong, J.W., Sunwoo, J.B., Nadeau, K.C., 2013. Epigenetically mediated pathogenic effects of phenanthrene on regulatory T cells. J. Toxicol. 2013, 1–13.
- Liu et al. (2019) Liu, P., Li, Z., Bennett, A., Lin, H., Sarathy, S.M., Roberts, W.L., 2019. The site effect on PAHs formation in HACA-based mass growth process. Combust. Flame 199, 54–68.
- Liu et al. (2017) Liu, X., Huey, L.G., Yokelson, R.J., Selimovic, V., Simpson, I.J., Müller, M., Jimenez, J.L., Campuzano-Jost, P., Beyersdorf, A.J., Blake, D.R., Butterfield, Z., Choi, Y., Crounse, J.D., Day, D.A., Diskin, G.S., Dubey, M.K., Fortner, E., Hanisco, T.F., Hu, W., King, L.E., Kleinman, L., Meinardi, S., Mikoviny, T., Onasch, T.B., Palm, B.B., Peischl, J., Pollack, I.B., Ryerson, T.B., Sachse, G.W., Sedlacek, A.J., Shilling, J.E., Springston, S., St. Clair, J.M., Tanner, D.J., Teng, A.P., Wennberg, P.O., Wisthaler, A., Wolfe, G.M., 2017. Airborne measurements of western U.S. wildfire emissions: Comparison with prescribed burning and air quality implications. J. Geophys. Res. Atmos. 122, 6108–6129.
- Majluf et al. (2022) Majluf, F.Y., Krechmer, J.E., Daube, C., Knighton, W.B., Dyroff, C., Lambe, A.T., Fortner, E.C., Yacovitch, T.I., Roscioli, J.R., Herndon, S.C., Worsnop, D.R., Canagaratna, M.R., 2022. Mobile near-field measurements of biomass burning volatile organic compounds: Emission ratios and factor analysis. Environ. Sci. Technol. Letters 9, 383–390.
- Martin et al. (2022) Martin, J.W., Salamanca, M., Kraft, M., 2022. Soot inception: Carbonaceous nanoparticle formation in flames. Prog. Energy Combust. Sci. 88, 100956.
- McManus et al. (2011) McManus, J.B., Zahniser, M.S., Nelson, D.D., 2011. Dual quantum cascade laser trace gas instrument with astigmatic herriot cell at high pass number. Appl. Opt. 50, A74.
- Melvin (2020) Melvin, M., 2020. 2020 National Prescribed Fire Use Report. Technical Report Technical Bulletin 04-20. Coalition of Prescribed Fire Councils, Inc.
- Miller and Lemieux (2007) Miller, C.A., Lemieux, P.M., 2007. Emissions from the burning of vegetative debris in air curtain destructors. J. Air Waste Manag. Assoc. 57, 959–967.
- Nisbet and LaGoy (1992) Nisbet, I.C., LaGoy, P.K., 1992. Toxic equivalency factors (TEFs) for polycyclic aromatic hydrocarbons (PAHs). Regul. Toxicol. Pharmacol. 16, 290–300.
- O’Dell et al. (2020) O’Dell, K., Hornbrook, R.S., Permar, W., Levin, E.J.T., Garofalo, L.A., Apel, E.C., Blake, N.J., Jarnot, A., Pothier, M.A., Farmer, D.K., Hu, L., Campos, T., Ford, B., Pierce, J.R., Fischer, E.V., 2020. Hazardous air pollutants in fresh and aged Western US wildfire smoke and implications for long-term exposure. Environ. Sci. Technol. 54, 11838–11847.
- Onasch et al. (2012) Onasch, T.B., Trimborn, A., Fortner, E.C., Jayne, J.T., Kok, G.L., Williams, L.R., Davidovits, P., Worsnop, D.R., 2012. Soot particle aerosol mass spectrometer: Development, validation, and initial application. Aerosol Sci. Technol. 46, 804–817.
- Permar et al. (2021) Permar, W., Wang, Q., Selimovic, V., Wielgasz, C., Yokelson, R.J., Hornbrook, R.S., Hills, A.J., Apel, E.C., Ku, I.T., Zhou, Y., Sive, B.C., Sullivan, A.P., Collett, J.L., Campos, T.L., Palm, B.B., Peng, Q., Thornton, J.A., Garofalo, L.A., Farmer, D.K., Kreidenweis, S.M., Levin, E.J.T., DeMott, P.J., Flocke, F., Fischer, E.V., Hu, L., 2021. Emissions of trace organic gases from western U.S. Wildfires based on WE-CAN Aircraft Measurements. J. Geophys. Res. Atmos. 126.
- Piqué and Domènech (2018) Piqué, M., Domènech, R., 2018. Effectiveness of mechanical thinning and prescribed burning on fire behavior in Pinus nigra forests in NE Spain. Sci. Total Environ. 618, 1539–1546.
- Porteiro et al. (2010) Porteiro, J., Patiño, D., Moran, J., Granada, E., 2010. Study of a fixed-bed biomass combustor: Influential parameters on ignition front propagation using parametric analysis. Energy Fuels 24, 3890–3897.
- Prichard et al. (2020) Prichard, S.J., O’Neill, S.M., Eagle, P., Andreu, A.G., Drye, B., Dubowy, J., Urbanski, S., Strand, T.M., 2020. Wildland fire emission factors in North America: Synthesis of existing data, measurement needs and management applications. Int. J. Wildland Fire 29, 132–147.
- Prunicki et al. (2019) Prunicki, M., Kelsey, R., Lee, J., Zhou, X., Smith, E., Haddad, F., Wu, J., Nadeau, K., 2019. The impact of prescribed fire versus wildfire on the immune and cardiovascular systems of children. Allergy 74, 1989–1991.
- Ramírez et al. (2011) Ramírez, N., Cuadras, A., Rovira, E., Marcé, R.M., Borrull, F., 2011. Risk assessment related to atmospheric polycyclic aromatic hydrocarbons in gas and particle phases near industrial sites. Environ. Health Perspect. 119, 1110–1116.
- Reid et al. (2016) Reid, C.E., Brauer, M., Johnston, F.H., Jerrett, M., Balmes, J.R., Elliott, C.T., 2016. Critical review of health impacts of wildfire smoke exposure. Environ. Health Perspect. 124, 1334–1343.
- Richter and Howard (2000) Richter, H., Howard, J.B., 2000. Formation of polycyclic aromatic hydrocarbons and their growth to soot-a review of chemical reaction pathways. Prog. Energy Combust. Sci. 26, 565–608.
- Saggese et al. (2013) Saggese, C., Frassoldati, A., Cuoci, A., Faravelli, T., Ranzi, E., 2013. A wide range kinetic modeling study of pyrolysis and oxidation of benzene. Combust. Flame 160, 1168–1190.
- Samburova et al. (2016) Samburova, V., Connolly, J., Gyawali, M., Yatavelli, R.L., Watts, A.C., Chakrabarty, R.K., Zielinska, B., Moosmüller, H., Khlystov, A., 2016. Polycyclic aromatic hydrocarbons in biomass-burning emissions and their contribution to light absorption and aerosol toxicity. Sci. Total Environ. 568, 391–401.
- Schollaert et al. (2023) Schollaert, C.L., Jung, J., Wilkins, J., Alvarado, E., Baumgartner, J., Brun, J., Busch Isaksen, T., Lydersen, J.M., Marlier, M.E., Marshall, J.D., Masuda, Y.J., Maxwell, C., Tessum, C.W., Wilson, K.N., Wolff, N.H., Spector, J.T., 2023. Quantifying the smoke-related public health trade-offs of forest management. Nat. Sustain. 7, 130–139.
- Sekimoto et al. (2018) Sekimoto, K., Koss, A.R., Gilman, J.B., Selimovic, V., Coggon, M.M., Zarzana, K.J., Yuan, B., Lerner, B.M., Brown, S.S., Warneke, C., Yokelson, R.J., Roberts, J.M., de Gouw, J., 2018. High- and low-temperature pyrolysis profiles describe volatile organic compound emissions from western US wildfire fuels. Atmos. Chem. Phys. 18, 9263–9281.
- Sekimoto et al. (2017) Sekimoto, K., Li, S.M., Yuan, B., Koss, A., Coggon, M., Warneke, C., De Gouw, J., 2017. Calculation of the sensitivity of proton-transfer-reaction mass spectrometry (PTR-MS) for organic trace gases using molecular properties. Int. J. Mass Spectrom. 421, 71–94.
- Shen et al. (2013) Shen, G., Xue, M., Wei, S., Chen, Y., Zhao, Q., Li, B., Wu, H., Tao, S., 2013. Influence of fuel moisture, charge size, feeding rate and air ventilation conditions on the emissions of PM, OC, EC, parent PAHs, and their derivatives from residential wood combustion. J. Environ. Sci. 25, 1808–1816.
- Silvani and Morandini (2009) Silvani, X., Morandini, F., 2009. Fire spread experiments in the field: temperature and heat fluxes measurements. Fire Safety Journal 44, 279–285.
- Smith et al. (1999) Smith, G.P., Golden, D.M., Frenklach, M., Moriarty, N.W., Eiteneer, B., Goldenberg, M., Bowman, T., Hanson, R.K., Song, S., Gardiner Jr., W.C., Lissianski, V.V., Qin, Z., 1999. GRI-mech 3.0. http://www.me.berkeley.edu/gri_mech/, Version 3.0.
- Spracklen et al. (2009) Spracklen, D.V., Mickley, L.J., Logan, J.A., Hudman, R.C., Yevich, R., Flannigan, M.D., Westerling, A.L., 2009. Impacts of climate change from 2000 to 2050 on wildfire activity and carbonaceous aerosol concentrations in the western United States. J. Geophys. Res. 114, 1–17.
- Stark et al. (2015) Stark, H., Yatavelli, R.L., Thompson, S.L., Kimmel, J.R., Cubison, M.J., Chhabra, P.S., Canagaratna, M.R., Jayne, J.T., Worsnop, D.R., Jimenez, J.L., 2015. Methods to extract molecular and bulk chemical information from series of complex mass spectra with limited mass resolution. Int. J. Mass Spectrom. 389, 26–38.
- U.S. Department of Agriculture Forest Service (2022) U.S. Department of Agriculture Forest Service, 2022. Confronting the Wildfire Crisis: A 10-Year Implementation Plan. Technical Report FS-1187b. USDA Forest Service.
- Wang (2011) Wang, H., 2011. Formation of nascent soot and other condensed-phase materials in flames. Proc. Combust. Inst. 33, 41–67.
- Ward and Radke (1993) Ward, D.E., Radke, L.F., 1993. Emissions measurements from vegetation fires: A comparative evaluation of methods and results, in: Crutzen, P.J., Goldammer, J. (Eds.), The Ecological, Atmospheric, and Climatic Importance of Vegetaion Fires. John Wiley & Sons, Ltd, pp. 53–76.
- Westerling et al. (2006) Westerling, A.L., Hidalgo, H.G., Cayan, D.R., Swetnam, T.W., 2006. Warming and earlier spring increase western U.S. forest wildfire activity. Science 313, 940–943.
- Williamson et al. (2016) Williamson, G.J., Bowman, D.M.J.S., Price, O.F., Henderson, S.B., Johnston, F.H., 2016. A transdisciplinary approach to understanding the health effects of wildfire and prescribed fire smoke regimes. Environ. Res. Lett. 11, 125009.
- Willis et al. (2016) Willis, M.D., Healy, R.M., Riemer, N., West, M., Wang, J.M., Jeong, C.H., Wenger, J.C., Evans, G.J., Abbatt, J.P.D., Lee, A.K.Y., 2016. Quantification of black carbon mixing state from traffic: Implications for aerosol optical properties. Atmos. Chem. Phys. 16, 4693–4706.
- Yan et al. (2004) Yan, J., Wang, L., Fu, P.P., Yu, H., 2004. Photomutagenicity of 16 polycyclic aromatic hydrocarbons from the US EPA priority pollutant list. Mutat. Res. Genet. Toxicol. Environ. Mutagen. 557, 99–108.
- Yokelson et al. (2013) Yokelson, R.J., Burling, I.R., Gilman, J.B., Warneke, C., Stockwell, C.E., de Gouw, J., Akagi, S.K., Urbanski, S.P., Veres, P., Roberts, J.M., Kuster, W.C., Reardon, J., Griffith, D.W.T., Johnson, T.J., Hosseini, S., Miller, J.W., Cocker III, D.R., Jung, H., Weise, D.R., 2013. Coupling field and laboratory measurements to estimate the emission factors of identified and unidentified trace gases for prescribed fires. Atmos. Chem. Phys. 13, 89–116.
- Zhang et al. (2007) Zhang, J., Toghiani, H., Mohan, D., Pittman, C.U., Toghiani, R.K., 2007. Product analysis and thermodynamic simulations from the pyrolysis of several biomass feedstocks. Energy Fuels 21, 2373–2385.
- Zhao and Zhang (2004) Zhao, J., Zhang, R., 2004. Proton transfer reaction rate constants between hydronium ion (H3O+) and volatile organic compounds. Atmos. Environ. 38, 2177–2185.
Appendix A Peak fit
Analysis of the raw mass spectrometer data was performed in Tofware v3.3.0 with IgorPro v9.0.2.4. An example of the fully constrained peak fit is shown in Fig. 1 for which we have tentatively identified as phenanthrene/anthracene (PH/AN).
Appendix B Emission profiles for investigated PAHs in the gas phase
Emission profiles for the remaining PAHs are shown in Figs. 1 to 6. They are obtained in the same manner as shown in Fig. 1 for PH/AN. Note that we deliberately excluded B[a]A/CHR and B[b]F/B[a]P due to low ion intensities in the gas phase. We also provide a non-normalized emission map for benzene () in Fig. 7 which shows gas-phase emissions normalized to the sample’s mass loss (in units PPB/kg).