First Ion Temperature Measurements in the MAST-U Divertor via Retarding Field Energy Analyzer
Abstract
This study presents the first ion temperature () measurements from the MAST-U divertor using a Retarding Field Energy Analyzer (RFEA). Embedded within the flat tile of the closed divertor chamber, the RFEA captures profiles across various plasma scenarios, including transitions to the Super-X configuration. Measurements were conducted under steady-state and transient plasma conditions characterized by a plasma current () of 750 kA, electron density () between and , and Neutral Beam Injection (NBI) power ranging from 3.0 MW to 3.2 MW. The ion temperatures, peaking at approximately 20 eV in steady state, were compared with electron temperatures () obtained from Langmuir probes (LP) at identical radial positions. The study also examined ion saturation current density () signals to using methodologies similar to previous MAST experiments. Preliminary findings reveal a ratio ranging from 1 to 2.5. Additionally, high temporal resolution measurements (100 ) captured the dynamics of Edge Localized Modes (ELMs), showing peaks at 16.03 ± 1.84 eV during ELM events, nearly three times higher than inter-ELM temperatures.
1 Introduction
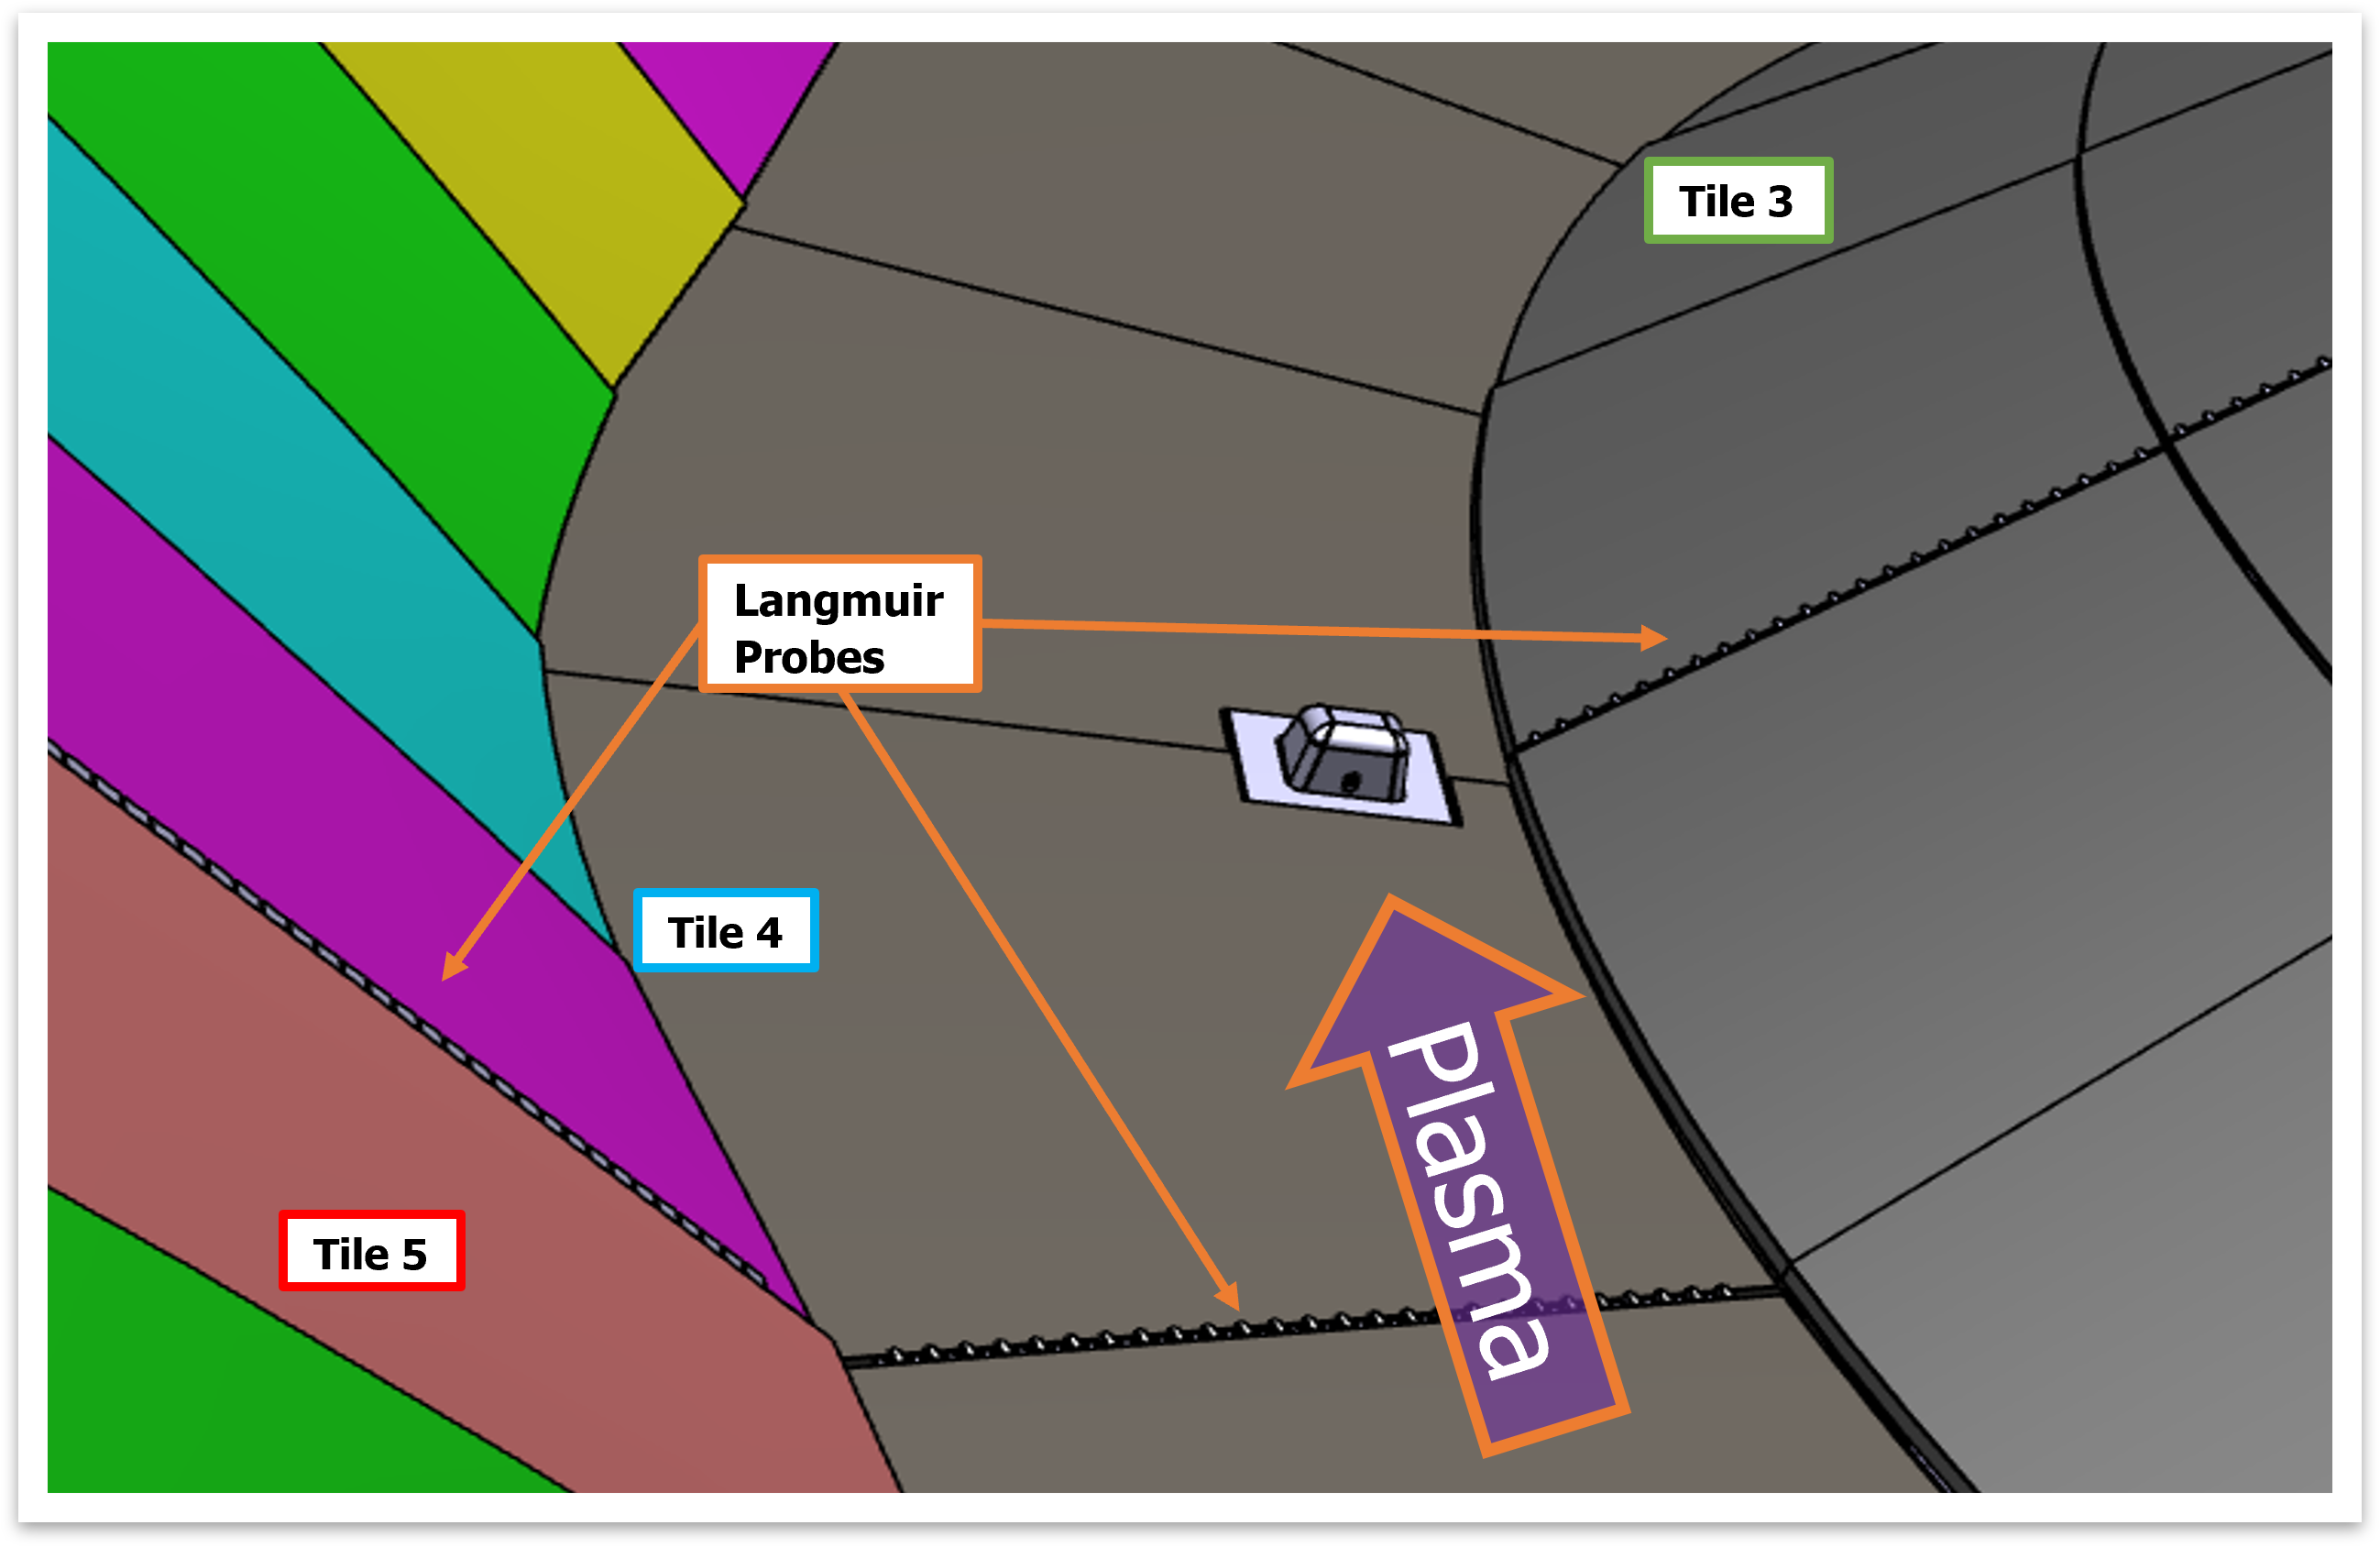
This study focuses on the novel application of a Retarding Field Energy Analyzer (RFEA) integrated within MAST-U’s flexible divertor system. The RFEA is embedded in the flat tile of the closed divertor chamber (Figure 1), enabling to study a variety of advanced divertor configurations. The RFEA was utilized to perform ion temperature () measurements across different plasma scenarios, specifically the elongated divertor (ED) and conventional divertor (CD) transitioning to the Super-X Divertor (SXD) configuration [1]. This paper presents, for the first time, measurements of ion temperature profiles under various operational conditions. The fluctuations between high and low have significant implications for plasma management and material integrity within the tokamak. The cyclic thermal stresses imposed by these temperature fluctuations can affect the longevity and integrity of plasma-facing components (PFCs). Materials subjected to repeated high-temperature pulses may experience accelerated erosion or structural weakening. Understanding the dynamics of ion temperature during Edge Localized Mode (ELM) and inter-ELM phases is crucial for developing effective ELM control strategies. Managing these temperature peaks through techniques such as ELM pacing or suppression could enhance the overall stability and efficiency of plasma confinement.
Further studies are needed to explore the causal mechanisms behind the rapid temperature increase during ELMs and the subsequent recovery in the inter-ELM period. Investigating the interaction of these temperature profiles with other plasma parameters could yield deeper insights into the behavior of transient phenomena in tokamak plasmas. Accurate measurements of ion temperature are crucial for predicting and mitigating the damage to material surfaces in tokamak vessels. As the sputtering yield of a material is strongly influenced by incoming ion energy, understanding in the divertor region can guide the development of strategies to protect plasma-facing materials [2]. Through these measurements, the aim is to deepen the understanding of ion dynamics in the divertor region, which is critical for optimizing plasma exhaust and improving the design and operation of future fusion devices. This paper discusses the integration of the RFEA diagnostic into the Divertor Science Facility (DSF), complemented by a Python-based data analysis tool, to enhance comprehension of divertor plasma physics in MAST-U.
2 Experimental Setup
The MAST-U Tokamak incorporates substantial advancements in spherical tokamak technology, aiming to enhance plasma performance and exhaust handling. One of the most distinctive features of MAST-U is its Super-X Divertor chamber that allows for various magnetic configurations. The DSF is located in the flat tile of the divertor chamber and allows different probe heads to be inserted statically into the divertor region (Figure 1). The DSF allows measurements to be taken as the plasma strike point sweeps over the DSF location. Central to the experimental investigations is the RFEA, which is integrated within the DSF. The RFEA setup includes a multi-grid system designed to measure ion energies and temperature by retarding and analyzing the energy distribution of ions passing through it. This device provides direct measurements of ion temperatures across various plasma scenarios. The plasma current was typically maintained around 750 kA, with an averaged core electron density from to and NBI power varying from 3.0 to 3.2 MW. Details of the shots selected for this analysis are presented in Table 1. Shot 49218 includes measurements recorded during a transition from Conventional CD to SXD in H-mode. In shot 49138, signals of multiple ELM phenomena were recorded in the ED configuration.
| Shot | KA | MW | (range) | Divertor Configuration |
|---|---|---|---|---|
| 49218 | 750 | 3.1 | CD to SXD | |
| 49138 | 750 | 3.2 | ED |
2.1 RFEA Operational Principle
In this section, the functionality and methodology associated with the use of the RFEA installed in the MAST-U divertor are elaborated upon. The RFEA is a diagnostic specifically designed to capture and analyze the energy distribution of charged particles, predominantly ions, within a plasma. It has been used to measure ion temperature within the scrape-off layer (SOL) on tokamaks including MAST, ASDEX-Upgrade, Tore-Supra and JET [3][4][5]. This device operates on the principle of electrostatic retardation of ions using a multi-grid system (Figure 2). The MAST-U RFEA consists of an entrance grid (Slit Plate), intermediate grids (Grid 1 and Grid 2), and a Collector Plate.
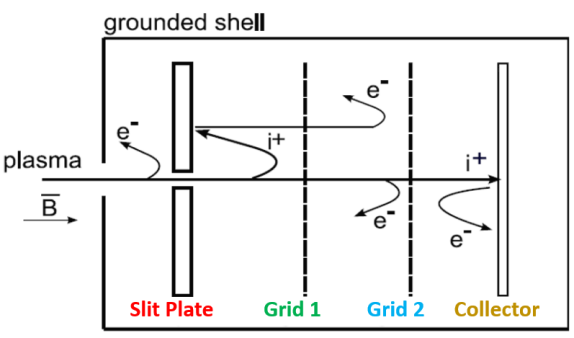
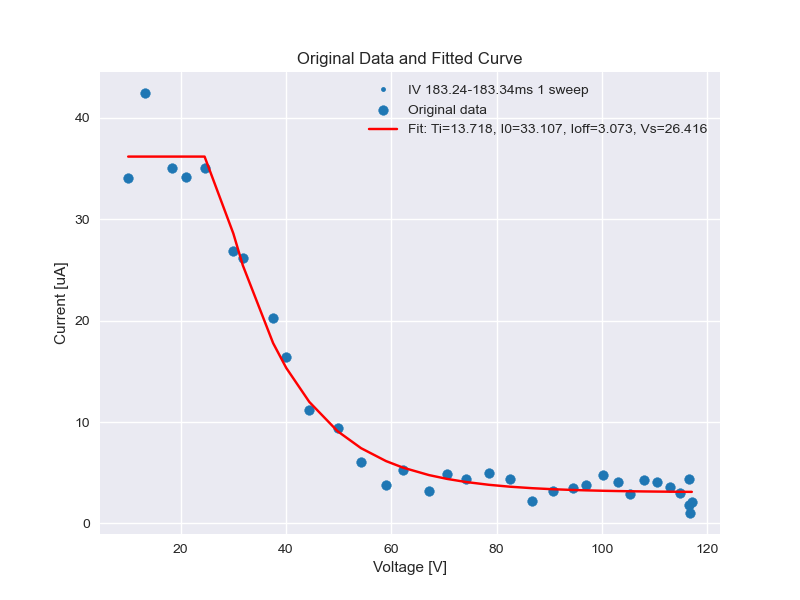
The entrance grid repels electrons, ensuring that primarily ions enter the device. The subsequent grids are biased at different potentials to create an electric field that selectively allows ions of specific kinetic energies to pass through. Grid 1 is a discriminating grid that sweeps from 0 to a positive voltage ( 3). Grid 2 is a suppression grid held at negative voltage to repel secondary electrons released by ions hitting the collector plate. Data collection with the RFEA involves capturing the ion current at the collector plate as a function of the retarding potential is applied to Grid 1. This process generates an I-V characteristic curve, from which the ion temperature is derived using Equation 1, where is the ions saturation current, the sheath voltage and accounts for any current offsets due to the electronics of the system. (see Figure 3 for an I-V characteristic of a plasma as measured by the RFEA).
| (1) |
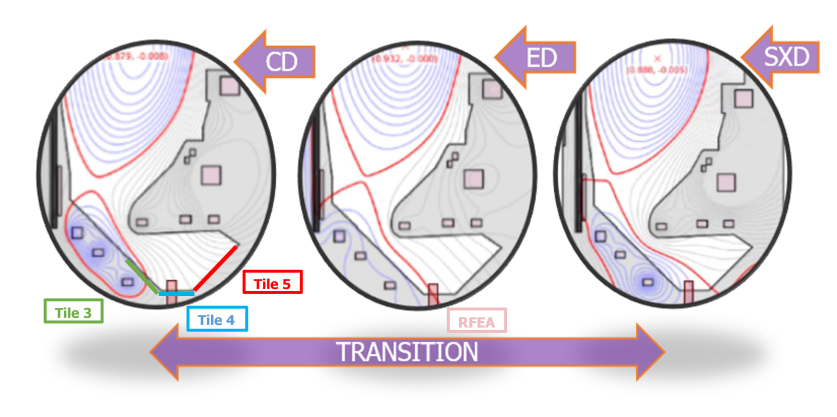
The primary data recorded includes ion current magnitudes at varying retarding potentials, which are processed using a Python-based analysis tool. This tool integrates the raw RFEA data and applies a fitting algorithm to deduce the ion temperature and density. To reconstruct the profiles around the strike point , the dynamic motion of the strike point in the MAST-U divertor chamber is exploited In this work, two configurations were examined that allow measurable signals on the RFEA: the ED, and transition from CD to SXD (Figure 4). The ED configuration extends the outer leg of the plasma from a CD to a chosen position on Tile 4.
When the strike point is positioned at the DSF location, the temporal evolution of can be measured. This allows for the measurement of multiple ELM temperature profiles in H-mode[7]. Another option involves a rapid transition from the CD to the SXD scenario, during which the radial profile is measured as the strike point swiftly sweeps over the DSF. In this case, temporal profiles are available along with a conversion of temporal measurements into radial distances from the Last Closed Flux Surface (LCFS) to the target (probe position), denoted as .
3 Results
This study offers a comparative analysis of ion saturation current density () and temperatures using the RFEA for ions and LP[8] for electrons across the SOL and the Private Flux Region (PFR). The data encompasses analysis of profiles and their comparison with obtained from LP located at the same radial position during the transition from CD to SXD. Measurement of ELMs are also discussed, obtained in Elongated Divertor configuration.
3.1 Conventional to Super X Divertor
For shot 49218, in Figure 5, the upper subplot presents the measured by the RFEA and the obtained from LP, while the lower subplot compares the ion saturation current () from both diagnostics. RFEA data is radially binned to match the LP time resolution. The binned data are calculated as the mean of the data points within each bin. The error for each bin is calculated using individual errors of the data points within the bin. This approach ensures that both the bin’s data and their associated errors are accurately represented. The profile correlates well with the from the RFEA, with peak nearly aligned with peak . This slight misalignment may be attributed to the spatial binning to convert from the RFEA to LP radial axis. Nevertheless, the general congruence between the profile shape and is maintained, having both a double peak. Comparatively, the profile from the LP exhibits a similar shape to that of the RFEA, though it is of greater magnitude, a difference that can arise from the uncertainty on the collection areas utilized in calculating . The alignment discrepancies between the two measurements in this instance are likely influenced by the toroidal field (TF) ripple [9], which may affect the measurements as the RFEA and LP are located at different toroidal positions. Examining the juncture between Tile 4 and Tile 5 in Figure 1, it is evident that the profile is not symmetric in the toroidal direction. This asymmetry was introduced to accommodate the TF ripple and may be contributing to the discrepancy observed between the LP and RFEA measurements. Although the as measured by the LP follows the profile, it does not mirror the from the RFEA as closely and consistently registers lower values. The red dashed line on Figure 5 and 6 marks the strike point location on the RFEA orifice, serving as a crucial reference point that distinguishes the SOL on the right from the PFR on the left. This distinction is essential as it corresponds to the sweeping of the strike point across the DSF. Importantly, this dynamic allows for tracking the temporal evolution of the measurements. During the strike point sweep from CD to SXD, the RFEA probe initially encounters the SOL as the strike point approaches, and subsequently measures the PFR as the strike point passes over, providing a sequential view of plasma conditions across these regions. In the PFR for distances less than -0.04 meters, transient phenomena are observed in both the signal and the RFEA slit plate current. Consequently, the measurements in this region may not be reliable for this study. As depicted in Figure 6, the / ratio exhibits a pronounced disparity, with values reaching as high as 2.5 in regions 0.04m rightward of the strike point position, and tapering off towards the PFR. This disparity in temperatures suggests a dominance of ion-specific heating mechanisms, possibly due to NBI or enhanced energy retention due to the larger mass and gyro-radius of ions compared to electrons. Moreover, the larger error bars observed in these regions stem from the error bars associated with the high uncertainty of the LP measurement, compared to the RFEA . For this shot, the LPs were set in multiplexer mode[8], implying a lower time resolution. This exposes the LP probe to different plasma conditions within a single voltage sweep and does not allow to bin them to reduce the uncertainty, as is possible with the RFEA. / peaks in the SOL, and not on the strike point, decreasing gradually towards the PFR and the far SOL(Figure 6). These findings underscore the influence of localized plasma conditions and magnetic field configurations on and . The higher relative to in certain areas could be indicative of less efficient ion cooling processes in these regions, potentially due to decreased ion interactions with neutrals or reduced efficacy of radiative cooling mechanisms. These phenomena could be related to the level of detachment observed during these transient measurements, which affects both ion and electron temperatures. Further research is necessary to elucidate the specific mechanisms contributing to the observed temperature disparities. Detailed modeling and simulation efforts should be directed towards understanding the impact of toroidal magnetic field ripple effects[9]. Additionally, the experimental setups could be optimized to reduce measurement uncertainties and enhance the resolution of temperature profiles from LP (e.g. not multiplexing).
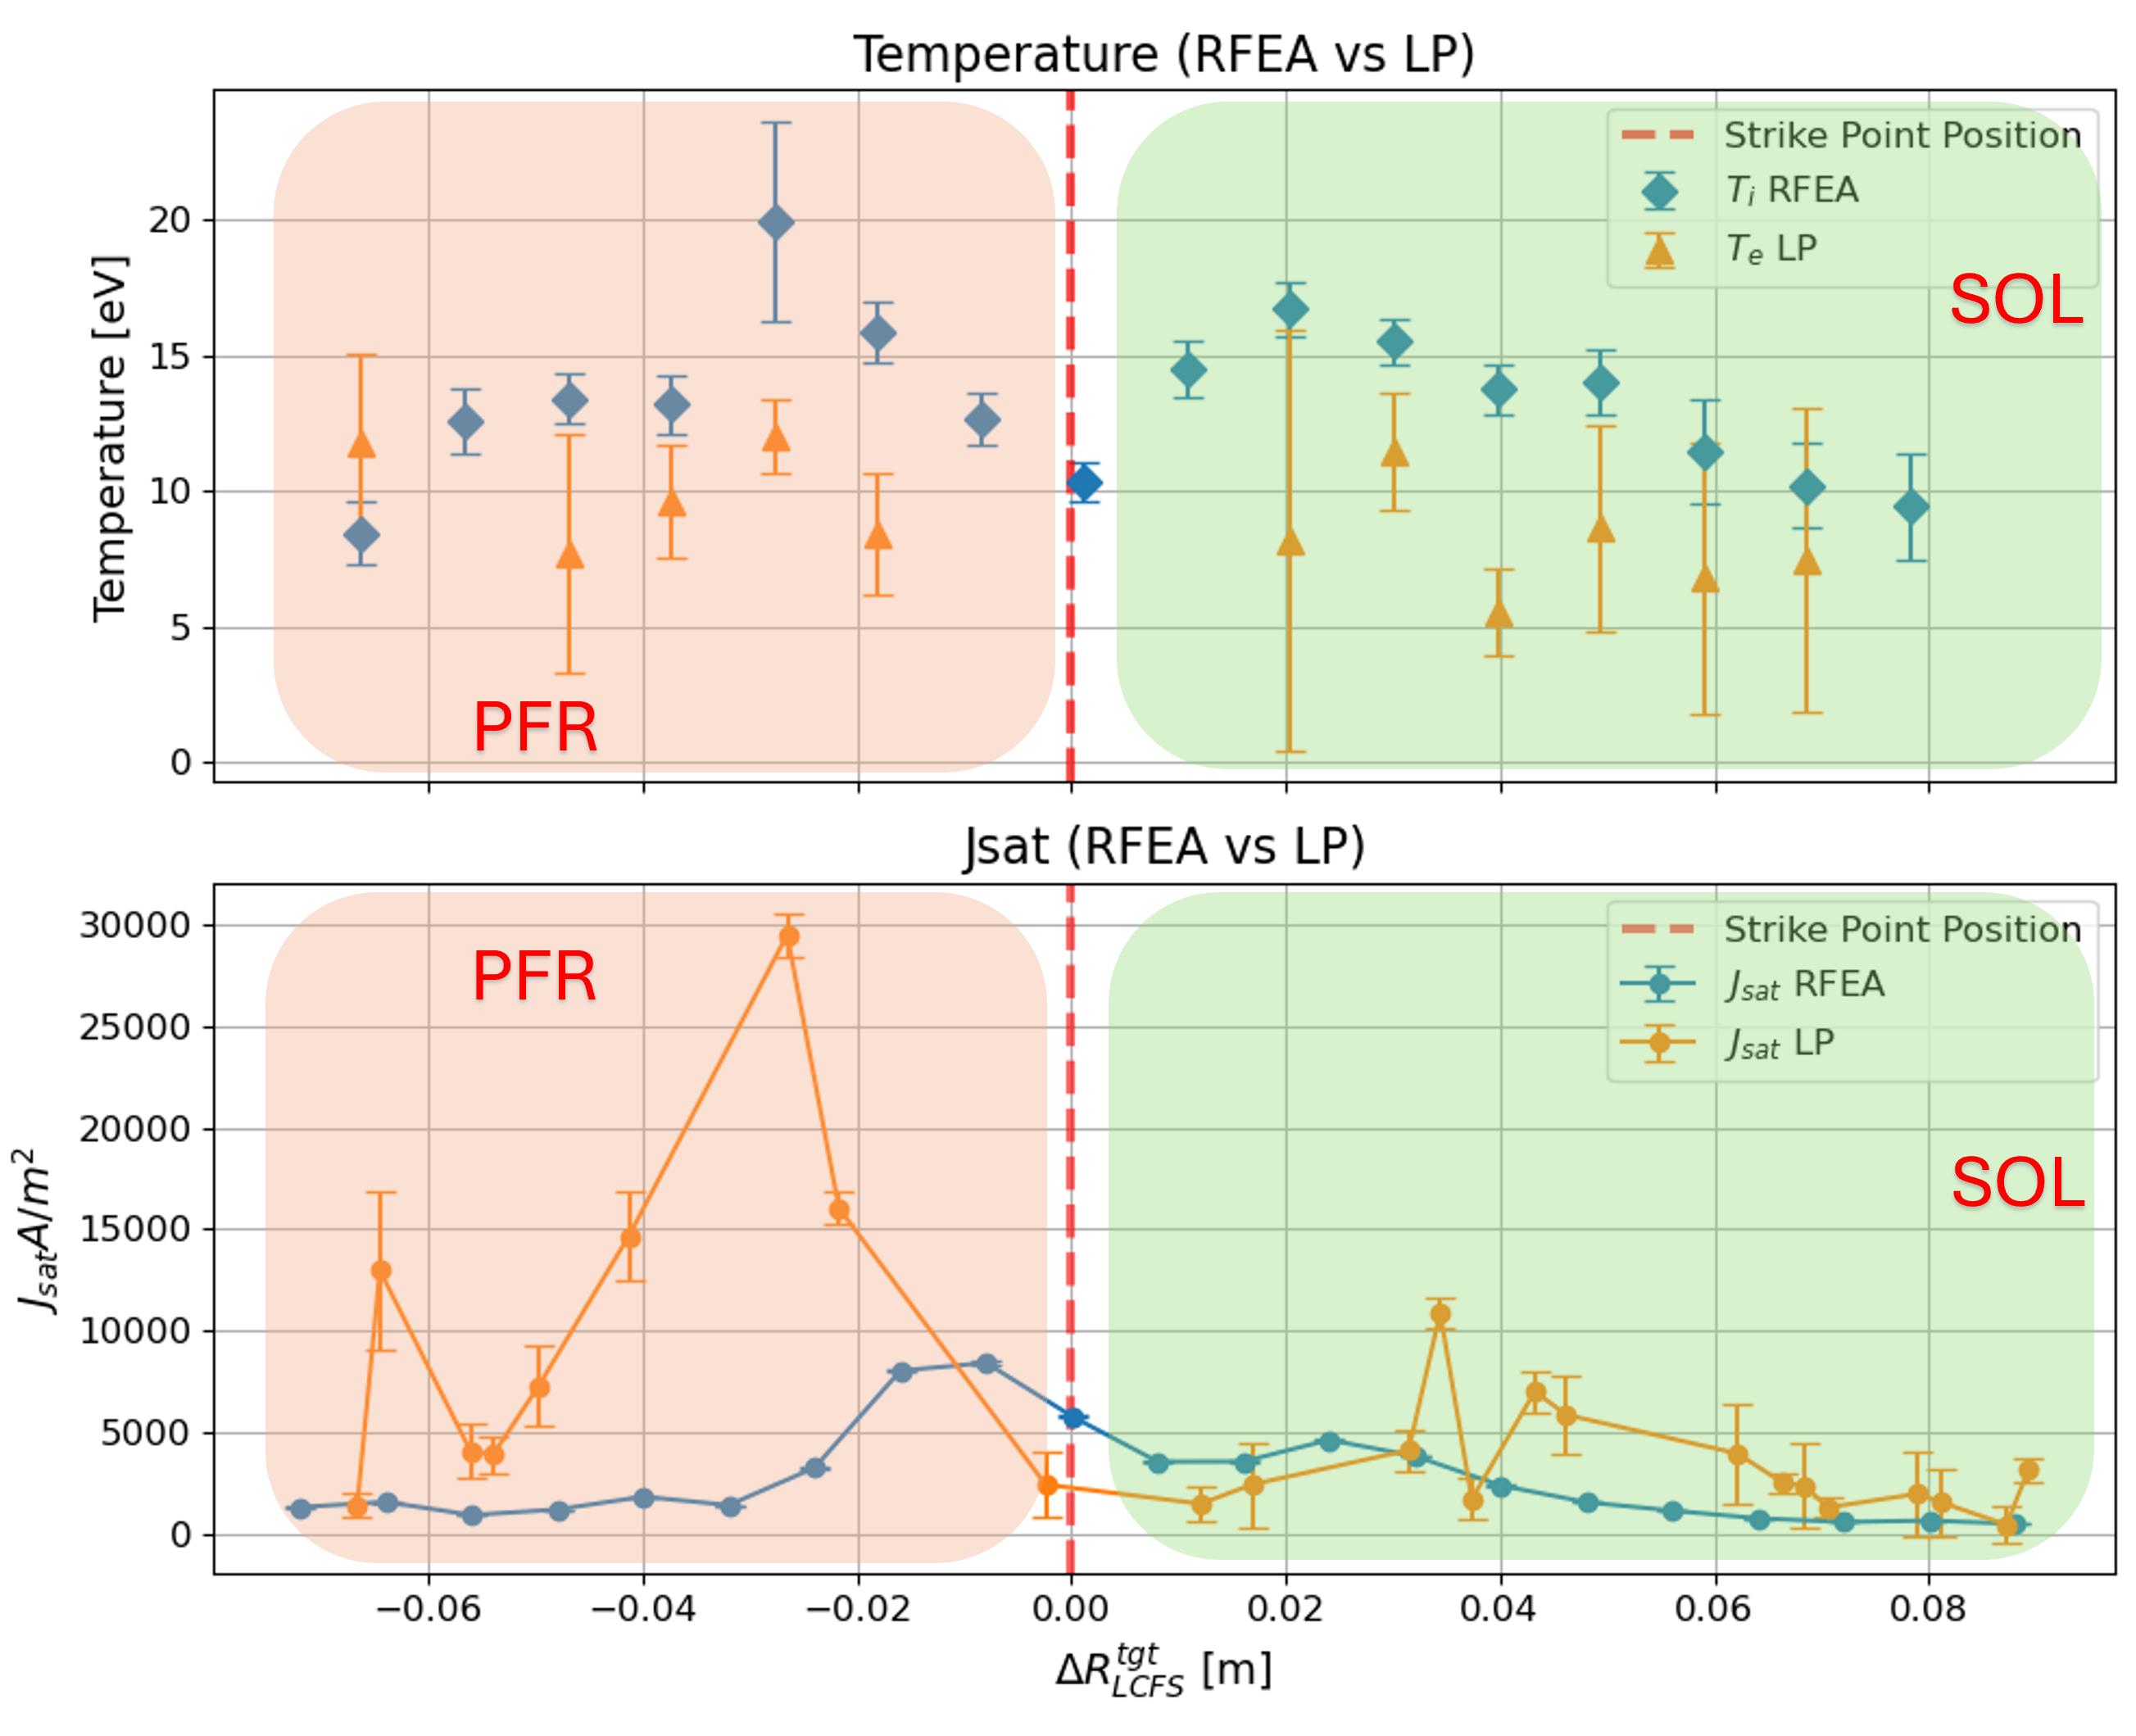
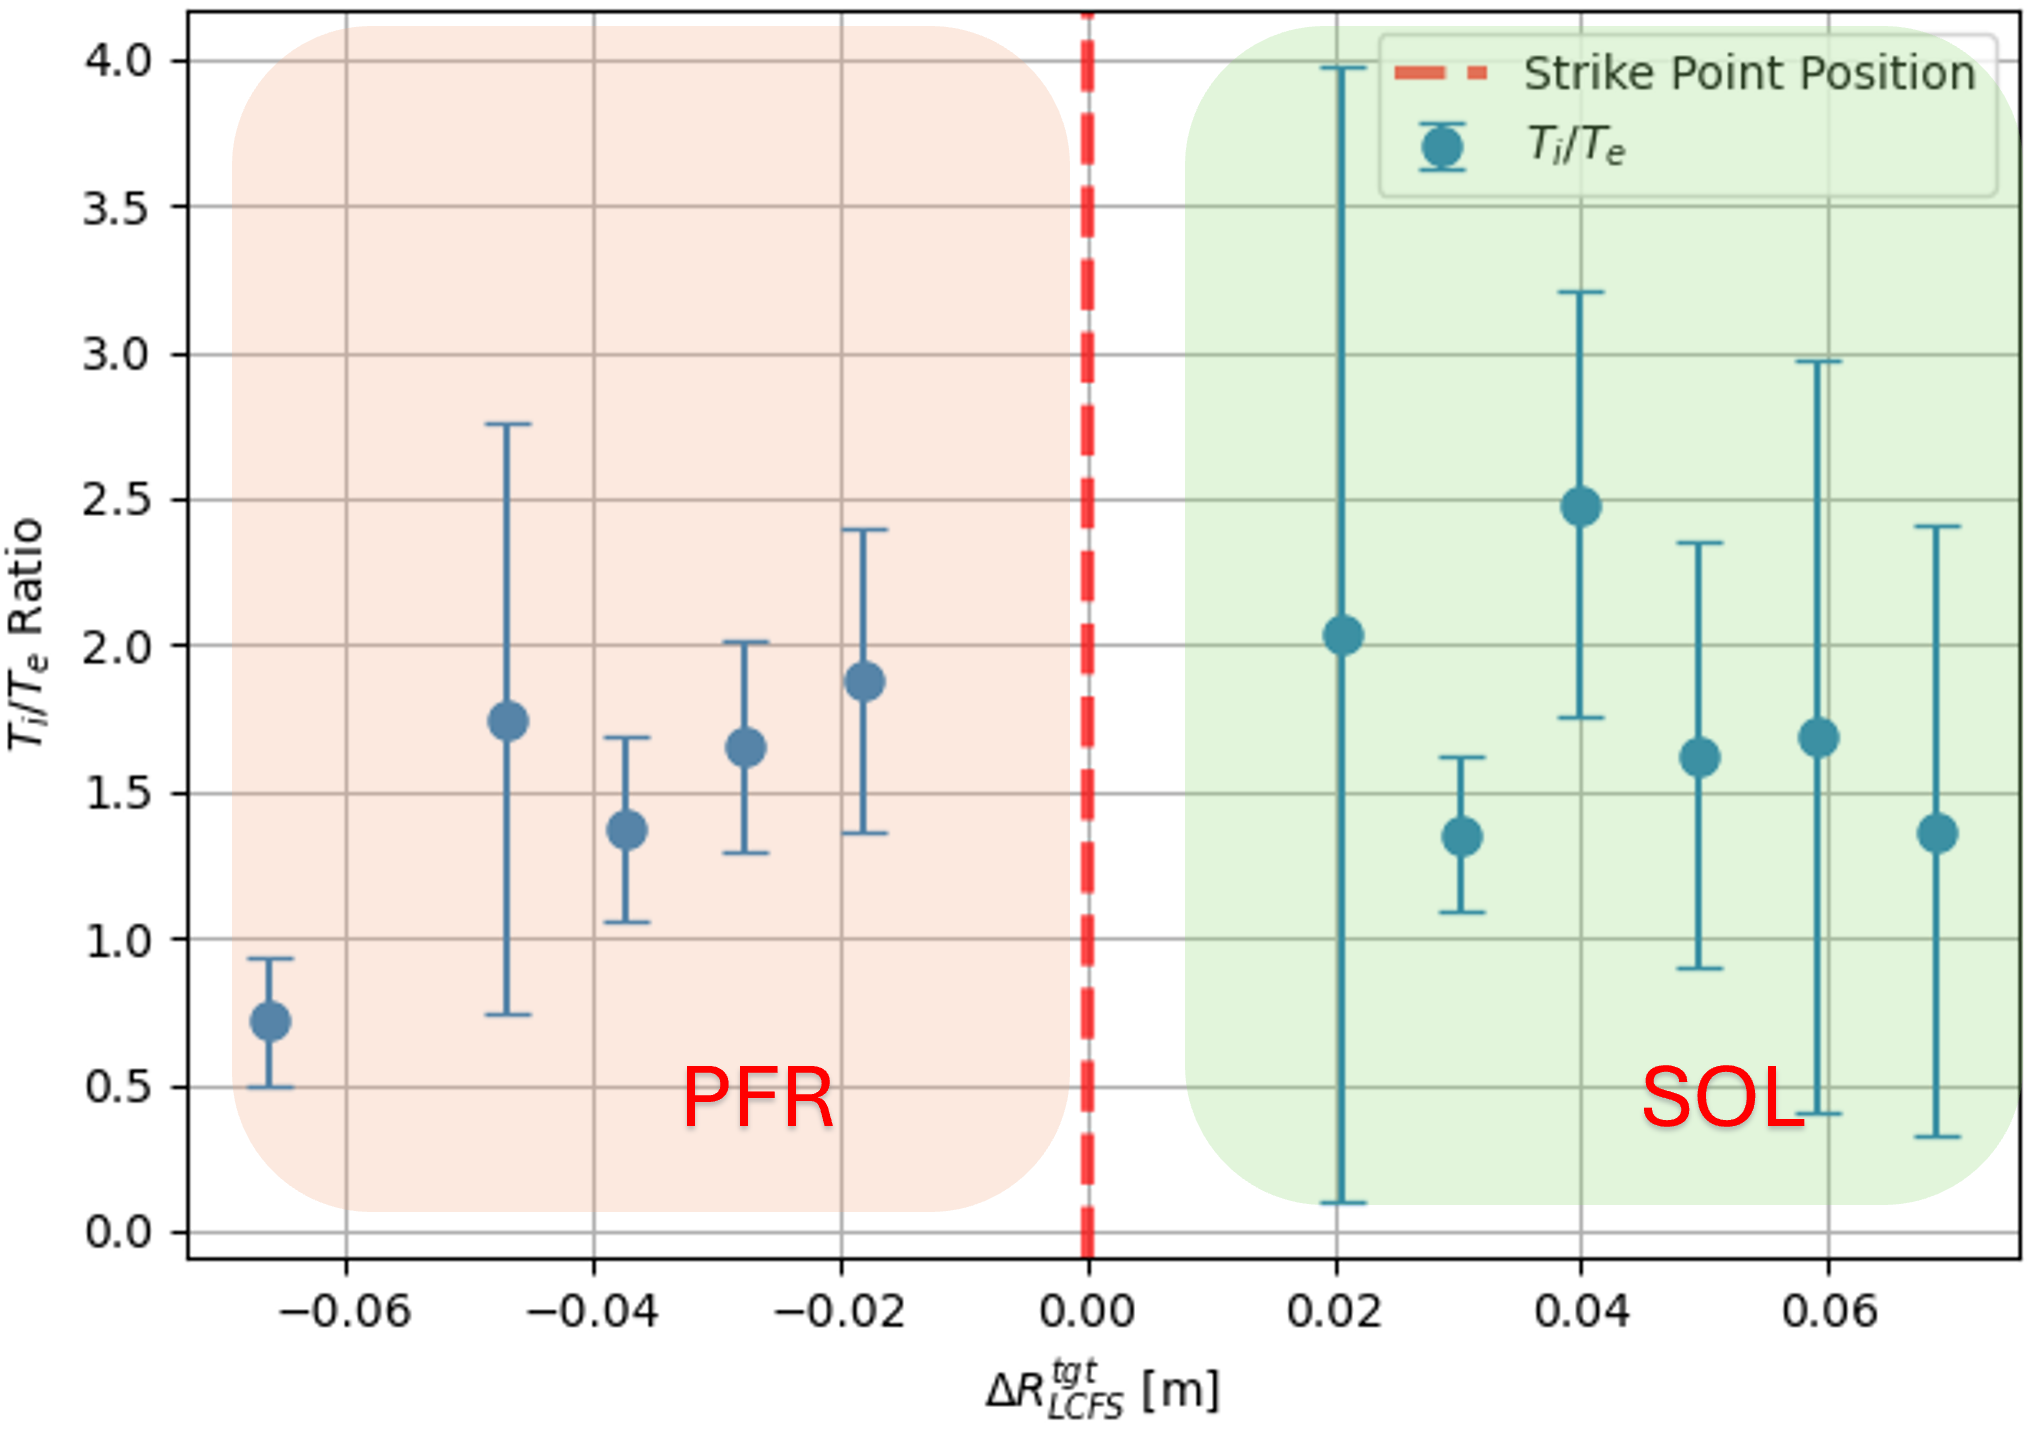
In this study, / ratios ranging from 1 to 2.5 were observed, indicating significant differences in the way energy is deposited and distributed within the plasma, comparable to previous studies carried out by Kocan et al.[10]. Furthermore prior studies on MAST, such as those by Elmore et al.[11], have reported similar ion temperature measurements up to 15 eV on the divertor, under conditions of lower plasma density and current (450 KA) in ohmic heated CD plasmas. This recent investigation on MAST-U thus provides additional evidence of the effectiveness of the cooling impact afforded by the novel extension of the outer strike point leg into a Super-X divertor configuration.
3.2 ELMs Measurements in Elongated Divertor
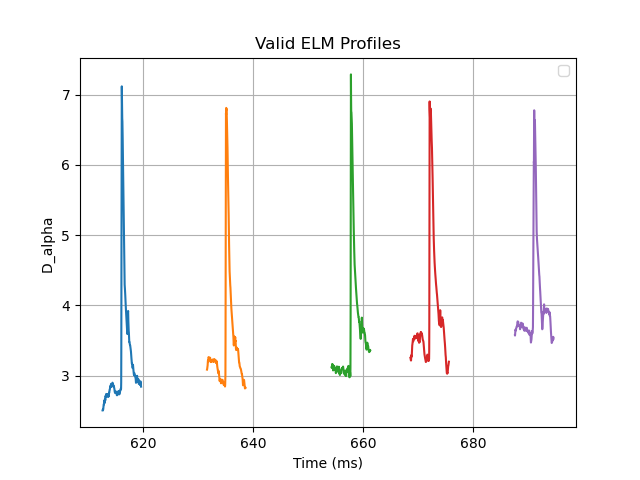
The fast sweep method employed by the RFEA enhances the temporal resolution of measurements to 100 . A similar approach has been previously used in ASDEX[13]. This capability is crucial for capturing the rapid dynamics of ELMs, which are transient instabilities in tokamak plasmas that can cause a significant increase of the heat and particle fluxes to the divertor regions. By achieving such a high temporal resolution, some instance of an ELM can be recorded. To reconstruct a comprehensive profile of these transient events, an ELM identification technique akin to those described in prior studies by Kirk et al.[12] and Elmore et al.[7] was implemented. This method involves aligning multiple ELM instances on the same temporal scale and aggregating them to form a composite profile. The onset of an ELM is determined by the time at which the midplane signal rises to 10% of the peak value above the inter-ELM level. Figure 7, displays selected ELM events during shot 49138. These have been chosen to correspond to the same type of ELM (Type 1, low frequency). For some ELMs, the current exceeded 3A, the power supply saturation current, and therefore were excluded from the analysis. Each color in Figure 8 represents a different ELM, illustrating the variability in their temporal characteristics and amplitude. By aligning these instances using a time scale , where denotes the ELM onset just identified, an averaged ELM profile was constructed. This approach ensures that each ELM, occurring at different times during the experiment, is synchronized to a common relative time, to create the coherent averaged profile in black in Figure 8.
The aligned ELM profile give insights into the temporal evolution of the ELM ion temperature, and has been taken over a range around ms from the peak of the ELM. During the measurements, the strike point was consistently maintained at the RFEA position, allowing for the measurement of the temporal evolution of ELMs at a fixed spatial location. This setup ensures that the measured temperature profiles reflect the dynamics at the point of impact, providing a reliable basis for understanding the thermal stresses imposed by ELMs on the divertor materials.
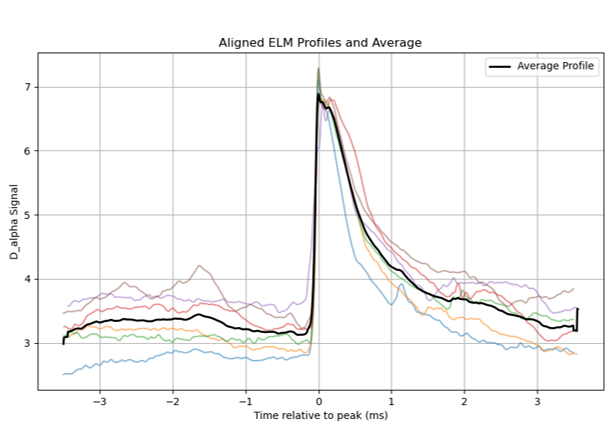
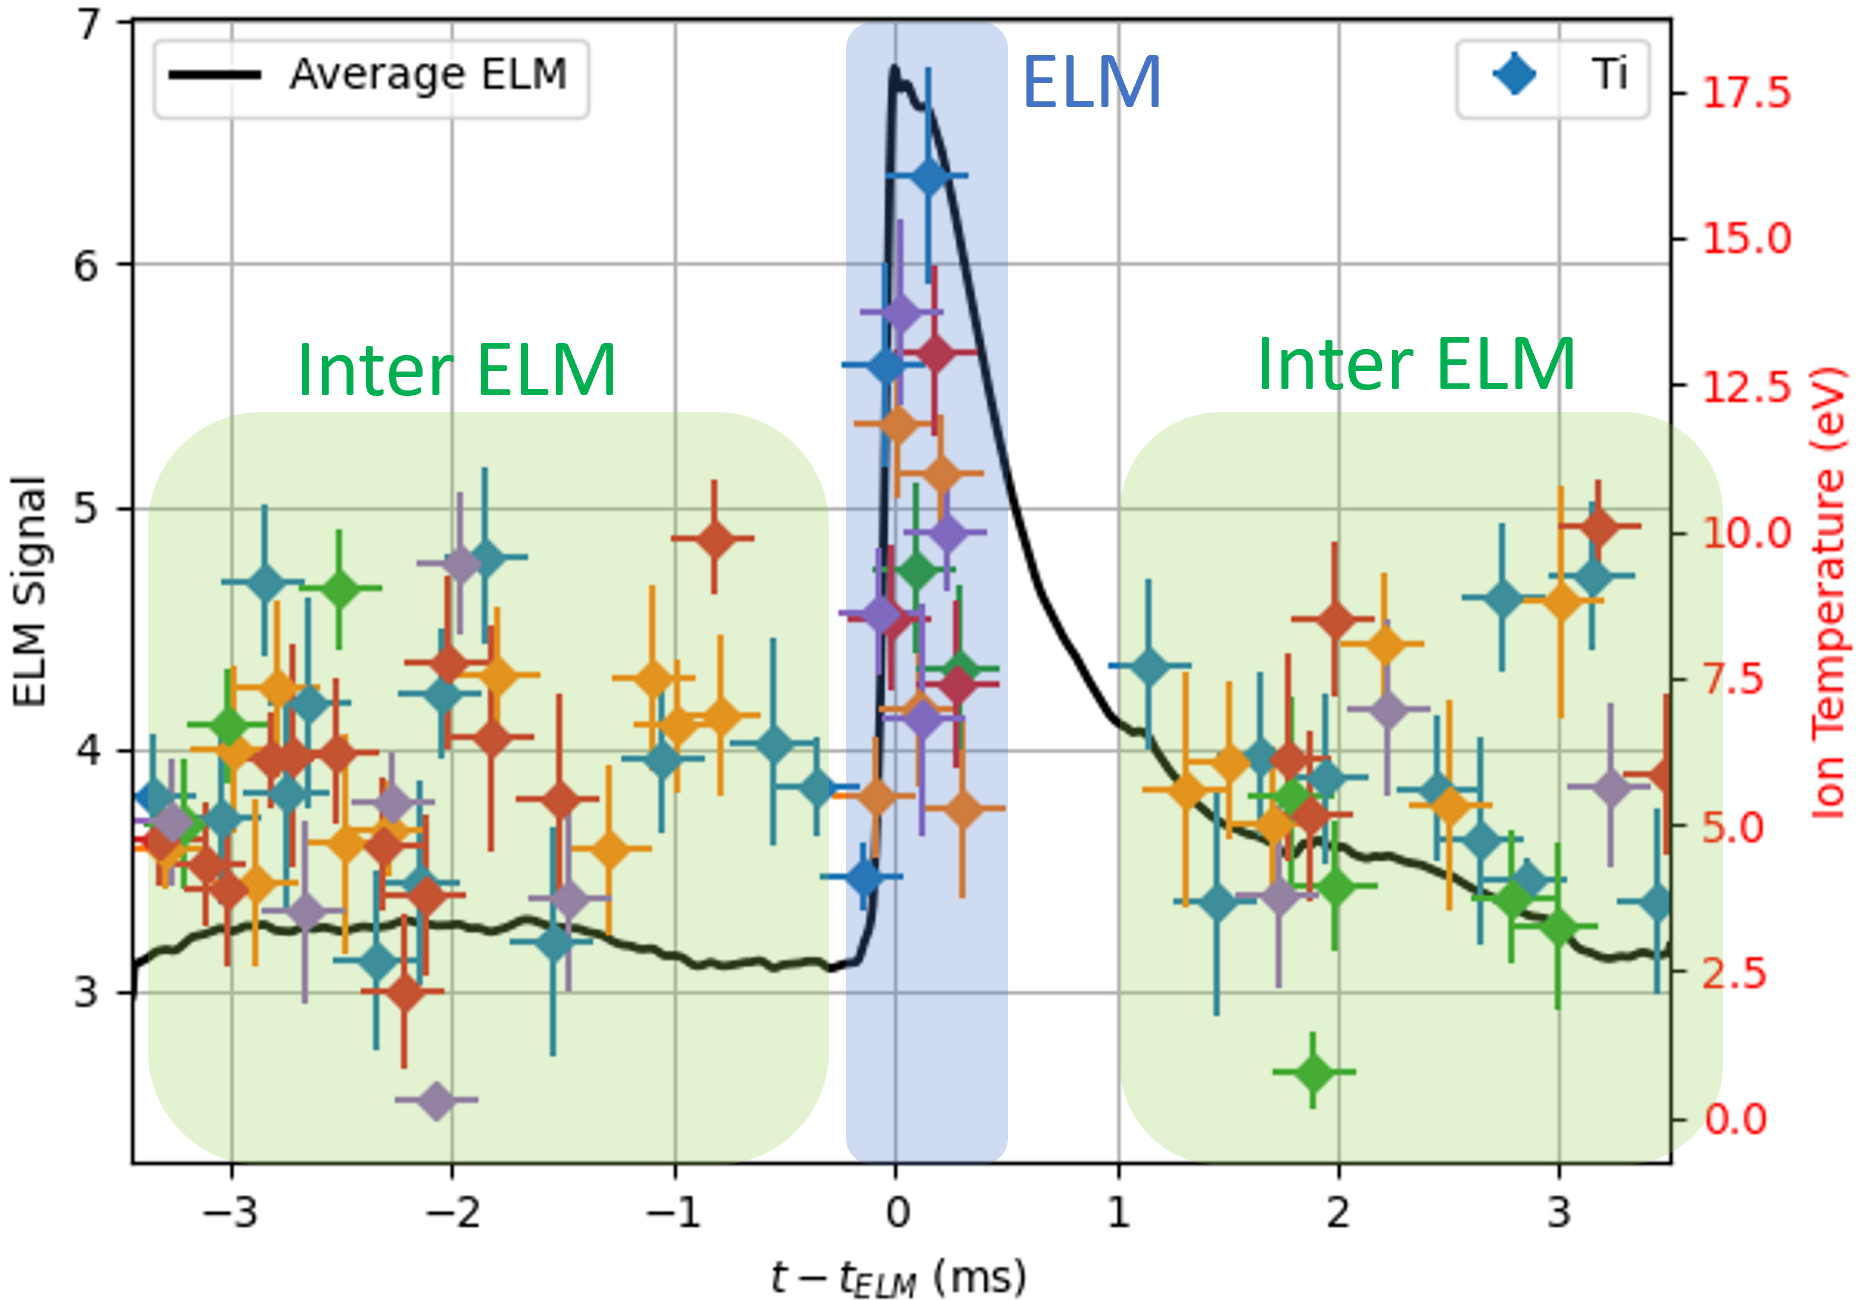
Figure 9 illustrates the temporal variation in during the ELM and inter-ELM periods, captured by the RFEA. During the ELM, the reaches a peak of , almost 3 times higher than the inter ELM average of . This elevated temperature correlates with the higher particle and energy fluxes to the divertor region, driven by the rapid release of energy during the ELM event. The peak area considered is marked by the blue rectangle in the plot, denoting the peak temperature measured from all the considered ELMs. This profile seem to exhibit a rapid ascent in coinciding with the onset of the ELM, followed by a steep decline immediately after the ELM peak. The gap from about 0.4 to 1 ms is due to the lack of collector current signal, which collapses to near zero after each ELM peak. The signal level returns to an analyzable values at approximately +1 ms. This behaviour could be consistent with the space charge limitation previously found in MAST RFEA data[14]. This is a build up of charge in the analyser head which cause a potential that can repel plasma entering the analyser. This can be addressed further lowering the voltage on the slit plate (Figure 2) when performing ELM measurements. In the inter-ELM region, the stabilizes to a lower average of , as indicated by the green area ( and ). This lower temperature phase reflects a more quiescent state of the plasma, where energy deposition to the target is reduced, and the plasma conditions are relatively stable.
4 Conclusions
This study presented the first measurements obtained utilizing RFEA diagnostic in the MAST-U divertor region during two particular shot with different configurations. The radial profile was measured during CD to SXD transition: has two peaks, at either side of the strike point, reaching 20 eV then decreasing further away from the strike point. was also analyzed along with data derived from LP at the same radial position. The comparison of and provided insights into the non-equilibrium characteristics of the plasma, with / ratios varying from 1 to 2.5 in line with previous studies[10]. Additionally, ion temperature measurements during ELMs show a very short (sub ms) increase about 3 times above the inter-ELM average. The implementation of the RFEA has proven to be a significant enhancement in the diagnostic capabilities of MAST-U, allowing for a deeper understanding of ion dynamics within the divertor region. The fast sweep method employed by the RFEA, enhancing the temporal resolution to 100 s, was crucial for capturing the rapid dynamics of ELMs. The variations in the ratio, indicative of complex interactions between ion and electron populations, highlight areas for further investigation, particularly concerning energy transfer mechanisms in the plasma SOL. The high temporal resolution of ELM measurements allowed for a new understanding of the ion temperature profile within ELMs as they impact divertor materials in the MAST-U divertor. Future research should focus on extending these measurements to higher power and longer pulse scenarios, which are critical for advancing towards the operational conditions expected in commercial fusion reactors. Furthermore, the RFEA settings could be optimized in future experiments to potentially capture the entire ELM profile. This might be achieved by increasing the current limit of the power supplies to prevent saturation in the slit plate signal and by further lowering the voltage of the slit plate grid to mitigate space charge limitations. Additionally, further refinement of plasma modeling based on these empirical data would enhance predictive capabilities. The insights gained from this study underscore the importance of continued study of the divertor region. Furthermore, RFEA measurements provide a new perspective by capturing ion temperature profiles near the target plate with high temporal resolution, which are challenging to measure with other diagnostics.
Acknowledgements
This work has been funded by the EPSRC Energy Programme, grant EP/S022430/1 and the University of Liverpool.For the purpose of open access, the author(s) has applied a Creative Commons Attribution (CC BY) licence (where permitted by UKRI, ‘Open Government Licence’ or ‘Creative Commons Attribution No-derivatives (CC BY-ND) licence’ may be stated instead) to any Author Accepted Manuscript version arising.
References
- [1] N Osborne et al., Plasma Physics and Controlled Fusion, vol. 66, no. 2, 025008.
- [2] Peter C Stangeby et al., Institute of Physics Pub, Philadelphia, Pennsylvania, 2000.
- [3] M Kočan et al., Review of Scientific Instruments, vol. 79, no. 7, 073502.
- [4] RA Pitts et al., Nuclear Fusion, vol. 46, no. 1, 82.
- [5] SY Allan et al., Plasma Physics and Controlled Fusion, vol. 58, no. 4, 045014.
- [6] Sarah Elmore et al., Bulletin of the American Physical Society, vol. 57.
- [7] S Elmore et al., Plasma Physics and Controlled Fusion, vol. 58, no. 6, 065002.
- [8] Peter J Ryan et al., Review of Scientific Instruments, vol. 94, no. 10.
- [9] Wayne Arter, Valeria Riccardo, and Geoff Fishpool, IEEE Transactions on Plasma Science, vol. 42, no. 7, 1932–1942.
- [10] M Kočan et al., Plasma Physics and Controlled Fusion, vol. 50, no. 12, 125009.
- [11] S Elmore et al., Plasma Physics and Controlled Fusion, vol. 54, no. 6, 065001.
- [12] A Kirk et al., Plasma Physics and Controlled Fusion, vol. 47, no. 2, 315.
- [13] R. Ochoukov et al., Review of Scientific Instruments, vol. 91, no. 6, 2020.
- [14] S. Elmore, PhD Thesis, University of Liverpool, 2013.