are comparable to the cross-sections related to the evolution of CO2 photodesorption, that are, depending on the flux, found between 4 to 20 times lower. This points towards a different mechanism for the CO2 photodesorption, decorrelated from the desorption of its photofragments or photoproducts.
| Photodesorption evolution cross section | Flux (photon/s/cm2) | ||
|---|---|---|---|
| for desorbing species | |||
| (cm2) | |||
| (cm2) | |||
| (cm2) | |||
3.2 Evolution of infrared spectra with photon fluence
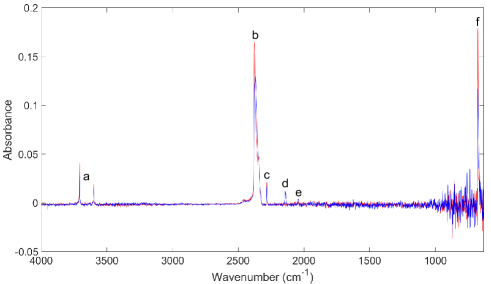
More information on the photon-induced processes in solid CO2, and their potential link to the photodesorption, can be accessed by monitoring the evolution of the photon-induced changes in the bulk ice as a function of photon fluence. Indeed, at 12 eV, the average penetration depth of the photons exceeds by far the studied ice thicknesses, and the whole ice volume should be affected by the irradiation. For this purpose, infrared spectroscopy was performed to monitor the pure CO2 ices during the irradiations, as stated in Part. LABEL:Experimental_Set-up. Fig. 4 presents RAIRS spectra, obtained on a 50 ML CO2 ice kept at 15 K, after the ice deposition, and after its irradiation using 12 eV photons with a flux of photons/s/cm2 and a total fluence of cm-2. Attributions of all the observed vibrational features were made using the work of gerakines_infrared_1995, escribano_crystallization_2013, baratta_infrared_1998, cooke_co_2016. In the spectrum of the deposited ice, all the observed peaks, labeled (a), (b), (c) and (f) in Fig.4, correspond to a particular vibration mode of solid CO2. The CO2 bending mode at 676 cm-1 (f) and asymetric stretching mode around 2350 cm-1 (b) are the dominant contributions to the spectrum. The band appears to be multi-component in our case, and will be discussed in more detailed in the following. The two bands at 3708 cm-1 and 3600 cm-1 (a) are associated with the combination modes and , respectively, being the symmetric stretching band. Finally, the band at 2283 cm-1 (c) is related to the stretching mode of the CO2 isotopologue. After irradiation, the main changes are the appearance of two new vibrational bands, at 2142 cm-1 and 2043 cm-1, labeled (d) and (e) in Fig. 4, associated with the presence of CO and CO3, respectively. The band at 2043 cm-1 related to the stretching mode of CO3 is the only band observed for this species, other vibration modes do not emerge from the noise. A general decrease in intensity of the CO2-related vibrational features is observed. This was expected as these two species were already reported to be the main photoproducts of the vacuum UV photolysis of condensed CO2.gerakines_infrared_1995, martin-domenech_uv_2015, sie_photodesorption_2019 The formation of a small amount of O3 was also reported in these studies, which should lead to the appearance of a vibrational band at 1043 cm-1 related to the vibrational mode of ozone. This however could not be clearly observed in our case, most likely because of our noise level in this spectral region and of the lower fluence range which has been used here.
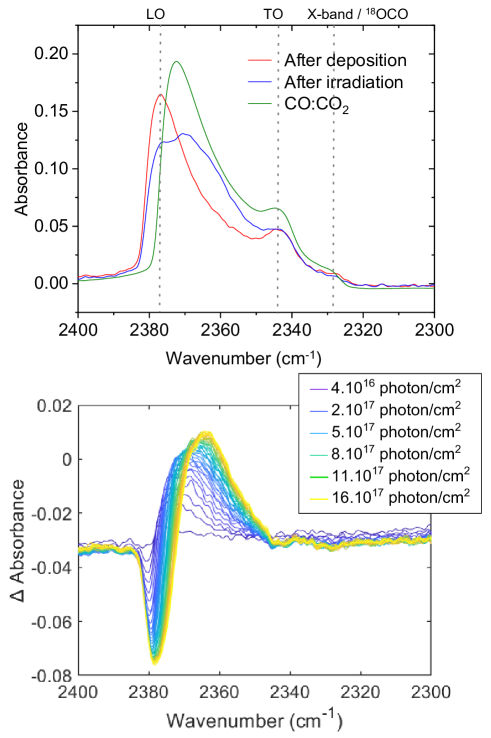
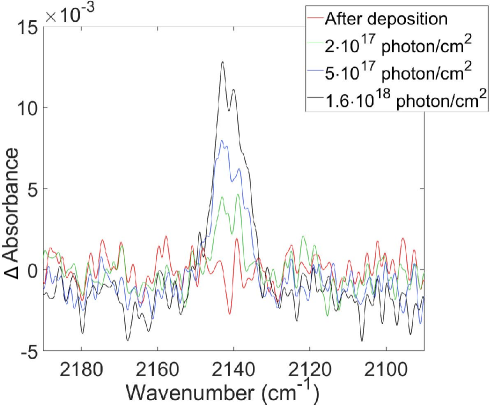
Fig. 5 (top) shows the spectral range of the CO2 asymmetric stretching mode after deposition of the ice, in red, and after irradiation, in blue. The lower panel shows the evolution of the difference spectra during irradiation. In our spectra, the stretching mode of deposited solid CO2 consists of two main components, at 2376 cm-1 and 2343 cm-1. Each of these structures is associated with the excitation of a specific optical phonon mode based on the vibration mode of the isolated molecule, propagating either in the longitudinal (normal to the surface) or transverse (parallel to the surface) direction in the ice, and labeled LO and TO respectively. In our RAIRS configuration, the incident IR beam presents a strong angle with respect to the surface normal (72∘), and is thus able to excite both.escribano_crystallization_2013, cooke_co_2016 Finally, the shoulder at 2328 cm-1 could be attributed to the so-called X-mode in the work of escribano_crystallization_2013, a feature associated with the amorphous phase of solid CO2. It should be noted, however, that this mode has not been observed in the RAIRS configuration in the the latter study. This feature could also be attributed to 18OCO as suggested by kataeva_infrared_2015, and thus cannot be used as a strong marker of the amorphous character of our samples. In order to clarify this point, we have performed IR spectrum of a crystalline CO2 ice grown at 50 K, which present a very different band profile than the CO2 grown at 15 K (see the Electronic Supplementary Information), giving us further confidence that our sample is in an amorphous phase before irradiation. The photon irradiation mainly impacts the LO mode, the intensity of which is decreased - and bears most of the negative contributions in the difference spectra – while the TO mode is kept almost unchanged and the X-mode only slightly modified. Another broad structure also appears at around 2360 – 2370 cm-1, and increases with the fluence, as can be clearly seen by the positive contribution to the difference spectra. Such structure in the CO2 mode has already been observed in the study of cooke_co_2016, and is related to CO2 molecules in interaction with CO, as is shown in the upper panel of Fig. 5. Indeed, the IR spectrum of an ice composed of a mixture of CO and CO2 has been recorded (green line). The proportion of this CO2:CO mixture has been chosen as 4:1, according to the amount of CO formed in the ice, observed in the TPD after irradiation. In our case, this contribution increases with fluence since, CO being the main photoproduct of the CO2 ice processing, the ice gradually evolves from a pure CO2 ice to a (predominantly) mixed CO:CO2 ice, which thereby affects the global shape and position of the CO2 asymmetric stretching mode. Therefore, the evolution of the band with fluence is a multiparameter process, since it reflects the total amount of CO2 which is photodissociated or desorbed, together with the amount of formed CO in the ice, each contribution presenting a priori different band strengths. Some photon-induced restructuring of the ice cannot be ruled-out either, which would induce some changes in the TO mode band strength which could compensate, in term of intensity, the global decrease of the number of CO2 molecules in the ice escribano_crystallization_2013. The fact that, after irradiation, the global band profile remains very different than the one of a CO2 crystalline sample, indicates that either no crystallization occurs during the irradiation within our flux and fluence conditions, or that its signatures are negligible compared to the chemical evolution of the ice. The study of tsuge_uv-ray_2020 has shown that UV irradiation of an already crystalline CO2 sample does not lead to its amorphization. They also concluded, from the study of martin-domenech_uv_2015, that UV could further crystallize a mixture of crystalline and amorphous CO2. The latter case cannot however be compared to our results on amorphous CO2 as the presence of crystallites in their sample is expected to favor crystallization by nucleation process.
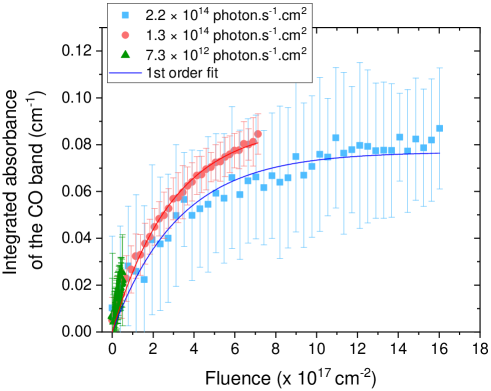
Due to all these overlapping contributions, the CO2-related vibrational features were considered bad candidates to quantify the ice evolution with fluence, both in term of photochemistry and of photodesorption. Instead, the CO-related vibration band at 2142 cm-1 was used in order to track the photochemical processing of the ice. We hypothesize that CO is a reliable tracer, even in the presence of other products such as O2, which is invisible in the infrared. Fig. 6 shows the IR spectra of the deposited and of the irradiated 50 ML CO2 ice at 15 K, in the spectral range of the solid CO vibration. With ongoing fluence, the formation and accumulation of CO in the ice is observed by the continuous increase of the CO vibrational peak. The band undergoes no spectral shift nor notable changes in its width during the irradiation, which suggests that the CO molecules are in the same local environment throughout the irradiation, i.e. embedded in the CO2 matrix. This was expected as, after irradiation, CO molecules account for a maximum of 20 % of the total of the remaining species in the ice, as revealed by TPD (see the electronic supplementary information). Therefore, the intensity of the CO band can be used to trace the chemical evolution of the ice with irradiation, as we do not expect its band strength to be strongly modified with irradiation time. This evolution was monitored by plotting the integrated absorbance of the CO-related vibration peak as a function of fluence, for the pure CO2 ice irradiated at 12 eV using the three previously mentioned flux conditions. Similarly to what was done for the desorption yields, each data set was then fitted with a first order single exponential law following:
| (5) |
with being the integrated absorbance of the CO peak, a fitting parameter corresponding to the asymptotic CO integrated absorbance (values are available in the ESI) and the photon fluence. This law introduces the cross-section which is defined as the evolution cross-section of the chemical modification of the CO2 ice film. It should be noted that the chemical evolution which is discussed here concerns mostly the bulk of the ice: since the IR probes the whole ice thickness, the weight of the surface chemistry in the IR spectra, i.e. in the top layer at the ice-vacuum interface (estimated to correspond to 1 ML), can be neglected with regards to the signal related to the remaining 49 ML of the bulk ice. The associated data and fitting curves are shown in Fig. 7, and the extracted values for are presented in Table 2. The single exponential law well describes the behavior of the increasing band area for the two irradiations at higher flux ( and photon/s/cm2). At the lowest photon flux, no asymptotic behavior could be reached during the irradiation time, therefore we were unable to use the exponential law to fit the data. The results obtained in the high flux regime compare well with past studies from gerakines_ultraviolet_1996 who also derived a first order law for the photoproduction of CO from CO2 ice irradiated with a broad-band hydrogen microwave discharge lamp. martin-domenech_uv_2015, on the other hand, reported a decrease of the fraction of CO in the CO2 ice in the high fluence regime, which they attributed to the growing importance of the recombination reaction competing with the CO production by direct photodissociation. This decrease was observed by martin-domenech_uv_2015 for fluences higher than cm-2, which is at the higher end of the fluences probed here. This might be why we do not observe this effect. For our two higher flux regimes, the kinetics for CO formation are found to be very similar, with very close evolution cross sections of several cm2, and no clear flux effect could be identified. Additionally, similar evolution cross sections are found in the case of CO3. In addition, it is worth noting that the values we find for the chemical cross sections are found to be very similar to those reported by martin-domenech_uv_2015, though a precise comparison should be done with caution as the photon energies were different.
| Evolution cross section | Flux (photon/cm2/s) | ||
|---|---|---|---|
| for detected species | |||
| (cm2) | / | 3.4 0.2 10-18 | 3.1 0.8 10-18 |
| (cm-1) | / | 8.9 0.2 10-2 | 7.7 0.9 10-2 |
4 Discussion on the photodesorption mechanisms from CO2 ice
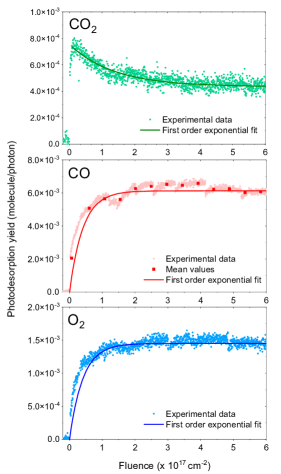
Fluence and flux dependent experiments have highlighted two different mechanisms for the photodesorption from CO2 ice. On the one hand, the photodesorption of CO2 presents no clear flux-dependency, and exhibits desorption evolution cross-sections of cm2. The photochemical evolution of the CO2 ice, estimated from the CO formation probed by RAIRS, exhibits the same general trend as the photodesorption of CO2. Although no values could be extracted from the lower flux irradiation, chemical evolution cross sections of the bulk ice were also found to be almost independent on the flux used in the high flux conditions, and the obtained values, i.e. cm2, are close to those associated with the CO2 photodesorption. This points toward a correlation between CO2 photodesorption and the chemical evolution of the ice bulk. On the other hand, the photodesorption yields of CO and O2 exhibit a strong dependence on both fluence and flux. The desorption evolution cross sections are found to be almost identical for each species, and vary over an order of magnitude depending on the flux value, from to cm2. In any case, these cross sections are found to be one to two orders of magnitude higher than those of the CO2 desorption, and are found to be totally decorrelated from the chemical evolution of the ice bulk. In the following, we propose two mechanisms for the photodesorption from CO2 ice that explain these experimental findings.
First, the photodesorption of CO2 is found to be almost independent from the photon flux, which indicates a process involving a single photon absorption. The process also depends on the chemical nature of the bulk ice. This may appear surprising at first, since the photodesorbing molecules should be located at the ice surface. However, this can be explained if the process involves a single photon absorption into the bulk, followed by the transfer of the excess energy to molecules located at the ice surface. This is in fact typical of the so-called indirect desorption induced by electronic transition (DIET) process, which has previously been identified in the case of CO- or H2O-containing ices.dupuy_mechanism_2021, andersson_theoretical_2011, del_fre_mechanism_2023 This type of DIET mechanism is indeed known to occur over the 3 to 5 topmost molecular layers of the ices,oberg_photodesorption_2009, munoz_caro_new_2010, bertin_uv_2012 and its efficiency, i.e. the energy transfer to the surface, depends on the chemical nature of the layers.bertin_indirect_2013 Here, we show that the CO2 photodesorption from a CO2 ice is mostly due to a similar DIET process: it explains both the independence of the desorption yields from the flux, and the evolution of the efficiency with ongoing chemical modification of the bulk. For the latter, the efficiency of the DIET energy transfer evolves as the ice does, including the topmost layers, pass gradually from a pure CO2 to a mixed CO:CO2 environment, as revealed by the infrared monitoring. Our work also indicates that any photochemically-induced desorption of CO2 is negligible, since it would imply flux-dependent desorption yields as will be discussed for the cases of CO and O2.
The proposed Indirect DIET mechanism for CO2 photodesorption is in strong agreement with martin-domenech_uv_2015, who concluded that the DIET process occurs in the upper layers of CO2 ice during irradiation. On the other hand, sie_photodesorption_2019 claim that only CO and O2 are desorbed by such an indirect DIET process. Photochemistry, even if DIET mechanism is not neglected, is believed to actively participate in the CO2 desorption, in contradiction with our findings. Such a discrepancy could originate from the fact that, in the study of sie_photodesorption_2019, the band strength of the IR stretching mode vibrational band of solid CO2 was considered not to be changing with fluence, which we have shown is not the case here due to the increasing effect of the photoproduced CO in its vicinity. This, in addition to the loss of CO2 due to the photochemistry, leads to inconsistent values for desorption rates measured by IR and by mass spectrometry. They corrected the photochemical effect by considering another photochemical pathway leading to the loss of C atoms. The question is open whether this process would still be needed if the fluence-induced change of the CO2 bandstrength was taken into account.
The photodesorption of both CO and O2 are found to originate from the same mechanism. The associated yields depend heavily on fluence and flux, and are decorrelated from the chemical evolution of the bulk ice. An hypothesis which would explain these facts is that they both originate from photon-induced surface chemistry, followed by the desorption of the photoproducts. This is supported by several points. First, as the yields depend on the photon flux, any process involving solely one photon, such as direct photodissociation of a surface CO2 molecule, resulting in its fragments desorbing into the gas phase, can be ruled out. The increase of the photodesorption yields of CO and O2 with fluence further confirms this, as it is inconsistent with a direct photodissociation of surface CO2 molecules, and more indicative of an accumulation of these products on the ice surface. Second, the CO and O2 desorption evolution cross-sections are found to be 10 to 100 times higher than that of the chemistry of the bulk ice. This rules-out a two step process, thereby implying (i) the formation of CO and O2 at the ice surface and (ii) an indirect DIET mechanism. Indeed, as previously discussed, the DIET process involves the bulk, and it would mimic the chemical evolution of the ice, resulting in lower evolution cross sections, and is thus inconsistent with what is observed. This also reveals that the CO and O2 production and desorption require many times fewer photons than the bulk chemistry, which is consistent with a surface process, where the diffusion of radicals, and thus the chemical evolution with fluence, is enhanced. To explain the CO and O2 desorption mechanisms, but also the fact that the photodesorption is more efficient at low flux, we propose a surface chemical process initiated by the photodissociation of surface CO2 molecules, leading to the production of hot O atoms, which can diffuse on the ice surface. It nevertheless should be noted here that our data do not provide any direct evidence of the exact photochemical pathways that are involved. In the following, we propose a scenario which fits with the above-mentioned experimental findings.
In the low flux regime, as the surface density of photon absorption events per time unit is low on the surface, the probability that the O atom encounters, and reacts with, another CO2 molecule should be dominant. In this case, our hypothesis is that the resulting surface reaction is responsible for the desorption of the CO and O2 via the following scheme, where () indicates a surface-located molecule, and () a molecule ejected into the gas phase:
| (6) |
Here, O is a produced oxygen atom which may be either translationally and/or electronically hot. The reaction is known to be endothermic by 340 meVpilling_mapping_2023. The process can occur through the formation of CO3, and comes with an energetic barrier of 1.53 eV for the O(3P) state and 481 meV for O(1D) statebennett_untangling_2004, grigorenko_theoretical_2020. However, the photodissociation of CO2 at 12 eV can produce oxygen atoms with excess energy up to 4.2 eV if the CO is formed in its fundamental vibrational state. At this photon energy, both hyperthermal ground state O(3P) with a maximum kinetic energy of 4.2 eV and excited O(1D) with a maximum kinetic energy of 2.1 eV, can be produced, which largely overcome the endothermicity and the barrier for the reaction. Whatever is the electronic state of the atomic oxygen, the reaction needs translationally hot oxygen atoms, as it has been reported by bennett_untangling_2004. As the excess energy of hyperthermal O atoms are expected to be quickly dissipated, it is expected that the process involves mostly neighboring CO2 molecules, as long range diffusion of the oxygen atom would prevent the reaction.
In the higher flux regimes, the efficiency of the process decreases. This can be related to the activation of a competing surface process. Indeed, in the high flux conditions, the surface density of photon absorption events per time unit increases, and so the CO and O surface densities. These surface densities can be roughly estimated, if one considers the dissociation probability of excited CO2 to be close to 1. Considering the absorption cross section cm2 cruz-diaz_vacuum-uv_2014 of CO2 at 12 eV, the amount of surface O and CO formed per second on the first molecular layer is of cm-2 in the low flux regime, and of cm-2 in the high flux regime. In the higher flux regime, the probability that an O atom, produced by a single dissociation event, meets another O atom or CO molecule originating from another dissociation event on the surface becomes higher and could compete with the O + CO2 reaction that dominates at low flux regimes. The resulting O + O or O + CO reactions result in the production of O2, or CO2 at the surface. It has been shown by minissale_dust_2016 that neither the O + O nor O + CO reactions lead to a detectable desorption of the products (less than 5% in their experimental conditions), which is consistent with our observations – even if direct comparison with this study should be done with caution as the kinetic energies of the atoms are different. Therefore, this process, only efficient at high flux, should reduce the general efficiency of the desorption, as shown experimentally. The proposed competing process at high flux can be summarized as follows:
| (7) |
It should be noted here that the reaction was found barrierless, contrary to the reaction , and can efficiently proceed via Langmuir-Hinshelwood mechanisms at 10 K.minissale_co_2013 In our case, the molecular oxygen formation can then be induced by thermalized O atoms at 15 K, and thus be initiated by long-range diffusion of the oxygens after their formation. This process can then be operative even in the low surface densities of formed O atoms per time unit, as thermalized oxygen atoms are known to present very high lifetime at low temperature bennett_untangling_2004. In terms of probability, it is thus more likely that the reformation of the molecular oxygen dominates gradually the surface photochemistry in the higher flux regime. The quicker chemical conversion of the surface CO2 to adsorbed CO and O2 competes with the low flux reaction which leads to the desorption of CO and O2.
5 Conclusions
In this work, we have studied the photodesorption of CO2, CO and O2 triggered by the irradiation of pure CO2 ices with vacuum-UV photons . We have focused our study on the effects played by both the fluence and the photon flux used in the experiments, and have compared the evolution of the desorption yields with those of the chemical composition of the bulk ice as measured by infrared spectroscopy. Our work shows that CO2 photodesorption proceeds mostly via a DIET mechanism, as was already hinted at in some previous experimental studies, and that the role of photochemistry is comparatively negligible, contrary to what was previously assumed. The photodesorption of CO and O2 involves different mechanisms, as neither the DIET process nor direct desorption of the photofragments of surface CO2 molecules can explain our findings. We propose that the desorption of these two species proceeds via surface chemistry, and involves reaction of photoproduced oxygen atom with neighboring intact CO2 molecules.
The monitoring of the photochemistry of the ice bulk using infrared spectroscopy has also revealed that the multicomponent CO2 asymmetric stretching vibrational absorption band is a bad candidate to accurately follow either the chemical evolution of the ice or the matter loss due to photodesorption. In particular, the progressive enrichment of the ice by CO molecules has a strong impact on both the spectral position, profile and intensity of the band, suggesting an important evolution of the overall band strength with the ongoing irradiation, precluding the use of the evolution of its integrated intensity with fluence as a means of quantifying the ice evolution. Some information can be drawn from it however, as our experiments have revealed that no discernible crystallization of the CO2 bulk ice occurs with UV irradiation.
Our work has also demonstrated that, depending on the mechanism(s) responsible for the desorption, different photon flux conditions will lead to different measured desorption yields. While desorption induced by DIET mechanisms were shown not to depend on the photon flux, in our probed flux conditions, both the efficiency and the kinetics of the desorption with fluence are strongly impacted by the photon flux when photochemical processes are at play. First, this first shows the importance of flux-dependent approaches to disentangle between bulk or surface located processes, and, though such a method does not allow to be totally conclusive, it brings strong hints on the several photochemical pathways which may be in competition during irradiation. Second, this is a very important point to consider when it comes to extrapolating experimentally-derived photodesorption yields to cold interstellar and circumstellar environments. Indeed, typical UV photon fluxes can vary over a wide range of values in the interstellar medium. In dense molecular clouds alone, values can vary significantly: UV flux resulting from cosmic ray interactions in dense cloudsshen_cosmic_2004 is, on average, approximately 103 to 105 photon/cm2/s-1, while at the edges of the clouds, fluxes can reach approximately 107 to 108 photon/cm2/s-1 due to the attenuated interstellar radiation field (ISRF)mathis_interstellar_1983. In any case, those interstellar fluxes are extremely low as compared to experimental UV fluxes. Most of the time, the astrophysical relevance of irradiation experiments are discussed only in term of total fluence, compared to the integrated fluence that an icy grain can receive during the lifetime of a molecular clouds, for instance. Here, we stress that not only the fluence, but also the flux has to be taken into consideration. The flux dependence is tightly bound to the nature of the desorption mechanisms, having potentially important effects as far as photochemistry is involved.
Conflicts of interest
There are no conflicts to declare.