Benchmarking SLAM Algorithms in the Cloud: The SLAM Hive System
Abstract
Evaluating the performance of Simultaneous Localization and Mapping (SLAM) algorithms is essential for scientists and users of robotic systems alike. But there are a multitude different permutations of possible options of hardware setups and algorithm configurations, as well as different datasets and algorithms, such that it is infeasible to thoroughly compare SLAM systems against the full state of the art. To solve that we present the SLAM Hive Benchmarking Suite, which is able to analyze SLAM algorithms in 1000’s of mapping runs, through its utilization of container technology and deployment in the cloud. This paper presents the architecture and open source implementation of SLAM Hive and compares it to existing efforts on SLAM evaluation. We perform mapping runs of many of the most popular visual and LiDAR based SLAM algorithms against commonly used datasets and show how SLAM Hive and then be used to conveniently analyze the results against various aspects. Through this we envision that SLAM Hive can become an essential tool for proper comparisons and evaluations of SLAM algorithms and thus drive the scientific development in the research on SLAM. The open source software as well as a demo to show the live analysis of 100s of mapping runs can be found on https://slam-hive.net.
Index Terms:
SLAM Benchmarking, Cluster.I Introduction
Simultaneous Localization and Mapping (SLAM) is an essential capability for many robotic systems. Consequently, there is lots of research work on SLAM, utilizing various types of sensors and algorithms and employing these to various application scenarios [1]. In order to scientifically evaluate the performance of SLAM systems, experiments with them must be reproducible, repeatable and properly compared to other solutions.
Running SLAM algorithms with pre-recorded datasets is essential for this, as it allows to repeatedly perform mapping runs with the exact same data. Using ground-truth path information for said datasets it is possible to quantitatively evaluate the localization error of the mapping run, which is generally considered a sufficient measure for the performance of SLAM algorithms [2].
Furthermore, methods should not only be evaluated against the Absolute Trajectory Error (ATE) and Relative Pose Error (RPE) w.r.t. the ground truth path, but memory consumption, processing time or map quality can also be important factors to consider.
For SLAM algorithms, although the diversity enables the research to flourish, the following problems of low portability and difficulty in forming a unified specification make it difficult to evaluate different slam algorithms. How to run and evaluate different algorithms on the same platform quickly and simply is a problem worth studying.
SLAM is a complex topic and the performance of an approach depends on various factors, including the type of environment, the path the robot took in that environment, sensor types, sensor placement on the robot, settings for the sensor data like frame rate, resolution or maximum range, as well as various configuration parameters for the algorithm like number of particles, number of features or various other thresholds and settings.
A robotics engineer who wants to deploy a SLAM system for a specific application should be able to select the best SLAM algorithm, given the number and quality of sensors and computing resources his scenario allows for. Likewise, scientists developing SLAM software should be able to evaluate the performance of their solution under various aspects and configurations. But the number of mapping runs needed to exhaustively test an algorithm under many permutations of configurations is very big - e.g. comparing 10 algorithms with 5 different configuration each, 10 sensor combinations (e.g. front camera or back camera or both, etc.), 4 different resolutions, 4 different frame rates and 10 different datasets with different environments and amounts of loops, requires 80,000 mapping runs. But currently papers on SLAM only test with and against very few mapping runs.
To solve above problem, there are still much to be done:
Firstly, to finish such big tasks fast and balanced, a powerful computational environments and supporting software system are required urgently. With the development of the high performance computational cluster and some mature cluster schedule tools like kubernetes, it’s possible to provide such a platform.
Furthermore, after finishing those running tasks and getting the results, how to analysis them using a comprehensive and grace way is also important. People usually prefer to read some straightforward and understandable visualized charts and statistical analysis of the results than the raw boring data.
And a structured database storing numerous mapping task results is also useful. To the best of our knowledge, there is no current work that applies databases to slam evaluation. Structured data will be more beneficial for us to analyze the results. And when the data in the database is much enough, it can be used as an index library in theory, and users can search for the satisfied algorithm and the corresponding configuration by inputting conditions
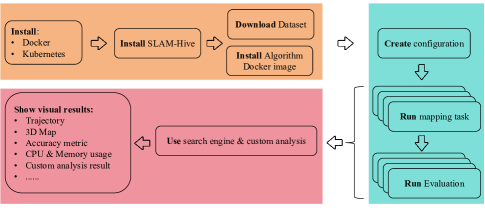
Fig. 1 shows an overview of the SLAM Hive System. Using SLAM Hive benchmarking suite [3], we implement a cross-platform SLAM algorithm automatic running and evaluation software system. It is intended to be deployed in different kinds of cluster (local cluster or cloud server platform like Aliyun) in order to be able to perform and evaluate 1000’s of mapping runs, but can also be used stand-alone on a workstation. The suite is ready for running and evaluating algorithms, the basic function of SLAM Hive Benchmarking Suite. Besides, in software, there is a set of functions that correspond to the complete evaluation process, including: the automated creation of many mapping run configurations, the Kubernetes orchestration for deployment in a cluster and schedule of many docker containers and the Meta Analysis for analyzing the results of the 1000’s of mapping run evaluations. We invite interested researcher to contribute to the development of SLAM Hive, which is available on GitHub 111https://github.com/SLAM-Hive.
The key contributions of the SLAM Hive System are:
-
•
Defining and implementing a cross-platform framework performing mapping runs of various SLAM Algorithms using various configurations and datasets, evaluation of the results of these mapping runs using (different) evaluation algorithms in Docker containers. The system can be deployed on workstation, local and cloud cluster.
-
•
Providing a Web interface. We run the mapping tasks, evaluation and also the SLAM system itself in docker containers. Users can do all of the operations by this interface.
-
•
Using Database to store the result of mapping running and evaluation structurally. Based on the flexibility of DB, we implement a search engine for users to find required algorithm configuration.
-
•
Deploying our system on clusters, configuring and running thousands of such mapping runs with different permutations of configurations automatically scheduled by our cluster controller based on Kubernetes.
-
•
Performing a meta analysis tool called “custom analysis”, which can be used to comprehensively evaluate and analyze the mapping runs from various aspects.
This work is an extended version of the conference paper [3]. This paper presents the basic framework of the SLAM Hive Benchmarking Suite. We extended the content in the following ways:
-
•
Complete the unfinished work mentioned in [3].
-
•
Implement a cross-platform automatic SLAM algorithm evaluation software that can be deployed on both workstation and cluster. Besides, we deploy our system on different types of clusters, like local cluster and cloud server platform Aliyun and make related experiments. This extension is the key to realize the big scale SLAM algorithm mapping runs.
-
•
Propose a meta analysis method called “custom analysis” as well as a search engine based on our database, providing a generalized way for research community to analysis their SLAM algorithms.
-
•
We do a series of complex benchmarking experiments with our system, such as exploring the wide parameter space of the algorithm. we take the ORB-SLAM3 algorithm as an example to explore the parameter space and analyze it from various aspects. Experiment results show the comprehensiveness and flexibility ot our system. The open source software as well as a demo to show the live analysis of hundreds of mapping runs can be found on https://slam-hive.net.
II Related work
II-A SLAM Datasets
Public datasets play a fundamental role in the evaluation of Simultaneous Localization and Mapping (SLAM) algorithms. At present, numerous widely recognized public datasets are available to researchers, such as the TUM RGB-D dataset [4] which includes depth values, the KITTI dataset [5] often employed in autonomous driving, and the EuRoC MAV dataset [6] acquired using unmanned aerial vehicles (UAVs). The TUM VI benchmark introduced a distinctive dataset showcasing diverse sequences in various environments designed to assess Visual Inertial Odometry (VIO) algorithms. To validate its benchmarking potential, this study features the outcomes produced by three state-of-the-art open-source methods- ROVIO, OKVIS, and VINS-Mono. The obtained outcomes indicate the presence of significant drift, even under long-distance and visually demanding sequences, thus providing researchers with a suitable dataset for evaluating high-performing algorithms [7]. It is clear that the development of SLAM necessitates more rigorously demanding datasets to effectively evaluate SLAM systems.
Among the recently released datasets, [8] published the Openloris-Scene, a dataset designed specifically for service robots in dynamic and daily-changing environments. [9] presented TartanAir, a challenging dataset collected in realistic simulated environments with various dynamic factors to take into consideration such as moving objects, lighting changes, and weather conditions. [10] developed PanoraMIS, a dataset utilizing a panoramic camera to capture a 360-degree view of the environment. [11] proposed the USVInland Multisensor Dataset, a dataset specifically designed for the purpose of underwater missions. [12] collected a challenging dataset in a volcanic environment using a handheld sensor component that can be implemented on a space exploration rover. The dataset includes more than 4 kilometers of travel on the soft volcanic slope, making it a difficult task both visually and structurally.
[13] introduced The Newer College Dataset, a large dataset utilized to test positioning and mapping systems. Using handheld devices, they collected data while walking around 2.2 kilometers of the Oxford University New College, which combines built environments, open spaces, and vegetation areas. [14] built upon the dataset proposed in [13], by extending The Newer College Dataset to include a multi-camera lidar-inertial dataset of a 4.5-kilometer walking distance. The newly extended dataset presented more challenging scenarios compared to the original dataset, such as rapid alterations in lighting, textureless surfaces, and fast motion.
Numerous autonomous driving datasets have surfaced alongside the well-known KITTI dataset [5]. Among them are UrbanLoco [15], DSEC [16], and Oxford Radar [17]. The Audi Autonomous Driving Dataset A2D2 [18] has also been made publicly available and comprises images, 3D point clouds, 3D bounding boxes, semantic segmentation, instance segmentation, and data taken from buses. The sensor suite of the A2D2 includes six cameras and five lidars, which provide a 360-degree view. Additionally, [19] proposed a new dataset: Waymo Open Dataset, which is large-scale, diverse, and high in quality. Comprised of 1150 traffic sequences, each spanning 20 seconds, the dataset covers a range of locales, both urban and suburban, and contains well-synchronized and calibrated high-quality lidar and camera data. Lastly, the dataset stands out as being 15 times more diverse than the largest dataset of such kind, according to the diversity metric proposed in the paper. In 2020, [20] introduced NuScenes, which is the pioneering dataset consisting of a comprehensive autonomous automobile sensor suite, comprising six cameras, five radars, and one lidar, all with 360-degree panoramic views. The NuScenes constitutes 1000 scenes, with each scene lasting 20 seconds and containing the full annotation of 23 classes and 8 attributes of 3D bounding boxes. The number of annotations in the NuScenes dataset is seven times larger than that of the KITTI dataset, and its image count is one hundred times greater than that of the KITTI dataset. [21] introduced the Brno Urban Dataset, which supplies data obtained from four WUXGA cameras, two 3D lidars, an IMU, an infrared camera, and a centimeter-precision differential RTK GNSS receiver. All datasets possess accurate timestamps with sub-millisecond precision, rendering them applicable to a broader range of purposes.
[22] introduced the Hilti SLAM Challenge Dataset, which contains indoor and outdoor sequences from varying environments, such as offices, laboratories, buildings, construction sites, and parking lots. These sequences share a common characteristic of having featureless areas and encounter varying lighting conditions, which are typical of real-world scenarios, making it a significant challenge for SLAM algorithms that have been developed in controlled laboratory environments. The Hilti-Oxford Dataset, subsequently proposed in [23], tests the limits of the state-of-the-art SLAM systems. It comprises complex sequences shot in diverse locations, ranging from sparse and regular construction sites to 17th-century neoclassical buildings with intricate details and curves. The paper introduces a data collection platform, equipped with one lidar, five cameras, and one IMU, to encourage multimodal SLAM methods. The Hilti-Oxford Dataset’s diversity and multimodality drew a vast number of academic and industrial researchers to participate in the Hilti SLAM Challenge. The results revealed that, while the top three teams achieved an accuracy of 2 cm or better in some sequences, the challenging sequences caused a decline in their performance.
[24] introduced a new large-scale dataset-M2DGR, collected by a ground mobile robot with a complete sensor component, including six fisheye cameras, one sky-facing RGB camera, one infrared camera, one event camera, one visual inertial sensor, one IMU, one lidar, one GNSS receiver, and one GNSS-IMU navigation system with real-time kinematics (RTK) signals. All these sensors are well calibrated and synchronized. The dataset includes 36 sequences (about 1 TB), captured in various scenes, including indoor and outdoor environments. This is the most extensive dataset in terms of sensor types and quantity known to date, but its RGB camera has a capture rate of only 25Hz, which many modern SLAM algorithms can easily handle with higher frequency data.
[25] conducted a detailed survey of robot-related datasets and listed various attributes of the datasets. The paper indicated that an ideal dataset should include many different types of sensors, pointing in different directions, with high resolution (which can be scaled down to simulate low-resolution sensors), high frame rates (which can simulate low frame-rate systems), hardware synchronization, good calibration, and ground truth. The paper introduces a data collection robot using nine cameras (four stereo cameras facing front, left, right, and upward, and one monocular camera facing backward), two Velodyne HDL-32E 3D lidars, and one IMU. The robot is equipped with an Intel Core i7-6770k processor and additional USB 3.0 interfaces to connect cameras, but it can only collect full-resolution image data at a frequency of 10 Hz due to processor performance limitations. Sensors can provide a large amount of data, especially RGB, RGB-D, and event cameras, which can typically collect over 600 MB of images per second. The camera used in the paper [25] can provide 2448 x 2048 pixel images at the highest frequency of 75Hz, corresponding to 1.05GB/s 8-bit RGB data in debayer format. Considering the limitations of computer performance, resolution or frame rate is often reduced to avoid massive datasets.
| System | Dataset Support | Data Types | Run any alg. in Docker | Monitor CPU & Memory | Automated Evaluation | Meta Analysis | Deploy in Cluster | Year |
| RAWSEEDS [26] | RAWSEEDS | mono, stereo, IMU | 2006 | |||||
| KITTI Vision [27] | KITTI dataset[5] | mono, stereo, IMU, LiDAR | 2012 | |||||
| TUM RGB-D [4] | TUM RGB-D dataset | RGB-D, IMU | 2012 | |||||
| ICL-NUIM RGB-D [6] | Simulation data | mono, stereo, RGB-D, IMU | ✓ | ✓ | 2016 | |||
| EVO [28] | Trajectories meet specific formats* | mono, stereo, RGB-D, IMU, LiDAR, etc. | 2017 | |||||
| TUM VI [7] | Simulation data | mono, stereo, RGB-D, IMU | ✓ | ✓ | 2018 | |||
| SLAMBench [29, 30, 31] | 9 public datasets | mono, stereo, RGB-D, IMU | ✓ | ✓ | 2019 | |||
| GSLAM [32] | 9 public datasets | mono, stereo, RGB-D, IMU | ✓ | ✓ | 2019 | |||
| VINSEval [2] | Simulation data | mono, stereo, RGB-D, IMU | ✓ | ✓ | 2021 | |||
| SLAM Hive | any ROS bag | mono, stereo, RGB-D, IMU, LiDAR, etc. | ✓ | ✓ | ✓ | ✓ | ✓ | 2024 |
-
*
EVO is to evaluate the trajectory output by the algorithm. The supported trajectory formats are: ’TUM’ trajectory files, ’KITTI’ pose files, ’EuRoC MAV’, ROS and ROS2 bagfile with geometry_msgs/PoseStamped, geometry_msgs/TransformStamped, geometry_msgs/PoseWithCovarianceStamped or nav_msgs/Odometry topics or TF messages. .
II-B SLAM Evaluation Systems
Until now, evaluation systems for a number of SLAM algorithms have emerged. Proposed by [33, 34, 26], the RAWSEEDS project is an early benchmarking toolkit focused on sensor fusion, localization, mapping, and SLAM evaluation for autonomous mobile robots. The paper highlights that the absence of benchmarks is an acknowledged problem in the field of robotics with twofold repercussions. Firstly, it obstructs the recognition of advanced scientific technologies which consequently affects further research and development. Secondly, it deters new entrants from venturing into robotics as significant investments are required to compensate for this lack. RAWSEEDS furnishes high-quality multi-sensor datasets and characterizes good benchmarking problems (BPs) based on these datasets. Moreover, users can tailor benchmarking solutions (BSs) that meet the BPs. Despite the absence of complete reproducibility and automation capabilities of the project, it still remains as an initial reference for assessing the scientific achievements in SLAM.
The famous KITTI Vision Benchmark Suite [27] provides a set of tools that can evaluate the accuracy of the stereo, optical flow, odometry and object recognition, but it can only use the KITTI dataset of the autonomous driving scenarios they provide and only evaluates the path provided by the user, so it doesn’t run the SLAM algorithm itself.
In addition to providing the RGB-D dataset, [4] also provides automatic evaluation tools both for the evaluation of drift of visual odometry systems and the global pose error of SLAM systems. In that paper, they evaluate the quality of the estimated trajectory instead of the resulting map and accurate ground truth maps. The two well known metrics: RPE and ATE were defined. For both evaluation metrics, they provided easy-to-use evaluation scripts for the users. On this basis, EVO provides executables and a small library for handling, evaluating and comparing the trajectory output of odometry and SLAM algorithms [28]. It supports different trajectory formats and it’s easy to output some nice comparison charts.
A series of papers [29, 30, 31] analyzes and compares existing SLAM evaluation systems. SLAMBench proposed that contrast accuracy alone is not enough, it presented a SLAM performance benchmark that combined a framework for quantifying quality-of-result with instrumentation of execution time and energy consumption [29]. SLAMBench2 proposed that different SLAM applications can have different functional and non-functional requirements. This benchmarking framework evaluates eight existing SLAM systems that are lined as a library, over ICL-NUIM, TUM-RGDB and EuRoC MAV datasets, while using a comparable and clearly specified list of performance metrics [30] . SLAMBench3 added new support for scene understanding and non-rigid environments (dynamic SLAM), and put forward the corresponding accuracy metrics [31]. Although SLAMBench, SLAMBench2 and SLAMBench3 are as comprehensive as possible and support plug and play, it is not as general SLAM Hive w.r.t. adding algorithms, as those need to be linked against SLAMBench, while SLAM Hive runs them in their environment in a container - SLAM Hive could theoretically even support algorithms coded in MatLab and/ or other operating systems. Moreover, SLAMBench only supports camera (and IMU) data, no LiDAR or other data.
The TUM VI benchmark published a novel dataset with a diverse set of sequences in different scenes for evaluating visual-inertial odometry (VIO). To verify that the dataset is suitable for benchmarking, it provides the results of three open-source state-of-the-art methods: ROVIO, OKVIS and VINS-Mono, which shows that even the best performing algorithms have significant drift in long (magistrale, outdoors) and visually challenging (slides) sequences [7]. It can be seen that the development of SLAM urgently needs more challenging datasets for SLAM systems evaluation.
[32] introduce a novel SLAM platform which provides not only evaluation functionality, but also useful toolkit for researchers to quickly develop their own SLAM systems. GSLAM implements a set of interfaces which makes it easy to interact with different datasets, SLAM algorithms, common optimized modules and applications with plugin forms in an unified frameworks. Besides c++, GSLAM also provides other programming languages such as Python and JavaScript for learning based and web based SLAM applications.
Lastly, VINSEval presented a unified framework for statistical relevant evaluation of consistency and robustness of Visual-Inertial Navigation System (VINS) algorithms with fully automated scoreboard generation over a set of selectable attributes [2]. VINSEval uses FlightGoggles, a development environment envisioned to allow the design, implementation, testing and validation of autonomous super vehicles, to generate simulation data with different IMU noisy, amount features, illumination and time delay instead of the real dataset.
Table I shows an overview the existing SLAM evaluation systems. According to the studies mentioned above, it can be found that KITTI Vision Bnechmark Suite [27], RGB-D SLAM systems benchmark [4] and the TUM VI benchmark [7] all publish a dataset and provide tools or easy-to-use scripts for evaluating the output of existing SLAM methods. All of them only support using the dataset they provide, which limits the breadth of evaluation of different SLAM algorithms. The SLAMBench series [29, 30, 31] provided more evaluation metrics, supported many algorithms and datasets, but is limited to SLAM algorithms linked against it. Also, it does not support Meta Analysis of many mapping runs, nor performing or creating them automatically. GSLAM[32] provides a unified platform for both SLAM system evaluation and development, but it may losses of flexibility in the development process and is hard to evalute exist SLAM algorithms for the rebuilding of the code. VINSEval [2] provides a robust evaluation method for the visual SLAM community, however it is difficult to ensure the correlation of simulated data with real data and they don’t support other sensor data like LiDARs.
III SLAM Hive
Our previous work in [3] introduced an automated SLAM algorithm evaluation system named “SLAM Hiv”. It uses Docker containers to execute and evaluate the algorithms, and supports many different configurations for evaluation, such as different resolutions, different frame rates, and different configuration parameters of the algorithm (such as different number of feature points or particles). The system records memory and CPU consumption and evaluates the accuracy of the map. The results can be displayed on the web interface. In addition, the system saves the configuration parameters in the database for further analysis and comparison. Fig. 3 shows an overview of the functionality of the system.
Based on framework [3], we implement a cross-platform automatic SLAM algorithm evaluation software named ”SLAM Hive System”. It can be deployed on both workstation and cluster. Besides above functions, it can perform and evaluate thousands of mapping runs simultaneously in different kinds of computation cluster environment and store the results in Database and local files system with a structured form, reused in newly developed search engine and custom analysis modules. Our system’s overview is shown as Fig. 1
III-A Overview
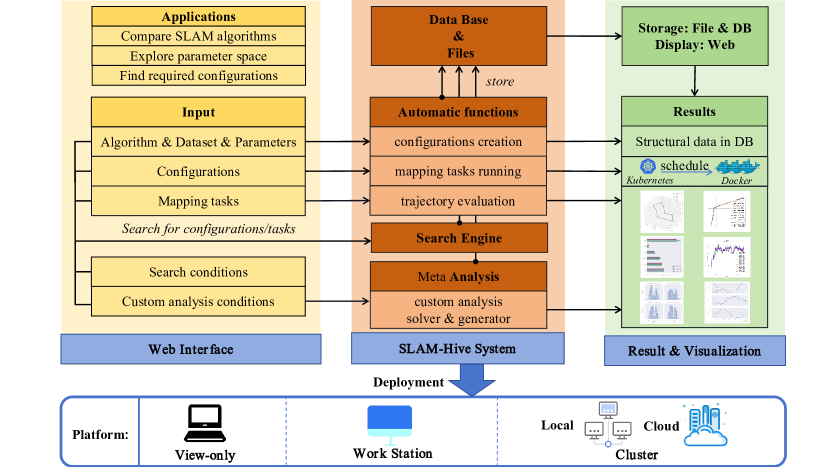
As far as we know, the SLAM Hive system is the first cross-platform SLAM benchmarking framework that can be deployed across different types of hardware environments. our system provides a graphical Web interface for users to view, config, run and evaluation the SLAM algorithms. And to fully evaluate the algorithm, we also support custom configurations and several performance metrics. The parameters of all tasks and their evaluation results are recorded in the database, facilitating meta analysis based on historical tasks data. At the same time, SLAM Hive has a strong scalability, as it can be also deployed in different kinds of clusters and operating system, which is a novel innovative way in the field of SLAM benchmark.
III-A1 Easy-to-use GUI
SLAM Hive system operates entirely through a web-based GUI. We provide pre-built Docker images, as well as generic mapping execution scripts, dataset scripts, and configuration files for various SLAM methods. Users can simply select their preferred algorithm and dataset, input the desired parameters, create a new mapping task and evaluate the trajectory results.
III-A2 Custom Configurations
Table II shows the SLAM methods and datasets that our system has supported, covering different sensor types. The implementation of algorithm is not limited to a particular operating system (such as ROS) and open source or not. All you need to do is adding a running script and standard format output defined on github. The system supports custom configurations including algorithm parameters, datasets parameters, topic remap, datasets resolution and frequency, convenient to explore the big space of parameters and find the best configuration of special application scenarios. For more comprehensive analysis, we also provide automated configuration generation method by inputting the conditions, which is easily to create thousands of mapping run configurations automatically.
III-A3 Comprehensive Evaluation Metrics
There are various metrics to evaluate a SLAM algorithm. Among them, the accuracy of estimated trajectory is a important indicator to measure the quality of algorithm results. Our system can visually and statistically compare the estimated trajectory with the groundtruth, for example plot the trajectory and compute their ATE and RPE. In addition, the resources consumed during the running of algorithm also need to be taken into account, such as CPU and memory usage. We utilize a monitoring tool called cAdvisor to perform real-time resource monitoring.
III-A4 Meta Analysis
Since different users will run and evaluate tasks with different combination of SLAM algorithms, datasets and configurations, a large number of structured data results are accumulated in the system. We firstly implement a search engine, which is easy for users to provide some structured limitations, such as: ”, to get the satisfied configurations. Then using the search engine and massive amount of data, we propose a yaml format rules and relevant file resolver and custom analysis generator, can load all historical data from the database, including the results metrics and algorithm parameter values, and automatically generate various evaluation indicators in the form of tables and diagrams as well as raw data for users to customize their own analysis. Users can analyze algorithms from different dimensions by comparing different metrics of algorithms, such as : ”Resolution vs. Trajectory ATE”, ”Frame Rate vs. Computation Time”, ”Left camera vs. Back camera”, ”LiDAR vs. RGB-D”, etc. By this function, users can perform many tasks that previously seemed difficult.
III-A5 Scalability
It’s simple to expand new algorithms, datasets and evaluation methods as for our system standard API and Docker container environment. Now we have builds different types of SLAM algorithms and datasets. The detail can be seen in Table II.
And benefit from the Docker container environment, system can be migrated to different systems and environments with few code modifications.
III-B Workflow
For workstation version, the workflow is introduced in [3]. For cluster version, after setting the Docker and Kubernetes environment, users can create thousands of mapping run and evaluation tasks through the web controller. The process is transparent for users, as the creation, running and destruction of containers, as well as the distribution of tasks and collection of results are completely automated through our cluster controller.
When a large amount of result data has been accumulated in the system, users can utilize search engine and custom analysis tools to directly assess these results in various search engine and custom analysis tools to comprehensively assess these results in various ways.
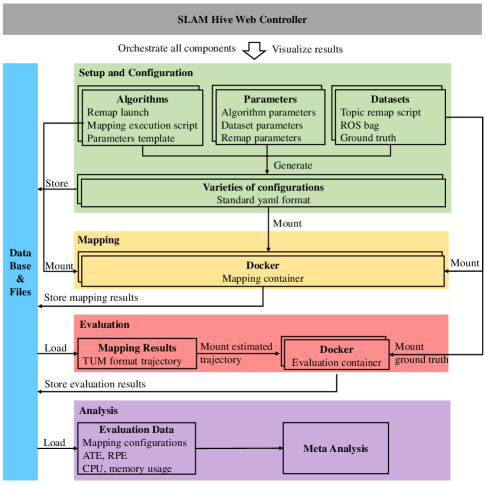
The workflow of SLAM Hive is also shown in the Fig 2.
IV SLAM Hive Components
IV-A Visual Web Controller
The graphical user interface is provided by the web controller, which is built using the lightweight web application Flask. Serving as the control center, it handles the creation of mapping and evaluation tasks, and also facilitates the addition of new algorithms, datasets, parameters, and configurations. Additionally, users have access to a search box and a meta-analysis file submission tool. With an integrated database, the system can store all historical information, which the front end displays to users.
For the workstation version, once a new task is created by the web controller, all of the information including the selection of algorithm and dataset, and configurations with many parameter values are recorded to database. Then a thread can be created at the back end of the controller to start the mapping task and monitor the completion of the task at all times. When the task is completed, a completed notification will be displayed on the front end. In addition, users can add their own new algorithms, datasets and parameters on the web controller by easy step. The evaluation results can be displayed in the form of pictures, tables on the web controller, making it clear to compare the benchmark results. Furthermore. in contrast to the command-line tools and simple desktop app provided by previous benchmarking works, our Web GUI, benefited by its flexibility, can better display a rich variety of dynamic visualized results.
And for the Cluster version, we implement a middle controller module called Cluster Controller, based on an open source container orchestration engine - Kubernetes. Controller is responsible for the entire life cycle of the task containers.
IV-B Standard Interface
Standard interface is an important guarantee that the system has the ability to expand and megrated.
IV-B1 Standard Container
It’s difficult to create an unified environment for all algorithms, since different SLAM software require different system environments. Docker is an open source application container engine that can package applications and dependencies into lightweight containers. Using the same Docker image repeatedly will not modify the image itself, ensuring that the same Docker image will be the exact same environment. We provide many SLAM methods and an evaluation Docker image, all mappings and evaluation on SLAM Hive are executed in standard Docker containers. In order to ensure the validity of already performed mapping runs, containers may not be modified after being added to SLAM Hive - if changes are needed one will have to add a new algorithm container. Currently all our algorithms support ROS 1.0, either out of the box or through slight modifications by us. But if needed, the algorithm script (which is included with the algorithm docker) might also extract the data from the ROS data stream to feed it to the algorithm in the format it requires.
IV-B2 Hardware Environment
For SLAM algorithm benchmark, not only require uniform system environment, the consistency of hardware environment, such as CPU type and Memory size, is also crucial. It’s relatively simply for workstation to ensure a totally same runtime environment, just by running tasks serially. But It will spend long time if the number of tasks is very huge. So, our work implements a cluster version system, which can be deployed in different kinds of clusters possessing many nodes with same software and hardware environment.
IV-B3 Unified Configuration Format
Most of the SLAM algorithms provide a configuration files in a standard format(such as yaml format), for users to setup the parameters of algorithm, intrinsic and extrinsic parameters of datasets. And When we use ROS to play the dataset, the remap configuration is needed. At the same time, When researchers and engineers have a big scale dataset with hig frequency and resolution data(mapping robot), they wish to reuse it to test the tolerance and robustness of the algorithms by reduce data frequency and resolution to generate a low quality dataset. So to summarize, We choose key-value format, easy for users to create and program to parse, to describe the all of above parameters.
When a mapping task is created, a unified configuration is automatically generated in the form of a yaml file, including algorithm selection, dataset selection, algorithm parameters, dataset parameters and ROS remap configuration. The algorithm and dataset execution scripts will extract the required information from the configuration for automated mapping run.
IV-B4 Algorithm Execution Scripts
Algorithm execution scripts includes parameters template and execution script. Before starting the mapping, the execution script gets algorithm parameter values, dataset parameter values and remap information from the configuration file, then generates custom mapping configuration files according to parameters template and the requirements of the algorithm software, which will be read at the beginning of mapping.
The dataset component consists of dataset in the form of ROS bag, groundtruth, and dataset play script. In order to realize custom remap topic, the dataset play script can extract the dataset remap topic from configuration file and generate corresponding dataset play and remap command.
Most of SLAM algorithms publish the topics information by ROS. So all algorithms containers are built based on ROS in order to replay dataset and record the topic of the estimated pose. For later evaluation, we convert estimated trajectories and groundtruth to the TUM format: .
IV-C Multiple Configurations Mechanism
Our system has a unified configuration format, varieties of configurations can be easily generated by selecting algorithms, datasets and inputting algorithm parameter values, dataset parameter values and remap topic from scratch or just copying an existing configuration and modifying some of its parameters. These configurations are recorded in database for further performance analysis. The same algorithm and dataset with different algorithm parameters, or the same algorithm and parameters with different datasets may yield interesting results. Nondeterministic algorithms may even be executed several times with the exact same parameters to evaluate their stability.
Besides, When we need to run a large number of tasks, there are certain laws fo their configurations. For example, all of the tasks run same SLAM algorithm on same dataset with different parameter values. So we provide a way to create configurations in batch by permutation and combination with a given rules. Through this way, users can save their time creating configurations and it is easily to query and lookup the similar configurations.
IV-D Cluster Controller
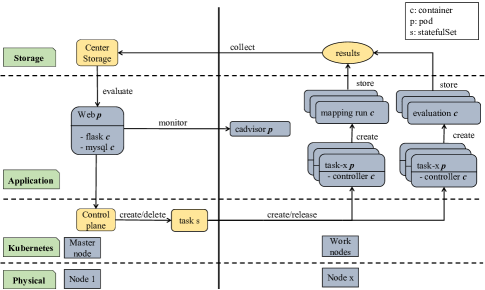
Our system use open source container orchestration engine - Kubernetes to create, deploy and manage such big number of containers on a multi-node computational cluster environment. We implement a middle controller module called Cluster Controller based on Kubernetes. Controller is responsible for the entire life cycle of the task containers.
When users create tasks with number of on a cluster with number of available nodes, the Web Controller will parse the request and call the Cluster Controller to take over sub-sequence processes. Cluster controller firstly create Kubernetes built-in workload API object called StatefulSet to manage the stateful applications and it will create task containers. Then algorithm image, dataset and configurations are transferred to relevant work node. After that, each container execute a script to run the tasks assigned by Cluster Controller following some given rules. Finally, the running results including trajectory file and performance monitor data are transferred to the master node, and all the containers as well static data will be remove from work nodes.
The whole process of Cluster Controller how to manage the task is illustrated in Fig 4.
IV-D1 Containers Assignment
Consider in the range of several to tens gigabytes size of data, the consume of transferring them to work node is also expensive. And there are complicate factors influencing the spending time: the number of available nodes and tasks; the similarity between different tasks, i.e. whether different tasks use same algorithm image and dataset; the duration of dataset.
So there are different strategies to adapt the real application scenarios. In our system, we provide a simply general strategy: Firstly classify tasks according to their algorithm and dataset, calling ”class”; Then assign ”class” to different work nodes in a random order with their relevant tasks. As for the complicate influencing factors, applying randomness can provide a more balanced load in probability. Furthermore, we reserve the interface for users to write tailored program based on their own requirements.
IV-D2 Dataset Frequency and Resolution Process
For SLAM algorithm, the ability of robustness and stability is also a significant aspect. A excellent algorithm should not only have good accuracy on high-quality datasets, but also have good stability when it is deployed to an environment with only poor-quality sensors. So a big scale dataset with high frequency and resolution data is significant for the evaluation of algorithm robustness and consistency by progressively degrading the quality of the dataset and running algorithm on them.
But there are only raw dataset storing in master node, so when tasks are involved in the parameters of dataset frequency and resolution, it’s required to post-process the dataset.Given the size of the dataset, it is unlikely to store all of the pruned dataset on the master node or perform all of the post-processing tasks locally.
In our work, a script is executed on relevant container to process the dataset. It is worth noting that since cameras have different models, the same attention should be paid to modifying the corresponding intrinsic and extrinsic parameters, as well as the corresponding correction and dedistortion parameters when reducing the image resolution. We implement the pinhole model in our system. Meanwhile, we set all the above variable quantities as parameters in the Web, and provide an interface for users to deal with their own camera model and implement the corresponding processing script.
IV-E Search Engine
A significant advantage of the database is that, over traditional file storage, it uses a structured format to store data , which facilitates various statistical analyses of the data. Furthermore, consider a scenario that is very important in practical applications: when researchers or industry want to build a SLAM system that meets the requirements in some specific environments. Due to the existence of various types of slam algorithms and a huge parameter space, it is very complex and time-consuming to find a suitable algorithm and configuration from scratch. In order to take full advantage of the database and solve the problems mentioned above, we developed a search engine based on the database in our system, which can be used to give a set of configurations that meet certain conditions, so as to realize the subsequent rich customized analysis.
IV-E1 Search Conditions
We divide the limited conditions into several parts as follows:
-
•
Algorithms
-
•
Datasets
-
•
Configuration Parameters
-
•
Evaluation Metrics
Based on this list, the user’s input can be: Choose some or all of the algorithms; Choose some or all of the datasets; Limitation the value of some algorithms’ parameters(such as: For ORB3-SLAM algorithm, we want to search the configurations with ); Limitation the value of some evaluation metrics(such as: We want to search the configurations with its ).
Now we give an text YAML example of the search input as Listing 1 (In real Web page, there is a GUI for users to input the content):
IV-E2 Workflow
Profiting from the reasonable database structure design, when the Web Controller parses the input content, it will query the database according to the constraints step by step, and then filter out the configurations that meets the conditions. Finally the results will display on the Web page. Users can not lookup the satisfied configurations only, but also reuse the results to do more diverse custom analysis.
IV-F Meta Analysis
Meta Analysis is one core function of our system. On the one hand, if we want to perform an exhaustive evaluation of the SLAM algorithm, we first need to run the algorithm a sufficient number of times with different configurations. Furthermore, after we run thousands of tasks and get the running trajectories with some fundamental evaluation metric results, how to assess them in an organized and elegant way so that researchers can easily and clearly understand is also a worthwhile research topic. Since we store the task information in the database each time, we can load all historical data from the database, including all parameters value, such as Mean, Standard Deviation, RMSE of ATE and RPE, CPU and memory usage etc. As the size of data continues to increase, using simple ways to analyze it can be cumbersome and tedious, urging for a more effective method to pre-process the data from database.
We propose a automatic meta analysis method called ”Custom Analysis” that utilize our database search engine for data loading and provide a highly customized selections for generate multiple evaluation indicators in forms of text, table and pictures.
IV-F1 Standard File Format
In Custom Analysis, we still choose YAML format as input for its flexibility and extensibility.
Totally, we group our analysis into 4 categories, depending on their algorithm and dataset of configurations: same algorithm and same dataset; different algorithm and same dataset; different algorithm and same dataset; different algorithm and same dataset. For each category, we implement some specific analysis result generator.
Then we divided the whole input into two main part: One is tell how to generate the analysis results while the other is to tell which configurations to be involved in analysis, just like Listing 2 illustrated.
For the former part, we now provide six types of evaluation indicators in diverse forms and users can input the correct content easily following the rules. Secondly, as for which configurations to choose, considering the number of configurations that are likely to keep growing in the future, we provide three methods to choose the configurations and a simple calculation to combine the chosen configurations.
A detail Example and relevant explanation are displayed in Appendix A.
IV-F2 Resolver
When the Web Controller parses the input content, it will first check if the request is legal to ensure the correction of the later generator part. After checking, controller will query the database according to the configuration chosen limitations, and then filter out the configurations that meets the conditions. (Maybe more detail; or in appendix)
IV-F3 Generator
For the resolver, its duty is to check the correction of the input and filter the satisfied configurations; Relatively, What generator needs to do is generating the multiple analysis indicators according to the input. Now our work implement six analysis indicators with diverse forms, including: Trajectory comparison; Trajectory accuracy metrics comparison for same dataset; Trajectory accuracy metrics comparison for different datasets; Performance usage metrics comparison; Scatter for same or different algorithm.
Each indicator provides not only the ready-made analysis results with form of .png, .pdf and .pgf that can be used in diverse scenarios, but also a link for users to download the raw data to extend their own analysis.
V Deployment
In this section, we introduce the system deployment on different platforms.
V-A Overview
For the benchmarking of SLAM algorithms, different groups have diverse needs. For example, for SLAM enthusiasts and beginners, they would like to have a convenient way to know the evaluation results of existing SLAM algorithms to assist them getting started and learning SLAM quickly. And for SLAM algorithm researchers, when they propose a new algorithm, they need to find a parameter configuration that makes the algorithm perform best to a certain extent, and make a detailed comparison and analysis between their algorithm and the same type of algorithms to understand the advantages and disadvantages of the algorithm in different aspects. What’s more, for the relevant community or company, simple evaluation of algorithms isn’t meet their requirements: in the development of actual commercial products, it is necessary to comprehensively compare the performance of different algorithms in corresponding application scenarios, so it is significant to assist different algorithms running under different parameter configurations in different application scenarios, i.e. dataset sequences.
In order to solve the problem of diverse requirements for SLAM algorithm evaluation, we use the basic framework of SLAM Hive to build a out-of-the-box software system that can be deployed on a variety of platforms, involving workstation, local cluster and cluster deployed on cloud platform Aliyun. Thanks to the flexibility and extensibility of SLAM Hive, we only released a single package and users can quickly deploy the system to corresponding platform by simply changing some parameters in the configuration file.
In addition, we develop a view-only version of the SLAM-Hive website, running on our own server, to showcase the rich evaluation and customized analysis results recording in our SLAM-Hive software system deployed in different environments, for users to browse. We hope it will promote SLAM algorithms to vigorously flourish.
It’s easy for users to deploy the system in relevant version on their local workstation. We provide a setup configuration file for changing the version. Cluster deployment works similarly on local and cloud servers: you only need to include information about the nodes in cluster (such as the node host name and inner IP) in the setup file.
V-B Aliyun
It’s worth noting that cloud vendors (e.g. Aliyun) often offer different server leasing options, the two most common ones being long-term lease and pay-as-you-go. The former is a one-time purchase of the right to use the server for a period of time, which is suitable for the needs of long-term operation of a service (such as running a website). Correspondingly, the latter can be charged by the minute when service is needed, and kill the server directly after the end of service, which is suitable for dealing with short-term tasks (such as the service that need to monopolise a server with shorter running times). Both adapt to different application scenarios.
Thanks to these features, when we want to get SLAM-Hive up and running in Aliyun, there’s a seemingly less expensive and reasonable way to do it: Firstly buy a server using long-term lease way as master node for running the SLAM-Hive website; Then when users want to create a task with hundreds of tasks, means that hundreds of containers are needed, they can buy relevant number of servers in pay-as-you-go way and kill servers after task done.
Now we introduce in detail what we complement in aliyun server version to adapt the system for above features.
V-B1 Automation Interface
Aliyun provides a set of interfaces to assist users purchasing servers and other operations through program. We use this interface to automate the selection, purchase, configuration, and destruction of servers and the transfer of data between them in SLAM-Hive. The whole process is completely transparent: users only need to submit a task request and nothing else.
V-B2 Cluster Mechanism
As mentioned before, balancing the number of containers running on each node is a complex issue. In simple terms, it depends on the taken time between the master node to transfer the algorithm image and dataset resources and each task to run, similar to the parallel scheduling and pipelining of tasks in computer systems. In fact, if the master is solely responsible for data delivery, it will put a huge amount of load on it, affecting other services running on the master. If the transmission task is distributed to other work nodes and the whole transmission process is parallelized, it seems that the transmission time can be greatly reduced. But limited by the bandwidth of the whole LAN, the optimization effect is not obvious in fact, and this complex mechanism will become difficult to manage and increase the risk of task errors. Moreover, in the actual process, it is equally important to control the cost.
Fortunately, benefiting from the efficient services provided by Aliyun, we designed a simple and feasible cloud platform cluster construction mechanism based on the purpose of balancing task consumption time and cost. In the cloud platform, when creating a server, you need to choose template image, which is the base operating system. The cloud platform will provide some basic operating systems (windows, ubuntu, etc.) for users to choose from and users can also customize the operating system on this basis, add their own needed resources and packages in the template image. In turn, cloud platform also provides snapshot functionality: a template image is created from an existing server, and subsequent servers based on that template have the exact same environment and configuration as the template server. Also, based on our experience, the time it takes to create a server from a template image compared to transfer the data can be reduced by an order of magnitude.
Accordingly, we design a ”1 + 1 + (n-1)” mechanism: the first ”1” represents a master node; The second ”1” represents the work node used to generate the template image; ”n” is the total number of work nodes required for this task, so ”n-1” is the number of worker nodes excluding the template node. Before the task is executed, the Cluster Controller running on the master will firstly create a work node and transfer all the static resources needed for this task to the work node. Then it will create an image from that node. Finally, ”n-1” other nodes are simultaneously created from this image.
V-B3 Mathematical formulation
Let’s first consider a simple case mentioned before: a task that each sub-task shares the same template image, i.e. the same algorithm image and dataset, with just one sub-task in one server. Assuming that the time to transfer a static resource between nodes is , the time to transfer a static resource with the upper limit of the cluster throughput is , the time to create an image is , and the average time required to run a task on each node is , then:
| (1) |
Compared with other strategies: The master node is responsible for the full transfer load; All nodes are equally responsible for the transfer load. Their costing times are as:
| (2) |
| (3) |
We know that , and are of the same order of magnitude. It can be seen that by using the powerful resource scheduling and excellent server creation mechanism behind the cloud platform, as the number of servers required by the task increases, the running time of the task will be greatly reduced.
Next, let’s consider the actual situation: a task contains sub-tasks, and each sub-task can be divided into different groups, called classes, according to its required algorithm image and dataset, and the number is . The number of nodes that can be created in this task is , and , meaning that each node may need to take on multiple sub-tasks. This task creates image templates, each containing one or more classes, with the number of tasks :. Accordingly, nodes are assigned to each template and the number of tasks loaded on each node is . Assuming that the average time consumed by each subtask is , the total time consumed is:
| (4) | ||||
V-B4 Assignment Strategy
From the preceding derivation, you can see that the classes assigned to each template, and the number of nodes assigned to each template, will affect subsequent time cost. Here we provide with a simple strategy: Creating as few templates as possible without exceeding the maximum amount of resources each template can load, and assigning each template classes with the same total size; Nodes are allocated proportionally to the number of sub-tasks each template has to undertake. This strategy makes the load of each node as equal as possible.
We reserve the interface for this part in the system, and users can design appropriate strategies to replace it according to their actual scenarios.
| MH_01_easy1 | MH_02_easy1 | MH_03_medium1 | MH_04_difficult1 | MH_05_difficult1 | ||||||||||||
| RMSE2 | CPU3 | RAM4 | RMSE | CPU | RAM | RMSE | CPU | RAM | RMSE | CPU | RAM | RMSE | CPU | RAM | ||
| Monocular | ORB-SLAM2 | 0.043 | 1.36/1.90 | 978 | 0.038 | 1.38/1.94 | 954 | 0.038 | 1.36/1.86 | 896 | 0.165 | 1.24/1.71 | 921 | 0.079 | 1.29/1.79 | 947 |
| ORB-SLAM3 | 0.044 | 1.25/1.67 | 2422 | 0.037 | 1.24/1.63 | 2225 | 0.041 | 1.21/1.53 | 2168 | 0.054 | 1.12/1.58 | 1972 | 0.057 | 1.30/2.51 | 2200 | |
| Monocular Inertial | VINS-Mono | 0.120 | 1.98/2.56 | 1905 | 0.294 | 1.93/2.57 | 1762 | 0.111 | 1.85/2.50 | 1585 | 0.250 | 1.56/2.40 | 1332 | 0.184 | 1.65/2.50 | 1477 |
| VINS-Fusion | 0.066 | 1.50/2.30 | 2507 | 0.049 | 1.41/2.23 | 1375 | 0.050 | 1.45/2.25 | 1575 | 0.083 | 1.26/2.15 | 1305 | 0.175 | 1.30/2.19 | 2138 | |
| ORB-SLAM3 | 0.051 | 1.41/1.85 | 1746 | 0.065 | 1.31/1.81 | 2202 | 0.050 | 1.20/1.66 | 2364 | 0.055 | 1.31/1.79 | 2036 | 0.053 | 1.09/1.55 | 2088 | |
| Stereo | ORB-SLAM2 | 0.038 | 3.24/4.10 | 1387 | 0.027 | 3.25/3.97 | 1392 | 0.052 | 3.35/4.52 | 1242 | 0.153 | 3.14/3.92 | 931 | 0.067 | 3.14/4.20 | 1599 |
| VINS-Fusion | 0.053 | 1.69/2.60 | 1265 | 0.054 | 1.69/2.46 | 1393 | 0.082 | 1.72/2.79 | 1547 | 0.125 | 1.52/2.40 | 1581 | 0.115 | 1.52/2.39 | 1423 | |
| ORB-SLAM3 | 0.036 | 1.83/2.55 | 2731 | 0.034 | 1.77/2.45 | 2478 | 0.044 | 1.90/2.62 | 2643 | 0.062 | 1.59/2.37 | 2145 | 0.070 | 1.76/3.21 | 2282 | |
| Stereo Inertial | VINS-Fusion | 0.043 | 1.84/2.66 | 1535 | 0.031 | 1.81/2.78 | 2306 | 0.068 | 1.85/2.88 | 2833 | 0.093 | 1.61/2.55 | 2045 | 0.090 | 1.59/2.59 | 2038 |
| ORB-SLAM3 | 0.041 | 1.91/2.41 | 3154 | 0.052 | 1.85/2.40 | 2712 | 0.047 | 1.98/2.50 | 2415 | 0.046 | 1.98/2.45 | 2307 | 0.054 | 1.99/2.46 | 2377 | |
-
1
They are five sequences of varying difficulty on the EuRoC dataset. MH_01_easy and MH_02_easy are with good texture and bright scene, MH_03_medium is with fast motion and bright scene, MH_04_difficult and MH_05_difficult are with fast motion and dark scene.
-
2
RMSE is the root mean square error of the ATE, the unit is meter.
-
3
The calculation of CPU usage is the sum of all core usage. CPU in the above table is average/maximum CPU usage during mapping, its unit is core.
-
4
RAM is the maximum memory usage during mapping, its unit is MB.

| The number of ORB features | RMSE ATE1 (cm) | RMSE RPE1 (cm) | CPU1 (core) | RAM1 (MB) |
| 2502 | - | - | - | - |
| 500 | 0.807 | 1.32 | 1.26/1.99 | 941 |
| 750 | 0.750 | 1.25 | 1.28/2.00 | 768 |
| 1000 | 0.768 | 1.23 | 1.42/2.38 | 880 |
| 1250 | 0.693 | 1.16 | 1.64/3.18 | 955 |
| 1500 | 0.698 | 1.17 | 1.89/3.37 | 1392 |
| 1750 | 0.645 | 1.24 | 2.02/3.42 | 1640 |
| 2000 | 0.625 | 1.12 | 2.29/3.75 | 1314 |
| 2250 | 0.650 | 1.12 | 2.33/3.87 | 1644 |
| 2500 | 0.623 | 1.11 | 2.31/3.85 | 1879 |
-
1
Our values are the average of 5 executions. RMSE ATE and RMSE RPE are obtained by aligning with the ground truth trajectory, where RPE is the error of translation per meter.
-
2
ORB-SLAM2 RGB-D fails when extracting 250 ORB feature points.
VI Benchmarking Experiments
We develop a ”view only” version of the SLAM Hive system, which is save to run open on the web. Our demo on https://slam-hive.net/ features the SLAM Hive software, while the results of the mapping runs can be visualized and new analysis can be performed. The accompanying wiki on https://slam-hive.net/wiki/ provides help for the users.
In this section, we firstly used SLAM Hive to complete a series of basic benchmark comparison experiments in terms of accuracy, CPU and memory usage. What’s more, based on the search engine and custom analysis mechanisms of SLAM Hive system, we design several sets of large experiments to explore the vast parameter space of SLAM algorithms. This highlights the capabilities and practicality of SLAM Hive system. Finally, we compare our SLAM Hive system with other popular SLAM benchmark framework.
All tests are on the same device, which is configured as: 32 G memory, Intel Core i7-7700 CPU @ 3.4=60GHz 8.
VI-A Performance Comparison of SLAM Methods
VI-A1 Performance Comparison of Multiple Visual SLAM Methods
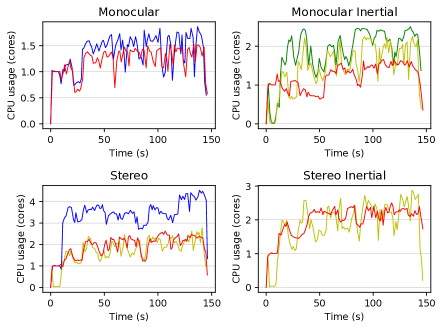
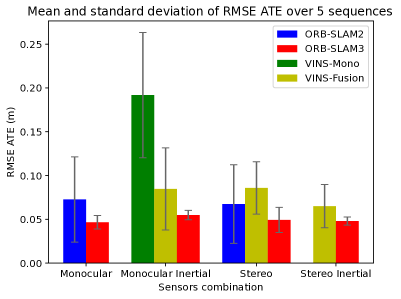
Fig. 6 shows the comparison of different methods under the same sensor combination on 5 different sequences from the EuRoC dataset. They are increasingly difficult to process in terms of flight dynamics and lighting conditions. For each algorithm, we used the default parameters. The results of each method in each sensor mode are summarized in Table III.
As shown in Fig. 5, in the 4 modes, the CPU usage of ORB-SLAM3 is smaller, while the memory usage is larger. In both monocular and stereo modes, the memory usage of ORB-SLAM3 is almost twice that of ORB-SLAM2. Fig. 6 shows the mean ATE of these methods on 5 sequences in different modes, it is obvious that ORB-SLAM3 performs more stable and has the highest accuracy.
Whether the number of sensor fusion pairs means higher accuracy and more resource consumption is also a topic worth exploring. The CPU usage of ORB-SLAM2 stereo mode is almost twice that of monocular mode. There is no obvious difference in the memory usage of ORB-SLAM3 in the 4 modes, and there is no significant difference in CPU consumption with or without the fusion of the IMU when the number of cameras is the same.
VI-A2 Performance Comparison of Multiple Lidar SLAM Lethods
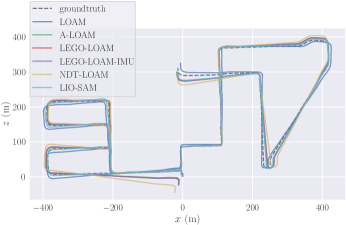
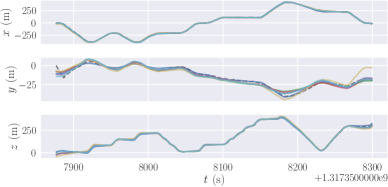
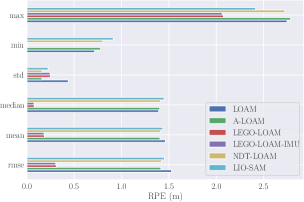
Fig. 8 shows the trajectories of different Lidar-based methods. We find that LIO-SAM performs best at the starting position. This is because the algorithm makes full use of the IMU data, and the instantaneous output of the IMU is very accurate, both providing a good initial value.
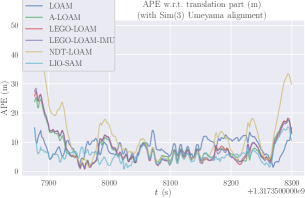
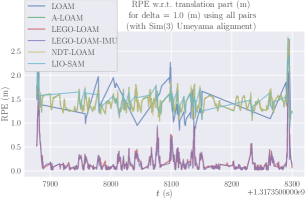
Fig. 9 shows their ATE and RPE statistics comparison results. LIO-SAM wins the ATE comparison while LEGO-LOAM is way ahead in the RPE. And We find that Fusing IMU data dose not improve the accuracy, cause the frequency of IMU data in KITTI dataset is low.
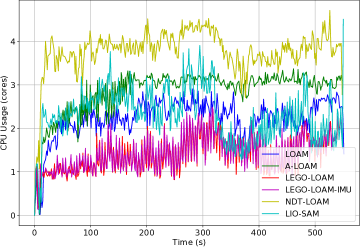
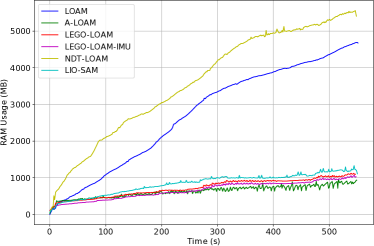
Fig. 7 shows their ATE and RPE statistics comparison results. Lightweight LEGO-LOAM and A-LOAM (optimized version of LOAM)has the least overhead. And NDT-LOAM and LOAM perform bad in resource usage. We guess that the former is because the algorithm is not optimized, and the latter is because a costly point cloud registration algorithm is used.
In summary, LIO-SAM fusing multiple sensors performs the best overall in terms of accuracy, but still slightly worse than LEGO-LOAM in resource usage
VI-A3 Correlation of Parameters to Performance
Each SLAM method has some parameters of its own and it is difficult to determine how much the change of the parameter value will affect the system. This experiment explores the impact of the number of ORB feature points extracted per image on accuracy, CPU and memory usage. All tests were performed on the freiburg2/desk sequence of the TUM-RGBD dataset, a 99.36s, 18.88m, sequence with loop closure.
As shown in the Table IV, as the number of feature points increases, the ATE and RPE tend to decrease, while the CPU and memory usage tend to increase. When only 250 feature points are extracted, the algorithm fails, indirectly indicating that if the scene has too few features, the performance of ORB-SLAM2 may no longer be robust.
| Mode | Camera Position | Image Resolution | Image Rate | IMU Rate | nFeatures | Configuration Number1 | |||||
| number | value | number | value | number | value (Hz) | number | value (Hz) | number | value | ||
| Monocular | 2 | left/right 2 | 2 | 1/0.5 3 | 2 | 20/10 | 2 | 1000/2000 4 | 16 | ||
| Monocular Inertial | 2 | left/right | 2 | 1/0.5 | 2 | 20/10 | 2 | 200/50 | 2 | 1000/2000 | 32 |
| Stereo | 2 | 1/0.5 | 2 | 20/10 | 2 | 1000/2000 | 8 | ||||
| Stereo Inertial | 2 | 1/0.5 | 2 | 20/10 | 2 | 200/50 | 2 | 1000/2000 | 16 | ||
| All | 72*5 = 360 | ||||||||||
-
1
They are five sequences of varying difficulty on the EuRoC dataset: MH_01_easy, MH_02_easy, MH_03_medium, MH_04_difficult and MH_05_difficult. Each configuration runs on these five sequences.
-
2
EuRoC dataset contains a stereo camera.
-
3
Scale relative to the pixel size of the original image.
-
4
Number of features per image.
| Image Resolution | Image Rate | IMU Rate | nFeatures | Configuration Number | ||||
| number | value | number | value (Hz) | number | value (Hz) | number | value | |
| 4 | 1/0.8/0.6/0.5 | 3 | 20/10/5 | 3 | 200/100/50 | 3 | 1000/2000/2500 | 108 |
VI-B Custom Analysis Experiments
We design a series of comprehensive experiments to demonstrate the capabilities of our custom analysis.
VI-B1 SLAM Algorithm Parameter Space Exploration I
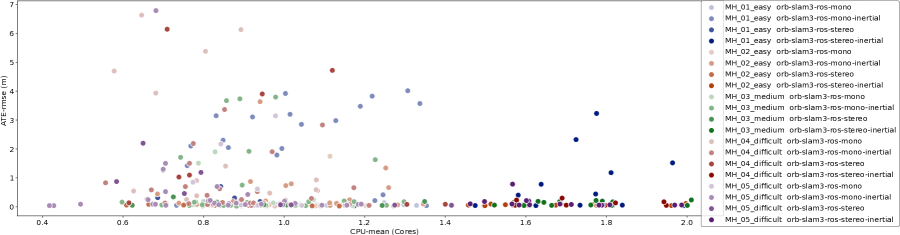
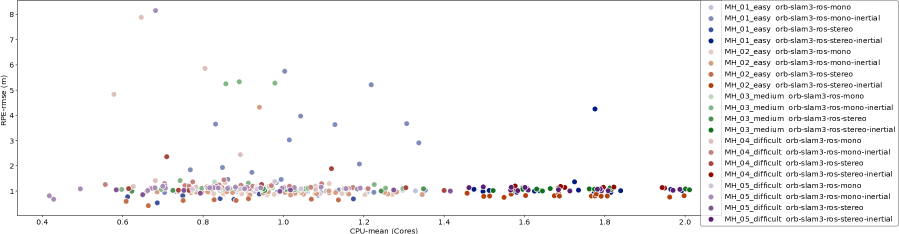
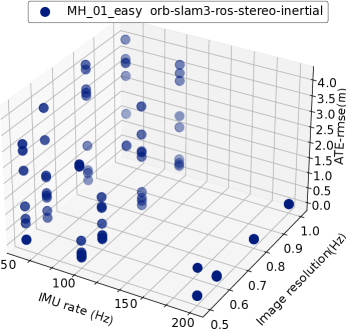
As a pretty classic visual SLAM algorithm, ORB-SLAM3 is well worth study. Using our SLAM Hive system, we try to explore the broad parameter space of the algorithm in terms of sensor type, the quality and difficulty of the dataset, and the parameters of algorithm itsef. We run the algorithm on different sequences of the EuRoC dataset and create 360 configurations totally by our ”combine configuration creation” function. The detail parameter space is shown in VI.
Fig. 10 shows the correlation between the average CPU usage and the RMSE of ATE and RPE, which also represents the relationship between accuracy and resource consumption of algorithm. Intuitively, When the quality of sensor data deteriorates, tracking fails even in simple scenarios. And the CPU usage of stereo-inertial mode is basically twice that of other three modes (the most dark colored points are in stereo-inertial mode). It is obvious that for monocular mode, fusing IMU data does not add additional resource consumption; The opposite is true for stereo mode. And instead of improving the algorithm, low frequency IMU data will have a negative impact;. In addition, we can find that when we use appropriate parameters and equipped with good quality sensors, the accuracy of these four modes is basically the same, but their costs are different.
Interestingly, when evaluate vast mapping tasks, we find that just calculating statistical metrics is not enough. For example, the stereo-inertial mode completely fails in poor conditions, no trajectory is generated, which will not be counted in the calculation of metrics. However, the monocular mode also produces poor tracking under the same conditions, which is equal to failure in effect, but outputs bad trajectories and thus produces bad statistical indicators. These will affect our judgment of the results. So we consider that when the number of tasks is large, the failure rate of tracking should be calculated at the same time, which can be used to assist the evaluation of results.
Furthermore, our online visualization make it easily to select some of these configurations to make more targeted comparisons. See our demo website for more custom analysis results.
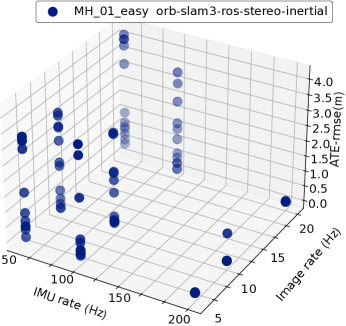
VI-B2 SLAM Algorithm Parameter Space Exploration II
We conducted a more detailed parameter exploration for the stereo-inertial mode of ORB-SLAM3. We run the algorithm on MH_01_easy sequences of the EuRoC dataset and create 108 configurations. The detail parameter space is shown in VI. Fig. 11 shows the influence of image data rate, IMU data rate and image data resolution on trajectory accuracy. It can be found that imu has the greatest impact on the accuracy, while low quality image has no effect. The reduction of imu data frequency will greatly reduce the accuracy of the trajectory, which is also in line with the conclusion above.
Limited by the quality of raw data in the dataset, we are temporarily unable to perform large-scale parameter space exploration. But in the future, ShanghaiTech MappingRobot [46] will collect an all-around data set, which can be used for more comprehensive evaluation.
VI-B3 Algorithm Stability Test
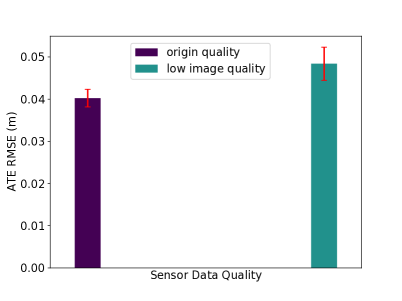
The stability of algorithm is also the important indicators to measure its quality. We use the SLAM Hive system to run the stereo-inertial mode of ORB-SLAM3 20 times on two sequences, the former is original dataset, and the latter is dataset that reduces the rate and resolution of the image data. Fig. 12 shows the mean and standard deviation of RMSE of ATE for the two groups tested. It can be found that when the quality of dataset decreases, in addition to the results of algorithm will become worse, the stability of algorithm will also decrease.
VI-B4 Search Engine Test
In the practical application of SLAM algorithm, it is often necessary to meet some specific scenarios, such as: limited computing resources, accuracy requirements, etc. When the results of a large number of mapping tasks have been accumulated in SLAM Hive system, Users can use our search engine, input the name of the required algorithm, the accuracy of results and the resource consumption, the range of parameters, etc., and return the configurations that satisfy the conditions. It will greatly save users the time to filter the required algorithm configuration.
VII Conclusion
The SLAM Hive Benchmarking suite is a containerized system to systematically test and evaluate SLAM algorithms under various configurations using datasets. The system is very scalable and flexible, supporting software using different standards, operating systems and also closed source solutions, as long as scripts can be written to interface with them. The system, for the first time, will be able to explore and analyze the vast space of possible permutations of configurations, datasets and algorithms, when deployed in a cluster. It is also flexible towards the evaluation by implementing these themselves as programs running in their docker container. The software is, together with a demo, available on slam-hive.net. In this paper as well as on slam-hive.net we shown the capability of our system by evaluating 100s of mapping runs and analyzing them in various aspects.
In the future we will use SLAM Hive in conjunction with the heterogeneous and massive datasets collected by the ShanghaiTech Mapping Robot to, for the first time, systematically evaluate all kinds of different SLAM approaches against each other, thus driving the research on SLAM as a whole forward.
We will extend SLAM Hive to support algorithms that need GPUs and are also planning to extend the scope of SLAM Hive beyond just SLAM algorithms, but also evaluate algorithms like segmentation or object recognition. We then also plan on hosting a competition on these algorithms by running them in their dockers on our hardware, thus offering fair and unbiased results that can be widely compared across very different modalities (e.g. RGB vs RGBD vs LiDAR based segmentation).
Acknowledgments
This work was supported by Science and Technology Commission of Shanghai Municipality (STCSM), project 22JC1410700 “Evaluation of real-time localization and mapping algorithms for intelligent robots”. This work has also been partially funded by the Shanghai Frontiers Science Center of Human-centered Artificial Intelligence.
References
- [1] C. Cadena, L. Carlone, H. Carrillo, Y. Latif, D. Scaramuzza, J. Neira, I. Reid, and J. J. Leonard, “Past, present, and future of simultaneous localization and mapping: Toward the robust-perception age,” IEEE Transactions on robotics, vol. 32, no. 6, pp. 1309–1332, 2016.
- [2] A. Fornasier, M. Scheiber, A. Hardt-Stremayr, R. Jung, and S. Weiss, “Vinseval: Evaluation framework for unified testing of consistency and robustness of visual-inertial navigation system algorithms,” in 2021 IEEE International Conference on Robotics and Automation (ICRA). IEEE, 2021, pp. 13 754–13 760.
- [3] Y. Yang, B. Xu, Y. Li, and S. Schwertfeger, “The slam hive benchmarking suite,” 2023.
- [4] J. Sturm, N. Engelhard, F. Endres, W. Burgard, and D. Cremers, “A benchmark for the evaluation of rgb-d slam systems,” in 2012 IEEE/RSJ international conference on intelligent robots and systems. IEEE, 2012, pp. 573–580.
- [5] A. Geiger, P. Lenz, C. Stiller, and R. Urtasun, “Vision meets robotics: The kitti dataset,” International Journal of Robotics Research (IJRR), 2013.
- [6] M. Burri, J. Nikolic, P. Gohl, T. Schneider, J. Rehder, S. Omari, M. W. Achtelik, and R. Siegwart, “The euroc micro aerial vehicle datasets,” The International Journal of Robotics Research, vol. 35, no. 10, pp. 1157–1163, 2016.
- [7] D. Schubert, T. Goll, N. Demmel, V. Usenko, J. Stückler, and D. Cremers, “The tum vi benchmark for evaluating visual-inertial odometry,” in 2018 IEEE/RSJ International Conference on Intelligent Robots and Systems (IROS). IEEE, 2018, pp. 1680–1687.
- [8] X. Shi, D. Li, P. Zhao, Q. Tian, Y. Tian, Q. Long, C. Zhu, J. Song, F. Qiao, L. Song et al., “Are we ready for service robots? the openloris-scene datasets for lifelong slam,” in 2020 IEEE international conference on robotics and automation (ICRA). IEEE, 2020, pp. 3139–3145.
- [9] W. Wang, D. Zhu, X. Wang, Y. Hu, Y. Qiu, C. Wang, Y. Hu, A. Kapoor, and S. Scherer, “Tartanair: A dataset to push the limits of visual slam,” in 2020 IEEE/RSJ International Conference on Intelligent Robots and Systems (IROS). IEEE, 2020, pp. 4909–4916.
- [10] H. Benseddik, F. Morbidi, and G. Caron, “Panoramis: An ultra-wide field of view image dataset for vision-based robot-motion estimation,” The International Journal of Robotics Research, vol. 39, 2020.
- [11] Y. Cheng, M. Jiang, J. Zhu, and Y. Liu, “Are we ready for unmanned surface vehicles in inland waterways the usvinland multisensor dataset and benchmark,” IEEE Robotics and Automation Letters, vol. PP, no. 99, pp. 1–1, 2021.
- [12] R. Giubilato, W. Stürzl, A. Wedler, and R. Triebel, “Challenges of slam in extremely unstructured environments: The dlr planetary stereo, solid-state lidar, inertial dataset,” IEEE Robotics and Automation Letters, vol. 7, no. 4, pp. 8721–8728, 2022.
- [13] M. Ramezani, Y. Wang, M. Camurri, D. Wisth, M. Mattamala, and M. Fallon, “The newer college dataset: Handheld lidar, inertial and vision with ground truth,” in 2020 IEEE/RSJ International Conference on Intelligent Robots and Systems (IROS), 2020, pp. 4353–4360.
- [14] M. F. F. Lintong Zhang, Marco Camurri, “Multi-camera lidar inertial extension to the newer college dataset,” arXiv preprint arXiv:2112.08854(CoRR), 2021.
- [15] W. Wen, Y. Zhou, G. Zhang, S. Fahandezh-Saadi, X. Bai, W. Zhan, M. Tomizuka, and L.-T. Hsu, “Urbanloco: A full sensor suite dataset for mapping and localization in urban scenes,” 2019.
- [16] M. Gehrig, W. Aarents, D. Gehrig, and D. Scaramuzza, “Dsec: A stereo event camera dataset for driving scenarios,” IEEE Robotics and Automation Letters, vol. 6, no. 3, pp. 4947–4954, 2021.
- [17] D. Barnes, M. Gadd, P. Murcutt, P. Newman, and I. Posner, “The oxford radar robotcar dataset: A radar extension to the oxford robotcar dataset,” in 2020 IEEE International Conference on Robotics and Automation (ICRA), 2020, pp. 6433–6438.
- [18] J. Geyer, Y. Kassahun, M. Mahmudi, X. Ricou, and P. Schuberth, “A2d2: Audi autonomous driving dataset,” arXiv preprint arXiv:2004.06320(CoRR), vol. abs/2004.06320, 2020.
- [19] P. Sun, H. Kretzschmar, X. Dotiwalla, A. Chouard, V. Patnaik, P. Tsui, J. Guo, Y. Zhou, Y. Chai, B. Caine, V. Vasudevan, W. Han, J. Ngiam, H. Zhao, A. Timofeev, S. Ettinger, M. Krivokon, A. Gao, A. Joshi, Y. Zhang, J. Shlens, Z. Chen, and D. Anguelov, “Scalability in perception for autonomous driving: Waymo open dataset,” in 2020 IEEE/CVF Conference on Computer Vision and Pattern Recognition (CVPR), 2020, pp. 2443–2451.
- [20] H. Caesar, V. Bankiti, A. H. Lang, S. Vora, V. E. Liong, Q. Xu, A. Krishnan, Y. Pan, G. Baldan, and O. Beijbom, “nuscenes: A multimodal dataset for autonomous driving,” in 2020 IEEE/CVF Conference on Computer Vision and Pattern Recognition (CVPR), 2020, pp. 11 618–11 628.
- [21] A. Ligocki, A. Jelinek, and L. Zalud, “Brno urban dataset - the new data for self-driving agents and mapping tasks,” in 2020 IEEE International Conference on Robotics and Automation (ICRA), 2020, pp. 3284–3290.
- [22] M. Helmberger, K. Morin, B. Berner, N. Kumar, G. Cioffi, and D. Scaramuzza, “The hilti slam challenge dataset,” IEEE Robotics and Automation Letters, vol. 7, no. 3, pp. 7518–7525, 2022.
- [23] L. Zhang, M. Helmberger, L. F. T. Fu, D. Wisth, M. Camurri, D. Scaramuzza, and M. Fallon, “Hilti-oxford dataset: A millimeter-accurate benchmark for simultaneous localization and mapping,” IEEE Robotics and Automation Letters, vol. 8, no. 1, pp. 408–415, 2023.
- [24] J. Yin, A. Li, T. Li, W. Yu, and D. Zou, “M2dgr: A multi-sensor and multi-scenario slam dataset for ground robots,” IEEE Robotics and Automation Letters, vol. 7, no. 2, pp. 2266–2273, 2022.
- [25] H. Chen, Z. Yang, X. Zhao, G. Weng, H. Wan, J. Luo, X. Ye, Z. Zhao, Z. He, Y. Shen et al., “Advanced mapping robot and high-resolution dataset,” Robotics and Autonomous Systems, vol. 131, p. 103559, 2020.
- [26] A. Bonarini, W. Burgard, G. Fontana, M. Matteucci, D. G. Sorrenti, J. D. Tardos et al., “Rawseeds: Robotics advancement through web-publishing of sensorial and elaborated extensive data sets,” in In proceedings of IROS, vol. 6, 2006, p. 93.
- [27] A. Geiger, P. Lenz, and R. Urtasun, “Are we ready for autonomous driving? the kitti vision benchmark suite,” in Conference on Computer Vision and Pattern Recognition (CVPR), 2012.
- [28] M. Grupp, “evo: Python package for the evaluation of odometry and slam.” https://github.com/MichaelGrupp/evo, 2017.
- [29] L. Nardi, B. Bodin, M. Z. Zia, J. Mawer, A. Nisbet, P. H. Kelly, A. J. Davison, M. Luján, M. F. O’Boyle, G. Riley et al., “Introducing slambench, a performance and accuracy benchmarking methodology for slam,” in 2015 IEEE international conference on robotics and automation (ICRA). IEEE, 2015, pp. 5783–5790.
- [30] B. Bodin, H. Wagstaff, S. Saecdi, L. Nardi, E. Vespa, J. Mawer, A. Nisbet, M. Luján, S. Furber, A. J. Davison et al., “Slambench2: Multi-objective head-to-head benchmarking for visual slam,” in 2018 IEEE International Conference on Robotics and Automation (ICRA). IEEE, 2018, pp. 3637–3644.
- [31] M. Bujanca, P. Gafton, S. Saeedi, A. Nisbet, B. Bodin, M. F. O’Boyle, A. J. Davison, P. H. Kelly, G. Riley, B. Lennox et al., “Slambench 3.0: Systematic automated reproducible evaluation of slam systems for robot vision challenges and scene understanding,” in 2019 International Conference on Robotics and Automation (ICRA). IEEE, 2019, pp. 6351–6358.
- [32] S. B. H. J. P. H. Yong Zhao, Shibiao Xu, “Gslam: A general slam framework and benchmark,” in Proceedings of the IEEE International Conference on Computer Vision. IEEE, 2019.
- [33] G. Fontana, M. Matteucci, and D. G. Sorrenti, “Rawseeds: Building a benchmarking toolkit for autonomous robotics,” Methods and Experimental Techniques in Computer Engineering, vol. 7, pp. 55–68, 2014.
- [34] S. Ceriani, G. Fontana, A. Giusti, D. Marzorati, M. Matteucci, D. Migliore, D. Rizzi, D. G. Sorrenti, and P. Taddei, “Rawseeds ground truth collection systems for indoor self-localization and mapping,” Autonomous Robots, vol. 27, pp. 353–371, 2009.
- [35] S. Schwertfeger and A. Birk, “Map evaluation using matched topology graphs,” Autonomous Robots, vol. 40, no. 5, pp. 761–787, 2016.
- [36] J. Hou, Y. Yuan, Z. He, and S. Schwertfeger, “Matching maps based on the area graph,” Intelligent Service Robotics, vol. 15, no. 1, pp. 69–94, 2022.
- [37] R. Mur-Artal and J. D. Tardós, “ORB-SLAM2: an open-source SLAM system for monocular, stereo and RGB-D cameras,” IEEE Transactions on Robotics, vol. 33, no. 5, pp. 1255–1262, 2017.
- [38] T. Qin, P. Li, and S. Shen, “Vins-mono: A robust and versatile monocular visual-inertial state estimator,” IEEE Transactions on Robotics, vol. 34, no. 4, pp. 1004–1020, 2018.
- [39] J. Engel, V. Koltun, and D. Cremers, “Direct sparse odometry,” IEEE transactions on pattern analysis and machine intelligence, vol. 40, no. 3, pp. 611–625, 2017.
- [40] Q. Tong, P. Jie, C. Shaozu, and S. Shaojie, “A general optimization-based framework for local odometry estimation with multiple sensors,” arXiv preprint arXiv:1901.03638(CoRR), vol. abs/1901.03638, 2019.
- [41] C. Campos, R. Elvira, J. J. G. Rodríguez, J. M. M. Montiel, and J. D. Tardós, “Orb-slam3: An accurate open-source library for visual, visual–inertial, and multimap slam,” IEEE Transactions on Robotics, vol. 37, no. 6, pp. 1874–1890, 2021.
- [42] T. Shan, B. Englot, D. Meyers, W. Wang, C. Ratti, and R. Daniela, “Lio-sam: Tightly-coupled lidar inertial odometry via smoothing and mapping,” in IEEE/RSJ International Conference on Intelligent Robots and Systems (IROS). IEEE, 2020, pp. 5135–5142.
- [43] J. Zhang and S. Singh, “Loam: Lidar odometry and mapping in real-time.” in Robotics: Science and Systems, vol. 2, no. 9, 2014, pp. 1–9.
- [44] T. Shan and B. Englot, “Lego-loam: Lightweight and ground-optimized lidar odometry and mapping on variable terrain,” in 2018 IEEE/RSJ International Conference on Intelligent Robots and Systems (IROS), 2018, pp. 4758–4765.
- [45] S. Chen, H. Ma, C. Jiang, B. Zhou, W. Xue, Z. Xiao, and Q. Li, “Ndt-loam: A real-time lidar odometry and mapping with weighted ndt and lfa,” IEEE Sensors Journal, vol. 22, no. 4, pp. 3660–3671, 2022.
- [46] Y. Yang, D. Feng, and S. Schwertfeger, “Cluster on wheels,” in 2022 International Conference for Advancement in Technology (ICONAT). IEEE, 2022, pp. 1–8.
![[Uncaptioned image]](/html/2406.17586/assets/imgs/authors/xinzhe.jpg) |
Xinzhe Liu Xinzhe Liu received his B.S. at Shandong University in China, and now he is a first-year graduate student at ShanghaiTech University. His research focuses on SLAM evaluation. He is also interesting in how to apply Large Language Models (LLMs) in Robotics and Autonomous Driving. |
![[Uncaptioned image]](/html/2406.17586/assets/imgs/authors/yuanyuan.jpg) |
Yuanyuan Yang received Master degree in Computer Science and Technology from ShanghaiTech University, Shanghai, China, in 2023. Her research interests include SLAM evaluation, sensor fusion and mapping for moblie robots. She is currently working. |
![[Uncaptioned image]](/html/2406.17586/assets/imgs/authors/bowen.jpg) |
Bowen Xu Bowen Xu received his B.S. at ShanghaiTech University in China, and now he is a second-year graduate student at ShanghaiTech University. His research focuses on Robot Mapping and SLAM. |
![[Uncaptioned image]](/html/2406.17586/assets/imgs/authors/soren.png) |
Prof. Dr. Sören Schwertfeger is an Associate Professor at ShanghaiTech University, where he joined in 2014. He is the head of the Mobile Autonomous Robotics Systems Lab (MARS Lab): https://robotics.shanghaitech.edu.cn. He graduated with a Diploma (German equivalent of the Master) in Computer Science in 2005 from the University of Bremen, Germany. In 2012 he received his Ph.D. in Computer Science from the Jacobs University Bremen. Between 2012 and 2014 he was a postdoctoral researcher at the Robotics Group of Prof. Andreas Birk at the Jacobs University Bremen. In 2010 Dr. Schwertfeger was a guest researcher at the National Institute of Standards and Technology (NIST) in Gaithersburg, Maryland, USA, and in 2015 he spend two months as a visiting researcher at University of California, Berkeley, USA. His research interest is in robotics, especially intelligent functions for mobile robots. Besides his work on mapping and SLAM, Dr. Schwertfeger is working on mobile manipulation and rescue robotics, object detection and robot autonomy. Sören Schwertfeger was the general chair of the 2017 IEEE International Symposium on Safety, Security, and Rescue Robotics (SSRR). He is a RoboCup Executive, an associate editor of the IEEE Robotics an d Automation Magazine and recently published, as a guest editor, a special issue on SSRR in the Journal of Field Robotics. |