Quantum Diamond Microscope for Narrowband Magnetic Imaging with High Spatial and Spectral Resolution
Abstract
The quantum diamond microscope (QDM) is a recently developed technology for near-field imaging of magnetic fields with micron-scale spatial resolution. In the present work, we integrate a QDM with a narrowband measurement protocol and a lock-in camera; and demonstrate imaging of radiofrequency (RF) magnetic field patterns produced by microcoils, with spectral resolution Hz. This RF-QDM provides multi-frequency imaging with a central detection frequency that is easily tunable over the MHz-scale, allowing spatial discrimination of both crowded spectral peaks and spectrally well-separated signals. The present instrument has spatial resolution , field-of-view , and per-pixel sensitivity to narrowband fields nTHz-1/2. Spatial noise can be reduced to the picotesla scale by signal averaging and/or spatial binning. The RF-QDM enables simultaneous imaging of the amplitude, frequency, and phase of narrowband magnetic field patterns at the micron-scale, with potential applications in real-space NMR imaging, AC susceptibility mapping, impedance tomography, analysis of electronic circuits, and spatial eddy-current-based inspection.
I Introduction
Nitrogen-vacancy (NV) centers in diamond are robust and sensitive detectors of magnetic fields, among other physical quantities [1, 2]. In particular, the quantum diamond microscope (QDM), utilizing a dense, micron-scale near-surface layer of NV centers in a diamond substrate, is a versatile platform for near-field magnetic field imaging, with diverse applications across the physical and life sciences [3]. To date, QDMs have mostly been used to image patterns of static or broadband magnetic fields, though narrowband measurements have also been performed, e.g., for real-space NMR imaging [4], AC magnetic susceptibility mapping [5], eddy current imaging [6], and phase-sensitive images of a narrowband signal produced by stripline wire [7]. However, the CCD-camera-based measurements used in most QDMs to date have typically been slow due to low frame rate and long exposure time, compared to single-channel measurements using a photodiode and digitizer, restricting the measurement bandwidth and temporal resolution. Moreover, the long exposure time of a CCD camera leads to low NV spin-state optical contrast and a limited ability to mitigate broadband laser intensity noise, both of which result in reduced magnetic signal sensitivity [2]. Fortunately, the development of QDMs utilizing high-speed lock-in cameras provides a platform to acquire magnetic images at a faster rate, while applying phase modulation to bandpass the signal. In a recent demonstration [8], broadband magnetic imaging using Ramsey interferometry and a lock-in camera was realized, with sub-millisecond temporal resolution, micron-scale spatial resolution, and nanotesla-scale per-pixel sensitivity.
Here, we demonstrate narrowband magnetic imaging protocols, integrated with a QDM using a lock-in camera, and capable of high spectral and spatial resolution measurements of patterns of near-field radiofrequency (RF) signals. Beginning with dynamical decoupling sequences, we image in-phase, multi-frequency sub-nanotesla RF signals ( MHz) produced by spiral-shaped microcoils [Fig. 1(a)]; and find good agreement with numerical simulations. This RF-QDM provides lateral spatial resolution , field-of-view (FOV) , and per-pixel sensitivity to narrowband fields nTHz-1/2. The central detection frequency can be easily tuned over several orders of magnitude by simple adjustments to the NV measurement protocol. We also show that RF-QDM measurements have good temporal stability by averaging down the spatial magnetic noise background to a few picotesla after 1 hour. Subsequently, we apply the coherently averaged synchronous readout (CASR) [9] protocol, enabling simultaneous acquisition of amplitude and phase images of multi-frequency RF signals with a 250 Hz spectral window and single-Hz resolution. Given the current performance of the RF-QDM, we evaluate its feasibility for real-space NV-NMR imaging of samples placed on the diamond imager chip, estimating the required acquisition times for imaging both thermally polarized and hyperpolarized NMR signals with various spatial resolutions. Notably, our approach is applicable to other quantum sensors, such as spin defects in silicon carbide (SiC) [10, 11, 12] and hexagonal boron nitride (hBN) [13, 14], thus providing a benchmark for narrowband magnetic imaging based on dynamical decoupling with any spin sensor.
II Experimental Methods
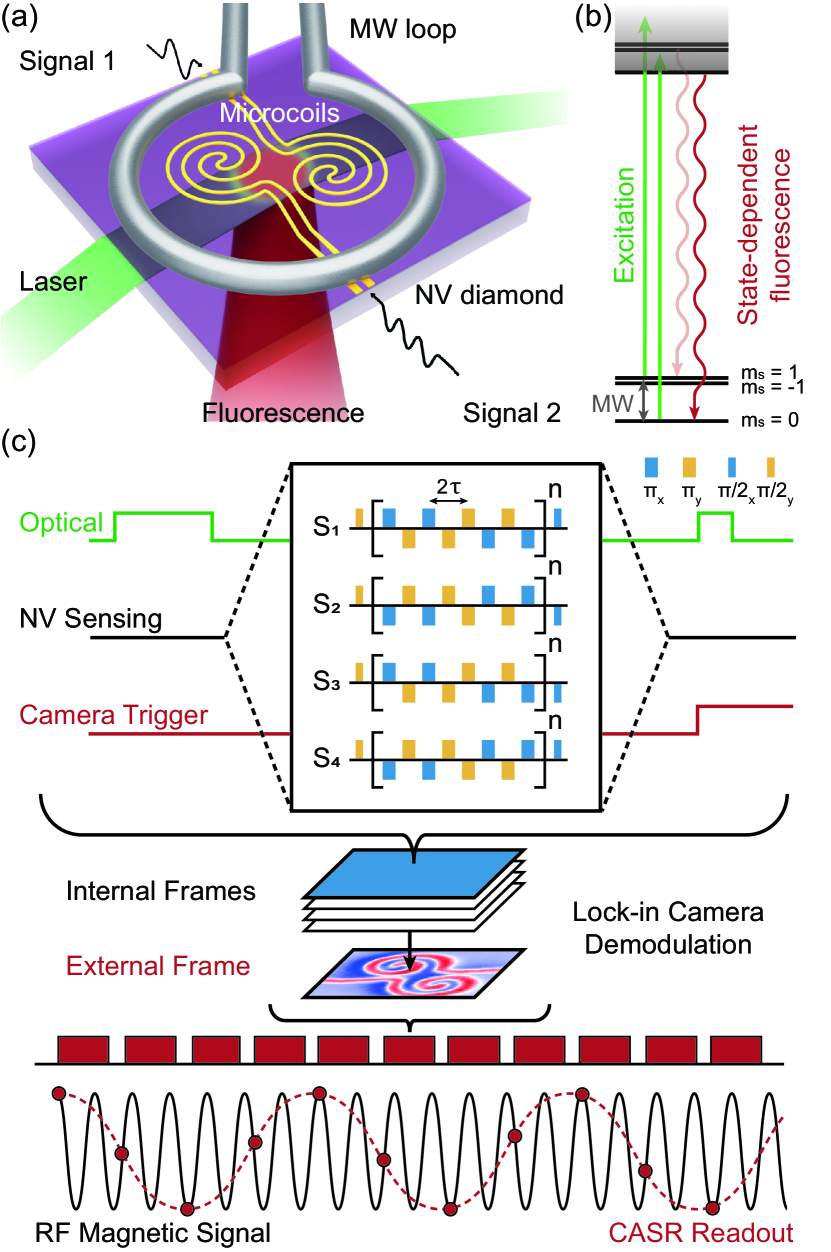
The present study employs a custom-built QDM utilizing a CVD-grown diamond plate [Fig. 1(a)] with a nitrogen-doped surface layer produced by Element Six, Ltd. Unless otherwise noted, measurements and simulations in the main text are for a diamond with a layer [ppm]. Results for a diamond with a layer with the same concentration, as well as other RF-QDM technical details, are reported in the Supplemental Material [15]. The negatively charged (otherwise referred to as NV throughout this paper) possesses a triplet ground-state spin [Fig. 1(b)] that can be optically initialized and read out. In this work, 532 nm green laser light is coupled into a polished side facet of the diamond plate, undergoing total internal reflection (TIR) and illuminating a region of the NV-doped layer. A nominal 22 mT bias magnetic field is aligned to one of the four NV ensemble orientations in diamond for sensing the projection of signal RF magnetic fields along that particular sensing NV orientation (defined as the z axis). The spin-state-dependent fluorescence is subsequently collected with an objective (20/0.75 NA Nikon) and imaged with a lock-in camera (Heliotis heliCam C3) capable of external frame rates up to 3.8 kHz.
An arbitrary waveform generator (AWG) is used to control the experimental apparatus, including direct synthesis of the microwave (MW) pulses that drive transitions between the NV and sub-levels [Fig. 1(b)]. The AWG marker channels synchronize the camera acquisition and gating of an acoustic optical modulator (AOM) used to generate optical pulses exciting the NV layer. In addition, the AWG produces independent RF test signals applied to two spiral-shaped microcoils on the NV-diamond surface, which provide spatially-varying magnetic field patterns across the FOV.
For each imaging pixel, the local RF magnetic fields generated by the microcoils can be measured using a dynamic decoupling protocol (XY8-n), where the net phase acquired by the electronic spin due to the oscillating field is mapped onto a difference in the ground state spin population by a final pulse prior to readout. Four different XY8-n sequences, comprising a single demodulation cycle, are interwoven between exposures of the lock-in camera, as depicted in [Fig. 1(c)], and the corresponding NV fluorescence signals are labeled as . By controlling the phase of the final pulse, one can enhance the readout signal contrast and subtract broadband laser intensity noise by leveraging the in-pixel lock-in camera demodulation. In each cycle and for every pixel, the camera generates an in-phase (I) signal by analog subtraction of the third exposure from the first; and a quadrature (Q) signal as the difference of the second and fourth exposures. The accumulated difference signals after demodulation cycles are digitized to produce external I and Q frames, which are stored in an on-board, memory buffer. Finally, since each I and Q frame pair contains the same information due to the specific phase alternation pattern employed, they are summed to form one external frame of the readout signal after transfer to the host computer. For an applied RF test signal with , where is the projection of the signal magnetic field amplitude on the NV axis, is the oscillation frequency, and is the phase offset, the readout signal for each pixel of an external frame can be written as , where is the signal oscillation amplitude, is a constant, and is the pulse number in the XY8-n sequence. When sensing a magnetic field shift , the change in NV fluorescence readout is given by . By calibrating the magnetometry slope of each pixel, the RF magnetic field image can be extracted from the fluorescence image as shown in the Supplemental Material [15].
The CASR protocol [9] is employed for simultaneous near-field imaging of the amplitude, frequency, and phase of RF signal patterns, with high spectral resolution ( Hz). By recording consecutive lock-in camera external frames [Fig. 1(c)], the time-dependent RF magnetic field is captured by interspersed NV spin-state readouts at a sampling rate of , equal to the external frame rate. Using the CASR protocol, an oscillating NV fluorescence signal in the time domain is read out for each pixel. Applying a Fast Fourier Transform (FFT) yields frequency domain CASR spectra for each pixel, centered at the alias frequency , with peak amplitude [15], where is the first-order Bessel function and is the integer closest to . For the demonstrations presented here, we experimentally ensure that such that the first-order Bessel function closely approximates a linear function, leading to .
III Results
III.1 In-phase RF magnetic imaging
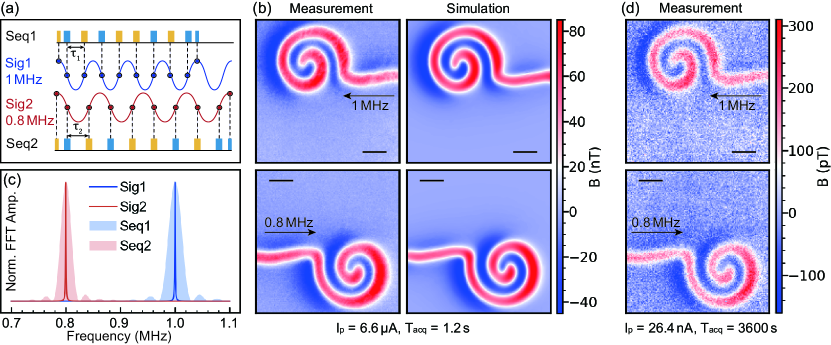
To characterize the performance of the RF-QDM, we begin by imaging narrowband magnetic fields with known phase. We simultaneously apply alternating current (AC) signals at and , each with a peak value of , to two separate microcoils on the NV-diamond surface [Fig. 2(a)]. We first align the XY8-8 sensing sequence in-phase with the signal by setting the pulse spacing to and sweep the test signal phase to obtain maximum signal. After a 1.2 second acquisition (200 camera external frames), we obtain an RF magnetic field amplitude image with a peak-to-peak difference of about 130 nT, revealing the near-field pattern generated by only the upper microcoil with [Fig. 2(b)]. Adjusting the spacing between XY8-8 pulses () to be in phase with the signal, we record the magnetic field pattern produced only by the lower microcoil. The RF-QDM provides clean near-field images of either signal frequency, with no significant ”cross-talk” between the simultaneously-applied signal patterns, because the test signal frequencies are spectrally separated by more than the narrowband filter function of the sensing sequence [Fig. 2(c)]. The center frequency of the filter function is easily tunable, as it is determined by the spacing between pulses in the sensing sequence; while the bandwidth (spectral detection window) is determined by the number of repetitions, , of the XY8-n sequence [16]. For the present demonstration, using an XY8-8 sensing sequence and signal frequencies MHz, the filter function bandwidth kHz. This demonstration illustrates the ability of the RF-QDM to perform micron-scale spatial discrimination of spectrally well-separated narrowband signals.
In Figure 2(b), the measured RF magnetic field distributions are compared to numerical simulations. We calculate the three-dimensional magnetic field generated by a static current of constrained to the physical geometry of the spiral-shaped microcoils using finite element software [17]. Averaging the magnetic field at a stand-off distance over the NV layer thickness and projecting the field vector onto the sensing NV orientation, the simulated magnetic field images are consistent with measurements. To highlight the sensitivity and stability of the RF-QDM, we reduce the amplitude of the two test signals to 26.4 nA. Following an acquisition time of 3600 s for each signal frequency, we obtain images of the in-phase narrowband magnetic field amplitude generated by each microcoil, with a peak-to-peak difference of about 500 pT and [Fig. 2(d)].
III.2 RF magnetic imaging performance
With a magnification objective and camera pixel size, the RF-QDM has a lateral optical resolution, corresponding to the size of a single pixel in the magnetic images [Fig. 2(b,d)]. For the dynamic-decoupling-based experiments discussed above, we vary the number of XY8 sequences and measure the narrowband sensitivity of each pixel across the FOV for a 1 MHz signal frequency, as shown in the Supplemental Material [15]. The optimized sequence is determined to be XY8-8, with a median per-pixel sensitivity of nTHz-1/2. Given a sensing voxel volume for the NV layer diamond, the volume-normalized sensitivity is about 6 nTHz, which is comparable to state-of-the-art ensemble NV sensitivity using XY8 sequences and photodiode (non-imaging) measurements [18]. We estimate the contribution of two per-pixel noise sources: photon shot noise nTHz-1/2 and camera quantization noise nTHz-1/2 [15], indicating that the present RF-QDM’s narrowband sensitivity is limited by the camera. A similar performance analysis is presented in the Supplemental Material [15] for the RF-QDM using the 1.7 NV layer diamond.
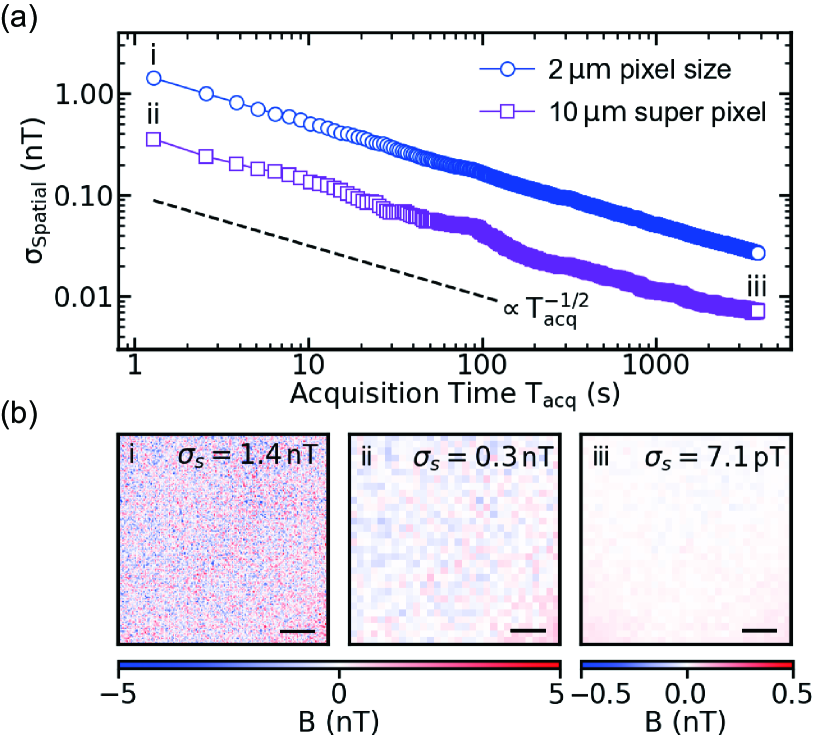
In addition to per-pixel sensitivity, spatial noise is another significant parameter for evaluating RF-QDM performance. To characterize the spatial noise, we conduct single-frame measurements without an applied RF magnetic signal. At a given narrowband detection frequency, the spatial noise floor of an RF-QDM image, , is defined as the pixel-to-pixel standard deviation of the measured in-phase magnetic field amplitude at the detection frequency, determined across the entire FOV; and is inversely proportional to the square root of the averaging frame number. During magnetic imaging, a trade-off arises between spatial resolution and spatial noise. One strategy to mitigate spatial noise is to bin pixels: i.e., group adjacent pixels together to create ”super pixels”; and thereby, effectively reduce the overall spatial noise in the image, albeit with coarser spatial resolution. For applications where the highest spatial resolution of the RF-QDM is not required, averaging noise over the space domain rather than the time domain allows for shorter acquisition times with similar SNR. We demonstrate this approach for 55 binned super pixels of size 10. With no signal applied to the microcoils, we observe for RF-QDM images and a 1 MHz detection frequency, where is the data acquisition time for both 2 (unbinned) pixels and 10 super pixels [Fig. 3(a)]. This behavior indicates that the RF-QDM’s spatial magnetic noise can be suppressed with time averaging out to hour timescales. The spatial noise floor of a single frame with 1.2 s acquisition time and 10 super pixel resolution is similar to that of a 30 s average of multiple frames with 2 single pixel resolution. With 10 super pixel spatial resolution and 1 hour acquisition time, the RF-QDM can average the spatial noise background down to 7.1(1) pT [Fig. 3(b)]. The median per-pixel narrowband sensitivity for a 10 super pixel is also improved to nTHz-1/2.
III.3 Simultaneous amplitude and phase imaging
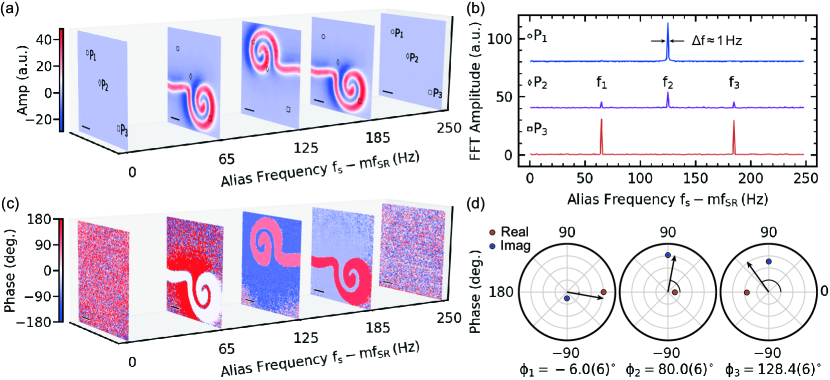
Next, we implement the CASR protocol in the RF-QDM, and simultaneously image the amplitude and phase of a multi-frequency RF magnetic field, with spectral resolution Hz as shown in [Fig. 4]. For these demonstration measurements, we simultaneously apply a dual-tone alternating current to the lower microcoil, and a single-tone current to the upper microcoil. Here, MHz is the carrier frequency; are 65 Hz, 125 Hz and 185 Hz, respectively; and are arbitrary phase offsets of each frequency component, which are fixed during the measurements. The current peak value of is half that of the in-phase signals used in the above results [Fig. 2(b)], with estimated peak RF magnetic field amplitude less than 40 nT, which is in the linear response range of the measurement. The lock-in camera frame rate is set to Hz with 8 demodulation cycles per frame. After 1 second of measurement, a series of NV fluorescence images are acquired [Fig. 1(c)], which gives the RF magnetic field change in the time domain, sampled at the CASR alias frequency. We repeat the measurement 100 times to average down the noise floor, then perform an FFT to the measured time-dependent fluorescence change of each pixel. Finally, we normalize the CASR signal amplitude to the steady-state NV fluorescence for each pixel (in the absence of any NV spin-state modulation) to extract the magnetic field amplitude images of each frequency component, as described in the Supplemental Material [15].
Three test pixels are selected to illustrate the CASR amplitude imaging results [Fig. 4(a,b)]. For pixel , which is located at the upper microcoil, only one frequency peak at is observed in the CASR spectrum. Pixel , located at the lower microcoil, exhibits two frequency components in its CASR spectrum, corresponding to and . The central pixel , located between the two microcoils, exhibits frequency components from both sources, with reduced amplitude. In all cases, the linewidth of CASR spectral peaks Hz (see Supplemental Material [15]). From the CASR spectra of each pixel, we can generate magnetic field amplitude images for each frequency component within the measurement bandwidth, as shown in [Fig. 4(a)] for five different example frequencies. The illustration of CASR amplitude images at frequencies provides insight into the RF magnetic field patterns generated by both microcoils, consistent with the in-phase magnetic field images and simulation results presented in [Fig. 2(b)].
The CASR protocol also enables simultaneous magnetic field phase imaging for each frequency component within the measurement bandwidth. The phases of each measured frequency component, , are dependent on the phases, , of the input test signals, the impedance of the microcoils, and the time delay between the current signal and the CASR sensing sequence. All of these parameters are fixed during measurement, which provides arbitrary but stable phases for the imaged RF magnetic field patterns. When extracting the CASR amplitude from time-domain NV fluorescence measurements, it is essential to consider the phase-dependent real and imaginary components of the CASR FFT spectra. The root mean square of these components yields the amplitude, while the phase can be extracted from the ratio. Based on the measured real and imaginary components of the CASR spectra at locations P1 and P3, we determine phases for each signal frequency components with accuracy of calculated from the noise floor in [Fig. 4(b)]. Repeating the same phase calculation for each pixel across the FOV, we obtain phase images at each frequency step of the CASR spectra, as shown in [Fig. 4(c)]. Further details are discussed in the Supplemental Material [15].
IV Discussion
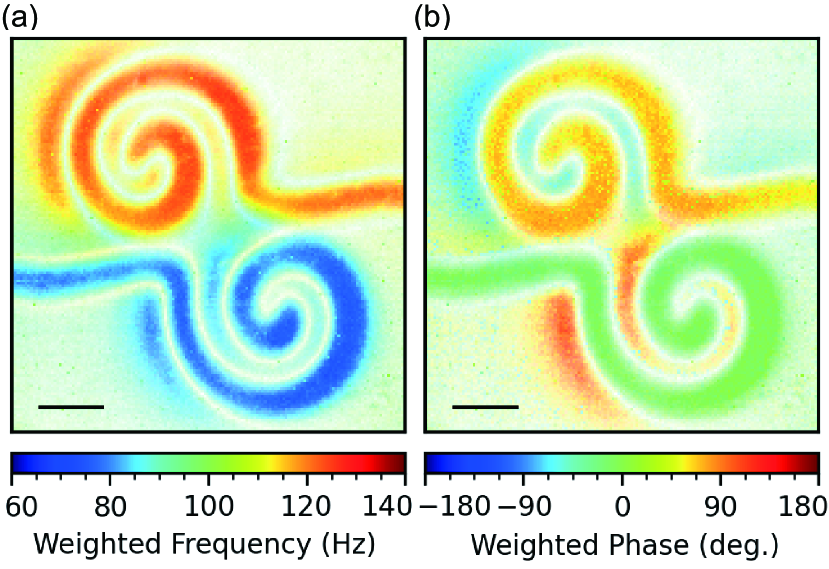
A promising application of the RF-QDM is micron-scale real-space NMR imaging. The RF-QDM’s Hz-scale spectral resolution will enable micron-scale spatial identification of chemical shifts and J-couplings in samples on the diamond surface [9] — key spectral identifiers of molecular structure that are critical to NMR applications in chemistry, life science, and materials research. Based on the results from previous NV-NMR research [9, 19], we estimate a spatial noise threshold of 50 pT for resolvable micron-scale NMR images with for a thermally polarized sample in an external (bias) magnetic field T; and a spatial noise threshold of 10 nT if using dynamic nuclear polarization (DNP) of the sample. Assuming the current RF-QDM performance, an acquisition time around 40 s is required for a thermally polarized sample to surpass this threshold with spatial resolution of 10; whereas DNP hyperpolarization would allow the threshold to be passed in about 30 ms with 2 spatial resolution [Fig. 3(a)]. (Other hyperpolarization techniques can provide even greater nuclear spin polarization, and NV-NMR signal amplitude [20], albeit with operation typically limited to lower bias fields.) With the millisecond-scale time resolution of the RF-QDM’s lock-in camera, it may thus be possible to image real-time NMR dynamics in micron-scale samples, including chemical processes in living systems at the cellular scale and samples within microfluidic structures [21]. To demonstrate the ability of the RF-QDM to spatially discriminate narrowband signals that are spectrally crowded (i.e., differ in frequency by a few tens of Hz, as in many NMR signals of interest), we show example CASR images of weighted frequency and phase from the two microcoils with 60 Hz offset in their signals (around a 1 MHz carrier frequency) [Fig. 5]. The near-field RF signals produced by the two microcoils are clearly distinguished at the micron scale by their different frequencies and phases. Similar weighted frequency (or phase) NV-NMR images could allow detailed spatial monitoring of chemical concentratons in samples of interest.
In this work, the amplitude of RF magnetic signals is held constant during measurements. However, it is worth noting that RF-QDM measurement protocols are applicable to signals with decay envelopes, such as free-inductive-decay (FID) in NMR experiments. A time domain decay envelope manifests as finite FFT peak linewidths in the CASR spectra of each pixel, yielding spatial information from both the imaged signal frequencies and linewidths. This capability of real-space imaged NV-NMR spectroscopy holds promise for applications involving micron-scale samples with spatially varying concentrations and local environments of NMR-detectable nuclear species. Furthermore, technical advances in lock-in camera frame rate and storage capacity can lead to corresponding improvements in sensing bandwidth and spectral resolution, for micron-scale NMR and other applications. In addition, the RF-QDM should be compatible with magnetic field gradients applied to the NV spins [22, 23], potentially allowing combined Fourier and real-space NMR imaging with nanoscale spatial resolution and FOV approaching a millimeter.
We also highlight other promising applications of the RF-QDM. Previous work demonstrated single-channel measurement of the AC susceptibility of 2D magnetic materials using NV centers and XY8 sequences [24]. The RF-QDM will allow micron-scale mapping of the spatial distribution of AC susceptibility, which could serve as an important calibration process for material science investigations. The RF-QDM can also be applied to imaging inductive eddy currents in electrical conductors [25]. By simultaneously imaging the amplitude and phase of the inductive AC magnetic signal, the RF-QDM could provide higher spatial resolution and better sensitivity than conventional techniques for eddy current inspection. For integrated circuits and other micron-scale electronics, the RF-QDM may be useful for failure analysis [26, 27] and hardware Trojan detection [28]. Mapping circuit magnetic field activity across various operating frequencies, the RF-QDM could provide complementary information to static field images [29, 30] and other electromagnetic properties. Additionally, the RF-QDM can be applied to impedance tomography, which is widely used in biological science [31]. Instead of using arrays of coplanar electrodes to detect the spatial distribution of modulated stimulation currents in living cells and tissue — which is invasive and only provides a limited set of point measurements — the RF-QDM may provide a noninvasive direct image of the current amplitude and phase, with full spatial coverage across the FOV.
In summary, we characterize the performance of a lock-in-camera-based quantum diamond microscope (QDM) for narrowband magnetic field imaging; and demonstrate imaging protocols for multi-frequency widefield imaging of near-field patterns of radiofrequency (RF) signals generated by fabricated microcoils, with Hz spectral resolution. This RF-QDM provides per-pixel sensitivity to narrowband fields nTHz-1/2 with spatial resolution across a 300300 field-of-view (FOV). With temporal averaging and spatial binning, the spatial noise floor is reduced to the picotesla-scale, similar to the expected signals from potential applications of real-space NV-NMR imaging using thermally-polarized samples. The RF-QDM simultaneously captures the micron-scale spatial distribution of the amplitude, frequency, and phase of RF magnetic fields, also paving the way for other application areas such as AC susceptibility imaging, eddy current inspection, assessment of electronic circuits, and impedance tomography.
Note that for the results presented here, the RF magnetic field amplitude images depict the projected value on the sensing NV orientation. However, as there are four NV orientations in diamond, the RF-QDM should be applicable to imaging of the RF magnetic field vector [32]. This capability, to be demonstrated in future work, could also allow the correction of image artifacts related to variation of RF magnetic field direction across the finite NV layer. In addition, the present RF-QDM is limited to signal frequencies MHz by technical constraints on the NV Rabi frequency. Future advances in delivered MW signal strength (and hence increased NV Rabi frequency), or the application of a quantum frequency mixing protocol [33], will allow imaging of higher signal frequencies ( MHz to GHz range). We also note that the RF-QDM is compatible with narrowband sensing protocols that provide improved sensitivity compared to XY8, e.g., DROID-60 [34, 35] and quantum logic enhanced repetitive readout [18]. However, these protocols typically have increased complexity, resulting in a longer sensing time. Currently, due to limitations imposed by the memory of the RF-QDM’s lock-in camera, employing such protocols would reduce the frame rate and available measurement time, leading to a reduced spectral detection window for CASR imaging. Improvements in camera technology and data processing algorithms may help alleviate these limitations, further enhancing RF-QDM performance for narrowband magnetic field imaging.
Acknowledgements.
We acknowledge the Maryland NanoCenter and its FabLab for providing instruments and assistance to fabricate the microwave waveguide and microcoils. This work is supported by, or in part by, the U.S. Army Research Laboratory under Contract No. W911NF1920181; the U.S. Army Research Office under Grant No. W911NF2120110; the U.S. Air Force Office of Scientific Research under Grant No. FA9550-22-1-0312; the Gordon & Betty Moore Foundation under Grant No. 7797.01; and the University of Maryland Quantum Technology Center.References
- Taylor et al. [2008] J. M. Taylor, P. Cappellaro, L. Childress, L. Jiang, D. Budker, P. R. Hemmer, A. Yacoby, R. Walsworth, and M. D. Lukin, High-sensitivity diamond magnetometer with nanoscale resolution, Nature Physics 4, 810 (2008).
- Barry et al. [2020] J. F. Barry, J. M. Schloss, E. Bauch, M. J. Turner, C. A. Hart, L. M. Pham, and R. L. Walsworth, Sensitivity optimization for nv-diamond magnetometry, Reviews of Modern Physics 92, 10.1103/RevModPhys.92.015004 (2020).
- Levine et al. [2019] E. V. Levine, M. J. Turner, P. Kehayias, C. A. Hart, N. Langellier, R. Trubko, D. R. Glenn, R. R. Fu, and R. L. Walsworth, Principles and techniques of the quantum diamond microscope, Nanophotonics 8, 1945 (2019).
- Devience et al. [2015] S. J. Devience, L. M. Pham, I. Lovchinsky, A. O. Sushkov, N. Bar-Gill, C. Belthangady, F. Casola, M. Corbett, H. Zhang, M. Lukin, H. Park, A. Yacoby, and R. L. Walsworth, Nanoscale nmr spectroscopy and imaging of multiple nuclear species, Nature Nanotechnology 10, 129 (2015).
- Dasika et al. [2023] S. Dasika, M. Parashar, and K. Saha, Mapping ac susceptibility with quantum diamond microscope, Review of Scientific Instruments 94, 10.1063/5.0138301 (2023).
- Chatzidrosos et al. [2019] G. Chatzidrosos, A. Wickenbrock, L. Bougas, H. Zheng, O. Tretiak, Y. Yang, and D. Budker, Eddy-current imaging with nitrogen-vacancy centers in diamond, Physical Review Applied 11, 10.1103/PhysRevApplied.11.014060 (2019).
- Mizuno et al. [2020] K. Mizuno, H. Ishiwata, Y. Masuyama, T. Iwasaki, and M. Hatano, Simultaneous wide-field imaging of phase and magnitude of ac magnetic signal using diamond quantum magnetometry, Scientific Reports 10, 10.1038/s41598-020-68404-5 (2020).
- Tang et al. [2023] J. Tang, Z. Yin, C. A. Hart, J. W. Blanchard, J. T. Oon, S. Bhalerao, J. M. Schloss, M. J. Turner, and R. L. Walsworth, Quantum diamond microscope for dynamic imaging of magnetic fields, AVS Quantum Science 5, 10.1116/5.0176317 (2023).
- Glenn et al. [2018] D. R. Glenn, D. B. Bucher, J. Lee, M. D. Lukin, H. Park, and R. L. Walsworth, High-resolution magnetic resonance spectroscopy using a solid-state spin sensor, Nature 555, 351 (2018).
- Klimov et al. [2015] P. V. Klimov, A. L. Falk, D. J. Christle, V. V. Dobrovitski, and D. D. Awschalom, Quantum entanglement at ambient conditions in a macroscopic solid-state spin ensemble, Science Advances 1, 10.1126/sciadv.1501015 (2015).
- Widmann et al. [2015] M. Widmann, S. Y. Lee, T. Rendler, N. T. Son, H. Fedder, S. Paik, L. P. Yang, N. Zhao, S. Yang, I. Booker, A. Denisenko, M. Jamali, S. A. Momenzadeh, I. Gerhardt, T. Ohshima, A. Gali, E. Janzén, and J. Wrachtrup, Coherent control of single spins in silicon carbide at room temperature, Nature Materials 14, 164 (2015).
- Jiang et al. [2023] Z. Jiang, H. Cai, R. Cernansky, X. Liu, and W. Gao, Quantum sensing of radio-frequency signal with nv centers in sic, Science Advances 9, eadg2080 (2023).
- Gottscholl et al. [2020] A. Gottscholl, M. Kianinia, V. Soltamov, S. Orlinskii, G. Mamin, C. Bradac, C. Kasper, K. Krambrock, A. Sperlich, M. Toth, I. Aharonovich, and V. Dyakonov, Initialization and read-out of intrinsic spin defects in a van der waals crystal at room temperature, Nature Materials 19, 540 (2020).
- Rizzato et al. [2023] R. Rizzato, M. Schalk, S. Mohr, J. C. Hermann, J. P. Leibold, F. Bruckmaier, G. Salvitti, C. Qian, P. Ji, G. V. Astakhov, U. Kentsch, M. Helm, A. V. Stier, J. J. Finley, and D. B. Bucher, Extending the coherence of spin defects in hbn enables advanced qubit control and quantum sensing, Nature Communications 14, 10.1038/s41467-023-40473-w (2023).
- [15] See supplemental material at http://link.aps.org/ supplemental/ for additional details of this paper.
- Łukasz Cywiński et al. [2008] Łukasz Cywiński, R. M. Lutchyn, C. P. Nave, and S. D. Sarma, How to enhance dephasing time in superconducting qubits, Physical Review B - Condensed Matter and Materials Physics 77, 10.1103/PhysRevB.77.174509 (2008).
- com [2021] COMSOL Multiphysics® v. 6.0 (2021).
- Arunkumar et al. [2023] N. Arunkumar, K. S. Olsson, J. T. Oon, C. A. Hart, D. B. Bucher, D. R. Glenn, M. D. Lukin, H. Park, D. Ham, and R. L. Walsworth, Quantum logic enhanced sensing in solid-state spin ensembles, Physical Review Letters 131, 10.1103/PhysRevLett.131.100801 (2023).
- Bucher et al. [2020] D. B. Bucher, D. R. Glenn, H. Park, M. D. Lukin, and R. L. Walsworth, Hyperpolarization-enhanced nmr spectroscopy with femtomole sensitivity using quantum defects in diamond, Physical Review X 10, 10.1103/PhysRevX.10.021053 (2020).
- Arunkumar et al. [2021] N. Arunkumar, D. B. Bucher, M. J. Turner, P. Tomhon, D. Glenn, S. Lehmkuhl, M. D. Lukin, H. Park, M. S. Rosen, T. Theis, and R. L. Walsworth, Micron-scale nv-nmr spectroscopy with signal amplification by reversible exchange, PRX Quantum 2, 10.1103/PRXQuantum.2.010305 (2021).
- Briegel et al. [2024] K. D. Briegel, N. R. V. Grafenstein, J. C. Draeger, P. Blümler, R. D. Allert, and D. B. Bucher, Optical widefield nuclear magnetic resonance microscopy, arXiv (2024).
- Arai et al. [2015] K. Arai, C. Belthangady, H. Zhang, N. Bar-Gill, S. J. DeVience, P. Cappellaro, A. Yacoby, and R. L. Walsworth, Fourier magnetic imaging with nanoscale resolution and compressed sensing speed-up using electronic spins in diamond, Nature Nanotechnology 10, 859 (2015).
- Zhang et al. [2017] H. Zhang, K. Arai, C. Belthangady, J. C. Jaskula, and R. L. Walsworth, Selective addressing of solid-state spins at the nanoscale via magnetic resonance frequency encoding, npj Quantum Information 3, 10.1038/S41534-017-0033-3 (2017).
- Zhang et al. [2021] X.-Y. Zhang, Y.-X. Wang, T. A. Tartaglia, T. Ding, M. J. Gray, K. S. Burch, F. Tafti, and B. B. Zhou, ac susceptometry of 2d van der waals magnets enabled by the coherent control of quantum sensors, PRX Quantum 2, 030352 (2021).
- Wang et al. [2018] C. Wang, M. Fan, B. Cao, B. Ye, and W. Li, Novel noncontact eddy current measurement of electrical conductivity, IEEE Sensors Journal 18, 9352 (2018).
- Oliver et al. [2021] S. M. Oliver, D. J. Martynowych, M. J. Turne, D. A. Hopper, R. L. Walswort, and E. V. Levine, Vector Magnetic Current Imaging of an 8 nm Process Node Chip and 3D Current Distributions Using the Quantum Diamond Microscope, ISTFA 2021 , 96 (2021).
- Kehayias et al. [2023] P. Kehayias, J. Walraven, A. Rodarte, and A. Mounce, High-resolution short-circuit fault localization in a multilayer integrated circuit using a quantum diamond microscope, Phys. Rev. Appl. 20, 014036 (2023).
- Ashok et al. [2022] M. Ashok, M. J. Turner, R. L. Walsworth, E. V. Levine, and A. P. Chandrakasan, Hardware trojan detection using unsupervised deep learning on quantum diamond microscope magnetic field images, J. Emerg. Technol. Comput. Syst. 18, 10.1145/3531010 (2022).
- Turner et al. [2020] M. J. Turner, N. Langellier, R. Bainbridge, D. Walters, S. Meesala, T. M. Babinec, P. Kehayias, A. Yacoby, E. Hu, M. Lončar, R. L. Walsworth, and E. V. Levine, Magnetic field fingerprinting of integrated-circuit activity with a quantum diamond microscope, Physical Review Applied 14, 10.1103/PhysRevApplied.14.014097 (2020).
- Kehayias et al. [2022] P. Kehayias, E. V. Levine, L. Basso, J. Henshaw, M. S. Ziabari, M. Titze, R. Haltli, J. Okoro, D. R. Tibbetts, D. M. Udoni, E. Bielejec, M. P. Lilly, T. M. Lu, P. D. Schwindt, and A. M. Mounce, Measurement and simulation of the magnetic fields from a 555 timer integrated circuit using a quantum diamond microscope and finite-element analysis, Physical Review Applied 17, 10.1103/PhysRevApplied.17.014021 (2022).
- Bounik et al. [2022] R. Bounik, F. Cardes, H. Ulusan, M. M. Modena, and A. Hierlemann, Impedance imaging of cells and tissues: Design and applications, BME Frontiers 2022, 10.34133/2022/9857485 (2022).
- Schloss et al. [2018] J. M. Schloss, J. F. Barry, M. J. Turner, and R. L. Walsworth, Simultaneous broadband vector magnetometry using solid-state spins, Phys. Rev. Appl. 10, 034044 (2018).
- Wang et al. [2022] G. Wang, Y. X. Liu, J. M. Schloss, S. T. Alsid, D. A. Braje, and P. Cappellaro, Sensing of arbitrary-frequency fields using a quantum mixer, Physical Review X 12, 10.1103/PhysRevX.12.021061 (2022).
- Zhou et al. [2020] H. Zhou, J. Choi, S. Choi, R. Landig, A. M. Douglas, J. Isoya, F. Jelezko, S. Onoda, H. Sumiya, P. Cappellaro, H. S. Knowles, H. Park, and M. D. Lukin, Quantum metrology with strongly interacting spin systems, Physical Review X 10, 10.1103/PHYSREVX.10.031003 (2020).
- Choi et al. [2020] J. Choi, H. Zhou, H. S. Knowles, R. Landig, S. Choi, and M. D. Lukin, Robust dynamic hamiltonian engineering of many-body spin systems, Physical Review X 10, 10.1103/PHYSREVX.10.031002 (2020).