DeepJEB: 3D Deep Learning-based Synthetic Jet Engine Bracket Dataset
Abstract
Recent advancements in artificial intelligence (AI) have significantly influenced various fields, including mechanical engineering. Nonetheless, the development of high-quality, diverse datasets for structural analysis still needs to be improved. Although traditional datasets, such as simulated jet engine bracket dataset, are useful, they are constrained by a small number of samples, which must be improved for developing robust data-driven surrogate models. This study presents the DeepJEB dataset, which has been created using deep generative models and automated engineering simulation pipelines, to overcome these challenges. Moreover, this study provides comprehensive 3D geometries and their corresponding structural analysis data.
Key experiments validated the effectiveness of the DeepJEB dataset, demonstrating significant improvements in the prediction accuracy and reliability of surrogate models trained on this data. The enhanced dataset showed a broader design space and better generalization capabilities than traditional datasets. These findings highlight the potential of DeepJEB as a benchmark dataset for developing reliable surrogate models in structural engineering. The DeepJEB dataset supports advanced modeling techniques, such as graph neural networks (GNNs) and high-dimensional convolutional networks (CNNs), leveraging node-level field data for precise predictions. This dataset is set to drive innovation in engineering design applications, enabling more accurate and efficient structural performance predictions. The DeepJEB dataset is publicly accessible at: https://www.narnia.ai/dataset.
1 Introduction
The rapid advancements in artificial intelligence (AI) have revolutionized various domains, and the field of mechanical engineering is no exception. The significance of comprehensive and diverse datasets has become increasingly apparent as AI advances at an unprecedented rate. Generative models, particularly those based on 2D images and text, have already demonstrated their potential [1, 2, 3, 4]. These models have advanced from academic research to real-world applications, providing practical benefits to society. Inspired by these developments, researchers in the field of mechanical engineering are increasingly leveraging data-driven approaches. These approaches are being utilized to address complex problems previously considered intractable or bottlenecked.
AI has found extensive applications in two key areas within mechanical engineering: generative design and predictive analysis [5, 6, 7]. Generative AI has garnered significant attention as a potential solution to the scarcity of data in mechanical design. Moreover, generative AI can effectively address the limitations caused by insufficient real-world data by providing novel data augmentation techniques [8, 9, 10, 11]. But predictive analysis has emerged as a subcategory of data-driven surrogate modeling and reduced-order modeling research. These approaches aim to develop efficient and accurate models that can predict the behavior of complex engineering systems.
One of the significant advantages of AI models, particularly deep learning architectures, is their ability to learn from high-dimensional data. This capability sets these AI models apart from traditional data-driven methodologies, which often struggle to handle the complexity and dimensionality of real-world engineering problems [12, 13, 14, 15, 16, 17]. However, research in this area has been primarily limited to benchmark problems due to the need for additional available data. Studies on 3D data and field predictions, crucial for industrial applications, are particularly scarce. Even when predictive models are developed, they typically depend on scalar values rather than considering the entire field, limiting their explanatory power. Although scalar values help in evaluating and optimizing geometries, they do not provide insights into the specific design regions that influence these evaluations. Moreover, accurate field predictions are in high demand because most scalar values are obtained from analytical results.
Addressing these challenges requires datasets that encompass field information, enabling comprehensive and insightful analyses in mechanical engineering applications [9, 18]. Researchers and practitioners can develop data-driven models that optimize designs and provide an extensive understanding of the underlying phenomena governing system behavior by leveraging such datasets. This paradigm shift toward data-driven approaches has the potential to revolutionize the field of mechanical engineering, enabling the development of highly efficient, reliable, and innovative solutions to complex problems.
However, the availability of public datasets in the mechanical engineering field is limited compared with the actively researched computer science domain. In particular, 3D simulation data are scarce due to the high computational and time costs involved. Moreover, additional diverse 3D data benchmarks are necessary to support various types of analyses. Consequently, 3D simulation datasets with multiple analyses performed are rare, and the existing datasets require additional samples for effective machine learning.
Simulated jet engine bracket dataset (SimJEB) [19] is one of the few publicly available 3D datasets in the engineering domain that provides boundary representation (B-Rep) files and structural analysis simulation data, including scalar and field data. However, the SimJEB dataset consists of only 381 samples, which must be increased to effectively train AI models. Furthermore, the structural analysis simulation label data contain outliers that significantly deviate from the data distribution. Additional data-cleaning processes are necessary to use this dataset for deep learning purposes, which may further reduce the number of usable samples.
To address these limitations, this work aims to utilize deep generative models to enhance the diversity of shapes and performance features in the SimJEB dataset, which serves as the foundation for our study. This endeavor seeks to improve the quality and quantity of the data, resulting in a high-quality 3D dataset for engineering design applications. The proposed dataset, named DeepJEB, provides engineering data labeled through structural simulations and is intended to serve as a benchmark dataset for data-driven surrogate models in the field of structural analysis.
The main contributions of this work are as follows:
-
1.
We present a large-scale dataset containing high-resolution 3D designs of jet engine brackets, accompanied by their corresponding structural simulation results. This dataset comprises a total of 2138 designs, making it approximately 5.6 times larger than SimJEB, the previously largest publicly available dataset for jet engine brackets. Moreover, this dataset provides information for estimating engineering performance based on various structural designs.
-
2.
Our dataset utilizes second-order tetrahedral elements in 3D structural simulations compared with SimJEB, providing more accurate simulation values and detailed field data based on an average of 209,000 nodal values.
-
3.
In addition to the four linear static load cases (horizontal, vertical, diagonal, and torsional) performed in the baseline dataset, we introduce supplementary engineering performance metrics not available in SimJEB, such as natural frequencies, mode shapes obtained through normal mode analysis, and inertia tensors, which enable the evaluation of dynamic performance.
-
4.
We provide multi-view images applicable to multi-view models, a popular research topic in the 3D graphics domain. Our dataset, unlike SimJEB, includes these multi-view images, facilitating advanced modeling techniques and analysis that are increasingly relevant in contemporary 3D graphics research.
-
5.
We demonstrate the potential of deep generative models to expand the design space of jet engine brackets and propose a simulation pipeline methodology for labeling engineering performance based on the synthesized data.
-
6.
We create a training dataset suitable for deep learning by expanding the dataset size and demonstrate the influence of synthetic data on improving surrogate model performance through a case study. The case study shows a 20.7% improvement in R² score compared to the baseline dataset, indicating enhanced predictive accuracy.
-
7.
We conduct a comprehensive analysis of the design and performance space to pre-label an appropriate test dataset that can serve as a benchmark for deep learning training.
| Data Type | Description |
|---|---|
| Surface Mesh | Tessellated surface mesh data in STL format. |
| Volume Mesh | Second-order tetrahedral mesh data in VTK format. |
| B-Rep | Boundary representation data in STEP format. |
| Solver Deck | Input files for numerical analysis solvers in FEM format. |
| Scalar Data | Geometric and analysis information in CSV format, including center of gravity, mass, volume, maximum displacement, maximum stress, and natural frequencies. |
| Field Data | Detailed simulation results at mesh nodes in CSV format, encompassing the , and coordinates, and resultant displacement, signed von Mises stress, and normal mode shapes. |
| Field Mesh | Hierarchical data format file combining volume mesh and nodal data in H5 format. |
| Image | Images of the bracket from various angles in PNG format. |
| Metadata | Train-test split labels in JSON format |
The DeepJEB dataset is categorized into geometric data and analysis data. Geometric data are available as surface mesh, B-Rep, and volume mesh data (Table 1). Analysis data encompasses scalar and field data for each sample and analysis solver input files. We also provide H5 files that combine the volume mesh and field data to facilitate efficient processing and mapping of field data with geometric data.
Scalar data include geometric information, such as the center of gravity, mass, and volume of each data sample and analysis information, such as maximum displacement, maximum stress, and natural frequencies. Field data encompass detailed simulation results at each mesh node, including the , and coordinates, corresponding displacement, and stress values.
We developed a dataset comprising 2138 3D geometric samples and their corresponding structural analysis data utilizing deep learning techniques. We also provide signed von Mises stress data, which allow for determining tension/compression based on the sign. These specific forms of data ensure that surrogate models can be evaluated for their performance and robustness in a wide range of scenarios.
Furthermore, we provide a dataset of 26 multi-view images of the bracket, including 8 distinct azimuth angles, 3 elevation angles, as well as top and bottom views. We include train–test split labels in JSON format to facilitate the use of the dataset as a benchmark, ensuring a uniform distribution across the design and performance spaces.
The structure of our paper is organized as follows: Section 2 reviews related work, including benchmark datasets and the use of deep generative models in the field. Section 3 describes the methodologies used for data collection, generation, geometric filtering, and the automation of analysis processes. Section 4 details the validation processes utilized to ensure data quality and benchmark suitability, comparing the design spaces between SimJEB and DeepJEB datasets. Section 5 presents a case study demonstrating the application of the synthetic dataset in surrogate modeling, comparing the performance of models built with the SimJEB and DeepJEB datasets. Section 6 summarizes the findings and contributions of this work and discusses implications for future research. Finally, Section 7 provides information on licensing, attributions, and access to the dataset and research tools used.
2 Literature Review
2.1 Benchmark Dataset
The rapid advancements in computer science have led to a proliferation of studies focused on 3D models, resulting in an increased availability of datasets for related research. In contrast to 2D images, which are defined as structured grids, 3D data can be represented in various forms, such as voxels (discretized volumes analogous to images), multi-view images (captured from different angles), point clouds (surfaces discretized into points), and more.
Computer-aided design (CAD) data, consisting of the commands used to create 3D models, also falls under the category of 3D data. Research endeavors, such as Fusion360 Gallery [20] and DeepCAD [21], have aimed to generate data based on these command sequences. Mesh data can be readily converted into point clouds, voxels, and multi-view representations.
Several benchmark datasets, such as ShapeNet [22], ABC [23], and ModelNet [24], have been established to represent 3D shapes using mesh-based approaches. However, these datasets were primarily constructed by research communities with a background in computer graphics, resulting in a higher proportion of everyday objects and household items compared to engineering components that could be utilized in a mechanical engineering context.
Among these datasets, ShapeNet has gained popularity due to its diverse range of categories and a large number of data samples within each category, resulting in studies leveraging this dataset. References [25] and [16] utilized the vehicle and airplane categories from ShapeNet to perform computational fluid dynamics (CFD) analyses and develop data-driven surrogate models and optimization techniques.
The MCB dataset [26], which focuses on mechanical parts such as gears, brackets, and linkages, offers high potential for practical applications. However, the dataset contains a significant number of component-level data and was collected from various sources, such as Traceparts, GrabCAD, and 3D Warehouse, resulting in inconsistencies in alignment and scaling, which limits its usability.
A notable drawback of existing benchmark datasets, including ShapeNet, is the lack of labels related to engineering performance, which limits their applicability to relevant engineering problems. Performance data is necessary for the development of data-driven models that can predict and optimize the behavior of 3D shapes in an engineering context.
Efforts have been made in the engineering field to develop large-scale 3D datasets specifically designed for this area to address these limitations. These efforts aim to address the shortcomings of existing datasets and provide a foundation for data-driven approaches in engineering applications. Notable examples include the FRAMED dataset [27], which consists of 4500 parametric bike frame shape data coupled with finite element method (FEM) results, and the Ship-D dataset [28], which contains ship-hull data defined by 45 parameters along with 32 wave drag coefficients.
SimJEB [19] is a public dataset that includes shape data, scalar values, and FEM data. This dataset utilizes 381 hand-designed CAD models submitted to the GE jet engine bracket challenge. SimJEB provides scalar labels, such as maximum displacement in the , , and directions, and maximum von Mises stress for four load cases. Additionally, SimJEB offers field data for the nodal points from the finite element analysis (FEA). However, SimJEB has a limitation in terms of the absolute quantity of data, making it challenging to obtain a sufficient dataset for training and validating deep learning models.
2.2 Deep Generative Model for Engineering Problem
The advancement of deep learning techniques and the growing interest in generative models have resulted in numerous efforts to utilize these models to generate engineering data. In particular, numerous studies have focused on 2D image-based approaches.
In mechanical design, research on topology optimization has been actively conducted even before the emergence of generative models. Studies [29, 30, 31, 8], and various reviews [32, 33, 34] have explored the integration of topology optimization with generative models.
TopOpNet [35] proposed a methodology that leverages reinforcement learning to generate many diverse data samples within a short inference time. Reference [8] introduced a complete process for training generative models using 2D image data generated through topology optimization methods. This research was further extended by [36], who developed a framework for generating and analyzing 3D data.
In the domain of CFD, researchers have been conducting studies on data-driven generative models using existing benchmark datasets, such as airfoils, and CFD simulators, such as X-foil [37]. PaDGAN [38] presented a generative model that utilizes Bezier curve techniques, taking advantage of the smooth surface characteristics and parameterized data of airfoils. Moreover, PaDGAN utilized a determinantal point processes (DPP) loss function to promote the generation of high-quality samples while covering a diverse data space.
PcDGAN [39] is an improved generative model that aims to generate new designs that satisfy specific performance requirements with an enhanced ability to model continuous conditions. This model incorporates concepts, such as performance-conditioned DPP loss, singular vicinal loss, and conditional batch normalization, for continuous labels to ensure continuity and diversity from a performance perspective.
Furthermore, MO-PaDGAN [40] has been proposed as an extension of the PaDGAN, incorporating DPP-based loss functions suitable for multi-objective problems, enabling the discovery of superior Pareto fronts.
Synthetic data have gained significant attention in engineering design as a crucial solution to address the limitations of real-world datasets in terms of scale and availability. CarHoods10k [41] provided a synthetic dataset that includes over 10,000 data samples and corresponding performance data. This synthetic dataset was generated by identifying and parameterizing features from CAD models of automotive hoods, which were combined with basic shapes and feature patterns to produce synthetic data. The synthesized data leveraged geometric deep learning techniques to predict performance values within a low-dimensional latent space instead of relying on traditional parametric methods. Additionally, these techniques facilitated the generation of new samples, thereby enabling design optimization and the creation of novel geometric configurations. Furthermore, research efforts, such as the DATED [42] study, have focused on establishing guidelines for generating high-quality synthetic datasets in the engineering design domain.
2.3 3D Generative Model
Although 2D data offer advantages in training and have numerous benchmark datasets that facilitate research, their validity has limitations, as real-world mechanical components and their analyses are primarily performed in three dimensions. 3D data pose challenges due to the limited availability of usable datasets and the complexities involved in representing and processing 3D shapes [9].
The representation of 3D data varies depending on the problem definition [43, 44, 45, 46, 47]. The main categories of 3D data representation include voxels, point clouds, meshes, and implicit functions. Voxels discretize 3D volumes into a grid, allowing the utilization of convolutional neural networks and similar techniques [48, 49]. Point clouds represent 3D surfaces using a set of 3D points, capturing detailed shapes and providing a global representation [50, 51]. Meshes discretize surfaces by connecting vertices to form faces, allowing for a compact representation of surfaces and compatibility with graph-based approaches [52, 53, 54, 55].
However, all three representation methods have limitations when representing mechanical components. Consequently, implicit functions are increasingly used as a representation for generative models [56, 57]. The signed distance function (SDF) is commonly utilized for solid shapes with a clear distinction between the interior and exterior. An SDF represents the shortest distance from an arbitrary point to the shape’s surface and is determined by whether the point is inside or outside the shape, indicated by its sign.
Implicit neural representations, particularly SDF, have gained significant attention in 3D generative models due to their ability to represent shapes with high fidelity, handle topological changes, and generate novel and feasible shapes. These representations have shown promising results in various domains and have the potential to revolutionize the way 3D data is represented and processed in engineering applications.
Since DeepSDF [45], the pioneering approach to representing shapes as signed distance functions and implicitly learning them, numerous models have been developed for shape manipulation. Among these, DualSDF [58] introduces an additional coarse network to facilitate shape manipulation, while A-SDF [59] disentangles the latent space specifically for articulated objects. These models share a common feature: an auto-decoder structure without an encoder. In addition, these models take coordinates and latent code as inputs, optimizing the latent code within the model via backpropagation.
3 DeepJEB Dataset Creation
Developing the DeepJEB dataset represents a comprehensive effort to create a high-quality, expansive dataset tailored for engineering design and analysis applications. This section details the processes and methodologies used to transform the SimJEB dataset into the enhanced DeepJEB dataset.
Introduction of Baseline Dataset
The DeepJEB dataset, derived from the SimJEB 3D shape dataset, originates from the GE jet engine bracket CAD challenge. This dataset, comprising various CAD models specifically designed for the structural analysis of jet engine brackets, is a valuable resource for engineering applications. In creating DeepJEB, the geometry data from SimJEB were utilized to create diverse bracket designs. FEM simulations were then performed on the derived synthetic data to enrich the dataset with necessary engineering analysis data.
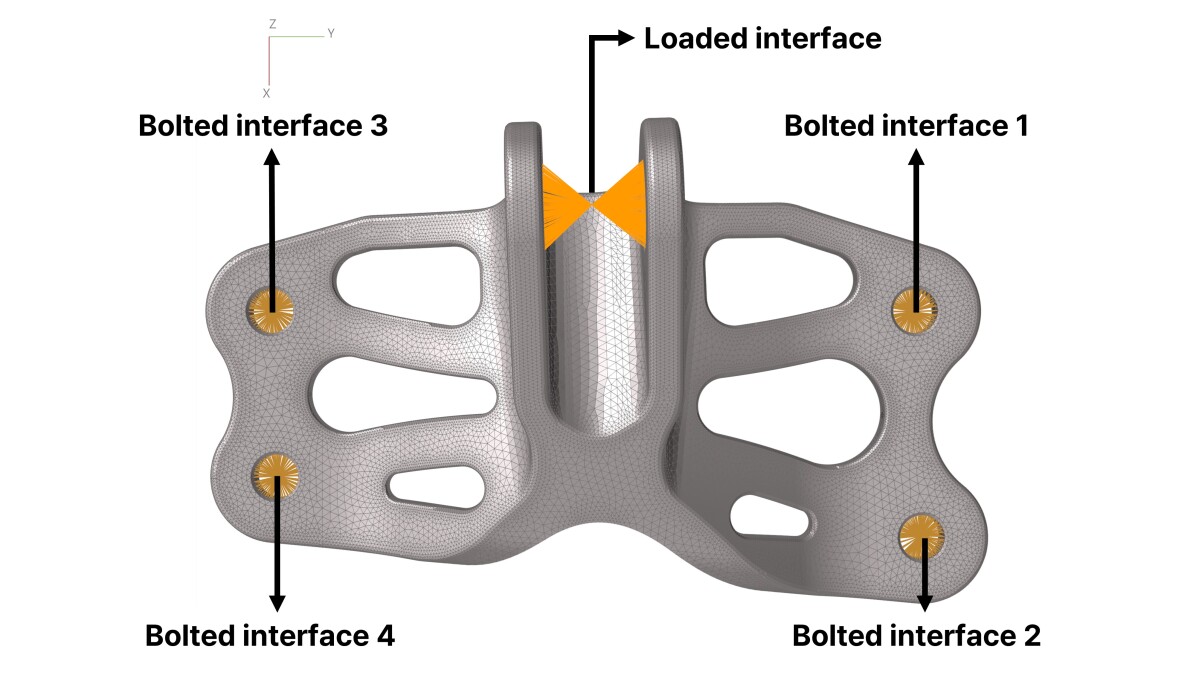
The boundary conditions in the baseline dataset are derived from the GE Jet Engine Bracket CAD challenge interfaces. These conditions are integrated into rigid body elements (RBE) to enhance computational efficiency. Figure 1(a) illustrates the categorization of the boundary conditions into loaded and bolted interfaces. The loaded interfaces are connected using multi-point constraints (MPC) and are modeled as interpolated RBEs (RBE3). For example, points near the loaded interface are connected via an MPC and modeled as an RBE3, with the center point of this element subjected to predefined loads. This approach ensures that the simulation can efficiently represent the load distribution and structural response. Meanwhile, the bolted interfaces are also connected using MPC but are modeled as RBEs (RBE2). For instance, bolted interfaces 1 to 4 use an RBE2 where the points near these interfaces are fixed, providing a realistic simulation of the bracket’s attachment points to the engine structure.
3.1 Deep Generative Model-based Geometry Generation
3.1.1 Seed Data Selection
Seed data is meticulously selected from the baseline dataset to ensure the stability and reliability of the synthetic data. The selection process aims to eliminate samples that may introduce inconsistencies and maintain uniformity in boundary conditions during the automated simulation stage. Ensuring consistency in boundary conditions is crucial for maintaining geometric stability and preventing errors in the simulation pipeline, which could otherwise arise from variations at boundary sections.
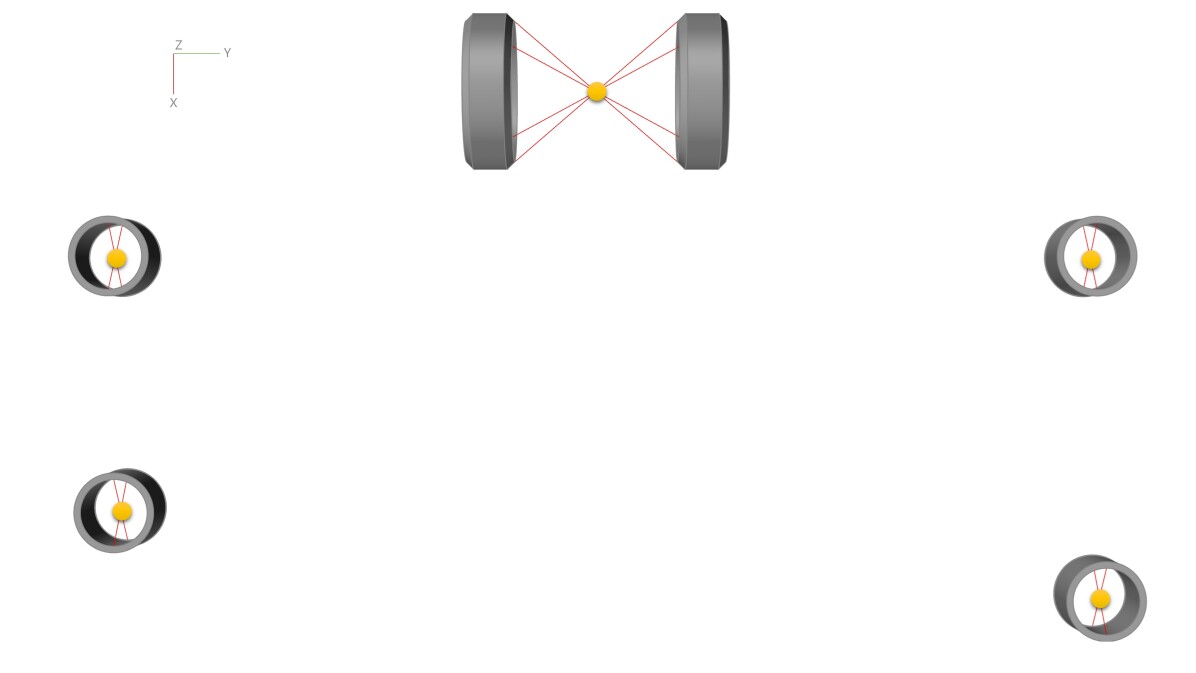
The criteria for data selection focus on identifying and filtering out noisy samples. Specifically, geometric issues, such as samples prone to noise, those with cavities, or fragile structures, are removed. Furthermore, alignment errors between the predefined boundary center points (illustrated in Fig. 1(b)) and the sample interfaces are calculated. The distance between the RBE center point of each interface and the RBE center point of the predefined boundary design is calculated according to Eq. (1) to quantify the boundary alignment error.
| Boundary alignment error | |||
| (1) |
The cumulative error across all five interfaces determines the overall alignment error. The average alignment error was calculated as 6.8, and a conservative threshold of 3.0 was set for the final alignment error.
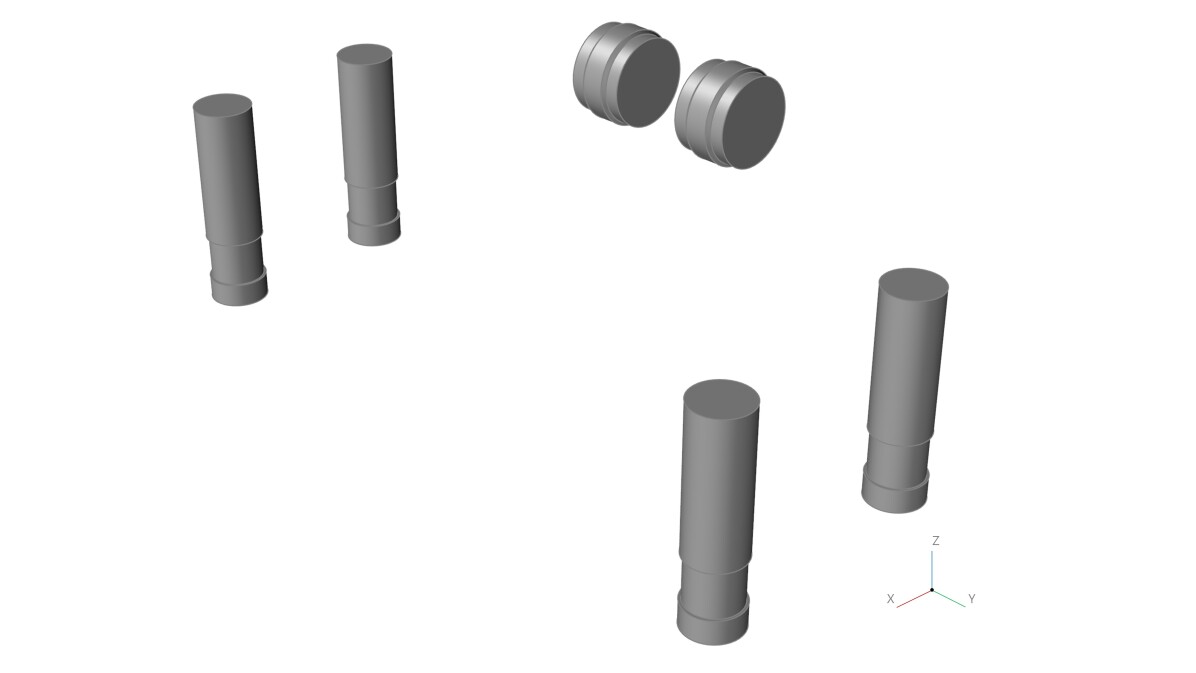
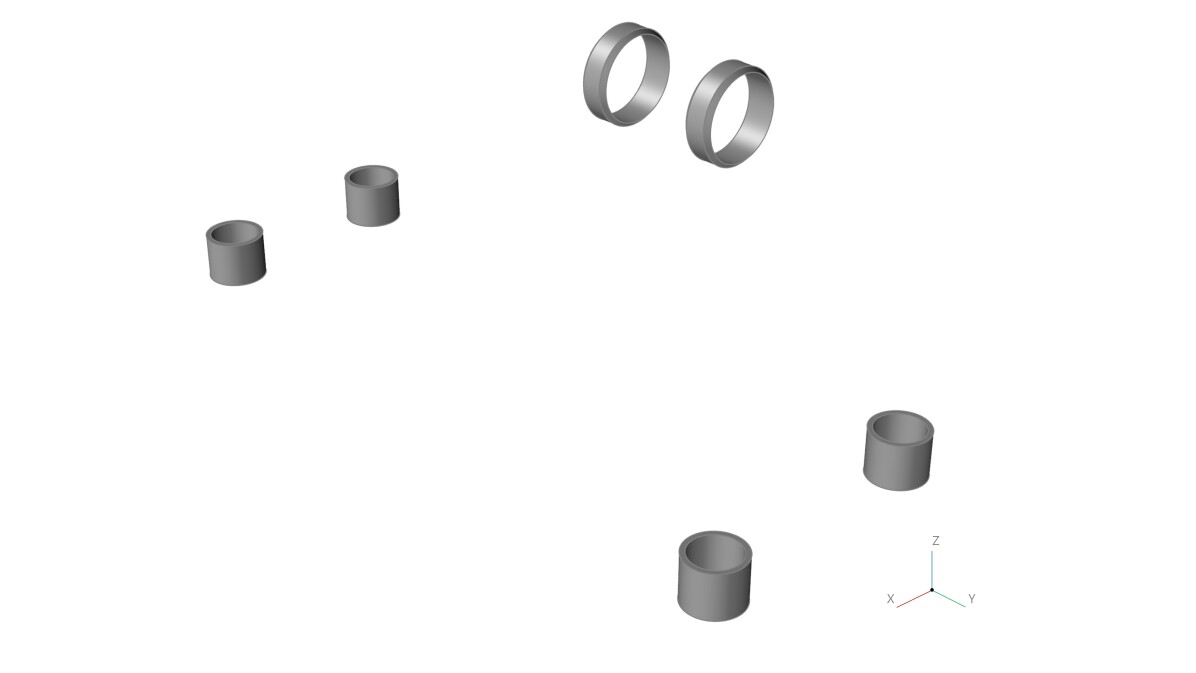
The selection process resulted in the removal of 118 samples. Examples of these removed samples are illustrated in Fig. 2. Consequently, 263 samples with well-aligned boundary conditions and stable geometries were selected as seed data. This selection process was carried out to ensure that the seed data used for generating new geometries were of high quality, thereby enhancing the reliability of the synthetic data generated in subsequent steps.
3.1.2 Data Generation Process
In this study, we adopted the implicit neural representation methodology. This approach is particularly practical in modeling complex data structures and projecting high-dimensional data into lower-dimensional spaces, which is essential for handling the intricate geometries and diverse topologies present in the baseline dataset. The primary objective of our data generation process is to augment the baseline dataset, which contains 263 bracket seed data samples after the selection process. Despite the reduction in the number of usable samples, meaningful data that maintain quality must be generated while enhancing the diversity and reliability of the dataset.
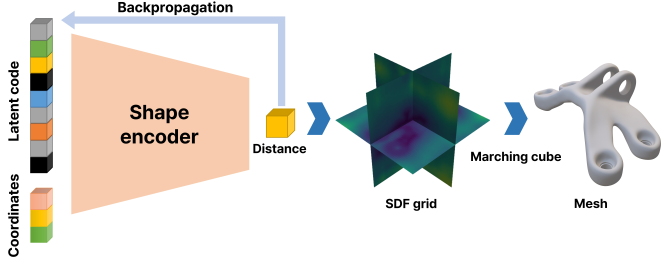
One of the significant challenges in this endeavor is constructing a meaningful latent space with the limited amount of data available. Methodologies that can learn complex patterns and perform compelling inferences from sparse data must be developed. This task requires approaches to maximize each data point’s utility and generate synthetic data that accurately represent the underlying distributions and variations in the original dataset. Accordingly, this study utilizes the implicit neural representation methodology, which introduces a new approach to handling high-dimensional data efficiently. This methodology provides a foundation for achieving high performance even with a limited dataset. An auto-decoder with a structure similar to that in Fig. 3 effectively learns features from a relatively small dataset and acquires meaningful latent spaces.
The methodology implementation steps include utilizing implicit neural representation to model the complex geometries of the jet engine brackets. This representation efficiently handles high-dimensional data and provides a scalable solution for data augmentation. The next step is constructing a latent space that captures the bracket design’s essential features and variations. The latent space must be robust enough to facilitate the generation of diverse and meaningful synthetic data. Finally, the implicit neural representation methodology are applied to the selected seed data to generate new bracket designs. The generated data is then validated to ensure they meet our study’s quality and diversity criteria. After the data generation process, we obtained 4833 synthetic bracket designs.
3.1.3 Synthetic Data Shape Filtering
The DeepJEB dataset comprises synthetic data generated from various topologies and geometric variations. Given the complexity and variety of shapes in the dataset, some generated geometries may exhibit irregularities, such as tears or disconnected regions. Although these issues are a trade-off for achieving high diversity from a limited initial dataset, they necessitate a rigorous filtering process to ensure the dataset’s practical usability. The filtering process is essential to eliminate synthetic geometries that are torn or disconnected, which are unsuitable for practical applications. The integrity and quality of these shapes must be ensured to maintain the dataset’s reliability and effectiveness in the subsequent analyses and applications.
Various mesh quality metrics were reviewed to identify the best metric for evaluating the quality of the generated meshes. The minimum Jacobian determinant (min jac) metric was selected through experimental evaluations. The min jac metric was used to assess the collapse degree of each mesh element, providing a robust indicator of geometric abnormalities. High min jac values corresponded to stable and well-formed meshes, while low values indicated potential issues, such as element collapse or geometric inconsistencies. The synthetic data were initially defined in the SDF field and then converted to a surface mesh using the marching cubes algorithm [60]. Despite the potential for high geometric fidelity in the generated data, some meshes may suffer from poor quality in terms of angles and connectivity.
The filtering process involves several steps to ensure the quality of the generated meshes. First, the synthetic data are converted from the SDF field to surface meshes by using the marching cubes algorithm. This algorithm reconstructs surface meshes that can be evaluated for geometric fidelity. Next, the quality of each generated mesh is assessed using the min jac metric. This metric evaluates the geometric integrity of the mesh, focusing on detecting abnormal shapes that may not be suitable for simulation or practical use. A threshold for the min jac metric is implemented to filter out substandard geometries. Meshes that do not meet the quality standards defined by the min jac metric are excluded from the dataset.
The min jac metric is crucial for the filtering process as it directly evaluates the geometric quality of the mesh. Unlike other metrics that may focus on mesh quality in terms of aspect ratios or element sizes, min jac specifically targets geometric stability and connectivity, which are vital for ensuring the dataset’s practical usability. We ensure that only high-quality, well-formed geometries are included in the DeepJEB dataset by filtering out meshes that fail to meet the min jac threshold. This process enhances the dataset’s reliability and applicability.
The synthetic data shape filtering process filtered out 2096 data points, resulting in a final set of 2737 well-formed bracket designs.
3.2 Automated Engineering Simulation pipeline
The DeepJEB dataset creation process involves establishing a fully automated FEM simulation process using the filtered synthetic 3D bracket geometries, such as FEM input geometries. This process is built using Altair Inspire and SimLab [61, 62] to create an automated FEM simulation pipeline designed to effectively label engineering performance data.
The mesh specifications play a pivotal role in ensuring the accuracy and reliability of the simulation results. The mesh used in the simulations consists of second-order tetrahedral elements. Each second-order tetrahedral element includes additional mid-nodes, resulting in 10 calculation points per element. This mechanism enhances the accuracy of stress analysis by providing more detailed and precise stress distribution within each element, although it increases the computational time. The average element size is set to 2 mm, which balances computational efficiency and the accuracy of the simulation results. The bracket material is set as Ti–6Al–4V, known for its specific properties: an elastic modulus () of 113.8 GPa, a Poisson’s ratio () of 0.342, and a density () of g/mm³.
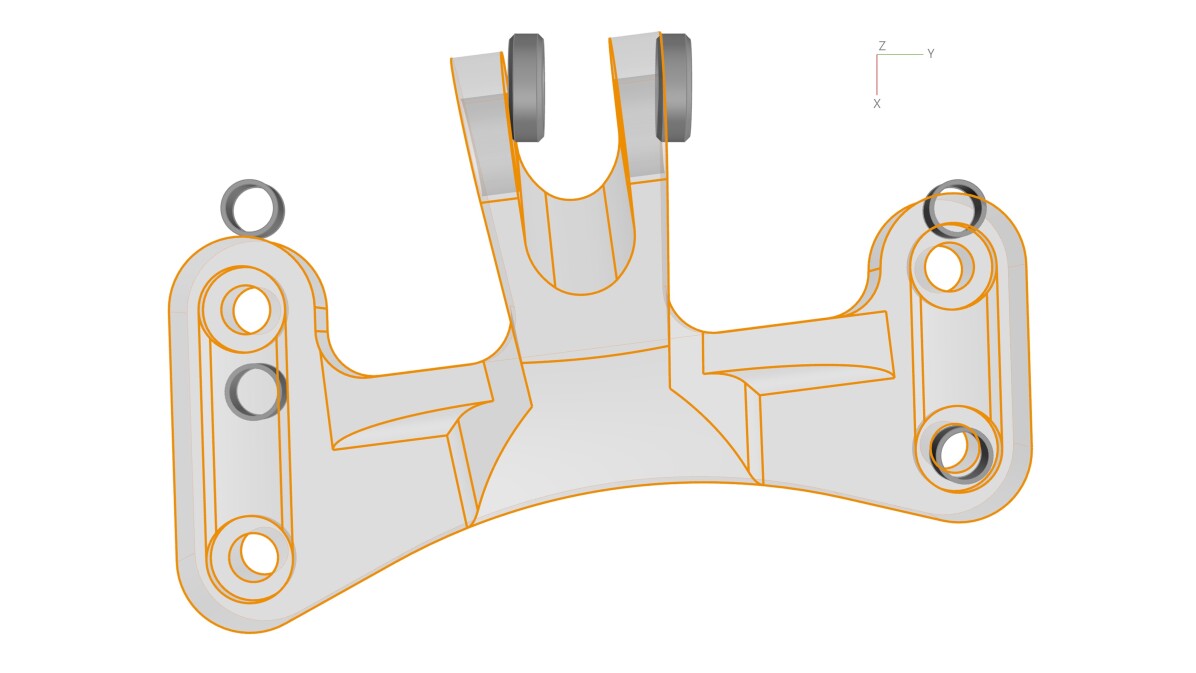
The synthetic 3D bracket geometries and surface mesh data generated using the marching cubes algorithm are smoothed using the PolyNURBS technique in Altair Inspire. This process converts polygonal surfaces into non-uniform rational b-splines (NURBS), making them solid bodies suitable for FEM simulations. However, this conversion can introduce geometric anomalies, especially at the boundary regions. Boundary cleanup geometries (Fig. 4(a)) around the boundary areas are used to clean up the boundary regions of the solid geometry through geometric operations to mitigate these issues. This approach ensures that the boundary conditions are well-defined and consistent across all samples, which is crucial for the accuracy and reliability of the FEM simulations. The synthetic 3D geometries are non-parametric, making defining boundary conditions based on parametric surfaces challenging. This challenge is addressed by combining the synthesized 3D geometry with predefined boundary condition geometry, as shown in Fig. 4(b), through geometric operations, resulting in a well-defined FEM model.
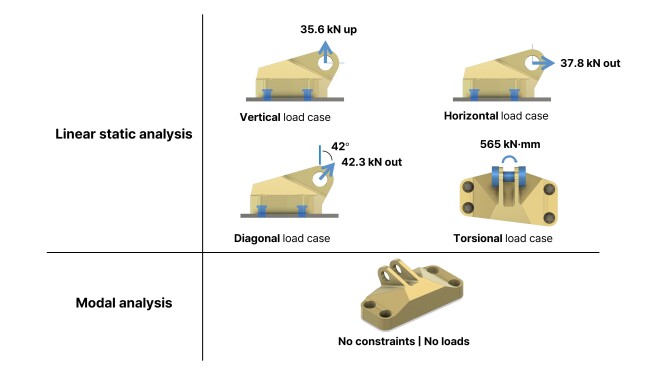
Figure 5 illustrates the load conditions used in the simulation, adhering to the structural considerations defined by the GE jet engine bracket CAD challenge. The simulation performs linear static load cases and free–free condition (no constraints or loads) modal analysis. Various loads are applied for the linear static load cases: a vertical load of 35.6 kN applied along the axis, a horizontal load of 37.8 kN applied along the axis, a diagonal load of 42.3 kN applied 42° from the vertical direction, and a torsional load of 565 kN·mm applied along the axis. In these cases, nodes in the bolted interfaces are fixed using RBE2s, and nodes in the loaded interface receive distributed loads via RBE3s.
Modal analysis is also performed under free–free conditions to evaluate the natural frequencies and mode shapes through eigenvalue analysis. This analysis helps in understanding the dynamic behavior of the bracket designs, which can be used to evaluate their reliability and performance under varying operational conditions.
3.3 FEA Simulation Results
The execution of the FEM simulations for each defined load case involves extracting various scalar and field results, which are critical for understanding the structural behavior and performance of the synthetic bracket designs.
The FEM simulations are executed to gather an extensive range of data. Scalar results, which include body properties, such as mass, volume, and the center of gravity, are extracted. Key performance indicators, such as maximum displacement and maximum von Mises stress values are also recorded as scalar results. These scalar values provide a concise summary of the overall structural performance of each bracket design under the applied load conditions.
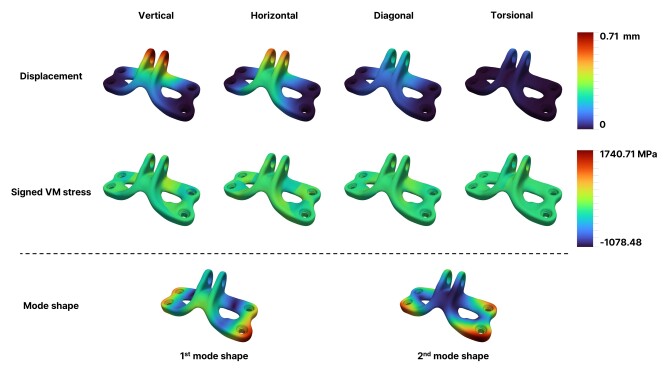
Figure 6 presents the simulation results, offering an in-depth view of the structural response by recording displacement and von Mises stress at every mesh node during linear static analyses. These detailed data demonstrate how different bracket parts react to various loads. Signed von Mises stress is used to indicate the directionality of the stress to provide additional insights, distinguishing between tensile and compressive states within the structure. These directional stress data are crucial for identifying potential failure points and understanding the distribution of stresses throughout the bracket.
In the modal analysis, natural frequencies are extracted as scalar results, while mode shapes are recorded as field results (Fig. 6). These results can be used to evaluate the dynamic behavior of the bracket designs. The natural frequencies measure the bracket’s inherent vibrational characteristics, while the mode shapes illustrate how different parts of the bracket deform under these conditions. The analysis explicitly excludes the six rigid body modes, focusing instead on extracting the first and second normal modes.
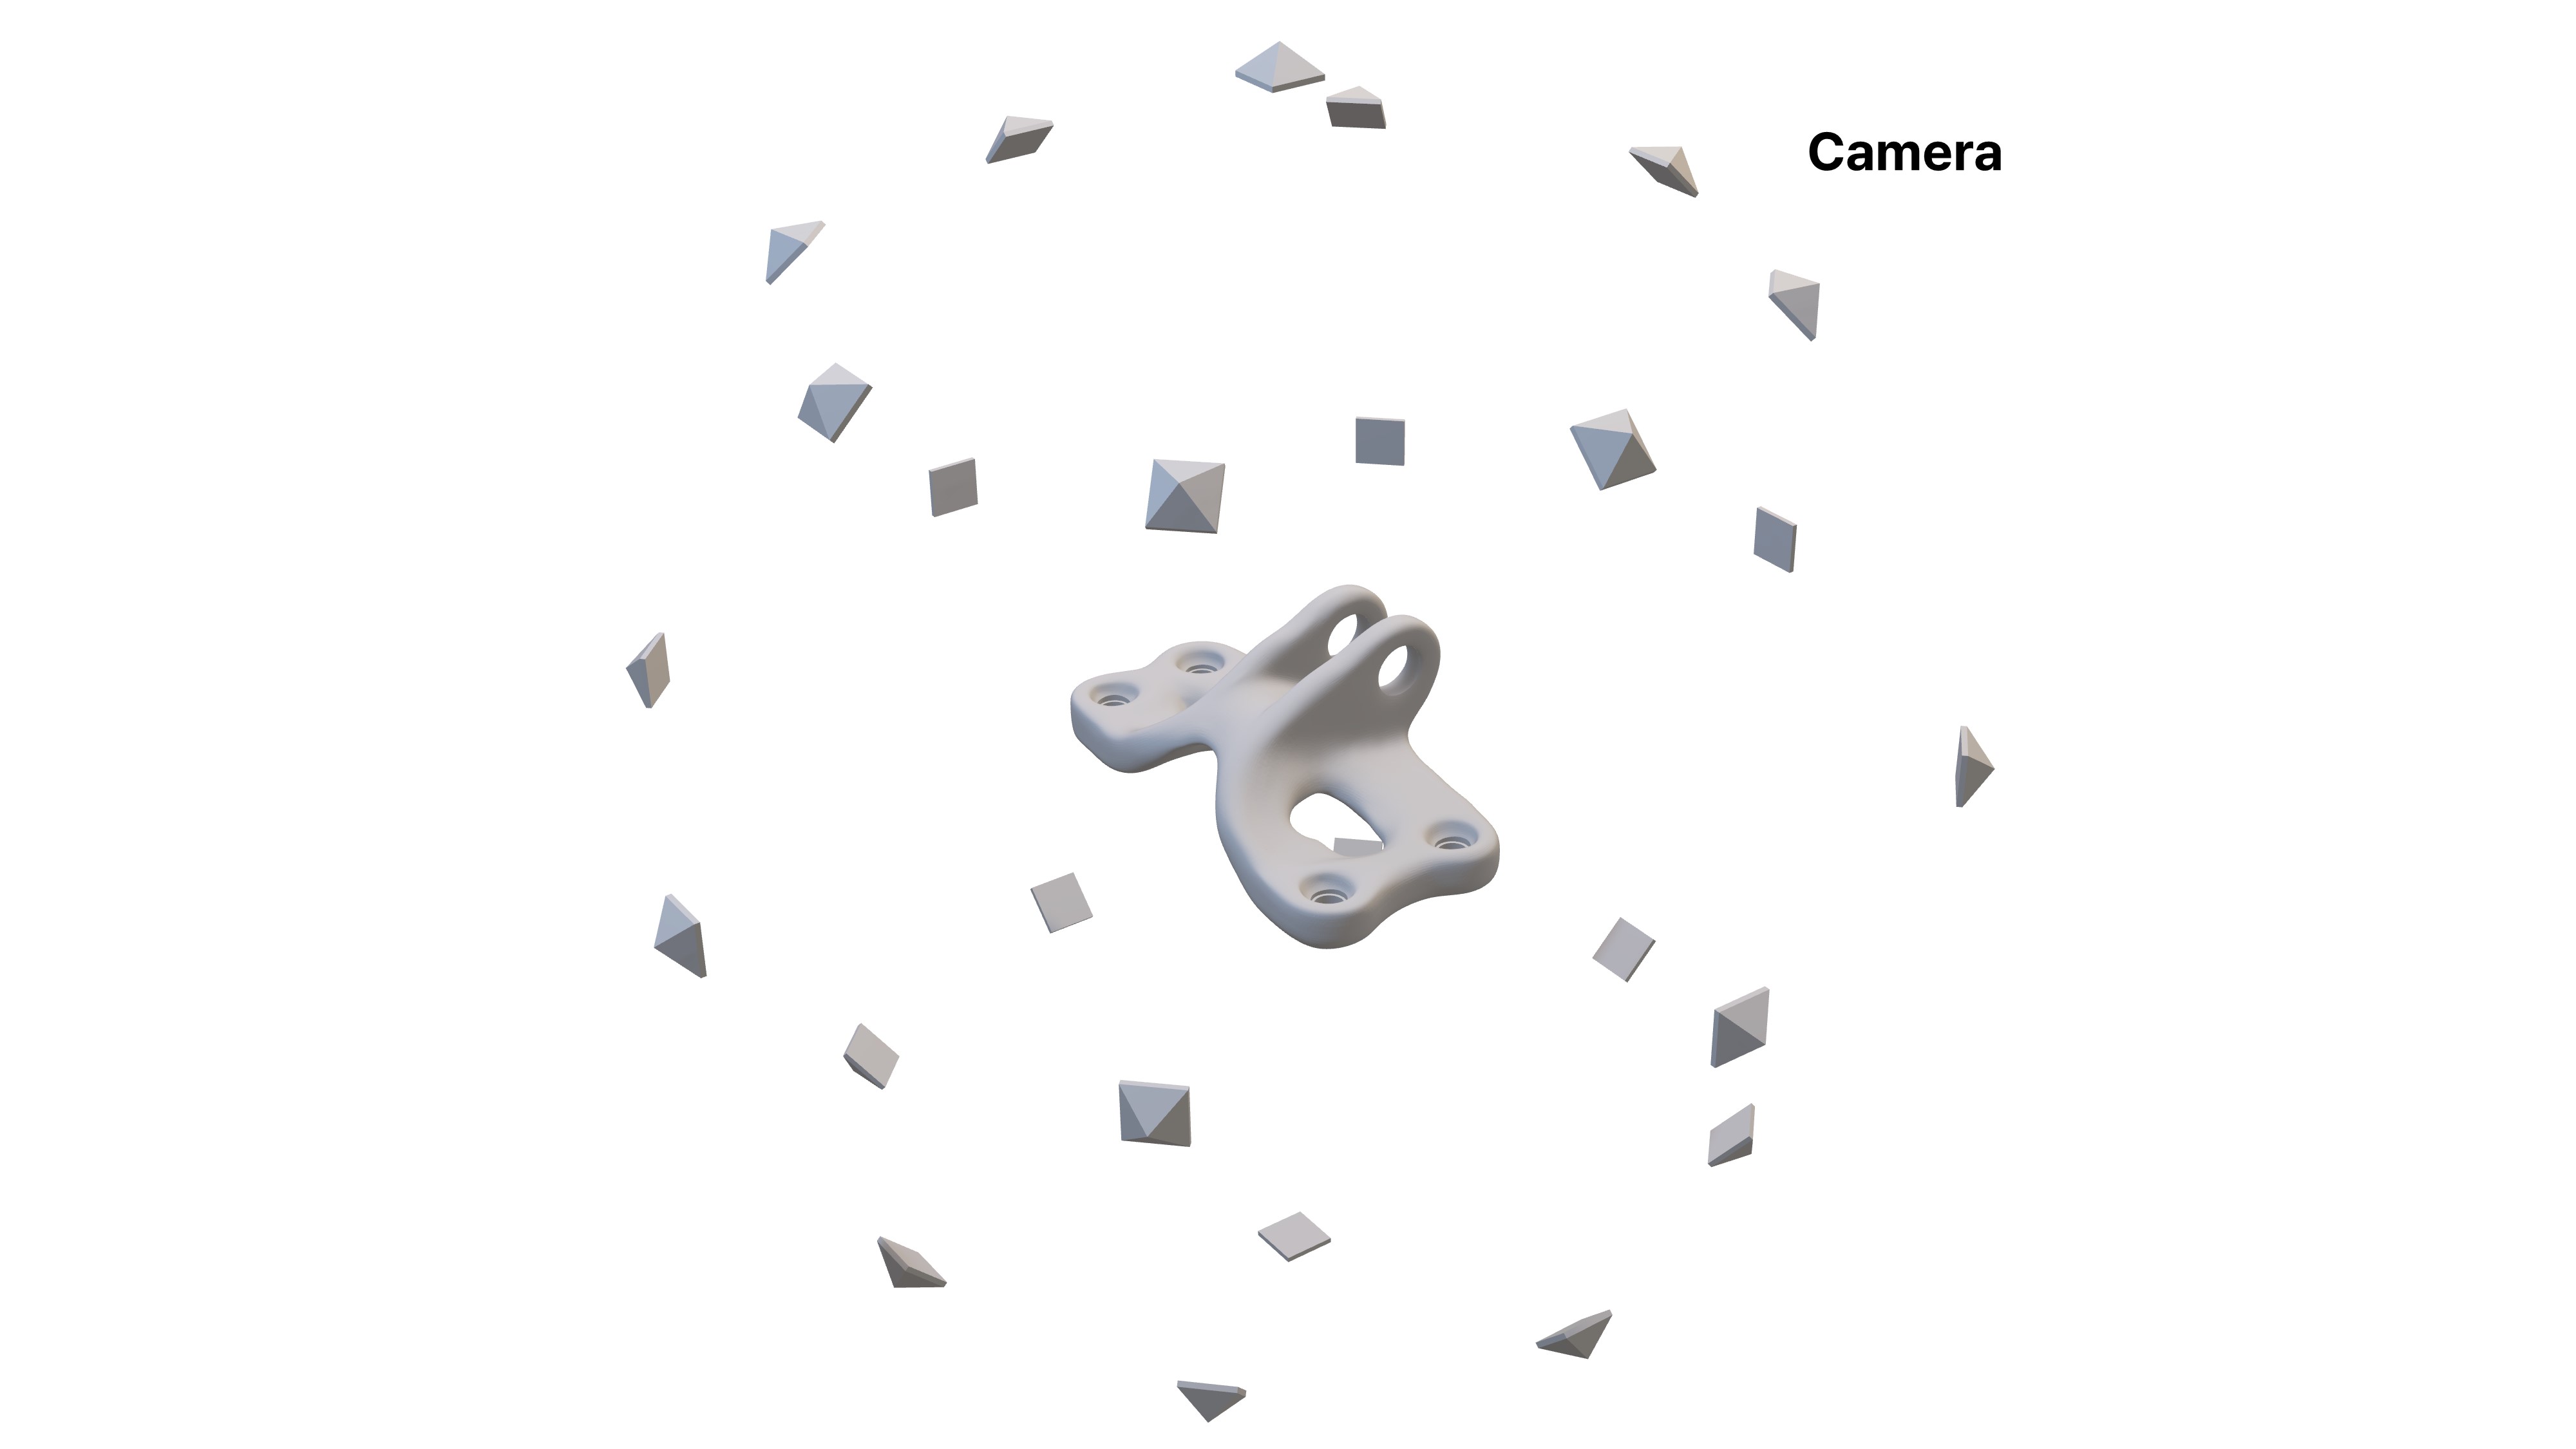
We provide multi-view images that can be applied to multi-view models to contribute to the current interest in the 3D graphics domain. Virtual cameras were positioned at 8 azimuth angles (0°, 45°, 90°, …, 315°) and 3 elevation angles (45°, 0°, -45°), maintaining a consistent distance from the model center. Additional views were captured from the top and bottom to ensure comprehensive coverage. The images were rendered with consistent lighting settings to ensure uniformity across all views. This process is illustrated in Figure 7, which shows the bracket model surrounded by the camera positions used to generate the dataset. These images are an effective alternative to 3D representations, providing a simplified yet comprehensive perspective of the 3D structure. Consequently, the multi-view images can be valuable tools for constructing efficient surrogate models.
The comprehensive data extracted from these FEM simulations indicate that the DeepJEB dataset is robust and detailed, providing insights into the structural behavior of the synthetic bracket designs. These data can serve as the foundation for developing and validating advanced data-driven models in structural analysis.
4 Dataset Validation
The validation of the DeepJEB dataset is essential to ensure its reliability and comprehensiveness as benchmark data for data-driven models. This section details the steps to validate the dataset, including statistical evaluation, outlier removal, geometric quality assessment, and performance space sampling. The applied methodologies are designed to ensure that the DeepJEB dataset meets the high standards for data-driven surrogate modeling.
4.1 Quality Assurance
Performance Data Verification
The performance data verification of the DeepJEB dataset is a critical step in ensuring the dataset’s reliability and comprehensiveness for engineering applications. High-quality performance data are crucial for developing accurate data-driven surrogate models, as these data serve as the ground truth labels for input data. Outliers or errors within this data can significantly degrade model performance and reliability, emphasizing the importance of ensuring accurate and clean data.
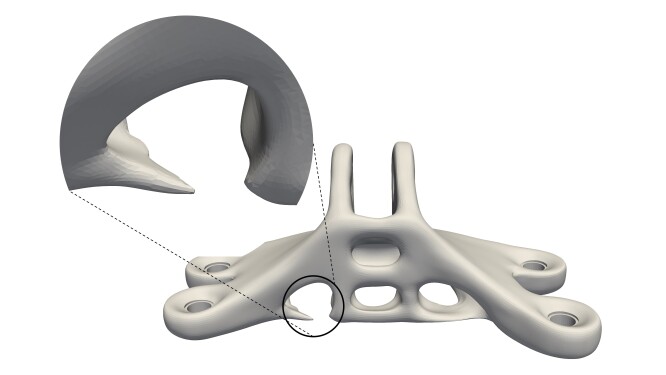
Performance data may contain outliers due to issues during the automated simulation process, such as mesh quality problems and geometric operation errors. Figure 8 shows that interpolation artifacts in the synthetic data can result in irregularities in the shape, resulting in unintended discontinuities during numerical simulations. The detection of these errors within automated simulation processes is limited, necessitating the removal of outliers to correct the data. A thorough statistical evaluation of the simulation results is conducted to identify and remove these outliers, ensuring the dataset’s reliability.
Balancing geometric diversity while ensuring the reliability of simulation results is essential. This task involves ignoring outliers related to geometric diversity and focusing on outliers in simulation metrics, such as displacement, stress, and natural frequencies. Identifying and removing outliers in these simulation metrics ensures that the dataset remains accurate and reliable while preserving the necessary geometric diversity.
The interquartile range (IQR) method is utilized to detect outliers in performance data. Given the need to preserve geometric diversity, a conservative sensitivity of 3 is used for IQR, corresponding to approximately ±4.72 standard deviations under the assumption of a normal distribution, 0.00024% of the data fall outside this range. Lower and upper bounds are calculated using the IQR method (Eq. (2) and (3)), to detect and remove outliers in displacement, stress, and natural frequency data. These equations represent the lower and upper bounds for identifying outliers. Samples identified as outliers based on these criteria are removed.
| IQR | ||||
| Lower Bound | (2) | |||
| Upper Bound | (3) |
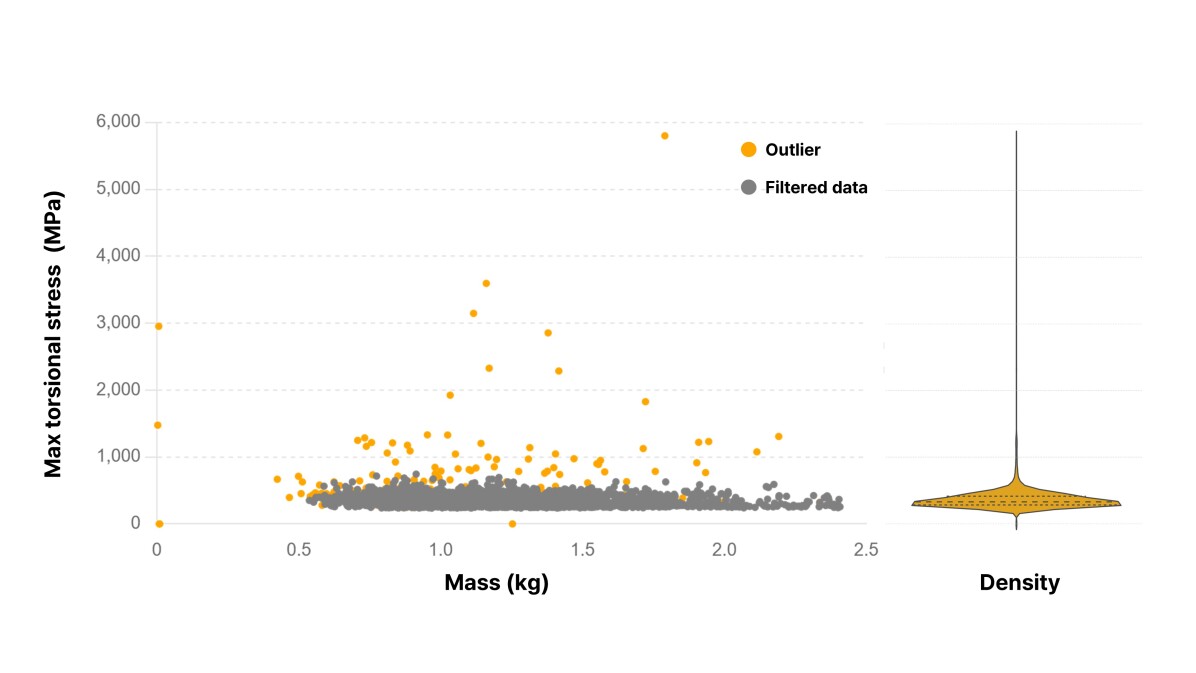
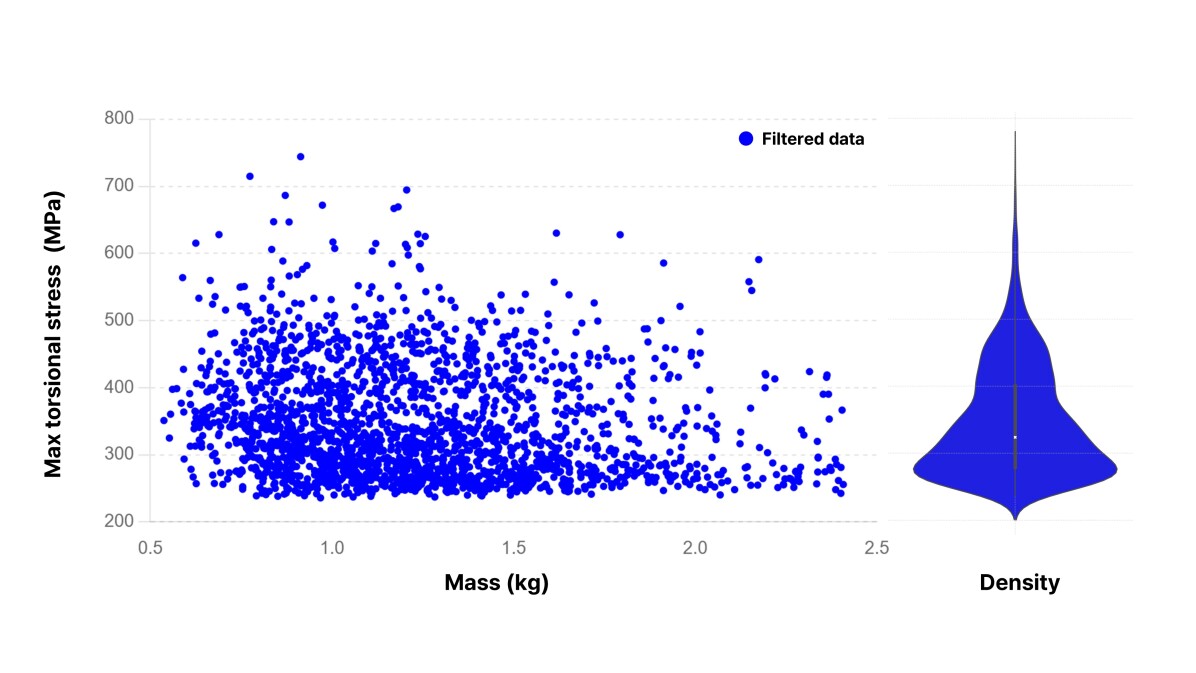
After applying the IQR method, 372 samples were identified as outliers and removed from the dataset. This process ensured that the remaining data were of high quality and suitable for reliable surrogate model training. Figure 9(a) illustrates the initial dataset’s scatter and violin plots, showing a long tail in the distribution of maximum torsional stress results due to outliers. After filtering, the DeepJEB dataset (Fig. 9(b)) displayed a uniform distribution around the median values in the scatter and violin plots, indicating a balanced and reliable dataset.
Geometrical Feasibility
This validation ensures the dataset’s integrity and usability, confirming that the final dataset is free from geometric flaws, and the mesh quality is suitable for simulations. Several stages in the data generation process can introduce potential issues, necessitating thorough validation. Non-parametric synthesis with deep generative models can result in irregular shapes, while reconstructing 3D shapes from implicit functions can introduce errors. Smoothing and converting polygonal surfaces to NURBS may cause local geometric distortions, and Boolean operations for boundary conditions can result in complex geometric elements with local inconsistencies. Converting these geometries into volume finite element (FE) meshes can introduce geometric errors despite initial filtering.
The final 3D geometries in the DeepJEB dataset are converted into FE meshes and mapped to simulation results. Evaluation of the quality of these 3D FE meshes is essential to ensure their geometric integrity and suitability for accurate simulations. The evaluation follows industry standards for 3D mesh quality, such as those outlined in [63]. The aspect ratio is a key metric for assessing the quality of 3D mesh elements. An ideal aspect ratio is one, but the aspect ratio must be three or less for stress analysis. In our dataset, only approximately 0.42% of the mesh elements exceed this aspect ratio threshold, indicating high overall mesh quality. The quality evaluation results show that the DeepJEB dataset consists of 3D meshes with an average of 130,000 elements each. Despite the large number of elements, the low percentage exceeding the aspect ratio threshold demonstrates that most elements meet the quality criteria, maintaining a high standard of geometric quality.
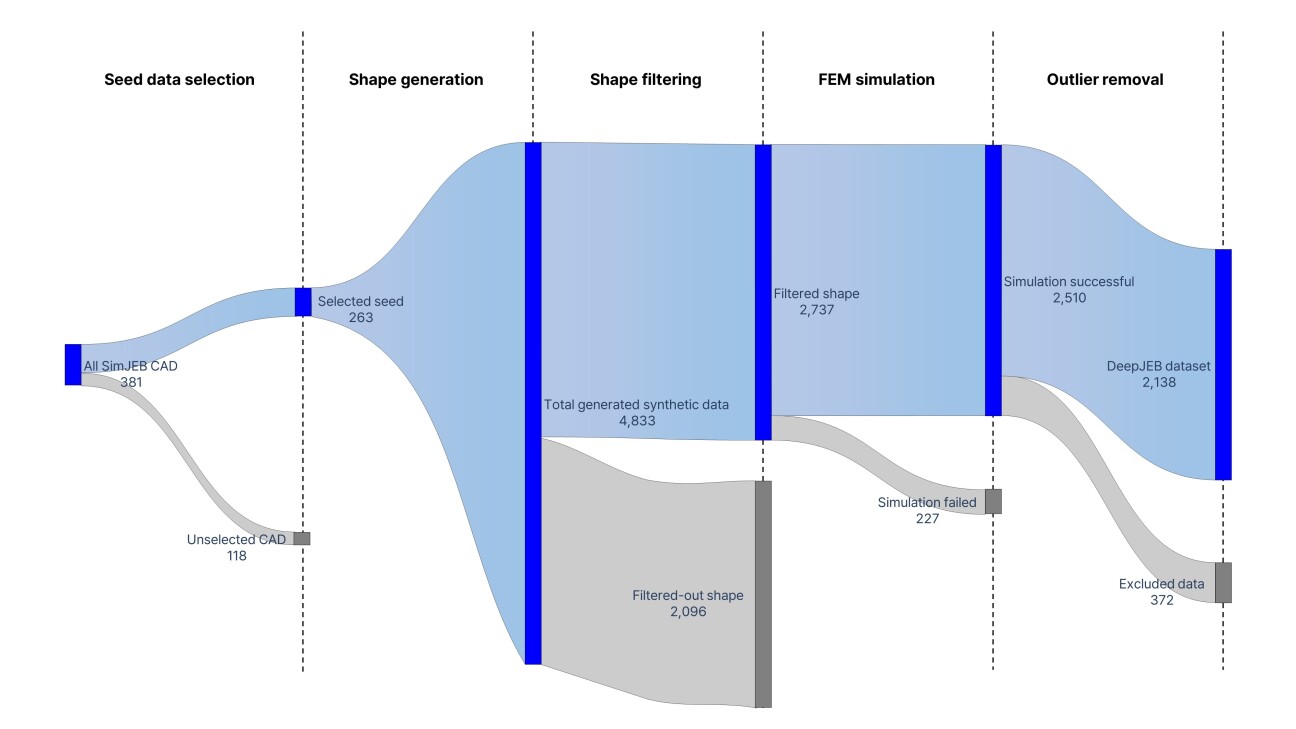
Figure 10 illustrates the workflow of data creation. After completing all filtering and validation processes, 2138 DeepJEB datasets were finalized.
Limitations
Despite using second-order elements and more accurate algorithms, FEM-derived performance data can still be potentially inaccurate. A common issue is the inaccuracy of stress results, particularly in stress concentration areas. Although controlling this issue in an automated simulation pipeline is challenging, mesh refinement in these areas can somewhat mitigate the issue. Additionally, even though the filtered samples enhance the reliability and stability of the data, they may not cover all possible designs that could emerge in the context of jet engine bracket interfaces. However, within the defined latent space, the dataset samples are densely populated and suitable for surrogate modeling of similar bracket designs.
4.2 Dataset Characteristics
Exploration of the Latent Space
In this study, data from the baseline dataset served as a starting point for training and generating the DeepJEB dataset. The initial baseline dataset comprised 381 samples, which were reduced to 263 after filtering for consistent boundary conditions. This filtering ensured that only samples with well-defined and consistent boundary conditions were retained, forming a reliable foundation for further data augmentation.
The DeepJEB dataset, augmented based on the 263 selected samples, was evaluated for its geometric diversity to ensure that it adequately represents a wide range of shapes. A beta-variational autoencoder (beta-VAE) was utilized as a dimensionality reduction model to visually assess the shape diversity visually. This model helps in understanding the distribution and diversity of the dataset by mapping high-dimensional data into a lower-dimensional space, making it easier to analyze and visualize.
The steps for diversity evaluation began with converting the mesh data into SDF grids with a resolution of 646464. This conversion provided a standardized representation of the 3D shapes, facilitating subsequent dimensionality reduction processes. The beta-VAE was then used to reduce the dimensionality of the mesh data, capturing the essential features and variations within the dataset. Further reduction was achieved using principal component analysis (PCA), which helped in simplifying the data to a manageable number of dimensions for visualization purposes. Finally, scatter plots were created using the first and second principal components to visualize the data distribution, allowing for a clear comparison of the geometric diversity between the baseline and the DeepJEB dataset.
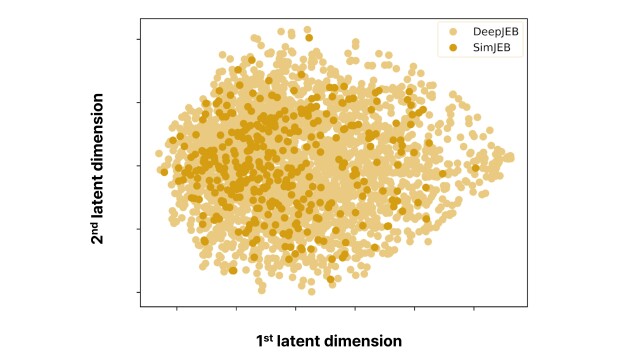
Figure 11 presents the scatter plot of the latent design space, comparing the 381 baseline data samples to the DeepJEB dataset. The DeepJEB dataset exhibited a broader and denser distribution than the baseline dataset, indicating enhanced geometric diversity. This broader distribution indicated that the DeepJEB dataset encompasses a wider variety of shapes and configurations, making it a more comprehensive resource for engineering applications.
The comparison between the baseline and the DeepJEB latent spaces demonstrates that the DeepJEB dataset offers greater geometric diversity and density. This increased diversity makes the DeepJEB dataset well-suited as a benchmark dataset in surrogate modeling and structural analysis applications. The enhanced geometric diversity ensures that the dataset can better represent the variability encountered in real-world scenarios, thereby improving the robustness and reliability of data-driven models developed using this dataset.
Testset Composition
Given the diverse geometric variations in the DeepJEB dataset, unsupervised clustering techniques are utilized to effectively classify and sample the latent space. These algorithms group unlabeled data samples based on their inherent shape similarities, ensuring a comprehensive latent space representation. Key features are extracted to manage the complexity of geometric data, and dimensionality is reduced using beta-VAE. This method preserves critical information while simplifying the data for clustering. The process begins by converting 3D shape data to SDF grids and then using beta-VAE for dimensionality reduction, which maintains essential geometric features.
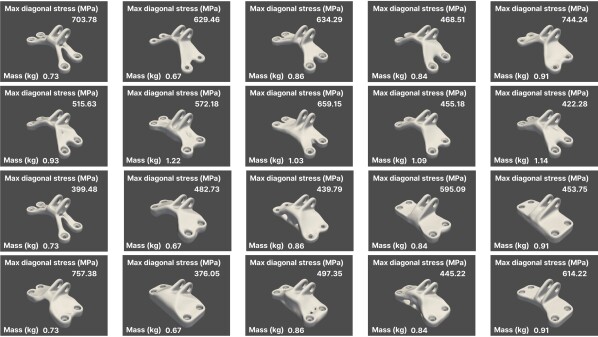
The reduced latent vectors are classified using k-means clustering. Silent scores and the elbow method are applied to determine the optimal number of clusters, resulting in 20. The steps involve determining the optimal number of clusters (k=20) using silhouette scores and the elbow method, followed by applying k-means to form 20 distinct clusters based on geometric features. Figure 12 presents sample geometries representing each of the 20 clusters and their corresponding performance metrics. Each cluster represents a unique segment of the latent space, and uniform sampling within these clusters ensures that all possible design variations are included in the test set. This process involves forming 20 clusters representing different design variations and using uniform sampling within each cluster to ensure comprehensive coverage of the design space.
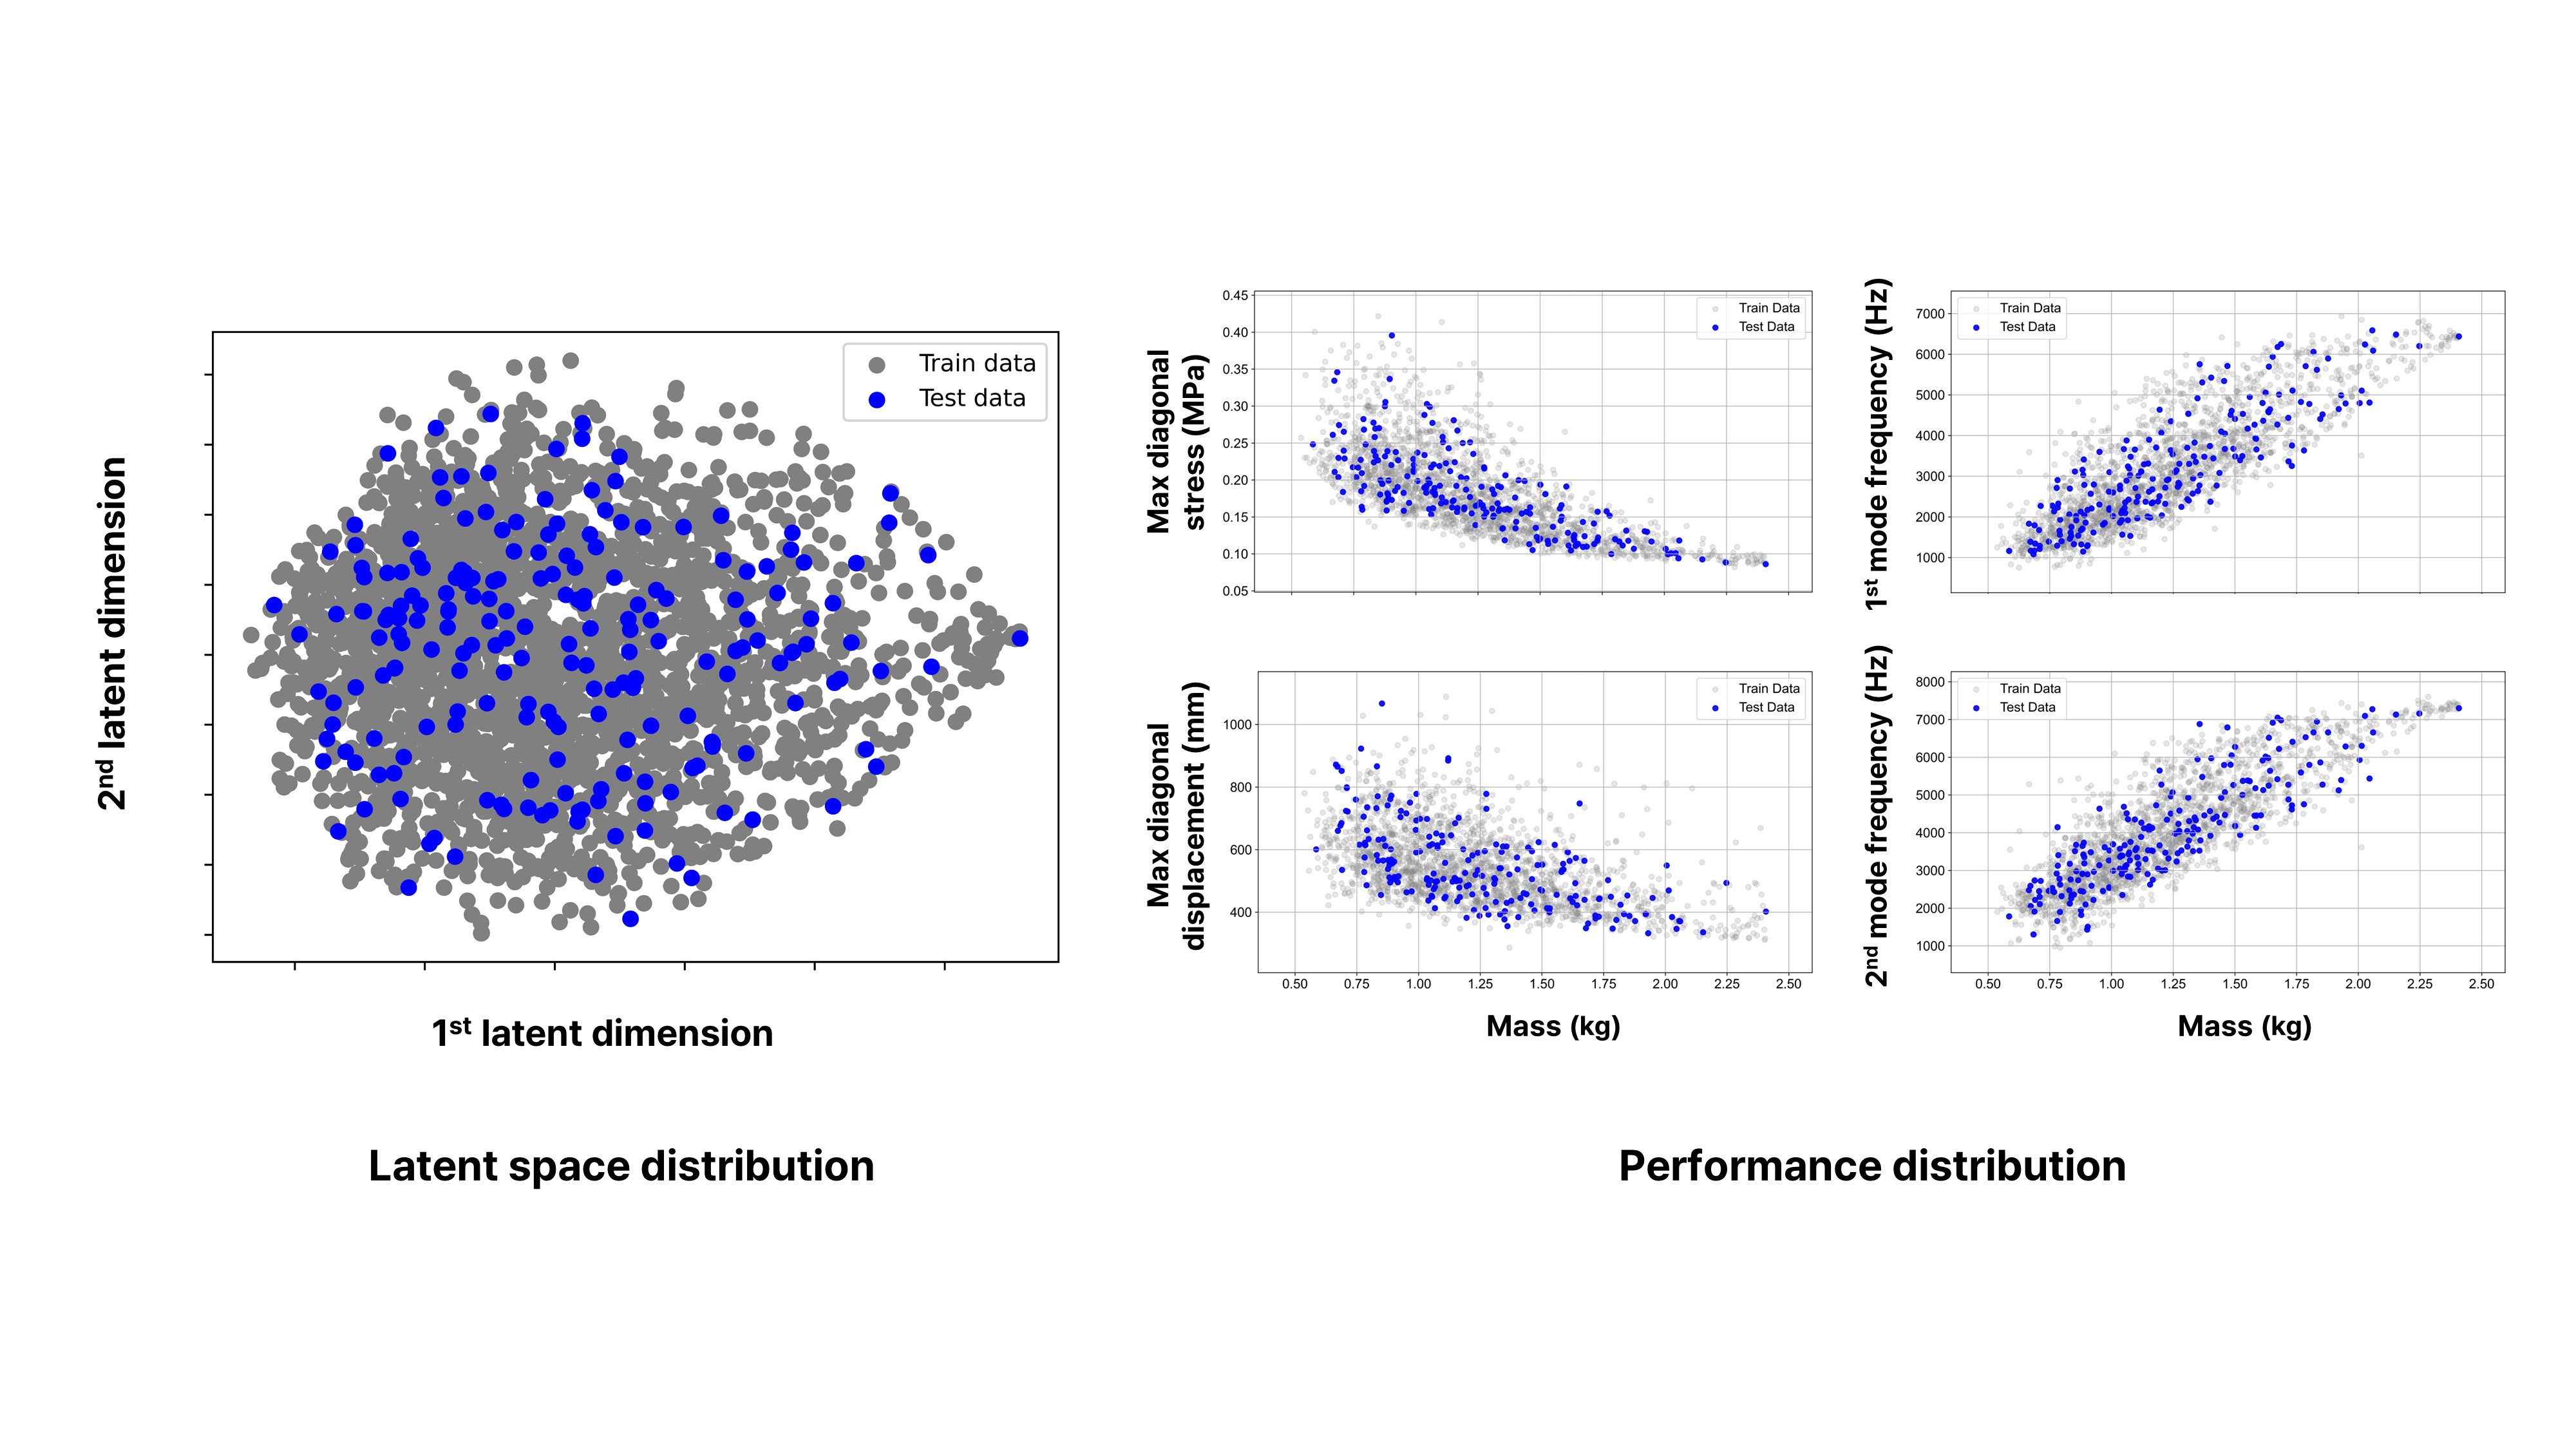
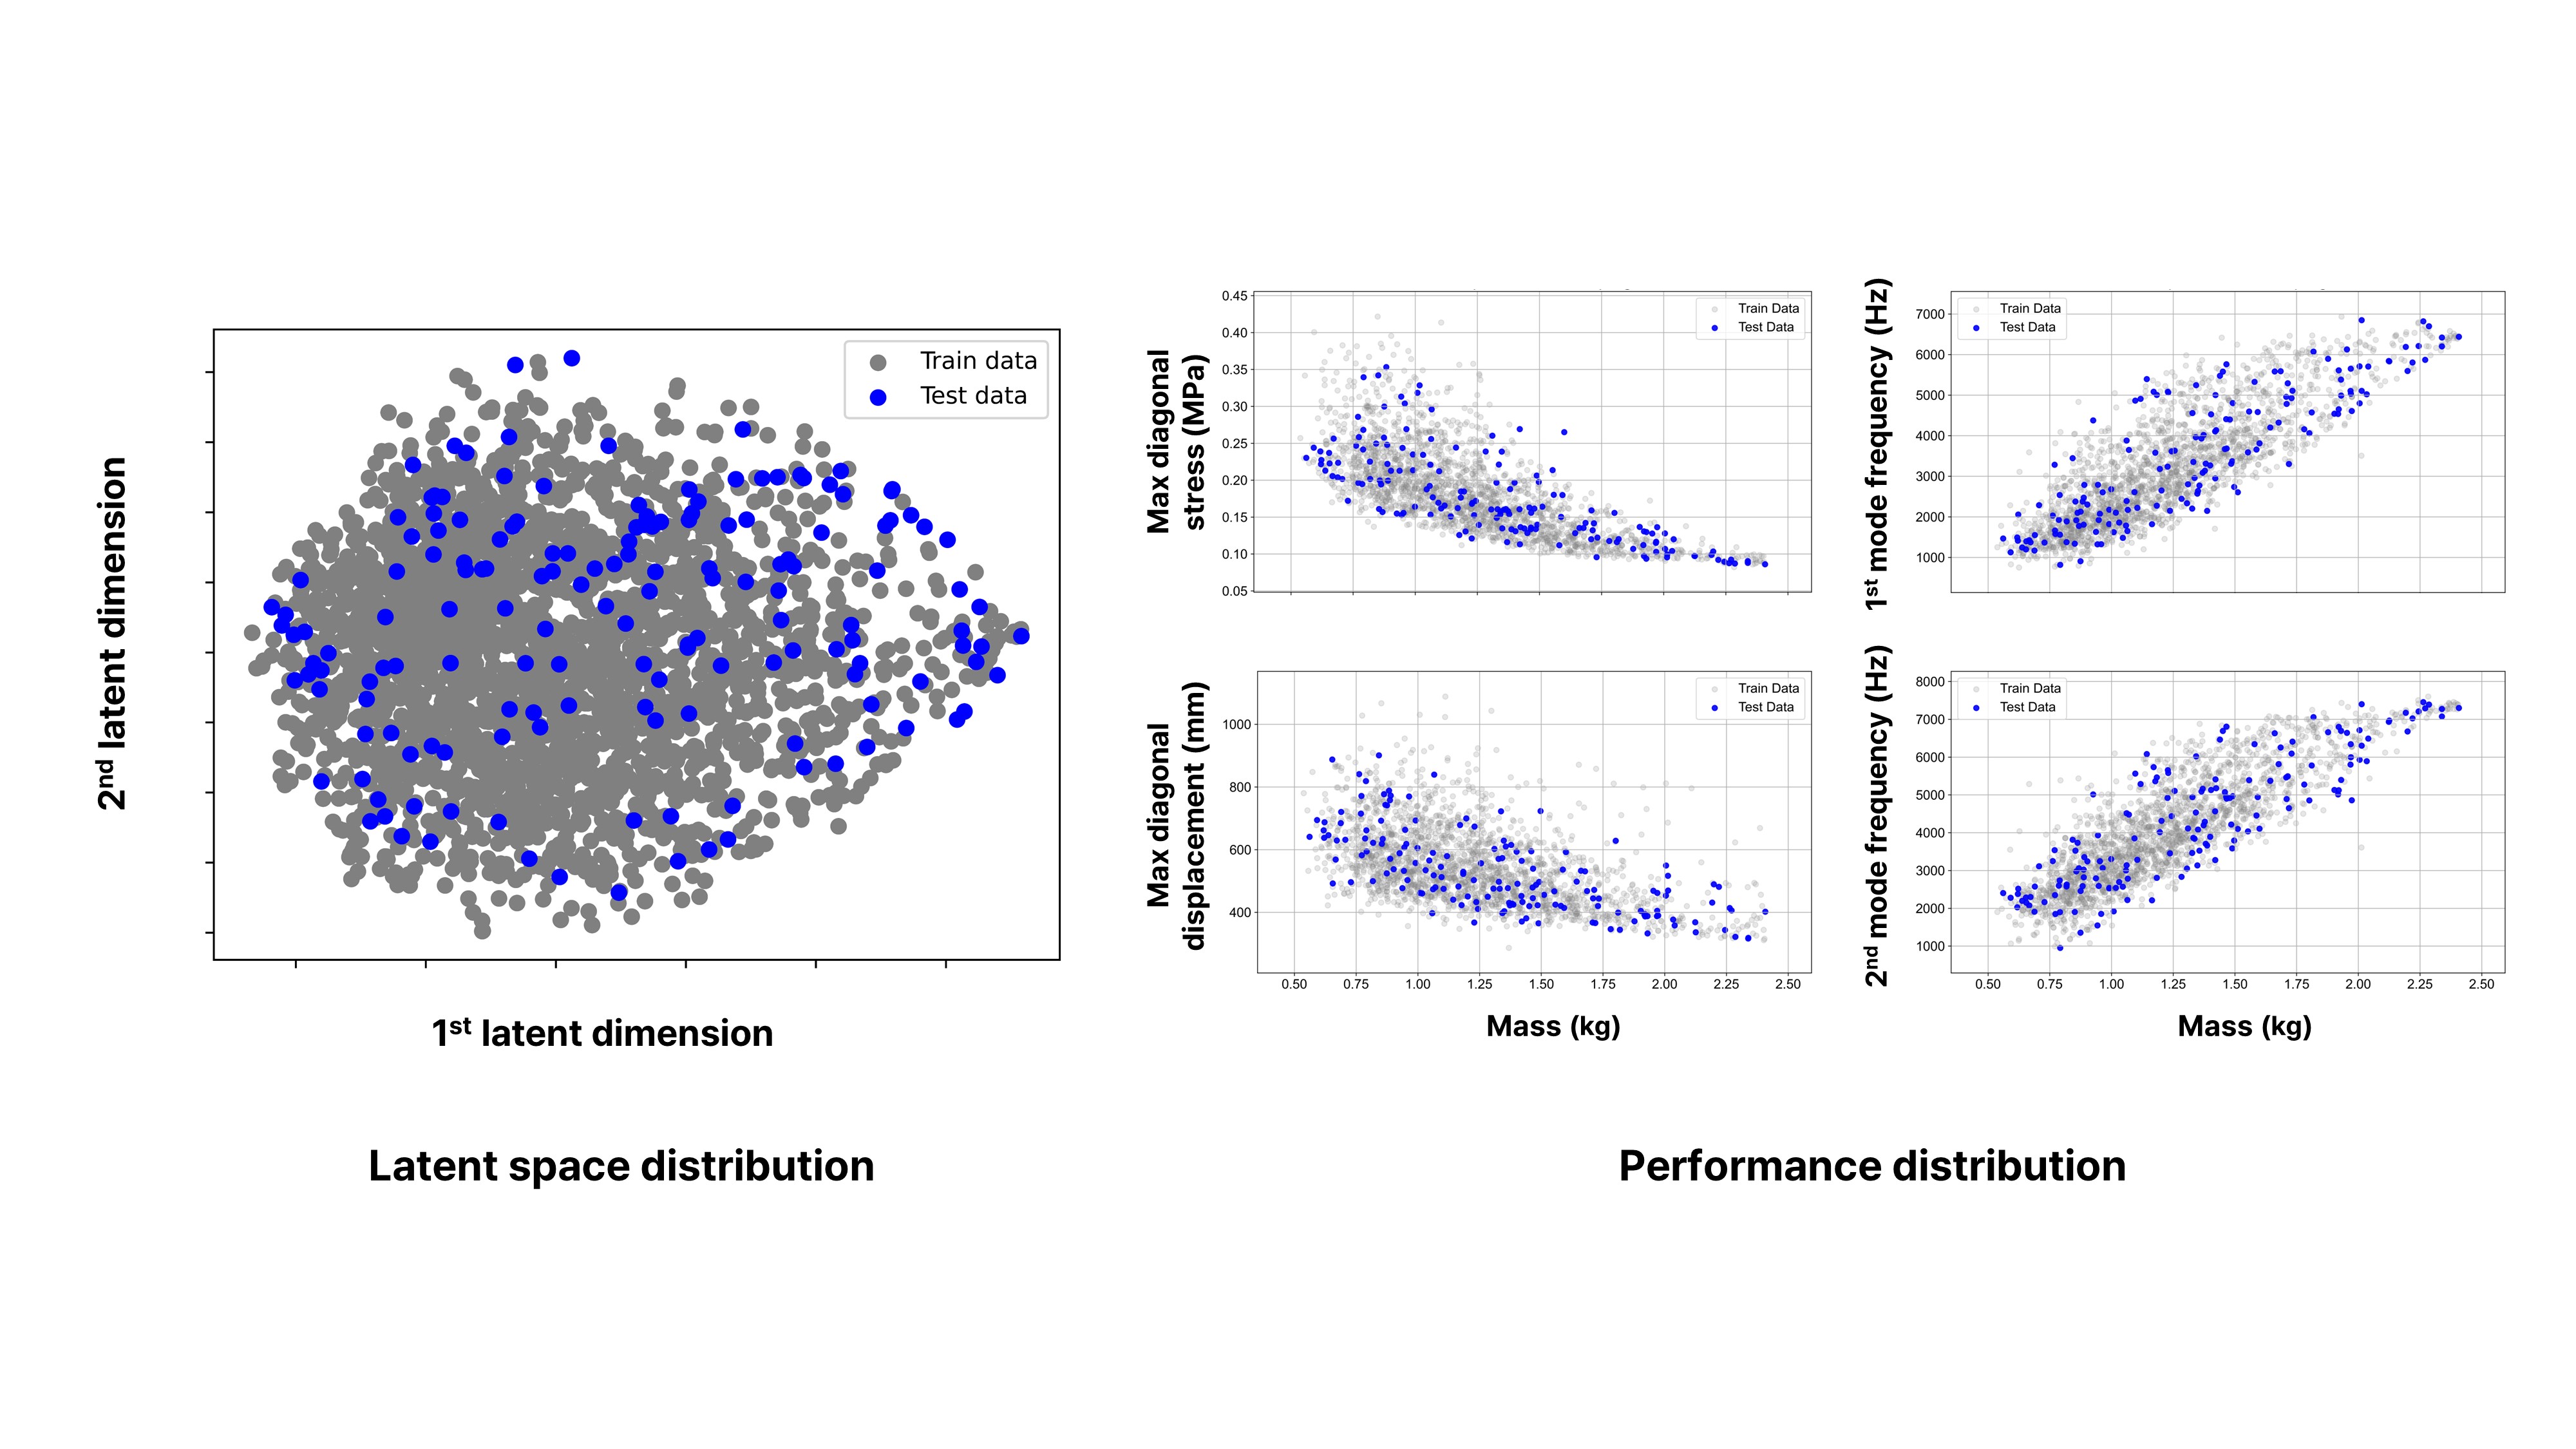
Unsupervised clustering and uniform sampling ensure that the test set of the DeepJEB dataset accurately represents the entire latent space. Figure 13(a) shows the latent space and performance distribution of the test set. This representation guarantees that all possible design variations are included, enhancing the reliability and applicability of surrogate models trained on this dataset.
Performance labels represent specific performance metrics for each design, such as maximum displacement, minimum–maximum stress, and natural frequency. These multi-dimensional performance data are reduced using PCA to manage the complexity and ensure a comprehensive representation. PCA captures the most significant variations in the performance data, simplifying it to principal components. The steps include identifying performance metrics, such as displacement, stress, and natural frequency, and applying PCA to reduce the dimensionality of the performance data, focusing on key components that capture the most variance.
Uniform sampling is applied within the reduced performance distribution to ensure that the performance space is comprehensively represented. This method ensures that the test set reflects all possible performance ranges, providing a robust basis for evaluating model performance. The process involves using PCA to create a reduced-dimensional performance distribution and applying uniform sampling to select representative performance combinations within this space.
The generated test set, derived from uniform sampling in the performance space, accurately represents the performance distribution (Fig. 13(b)). This test evaluates various performance scenarios, ensuring the model learns from diverse performance data and enhancing its generalization capabilities.
The test sets are provided in JSON format, including metadata for each 3D model’s name. This format enhances accessibility and compatibility, making it easy to use across various systems and software.
5 Case Study: Surrogate modeling of Structural Performance
In this section, we delve into the practical application of the DeepJEB dataset for developing surrogate models to predict structural performance. We illustrate the dataset’s utility through a comparative analysis with the baseline dataset, highlight the benefits of using synthetic data, and validate model performance using a uniformly sampled test set in latent and performance spaces.
5.1 Surrogate Model Construction
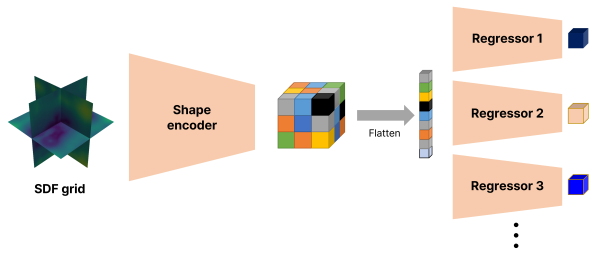
The surrogate model consists of an encoder that compresses the shape data and a regressor that predicts performance metrics based on the compressed shape features. The model’s architecture was designed to assess the performance diversity and validity of the DeepJEB dataset by training it under the same conditions as those used for the baseline dataset. As shown in Fig. 14, the surrogate model comprises a shape-encoding encoder and a set of regressors that predict individual performances. The shape encoder receives the SDFs of the preprocessed individual shapes in a grid format and processes them through 3D convolutional layers for learning. The number of regressors corresponds to the number of performances to be predicted, all of which take latent codes compressed by the shape encoder as input. The regressors utilize a simple multi-layer perceptron consisting of linear layers and rectified linear unit functions. The model is trained to predict vertical, horizontal, diagonal, and torsional maximum displacements using these labels to evaluate its accuracy and reliability.
We utilize the deep ensemble methodology [64] with negative log-likelihood (NLL) loss to quantify prediction uncertainty. This approach provides a robust measure of uncertainty, which is crucial for assessing the reliability of surrogate models. The methodology involved combining multiple models to improve prediction robustness and using NLL loss to quantify prediction uncertainty.
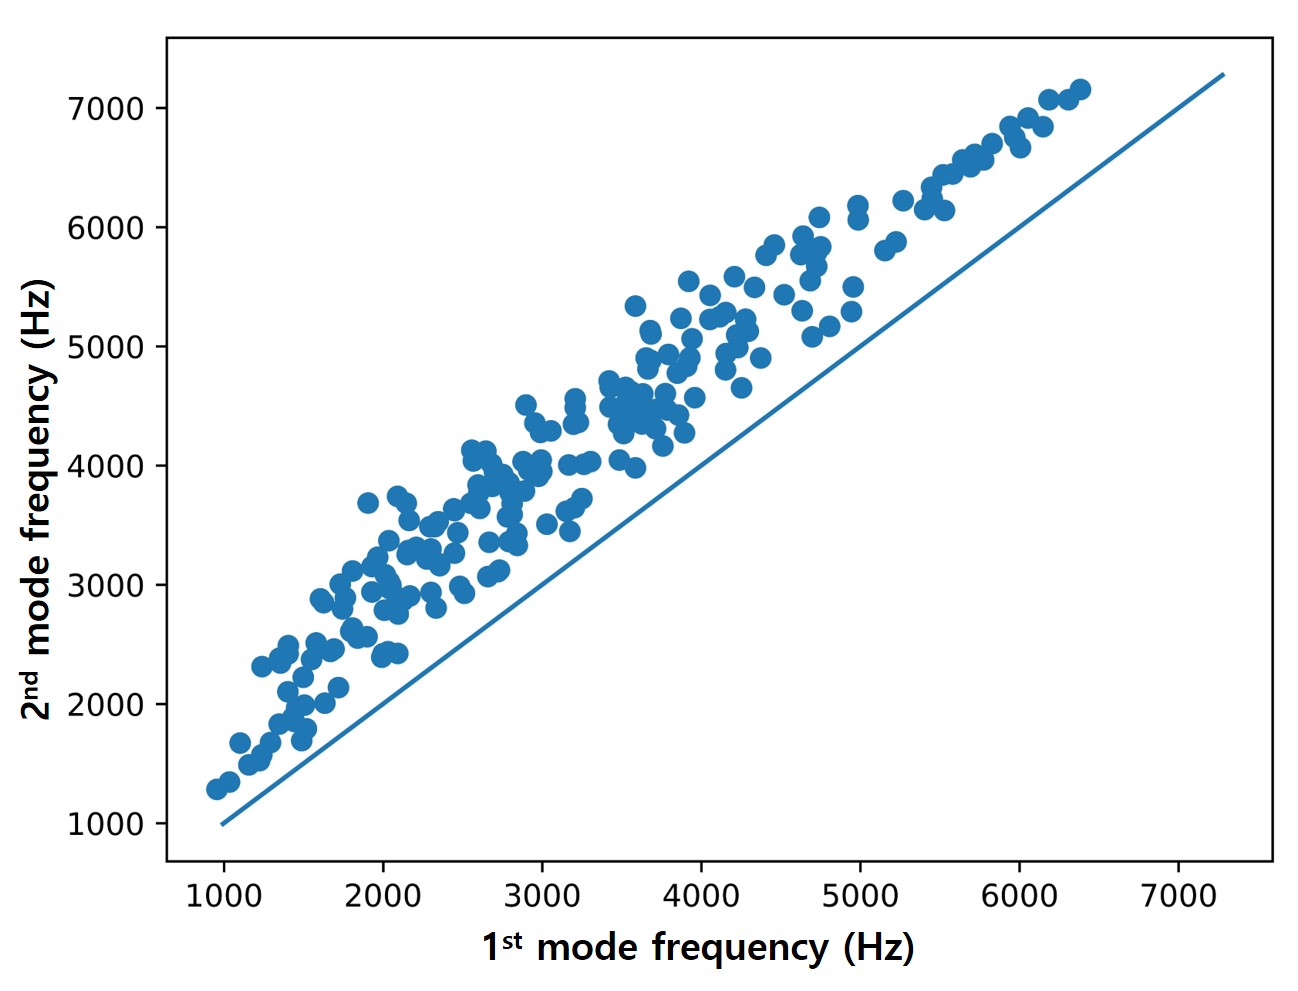
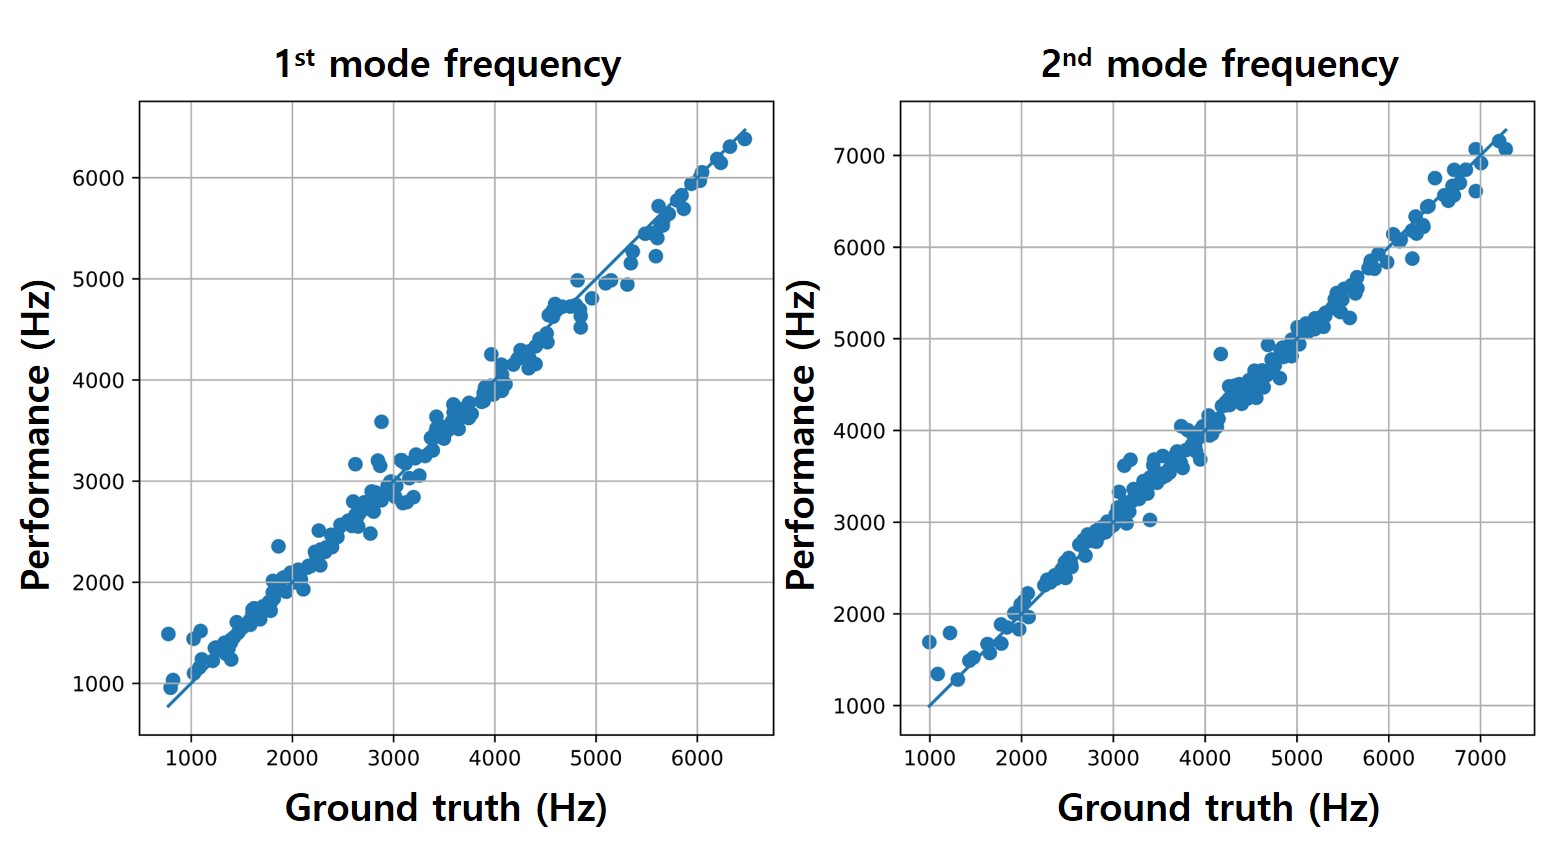
Furthermore, we evaluated the surrogate model’s performance in predicting the first and second mode frequencies provided by DeepJEB. The characteristic that the second mode frequency is always more significant than the first mode frequency was used to validate the model’s understanding of domain-specific information. Key observations included the surrogate model’s ability to predict first and second mode frequencies and the reflection of domain-specific characteristics in the model’s predictions. We conducted experiments with DeepJEB, dividing the dataset into training, validation, and test sets in an 8:1:1 ratio. DeepJEB demonstrated high accuracy, successfully learning the overall trends (Fig. 16). Table 2 shows quantitative confirmation of this high accuracy. Furthermore, DeepJEB effectively learned the domain-specific knowledge that the first mode frequency should be lower than the second mode frequency (Fig. 15). This mechanism validated the model’s capability to incorporate and reflect critical domain-specific characteristics in its predictions.
| First mode frequency | R² | 0.9882 |
|---|---|---|
| MAE | 97.64 | |
| MSE | 2.188 | |
| Second mode frequency | R² | 0.9902 |
| MAE | 92.55 | |
| MSE | 1.965 |
We compared the performance of surrogate models trained on DeepJEB data with those trained on baseline data to demonstrate the advantages of using synthetic data. This comparison highlighted improvements in prediction accuracy and reliability attributable to the enhanced diversity and detail in the DeepJEB dataset. The comparison showed that surrogate models trained on DeepJEB data exhibited improved prediction accuracy and reliability compared with those trained on the baseline data.
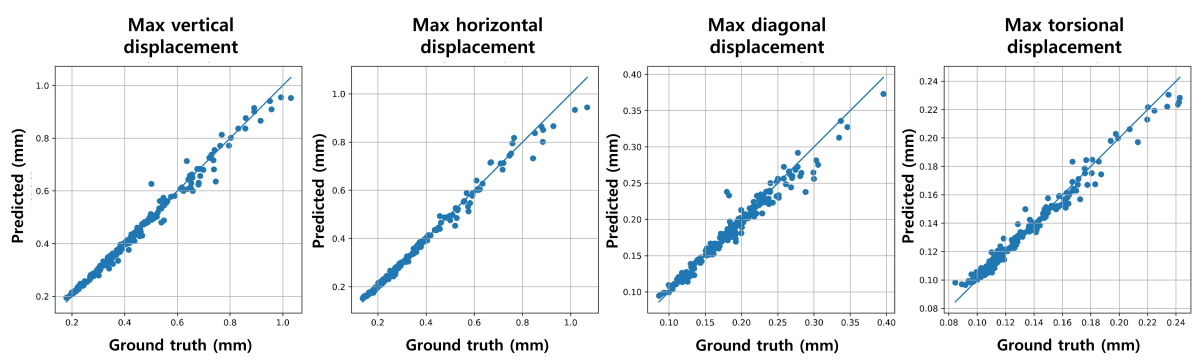
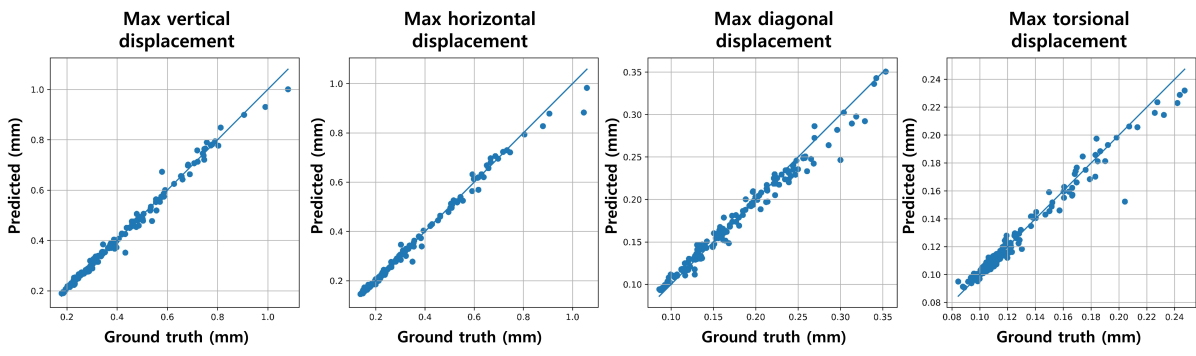
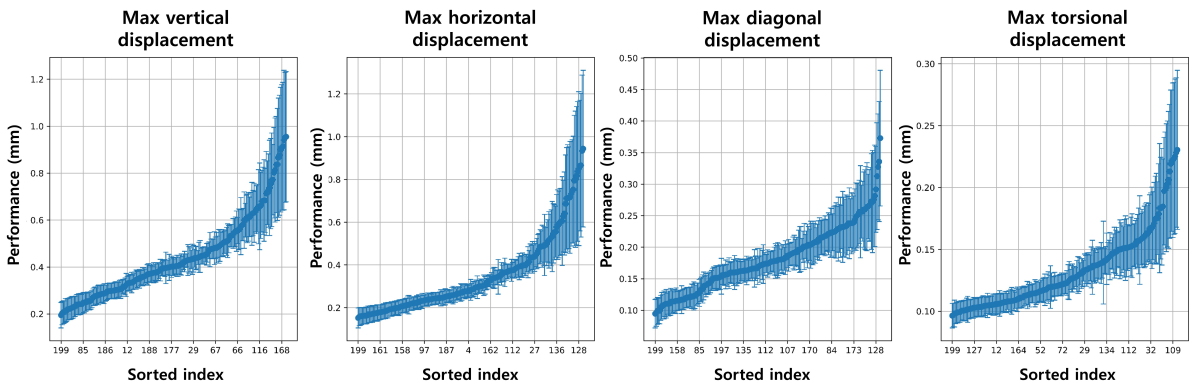
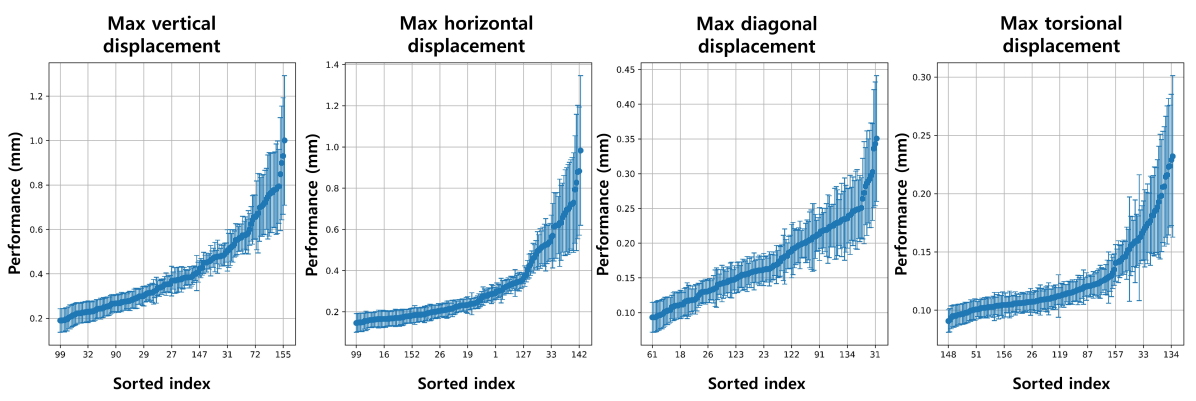
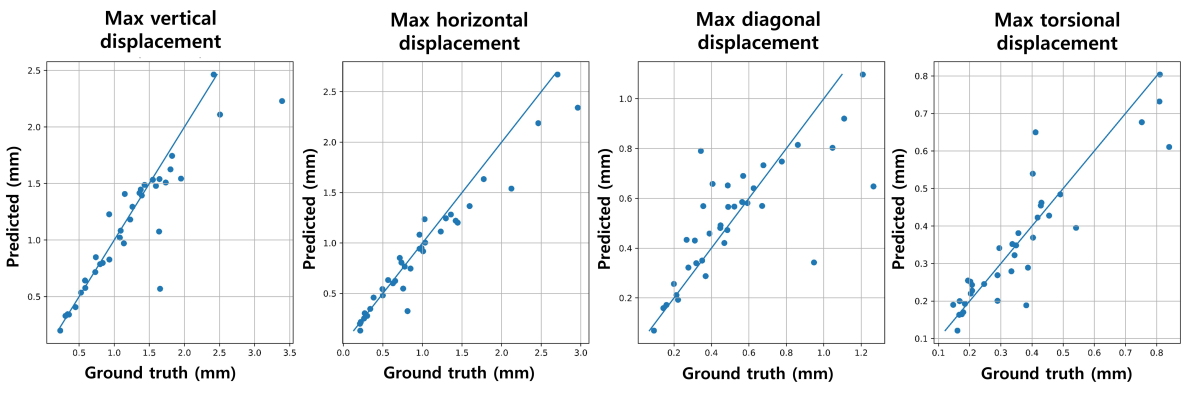
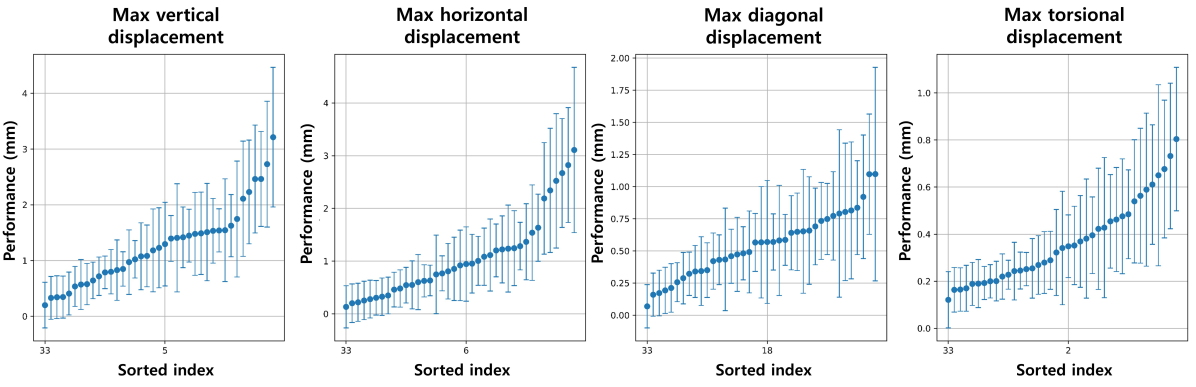
Furthermore, we divided the DeepJEB dataset into training, validation, and test sets in an 8:1:1 ratio, following the same experimental protocol as the previous frequency experiments. In this case, we used two uniformly sampled test datasets drawn from the distributions of shapes and performances, as described in Section 4. The results of these experiments are as follows: the performance metrics for the experimental datasets demonstrate a significant improvement compared with the baseline data across all performance indicators (Table 3). The scatter plots in Figs. 17(a) and 17(b) illustrate that all test sets are classified according to the shape and performance distributions exhibit strong trend adherence. The uncertainty quantification graph in Figs. 17(c) and 17(d) reveals that the regions with high data sample density, which are known a priori, show reduced uncertainty. Overall, the dataset’s high accuracy and reliability are evident when comparing the scatter plot and uncertainty quantification graph in Fig. 18 to those of the SimJEB data. These observations confirm that the surrogate models trained on the DeepJEB dataset provide precise predictions and maintain robustness, as evidenced by the quantified uncertainties. The models effectively capture complex relationships and demonstrate enhanced predictive capabilities and reliability in practical applications.
Engineering label Metrics DeepJEB (shape uniform) DeepJEB (performance uniform) SimJEB Max vertical displacement R² 0.9858 0.9901 0.8148 MAE 1.229 1.205 1.355 MSE 4.585 3.450 6.176 Max horizontal displacement R² 0.9882 0.9901 0.9120 MAE 1.068 9.568 1.213 MSE 4.082 3.744 3.788 Max diagonal displacement R² 0.9597 0.9738 0.6507 MAE 7.015 6.792 1.007 MSE 1.235 9.775 2.612 Max torsional displacment R² 0.9765 0.9674 0.8571 MAE 3.559 3.677 4.830 MSE 2.580 4.042 5.203
Synthetic data generated through augmentation techniques significantly enhance the surrogate models’ performance. These data increase the model’s generalization ability and prediction accuracy, demonstrating the value of using an augmented dataset. The key findings indicate that synthetic data improve the model’s ability to generalize to new designs and the accuracy of performance predictions across a diverse design space.
5.2 Validating Model Performance
We utilized a test set uniformly sampled from both the latent and performance spaces to validate the performance of the constructed surrogate models. This test set includes representative samples from various design and performance categories, ensuring a comprehensive evaluation of the model’s capabilities across different design scenarios. The evaluation uses the uniformly sampled test set to measure the efficiency of the surrogate models in predicting structural performance metrics.
The uniformly sampled test set, drawn from both the design and performance spaces, encompasses various design scenarios. This carefully selected set of unseen data allows for an accurate measurement of the model’s generalization capabilities. The results from this evaluation reveal that the surrogate models developed using the DeepJEB dataset exhibit high predictive accuracy and reliability across various design and performance conditions. Furthermore, the analysis demonstrates that these models effectively capture the complex relationships between geometric features and structural performance metrics. The performance metrics, including mean absolute error (MAE), mean squared error (MSE), and adjusted R² scores, indicate that the models provide precise predictions consistent with the expected performance trends. Furthermore, using the deep ensemble methodology with NLL loss enhances the models’ robustness by quantifying prediction uncertainty, which is crucial for assessing the reliability of the models in practical applications.
This case study validates the effectiveness of the DeepJEB dataset and underscores the benefits of using synthetic data to improve model performance and reliability. The DeepJEB dataset provides a robust foundation for developing high-performance surrogate models. The ability of this dataset to generate diverse and high-quality data ensures that the models trained on this dataset can generalize well to new and unseen designs, enhancing their applicability in real-world engineering scenarios. This case study highlights the transformative potential of synthetic data in improving the accuracy and reliability of data-driven models in structural performance prediction.
6 Conclusion
This research has effectively addressed the shortcomings of traditional datasets in handling complex geometries and performance metrics. The integration of advanced data generation techniques and rigorous validation processes resulted in a dataset that significantly enhanced the capabilities of surrogate models. This improvement paved the way for additional accurate and efficient engineering designs, demonstrating that high-quality synthetic datasets can effectively overcome the limitations of existing data-driven models.
Our key experiment involved creating the DeepJEB dataset and validating its effectiveness. The DeepJEB dataset, comprising 2138 samples, is approximately 5.6 times larger than the SimJEB dataset. Additionally, DeepJEB includes data not available in SimJEB, such as simulation results for second-order tetrahedral elements. These signed von Mises stress data allow for assessing tension and compression tendencies, modal analysis results, and multi-view images. Surrogate models trained on DeepJEB data outperformed those trained on SimJEB data, as evidenced by lower error metrics and better generalization across various design scenarios. This validation underscores the dataset’s potential as a robust benchmark for surrogate model development in structural engineering.
The DeepJEB dataset, with its detailed node-level field data, is particularly suitable for advanced modeling techniques, such as GNN and high-dimensional convolutional networks. These models can leverage the interactions and connectivity of each node to provide more precise and detailed predictions, advancing the accuracy and applicability of surrogate models in structural engineering. Furthermore, developing models for node value prediction (field prediction) is a promising direction for future research, enabling an extensive understanding of structural behavior and potentially leading to breakthroughs in the accuracy and reliability of engineering simulations.
In the future, updates to the dataset could incorporate dynamic time series data obtained through the integration of crash simulations or multi-physics simulations. This approach would provide a more comprehensive dataset that captures engineering systems’ complex, real-world behaviors, further enhancing the applicability and robustness of surrogate models.
In conclusion, the creation and validation of the DeepJEB dataset have significantly contributed to the field of mechanical engineering. Our research offers valuable insights and tools for enhancing data-driven engineering models by addressing the limitations of existing datasets and offering a robust framework for future dataset creation. This work not only improves the accuracy and reliability of surrogate models but also opens up new possibilities for their application in various engineering domains, driving forward innovation and progress in the field. Datasets, such as DeepJEB, will be crucial in advancing the frontiers of engineering research and practice as AI continues to evolve.
7 Licensing, attributions and access
The DeepJEB dataset is a derivative work incorporating synthesized CAD models based on a subset of “The Simulated Jet Engine Bracket Dataset (SimJEB)”, licensed under the Open Data Commons Attribution License. The full license document can be accessed at reference [65]. Unlike the original SimJEB dataset, the DeepJEB dataset includes several modifications and enhancements, such as generating additional shapes through shape synthesis, including more comprehensive engineering information via additional simulation metrics, and providing multi-view images. These enhancements enable more versatile applications of the 3D bracket data in various engineering contexts. The DeepJEB dataset is also licensed under the Open Data Commons Attribution License.
The DeepJEB dataset is publicly accessible on Google Drive without any restrictions. This dataset can be accessed at the following URL: https://www.narnia.ai/dataset. Moreover, this repository provides all necessary files in standard formats, including simulation results (.csv), B-Rep CAD files (.step), second-order tetrahedral mesh files (.vtk), multi-view images (.png), tessellated surface mesh files (.stl), hierarchical data format files combining information on tetrahedral meshes and simulation results (.h5), train–test split index files (.json), and FEM solver input files (.fem).
References
- [1] Ramesh, A., Dhariwal, P., Nichol, A., Chu, C., and Chen, M., 2022, “Hierarchical text-conditional image generation with clip latents,” arXiv preprint arXiv:2204.06125, 1(2), p. 3.
- [2] Team, G., Anil, R., Borgeaud, S., Wu, Y., Alayrac, J.-B., Yu, J., Soricut, R., Schalkwyk, J., Dai, A. M., Hauth, A., et al., 2023, “Gemini: a family of highly capable multimodal models,” arXiv preprint arXiv:2312.11805.
- [3] Achiam, J., Adler, S., Agarwal, S., Ahmad, L., Akkaya, I., Aleman, F. L., Almeida, D., Altenschmidt, J., Altman, S., Anadkat, S., et al., 2023, “Gpt-4 technical report,” arXiv preprint arXiv:2303.08774.
- [4] Shen, Y., Song, K., Tan, X., Li, D., Lu, W., and Zhuang, Y., 2024, “Hugginggpt: Solving ai tasks with chatgpt and its friends in hugging face,” Advances in Neural Information Processing Systems, 36.
- [5] Bappy, M. A., Ahmed, M., and Rauf, M. A., 2024, “Exploring the integration of informed machine learning in engineering applications: A comprehensive review,” Manam and Rauf, Md Abdur, Exploring the Integration of Informed Machine Learning in Engineering Applications: A Comprehensive Review (February 19, 2024).
- [6] Patel, A. R., Ramaiya, K. K., Bhatia, C. V., Shah, H. N., and Bhavsar, S. N., 2021, “Artificial intelligence: Prospect in mechanical engineering field—a review,” Data Science and Intelligent Applications: Proceedings of ICDSIA 2020, pp. 267–282.
- [7] Tapeh, A. T. G., and Naser, M., 2023, “Artificial intelligence, machine learning, and deep learning in structural engineering: a scientometrics review of trends and best practices,” Archives of Computational Methods in Engineering, 30(1), pp. 115–159.
- [8] Oh, S., Jung, Y., Kim, S., Lee, I., and Kang, N., 2019, “Deep generative design: Integration of topology optimization and generative models,” Journal of Mechanical Design, 141(11), p. 111405.
- [9] Regenwetter, L., Nobari, A. H., and Ahmed, F., 2022, “Deep generative models in engineering design: A review,” Journal of Mechanical Design, 144(7), p. 071704.
- [10] Shu, D., Cunningham, J., Stump, G., Miller, S. W., Yukish, M. A., Simpson, T. W., and Tucker, C. S., 2020, “3d design using generative adversarial networks and physics-based validation,” Journal of Mechanical Design, 142(7), p. 071701.
- [11] Wang, J., Chen, W. W., Da, D., Fuge, M., and Rai, R., 2022, “Ih-gan: A conditional generative model for implicit surface-based inverse design of cellular structures,” Computer Methods in Applied Mechanics and Engineering, 396, p. 115060.
- [12] Belani, H., Vukovic, M., and Car, Ž., 2019, “Requirements engineering challenges in building ai-based complex systems,” In 2019 IEEE 27th International Requirements Engineering Conference Workshops (REW), IEEE, pp. 252–255.
- [13] Goh, G. D., Sing, S. L., and Yeong, W. Y., 2021, “A review on machine learning in 3d printing: applications, potential, and challenges,” Artificial Intelligence Review, 54(1), pp. 63–94.
- [14] Zhang, W., Li, H., Li, Y., Liu, H., Chen, Y., and Ding, X., 2021, “Application of deep learning algorithms in geotechnical engineering: a short critical review,” Artificial Intelligence Review, pp. 1–41.
- [15] Chang, R., Wang, Y.-X., and Ertekin, E., 2022, “Towards overcoming data scarcity in materials science: unifying models and datasets with a mixture of experts framework,” npj Computational Materials, 8(1), p. 242.
- [16] Cunningham, J. D., Simpson, T. W., and Tucker, C. S., 2019, “An investigation of surrogate models for efficient performance-based decoding of 3d point clouds,” Journal of Mechanical Design, 141(12), p. 121401.
- [17] Du, P., Zhu, X., and Wang, J.-X., 2022, “Deep learning-based surrogate model for three-dimensional patient-specific computational fluid dynamics,” Physics of Fluids, 34(8).
- [18] Kim, S. W., Kim, I., Lee, J., and Lee, S., 2021, “Knowledge integration into deep learning in dynamical systems: an overview and taxonomy,” Journal of Mechanical Science and Technology, 35, pp. 1331–1342.
- [19] Whalen, E., Beyene, A., and Mueller, C., 2021, “Simjeb: simulated jet engine bracket dataset,” In Computer Graphics Forum, Vol. 40, Wiley Online Library, pp. 9–17.
- [20] Willis, K. D., Pu, Y., Luo, J., Chu, H., Du, T., Lambourne, J. G., Solar-Lezama, A., and Matusik, W., 2021, “Fusion 360 gallery: A dataset and environment for programmatic cad construction from human design sequences,” ACM Transactions on Graphics (TOG), 40(4), pp. 1–24.
- [21] Wu, R., Xiao, C., and Zheng, C., 2021, “Deepcad: A deep generative network for computer-aided design models,” In Proceedings of the IEEE/CVF International Conference on Computer Vision, pp. 6772–6782.
- [22] Chang, A. X., Funkhouser, T., Guibas, L., Hanrahan, P., Huang, Q., Li, Z., Savarese, S., Savva, M., Song, S., Su, H., et al., 2015, “Shapenet: An information-rich 3d model repository,” arXiv preprint arXiv:1512.03012.
- [23] Koch, S., Matveev, A., Jiang, Z., Williams, F., Artemov, A., Burnaev, E., Alexa, M., Zorin, D., and Panozzo, D., 2019, “Abc: A big cad model dataset for geometric deep learning,” In Proceedings of the IEEE/CVF conference on computer vision and pattern recognition, pp. 9601–9611.
- [24] Wu, Z., Song, S., Khosla, A., Yu, F., Zhang, L., Tang, X., and Xiao, J., 2015, “3d shapenets: A deep representation for volumetric shapes,” In Proceedings of the IEEE conference on computer vision and pattern recognition, pp. 1912–1920.
- [25] Song, B., Yuan, C., Permenter, F., Arechiga, N., and Ahmed, F., 2023, “Surrogate modeling of car drag coefficient with depth and normal renderings,” In International Design Engineering Technical Conferences and Computers and Information in Engineering Conference, Vol. 87301, American Society of Mechanical Engineers, p. V03AT03A029.
- [26] Kim, S., Chi, H.-g., Hu, X., Huang, Q., and Ramani, K., 2020, “A large-scale annotated mechanical components benchmark for classification and retrieval tasks with deep neural networks,” In Computer Vision–ECCV 2020: 16th European Conference, Glasgow, UK, August 23–28, 2020, Proceedings, Part XVIII 16, Springer, pp. 175–191.
- [27] Regenwetter, L., Weaver, C., and Ahmed, F. “Framed: An automl approach for structural performance prediction of bicycle frames,” Available at SSRN 4132282.
- [28] Bagazinski, N. J., and Ahmed, F., 2023, “Ship-d: Ship hull dataset for design optimization using machine learning,” In International Design Engineering Technical Conferences and Computers and Information in Engineering Conference, Vol. 87301, American Society of Mechanical Engineers, p. V03AT03A028.
- [29] Giannone, G., Srivastava, A., Winther, O., and Ahmed, F., 2024, “Aligning optimization trajectories with diffusion models for constrained design generation,” Advances in Neural Information Processing Systems, 36.
- [30] Mazé, F., and Ahmed, F., 2023, “Diffusion models beat gans on topology optimization,” In Proceedings of the AAAI conference on artificial intelligence, Vol. 37, pp. 9108–9116.
- [31] Nie, Z., Lin, T., Jiang, H., and Kara, L. B., 2021, “Topologygan: Topology optimization using generative adversarial networks based on physical fields over the initial domain,” Journal of Mechanical Design, 143(3), p. 031715.
- [32] Shin, S., Shin, D., and Kang, N., 2023, “Topology optimization via machine learning and deep learning: A review,” Journal of Computational Design and Engineering, 10(4), pp. 1736–1766.
- [33] Maksum, Y., Amirli, A., Amangeldi, A., Inkarbekov, M., Ding, Y., Romagnoli, A., Rustamov, S., and Akhmetov, B., 2022, “Computational acceleration of topology optimization using parallel computing and machine learning methods–analysis of research trends,” Journal of Industrial Information Integration, 28, p. 100352.
- [34] Mukherjee, S., Lu, D., Raghavan, B., Breitkopf, P., Dutta, S., Xiao, M., and Zhang, W., 2021, “Accelerating large-scale topology optimization: State-of-the-art and challenges,” Archives of Computational Methods in Engineering, pp. 1–23.
- [35] Jang, S., Yoo, S., and Kang, N., 2022, “Generative design by reinforcement learning: enhancing the diversity of topology optimization designs,” Computer-Aided Design, 146, p. 103225.
- [36] Yoo, S., Lee, S., Kim, S., Hwang, K. H., Park, J. H., and Kang, N., 2021, “Integrating deep learning into cad/cae system: generative design and evaluation of 3d conceptual wheel,” Structural and multidisciplinary optimization, 64(4), pp. 2725–2747.
- [37] Drela, M., 1989, “Xfoil: An analysis and design system for low reynolds number airfoils,” In Low Reynolds Number Aerodynamics: Proceedings of the Conference Notre Dame, Indiana, USA, 5–7 June 1989, Springer, pp. 1–12.
- [38] Chen, W., and Ahmed, F., 2021, “Padgan: Learning to generate high-quality novel designs,” Journal of Mechanical Design, 143(3), p. 031703.
- [39] Heyrani Nobari, A., Chen, W., and Ahmed, F., 2021, “Pcdgan: A continuous conditional diverse generative adversarial network for inverse design,” In Proceedings of the 27th ACM SIGKDD conference on knowledge discovery & data mining, pp. 606–616.
- [40] Chen, W., and Ahmed, F., 2021, “Mo-padgan: Reparameterizing engineering designs for augmented multi-objective optimization,” Applied Soft Computing, 113, p. 107909.
- [41] Wollstadt, P., Bujny, M., Ramnath, S., Shah, J. J., Detwiler, D., and Menzel, S., 2022, “Carhoods10k: An industry-grade data set for representation learning and design optimization in engineering applications,” IEEE Transactions on Evolutionary Computation, 26(6), pp. 1221–1235.
- [42] Picard, C., Schiffmann, J., and Ahmed, F., 2023, “Dated: Guidelines for creating synthetic datasets for engineering design applications,” In International Design Engineering Technical Conferences and Computers and Information in Engineering Conference, Vol. 87301, American Society of Mechanical Engineers, p. V03AT03A015.
- [43] Guo, Y., Wang, H., Hu, Q., Liu, H., Liu, L., and Bennamoun, M., 2020, “Deep learning for 3d point clouds: A survey,” IEEE transactions on pattern analysis and machine intelligence, 43(12), pp. 4338–4364.
- [44] Chaudhuri, S., Ritchie, D., Wu, J., Xu, K., and Zhang, H., 2020, “Learning generative models of 3d structures,” In Computer graphics forum, Vol. 39, Wiley Online Library, pp. 643–666.
- [45] Park, J. J., Florence, P., Straub, J., Newcombe, R., and Lovegrove, S., 2019, “Deepsdf: Learning continuous signed distance functions for shape representation,” In Proceedings of the IEEE/CVF conference on computer vision and pattern recognition, pp. 165–174.
- [46] Chabra, R., Lenssen, J. E., Ilg, E., Schmidt, T., Straub, J., Lovegrove, S., and Newcombe, R., 2020, “Deep local shapes: Learning local sdf priors for detailed 3d reconstruction,” In Computer Vision–ECCV 2020: 16th European Conference, Glasgow, UK, August 23–28, 2020, Proceedings, Part XXIX 16, Springer, pp. 608–625.
- [47] Mildenhall, B., Srinivasan, P. P., Tancik, M., Barron, J. T., Ramamoorthi, R., and Ng, R., 2021, “Nerf: Representing scenes as neural radiance fields for view synthesis,” Communications of the ACM, 65(1), pp. 99–106.
- [48] Maturana, D., and Scherer, S., 2015, “Voxnet: A 3d convolutional neural network for real-time object recognition,” In 2015 IEEE/RSJ international conference on intelligent robots and systems (IROS), IEEE, pp. 922–928.
- [49] Li, Z., Liu, F., Yang, W., Peng, S., and Zhou, J., 2021, “A survey of convolutional neural networks: analysis, applications, and prospects,” IEEE transactions on neural networks and learning systems, 33(12), pp. 6999–7019.
- [50] Qi, C. R., Su, H., Mo, K., and Guibas, L. J., 2017, “Pointnet: Deep learning on point sets for 3d classification and segmentation,” In Proceedings of the IEEE conference on computer vision and pattern recognition, pp. 652–660.
- [51] Qi, C. R., Yi, L., Su, H., and Guibas, L. J., 2017, “Pointnet++: Deep hierarchical feature learning on point sets in a metric space,” Advances in neural information processing systems, 30.
- [52] Nash, C., Ganin, Y., Eslami, S. A., and Battaglia, P., 2020, “Polygen: An autoregressive generative model of 3d meshes,” In International conference on machine learning, PMLR, pp. 7220–7229.
- [53] Gao, J., Shen, T., Wang, Z., Chen, W., Yin, K., Li, D., Litany, O., Gojcic, Z., and Fidler, S., 2022, “Get3d: A generative model of high quality 3d textured shapes learned from images,” Advances In Neural Information Processing Systems, 35, pp. 31841–31854.
- [54] Huang, Q., Huang, X., Sun, B., Zhang, Z., Jiang, J., and Bajaj, C., 2021, “Arapreg: An as-rigid-as possible regularization loss for learning deformable shape generators,” In Proceedings of the IEEE/CVF international conference on computer vision, pp. 5815–5825.
- [55] Muralikrishnan, S., Chaudhuri, S., Aigerman, N., Kim, V. G., Fisher, M., and Mitra, N. J., 2022, “Glass: Geometric latent augmentation for shape spaces,” In Proceedings of the IEEE/CVF Conference on Computer Vision and Pattern Recognition, pp. 18552–18561.
- [56] Peng, D., Merriman, B., Osher, S., Zhao, H., and Kang, M., 1999, “A pde-based fast local level set method,” Journal of computational physics, 155(2), pp. 410–438.
- [57] Osher, S., Fedkiw, R., and Piechor, K., 2004, “Level set methods and dynamic implicit surfaces,” Appl. Mech. Rev., 57(3), pp. B15–B15.
- [58] Hao, Z., Averbuch-Elor, H., Snavely, N., and Belongie, S., 2020, “Dualsdf: Semantic shape manipulation using a two-level representation,” In Proceedings of the IEEE/CVF Conference on Computer Vision and Pattern Recognition, pp. 7631–7641.
- [59] Mu, J., Qiu, W., Kortylewski, A., Yuille, A., Vasconcelos, N., and Wang, X., 2021, “A-sdf: Learning disentangled signed distance functions for articulated shape representation,” In Proceedings of the IEEE/CVF International Conference on Computer Vision, pp. 13001–13011.
- [60] Lorensen, W. E., and Cline, H. E., 1998, “Marching cubes: A high resolution 3d surface construction algorithm,” In Seminal graphics: pioneering efforts that shaped the field. pp. 347–353.
- [61] Accelerate Simulation-driven Design — Altair Inspire — altair.com https://altair.com/inspire/ [Accessed 28-05-2024].
- [62] Multiphysics Workflows with CAD Associativity — Altair SimLab — altair.com https://altair.com/simlab/ [Accessed 28-05-2024].
- [63] Abambres, M., and Arruda, M. R., 2016, “Finite element analysis of steel structures–a review of useful guidelines,” International Journal of Structural Integrity, 7(4), pp. 490–515.
- [64] Lakshminarayanan, B., Pritzel, A., and Blundell, C., 2017, “Simple and scalable predictive uncertainty estimation using deep ensembles,” Advances in neural information processing systems, 30.
- [65] Open Data Commons Attribution License (ODC-By) v1.0. URL: https://opendatacommons.org/licenses/by/1-0/.