Interference Analysis for Coexistence of UAVs and Civil Aircrafts Based on Automatic Dependent Surveillance-Broadcast
Abstract
Due to the advantages of high mobility and easy deployment, unmanned aerial vehicles (UAVs) are widely applied in both military and civilian fields. In order to strengthen the flight surveillance of UAVs and guarantee the airspace safety, UAVs can be equipped with the automatic dependent surveillance-broadcast (ADS-B) system, which periodically sends flight information to other aircrafts and ground stations (GSs). However, due to the limited resource of channel capacity, UAVs equipped with ADS-B results in the interference between UAVs and civil aircrafts (CAs), which further impacts the accuracy of received information at GSs. In detail, the channel capacity is mainly affected by the density of aircrafts and the transmitting power of ADS-B. Hence, based on the three-dimensional poisson point process, this work leverages the stochastic geometry theory to build a model of the coexistence of UAVs and CAs and analyze the interference performance of ADS-B monitoring system. From simulation results, we reveal the effects of transmitting power, density, threshold and pathloss on the performance of the ADS-B monitoring system. Besides, we provide the suggested transmitting power and density for the safe coexistence of UAVs and CAs.
Index Terms:
UAV, ADS-B, civil aviation, interference analysis, poisson point process, stochastic geometry.I Introduction
As low-altitude aerial technology advances, unmanned aerial vehicles (UAVs) play increasingly significant roles across various domains such as collaborative reconnaissance, precision agriculture, disaster rescue, and environmental monitoring [1]. Besides, the growing multitude applications necessitate abundant UAVs, raising concerns about the flight safety. Furthermore, the absence of on-board pilots poses potential risks to the safe operation of civil aircrafts (CAs) [2]. Hence, enhancing the airspace management for UAVs and guaranteeing the flight safety emerge as crucial imperatives [3].
In order to obtain exact aerial location information, UAVs can be equipped with automatic dependent surveillance-broadcast (ADS-B) systems[4]. Working at 1090MHz, ADS-B is beneficial to both the flight safety and air traffic management [5]. In detail, an aircraft equipped with ADS-B can automatically broadcast its flight information to nearby aircrafts and ground stations (GSs)[6]. However, due to the limited channel capacity, if multiple UAVs utilize the same channel, the interference between UAVs and CAs cannot be neglected. Consequently, the accuracy of received information at GSs is deteriorated, which further impairs the performance of the monitoring system. In particular, the density of UAVs and the transmitting power of ADS-B are key factors on the performance of the monitoring system. As a result, this work aims to analyze the interference for the coexistence of UAVs and CAs based on ADS-B with respect to the transmitting power and the density of UAVs.
There exist a couple of related works about UAVs equipped with ADS-B. For instance, [7] points out that the performance of ADS-B system is affected by the density of UAVs, ADS-B transmitting power and the number of GSs. [8] demonstrates that the performance of the ADS-B system is affected by channel characteristics and minimum updating interval required by aircrafts. Besides, there are a few works utilizing stochastic geometry (SG) and poisson point process (PPP) to analyze UAVs networks, for example, [9] states that UAV wireless networks have natural spatial random characteristics and the channel has fading and shadowing characteristics. Therefore, SG can be utilized to analyze the performance of UAV wireless networks. [10] develops a tractable framework for signal-to-interference-plus-noise ratio (SINR) analysis in downlink heterogeneous cellular networks with flexible cell association policies. [11] compares the model of Rician channel, Rayleigh channel and Nakagami-m channel in wireless network, and analyzes the coverage rate of UAV assisted cellular network. The authors in [12] utilize SG to analyze the response delay and the successful transmission probability for a single link and a group of links based on the three-dimensional (3D) distribution of UAV swarms.
However, the above works equip UAVs with ADS-B to enhance the flight safety, but they seldom utilize SG to examine the system performance considering the interference based on ADS-B. Besides, to construct the model, we distinguish the interference taking account of the coexistence of UAVs and CAs, which is a challenging problem. In, short, the contributions of this paper are summarized as follows.
-
•
We propose the model of the coexistence of UAVs and CAs based on ADS-B techniques.
-
•
Based on SG theory, we employ 3D-PPP to reveal the interference performance and deduce the analytic form of the received probability.
-
•
Extensive simulations are conducted to verify the effects of transmitting power, density, threshold and pathloss on the performance of ADS-B monitoring system.
II System Model
II-A Network Model
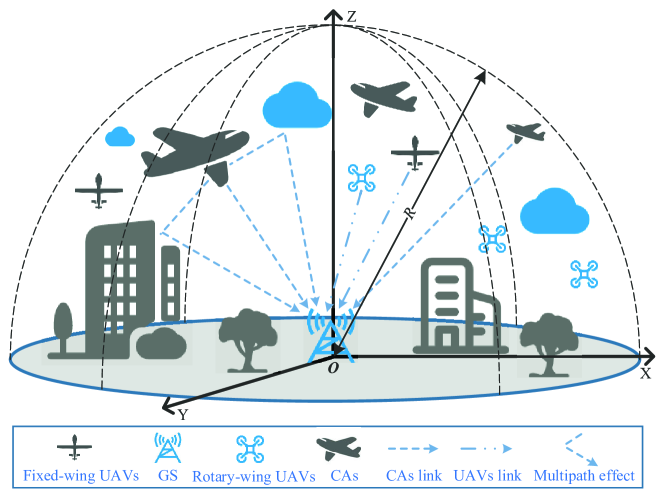
Fig. 1 depicts the system model of the coexistence of UAVs and CAs. The fixed-wing UAVs, rotary-wing UAVs and CAs are randomly distributed in space V. All aircrafts transmit flight information to the GS via ADS-B. The fixed-wing UAVs and the rotary-wing UAVs follow a 3D-PPP [13] with density in the finite space V, and the number of UAVs is . The CAs follow a 3D-PPP with density in the finite space V, and the number of CAs is . Denote the UAV set as , and the CA set as . It is assumed that there is only one GS in space V, and all ADS-B packets from UAVs and CAs are received by the GS. The GS is located in the center of the ground with the coordinate of O(0, 0, 0). In detail, the coordinate of the - UAV in set is , , and the coordinate of the - CA in set is , , . The X-axis coordinates for all aircrafts range within , the Y-axis coordinates range within , and the Z-axis coordinates are . The euclidean distance between UAV and the GS is , and the euclidean distance between CA and the GS is . The transmitting power of ADS-B from UAV and CA are set as and , respectively.
II-B Channel Model
and respectively represent the transmitter gain of UAVs and CAs. denotes the receiver gain at the GS. Therefore, the total air-ground (AG) channel gain at the GS from UAVs is , and the AG channel gain between CAs and the GS is . The pathloss from the GS to UAVs and CAs are respectively proportional to and , where and represent the distance between the aircrafts and GS. indicates the pathloss index. represents the gain of small scale fading channel between UAV and the GS. represents the gain of small scale fading channel between CA and the GS. and are two random variables following an exponential distribution with mean value of 1. Gaussian white noise is added to the model, i.e., , where is noise power density and is the system bandwidth. We leverage to represent SINR. Then, the of the desired signal sent by the - UAV in set is
| (1) |
in which
| (2) |
and
| (3) |
III Performance Analysis
It is supposed that all the aircrafts send the flight information via ADS-B to the GS within space V. In particular, UAVs follow the nearest neighbor association strategy[14], i.e., no other GSs outside space V has less distance to the target UAV
| (4) |
where 0, and is the radius of the 3D euclidean space . Therefore, the cumulative distribution function (CDF) of the distance from UAV to the GS is
| (5) |
and the probability density function (PDF) of is
| (6) |
The successful received probability at the GS is introduced to measure the transmission quality. If the distance between the UAV and GS is , and is greater than the received threshold , the successful received probability of the GS is denoted as
| (7) |
Since is also a function of , the of the - UAV in set is further expressed as
| (8) |
It is assumed that the average gain of small scale fading channel is a random variable following the Gamma distribution with mean value of 1[13], which is depicted as


| (9) |
When equals 1, the channel is considered as Rayleigh fading. follows an exponential distribution with mean value of 1. The PDF of is =, i.e., and . Hence, in (III) is further represented as
| (10) |
Let , and we have
| (11) |
which is the Laplace transform of , and is further derived as
| (12) |
where (a) is obtained by the moment generating function, (b) follows the probability generating function (PGFL) of the PPP [15], in (c) can be further expressed as , and in (d) represents the triple integral in (c). Moreover, let , and we have
| (13) |
following the Laplace transformation of . Therefore, (13) is further simplified as
| (14) |
where in (e) symbolizes the triple integral. By substituting (III), (11), (III), (13) and (III) into (III), is calculated as
| (15) |
The influences of and on have different weights, which are proportional to and , respectively. According to (III), is mainly affected by the ratio of to . Hence, following (III), is mainly related with , , , and . Analyzing the performance on UAVs or CAs is a similar reasoning process, i.e., the SINR and successful received probability have similar analytic forms. The detailed difference between UAVs and CAs lies in the altitude, density and transmitting power of ADS-B. Hovover, in this paper, our research mainly focuses on the analysis of the performance of GS on UAVs, and CAs are regarded as a interfering factor. Hence, we only provide the deductions and simulations concentrated on UAVs. Further, we analyze the detailed influences in Section IV.
| Parameter | Value |
|---|---|
| 1MHz | |
| -174dBm/Hz | |
| 1W70W | |
| 23dBi | |
| 15W140W | |
| 20dBi | |
| 7dB, 10dB, 11dB, 13dB, 14dB | |
| 25 | |
| 0100 | |
| 15 | |
| 1km6km | |
| 6km10km |
IV Simulation Results and Analyses
To further evaluate the detailed performance, MATLAB is employed to simulate the 3D-PPP distribution scenario of the UAVs and CAs, as shown in Fig. 2. Space V is set as 20km 20km10km. The CAs are randomly distributed at altitudes of , and the UAVs are randomly distributed at altitudes of due to the limited flight ability. is set within , and is fixed as 15. In the civil aviation system, the channel interval within is 1MHz. Since we focus on ADS-B operating at 1090MHz, the channel bandwidth between the GS and all aircrafts are set as 1MHz[16]. Besides, the pathloss index is set within . Moreover, the total gain on AG channel of UAVs is 23dBi, and the total gain on AG channel of CAs is 20dBi. The detailed parameters in simulations are summarized in TABLE I.
Fig. 3 shows the distance between the GS and UAVs or CAs. In detail, X-axis represents the generated aircrafts, including UAVs and CAs, and Y-axis denotes the distance between the aircrafts and the GS, corresponding to the simulation scenario in Fig. 2. The distance of each point is randomly generated according to PPP. It is classified that if 15km, is considered as a short-range UAV. Otherwise, if 15km, is deemed as a long-range UAV.
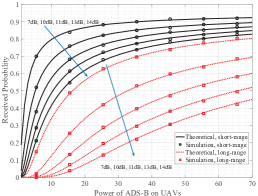
Fig. 4a demonstrates the impact of on the received probability under different threshold , considering UAVs as targets. , and are respectively fixed at 30W, 2 and 30. The solid lines represent the performance of short-range UAVs, while the dashed lines demonstrate the performance related to long-range UAVs. Besides, the simulation results coincide with the theoretical results, which validates the accuracy of theoretical analysis. As for the short-range UAVs, with the increment of , the received probability from the desired UAVs at the GS increases. Moreover, as grows, the corresponding successful received probability decreases. When is 7dB and is 16W, the received probability is 84.77, where the received probability curve starts to smooth. If increases to 11dB, the received probability descends to 68.63. On the other hand, the dashed lines manifest the performance of the long-range flying UAVs. In particular, has little influence on the received probability during the initial increment. Compared with short-range UAVs, with the increment of the distance, the received probability corresponding to the same and declines. When is 7dB and is 16W, the received probability is only 49.40, which decreases by 41.72 on the basis of short-range UAVs. If the threshold escalates, more transmitting power is needed to compensate for the received probability. In conclusion, for short-range UAVs, setting to be greater than 30W is energy-consuming, since the received probability is already approaching flat. Furthermore, in terms of long-range UAVs, the received probability improves significantly when falls between 30W and 70W[17]. Additionally, the curve of =7dB and =10dB show smooth trends when exceeds 65W.
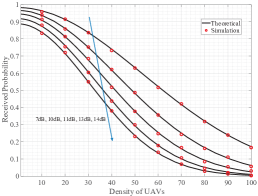
To evaluate the density of UAVs, in Fig. 4b is set within . We explore the impact of on received probability under different threshold . , and are respectively fixed at 11dB, 30W and 2. The simulation results coincide with the theoretical results, which validates the accuracy of theoretical analysis. As the density of UAVs ascends, the received probability descends. Supposing is 30, as we set in Fig. 4a, =7dB, =10dB, =11dB, =13dB, =14dB correspond to the received probability of 83.68, 75.05, 67.69, 60.61, 54.86, respectively. Besides, when is higher 11dB and exceeds 60, the GS can no longer support the monitoring of the airspace.
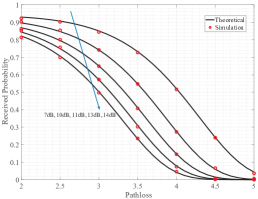
Fig. 4c discusses the impact of pathloss on the received probability under different threshold . , and are respectively fixed at 25W, 30W and 30. The simulation results coincide with the theoretical results, which validates the accuracy of theoretical analysis. Primarily, has little influence on the received probability during the initial increment. When exceeds 3, the received probability drops sharply. Considering is 7dB and is 3, the corresponding received probability is 85.1. When rises to 4.5, the corresponding received probability declines to 24.1. If increases at this point, the GS can no longer support the monitoring of the airspace. In short, when is greater 3, the increment cause the received probability to plummet, making the channel performance deteriorated. By increasing or decreasing , we can compensate for the effect of the increment of on the received probability.

Fig. 5 illustrates the impact of and on received probability. We set and as variables, aiming to simultaneously examines the influence of and on the received probability at short-range UAVs. , and are respectively fixed at 7dB, 2 and 30. With the increment of , the received probability increases. On the contrary, as enlarges, the received probability diminishes. Assuming is 24W and is 40W, the corresponding received probability is 75.26. If stays constant, the corresponding received probability is 70.98 when decreases to 15W. If stays constant, the corresponding received probability is 70.49 when increases to 73W. Minishing improves the received probability of the GS towards UAVs. However, the monitoring performance of the GS towards CAs is undermined. In addition, is unadvisable to be magnified indefinitely, which intensifies the signal interference, impairs the ability of the GS to monitor CAs and wastes energy. Hence, the transmitting power of both types of aircrafts should be balanced according to actual demands.
V Conclusions
This work analyzes the interference for the coexistence of UAVs and CAs based on ADS-B. We build a 3D-PPP model and deduces the explicit analytic form of the received probability targeting UAVs by SG theory. When analyzing the signal of a UAV, the interference signals are distinguished between UAVs and CAs. Moreover, based on the AG channel, we reveal the effects of transmitting power, density, threshold and pathloss on the performance of the ADS-B monitoring system via simulations. Additionally, the transmitting power of UAVs and CAs are both taken as variables to analyze the received probability of UAVs. In terms of raising the received probability, the transmitting power of ADS-B and the density of UAVs are contrarious, which can be set appropriately according to the requirements of the surveillance performance. In short, this work contributes to the appropriate deployment of ADS-B equipment on the UAVs, which helps improve the airspace safety and enhances the air traffic flow management.
References
- [1] H. Xu, L. Wang, W. Han, Y. Yang, J. Li, Y. Lu and J. Li, "A Survey on UAV Applications in Smart City Management: Challenges, Advances, and Opportunities," IEEE J-STARS, vol. 16, pp. 8982-9010, 2023.
- [2] L. Gupta, R. Jain and G. Vaszkun, "Survey of Important Issues in UAV Communication Networks," IEEE Commun. Surveys Tuts., vol. 18, no. 2, pp. 1123-1152, Second quarter 2016.
- [3] Y. Zhu, Z. Jia, Q. Wu, C. Dong, Z. Zhang, H. Hu and Q.Cai, "UAV Trajectory Tracking via RNN-enhanced IMM-KF with ADS-B Data," in IEEE Wireless Commun. Networking Conf., Dubai, United Arab Emirates, Apr. 2024.
- [4] M. Strohmeier, V. Lenders and I. Martinovic, "On the Security of the Automatic Dependent Surveillance-Broadcast Protocol," IEEE Commun. Surveys Tuts., vol. 17, no. 2, pp. 1066-1087, Second quarter 2015.
- [5] M. Strohmeier, M. Schafer, V. Lenders and I. Martinovic, "Realities and challenges of nextgen air traffic management: the case of ADS-B," IEEE Commun. Mag., vol. 52, pp. 111-118, May 2014.
- [6] X. Deng, F. Wang and G. Yang, "A Survey on Airborne ADS-B Technology and Its Development Trend," Advances in Aeronautical Science and Engineering, vol. 12, no. 1, pp. 121-128, Feb. 2021.
- [7] P. Jonas, M. Jancik, S. Holoda and J. Bodart, "Impact of SUAS equipped with ADS-B on 1090MHz environment," in New Trends in Civil Aviation (NTCA), Prague, Czech Republic, Nov. 2020.
- [8] H. Liu, S. Wu, D. Qin and D. Li, "Performance analysis of surveillance capacity of satellite-based ADS-B receiver," in Acta Aeronautica Et Astronatica Sinica, vol. 39, no. 5, pp. 8-15, May 2018.
- [9] J. G. Andrews, F. Baccelli and R. K. Ganti, "A Tractable Approach to Coverage and Rate in Cellular Networks," IEEE Trans. Commun., vol. 59, no. 11, pp. 3122-3134, Nov. 2011.
- [10] H. -S. Jo, Y. J. Sang, P. Xia and J. G. Andrews, "Heterogeneous Cellular Networks with Flexible Cell Association: A Comprehensive Downlink SINR Analysis," IEEE Trans. Wireless Commun., vol. 11, no. 10, pp. 3484-3495, Oct. 2012.
- [11] L. Zhou, Z. Yang, S. Zhou and W. Zhang, "Coverage Probability Analysis of UAV Cellular Networks in Urban Environments," in IEEE ICC Workshops, Kansas City, MO, May 2018.
- [12] Q. Zhang, J. Chen, L. Ji, Z. Feng, and Z. Chen, "Response delay optimization in mobile edge computing enabled UAV swarm," IEEE Trans. Veh. Technol., vol. 69, no. 99, pp. 3280-3295, Mar. 2020.
- [13] X. Liu, "Closed-Form Coverage Probability in Cellular Networks With Poisson Point Process," IEEE Trans. Veh. Technol., vol. 68, no. 8, pp. 8206-8209, Aug. 2019.
- [14] Y. Guo, X. Jia, S. Cao and Z. Hao, "Analysis of Downlink Coverage and Capacity for 3D Mobile UAV Networks," in 7th ISMII, Zhuhai, China, Jan. 2021.
- [15] H. E. Sawy, A. Sultan-Salem, M. Alouini and M. Z. Win, "Modeling and Analysis of Cellular Networks Using Stochastic Geometry: A Tutorial," IEEE Commun. Surveys Tuts., vol. 19, no. 1, pp. 167-203, First quarter 2017.
- [16] Y. Bai, X. Zhang and L. Zhao, "Co-channel CCK transmission overlapped with DME in aeronautical communication," in IEEE ChinaSIP, Xi’an, China, Jul. 2014.
- [17] RTCA, "Minimum Operational Performance Standards (MOPS) for 1090 MHz Extended Squitter Automatic Dependent Surveillance-Broadcast (ADS-B) and Traffic Information Services-Broadcast (TIS-B)," [Online]. Available: https://www.rtca.org/standards/