SlowPerception: Physical-World Latency Attack against Visual Perception
in Autonomous Driving
Abstract
Autonomous Driving (AD) systems critically depend on visual perception for real-time object detection and multiple object tracking (MOT) to ensure safe driving. However, high latency in these visual perception components can lead to significant safety risks, such as vehicle collisions. While previous research has extensively explored latency attacks within the digital realm, translating these methods effectively to the physical world presents challenges. For instance, existing attacks rely on perturbations that are unrealistic or impractical for AD, such as adversarial perturbations affecting areas like the sky, or requiring large patches that obscure most of a camera’s view, thus making them impossible to be conducted effectively in the real world.
In this paper, we introduce SlowPerception, the first physical-world latency attack against AD perception, via generating projector-based universal perturbations. SlowPerception strategically creates numerous phantom objects on various surfaces in the environment, significantly increasing the computational load of Non-Maximum Suppression (NMS) and MOT, thereby inducing substantial latency. Our SlowPerception achieves second-level latency in physical-world settings, with an average latency of 2.5 seconds across different AD perception systems, scenarios, and hardware configurations. This performance significantly outperforms existing state-of-the-art latency attacks. Additionally, we conduct AD system-level impact assessments, such as vehicle collisions, using industry-grade AD systems with production-grade AD simulators with a 97% average rate. We hope that our analyses can inspire further research in this critical domain, enhancing the robustness of AD systems against emerging vulnerabilities.
1 Introduction
Autonomous driving (AD) vehicles, which enable vehicles to operate without human input, are becoming increasingly available in our daily lives such as Waymo robotaxi [1, 2] and Tesla AutoPilot [3]. In AD systems, visual perception plays a critical role similar to a driver’s eyes. This component leverages object detection and multiple object tracking (MOT) for detecting and tracking surrounding objects such as cars and pedestrians in real-time, ensuring safe driving. Failure to detect and track objects can directly lead to violent crashes or even fatal accidents [4, 5]. Thus, prior research has concentrated on conducting security and safety analyses of this critical component in AD systems, especially on the integrity part such as making the object vanish or misclassified [6, 7, 8, 9, 10, 11, 12].
Compared to the above integrity threats to AD perception, the availability aspect (particularly real-time performance) in AD perception, has been less explored but is equally crucial for ensuring safety. High latency, for instance, can hinder the timely provision of data necessary for decision-making and thus lead to significant safety hazards, such as vehicle collisions [13]. Recognizing the significance of this issue, several prior works have concentrated on the latency attacks, either targeting object detection alone [14, 15, 16, 17] or the entire AD perception [13].
However, all these studies are limited to the digital space, and directly translating their methods to the physical world poses significant challenges. Although DS [14] attempts a physical attack with printed adversarial patches, the attack fails to create sufficient latency to qualify as a latency attack since it only achieves the same latency (0.03 s) as the benign case and such latency falls within the acceptable latency limits for AD vehicles [18, 19].
From the attack methodology aspect, existing latency attacks are limited by the threshold of object detection and rely on perturbations that are unrealistic or impractical for AD, such as those affecting areas like the sky, or requiring large patches that obscure most of a camera’s view, thus making them difficult to be conducted effectively in the real world. The efficacy of latency attacks is closely tied to the extent of the image area manipulated—a larger manipulated area allows for creating more phantom objects, thereby injecting higher latency. However, the limited surface area available for attackers to exploit poses a substantial challenge when transitioning from the digital to the physical world.
From the attack vector aspect, existing latency attacks assume the manipulated region to be large. Specifically, most attacks leverage the adversarial perturbations on the whole image as the attack vector. However, perturbing the whole captured region, which contains various objects and the background, is impractical in real driving scenarios. Other attacks, such as DS [14], use printed patches. However, without being impractically large or close to the camera, such patches are hard to succeed.
To overcome the above limitations, in this paper, we propose SlowPerception, the first physical-world universal latency attack against entire AD perception employing a projector to generate adversarial perturbations. SlowPerception strategically creates numerous phantom objects with various shape features on physically perturbable surfaces in the environment. This strategy significantly increases the number of bounding boxes fed into Non-Maximum Suppression (NMS) and the number of trackers in the MOT tracker pool, thereby increasing the computational costs of both NMS and MOT and inducing substantial latency. Additionally, SlowPerception subtly and silently injects latency without overtly displaying numerous phantom objects in the perception results, which is more stealthy compared to other latency attacks, which display a plethora of phantom objects in perception results. To ensure that universal perturbations are robust enough to effectively carry out latency attacks in the physical world using a projector, SlowPerception has developed a projection model. This model simulates the transformation between the projection surface, the projected perturbations, and the image captured by the camera.
We evaluate the effectiveness of our attack through both simulated physical experiments on two AD datasets and real-world environments with 3 different hardware environments. SlowPerception effectively achieves second-level latency in the physical world, which refers to time latency exceeding one second, using universal perturbations, with an average latency of 2.5 seconds across various AD perception systems, scenarios, and hardware configurations. Additionally, SlowPerception significantly outperforms state-of-the-art latency attacks in a physical-world setup. It surpasses Phantom Sponges (PS) [20] and SlowTrack (ST) [13] by 10 and 9 times, respectively, in terms of induced latency in the physical world. This demonstrates the superior capability of SlowPerception to disrupt AD systems more effectively than currently available methods.
To assess how SlowPerception affects the AD behavior, such as vehicle collisions or STOP sign traffic rule violation, we conduct tests using PASS Platform [21], a system-driven evaluation platform for AD safety and security, including an AD system and Carla simulator [22] and Baidu Apollo [23], an industry-grade full-stack AD system with the LGSVL simulator [24], a production AD simulator. SlowPerception achieves an average effectiveness of 97%, while other state-of-the-art baseline attacks can only have 0%. We also evaluate various existing directly adaptable DNN-level defense strategies and discuss future defense directions.
To sum up, we make the following contributions:
-
•
We perform the first security analysis for the latency aspect of AD visual perception including both object detection and MOT.
-
•
We propose a novel attack framework, SlowPerception, to generate the physical-world adversarial attack for latency attack introducing a novel physically realizable attack strategy.
-
•
We evaluate SlowPerception on multiple AD perception systems in both the digital and physical domains. SlowPerception can cause AD system-level effects such as vehicle collisions and STOP sign traffic rule violations in production AD simulators.
2 Background and Related Work
In the background and related work section, we introduce visual perception in autonomous driving (AD), existing attacks on AD visual perception, and the threat model.
2.1 Visual Perception in Autonomous Driving (AD)
Visual perception in AD, hereinafter referred to as AD perception in this paper, is essential for accurately recognizing and classifying surrounding entities such as cars, pedestrians, and traffic signs. This process hinges on effective object detection and multiple object tracking (MOT) [23, 25, 26], which together determine the position and type of each object.
Object detection is critical in AD perception and primarily utilizes Deep Neural Networks (DNNs) to identify and categorize various road objects [27]. Current state-of-the-art DNN-based object detectors fall into two main categories: one-stage and two-stage detectors [28]. One-stage detectors, such as YOLO [29, 30], are valued for their rapid detection speeds, making them highly suitable for real-time applications such as AD systems. In contrast, two-stage detectors, such as Faster R-CNN [31], are known for their high accuracy. Considering the real-time operational demands of AD systems, industry-grade full-stack AD systems, such as Baidu Apollo [23] and Autoware.AI [25], typically utilize one-stage detectors. In this paper, our proposed attack methodology is adaptable to both types of object detectors. However, our evaluation primarily focuses on those with superior real-time performance. Given that we are investigating physical-world latency attacks, targeting these fast-performing detectors represents a worst-case scenario for an attacker seeking to increase latency in AD perception. Our choice makes such detectors more representative of those applied in AD systems, emphasizing the practical implications of our findings.
The current state-of-the-art MOT can be broadly classified into two main approaches: detection-based tracking, also known as tracking-by-detection, and detection-free tracking [32, 33]. Detection-based tracking utilizes object detectors to identify objects that are subsequently used as inputs for MOT, whereas detection-free tracking relies on manually cropped or marked objects as inputs [32]. Tracking-by-detection has become the predominant technique in MOT within the context of AD [32, 33, 34]. The predominance of this method is due to the dynamic nature of the driving environment, where the number and location of objects constantly change [33]. Such conditions make tracking-by-detection algorithms particularly well-suited for integration into AD systems. In tracking-by-detection, despite variations in matching strategies, there exists a common management approach for tracking [35]. This approach involves constructing and terminating the moving trajectories of objects, known as trackers. Trackers and detection boxes are assigned different statuses during the tracking management process. Specifically, unmatched detection boxes are marked as unconfirmed and will be deleted unless they are continuously detected for frames. Matched trackers are either marked to continue tracking (re-find) or remain activated based on their previous state, while unmatched trackers are marked as lost and will be deleted if they remain unassociated for frames. All trackers involved in the matching process constitute the tracker pool, with those in active states designated as outputs, which can be leveraged to significantly increase the latency of the entire AD perception. Note that detection boxes are required to be detected for frames before being added to the tracking pool. In this paper, we introduce the first physical-world latency attack on the entire representative AD perception.
2.2 Existing Attacks on AD Perception
Existing Latency Attacks on AD Perception. Latency attacks on AD perception can delay the output functions by causing a plethora of operations in various AD perception components. Prior latency attacks have concentrated on either object detection alone [14, 15, 16, 17] or the entire AD perception [13]. We present a detailed comparison of essential security properties between our attack and previous latency attacks in Table I. Among all the latency attacks on AD perception, none of them show effective latency in the physical-world settings. While only DS [14] tries a physical attack with printed adversarial patches. However, it fails to create sufficient latency to qualify as a latency attack since it only achieves the same latency (0.03 s) as the benign case and such latency falls within the acceptable latency limits for AD vehicles [18, 19]. As shown in §5.3, even state-of-the-art latency attacks cannot achieve significant latency in the physical world. This ineffectiveness is caused by their limitations on attack methodology and attack vectors.
From the attack methodology perceptive, the majority of previous latency attacks have been focused solely on object detection, which, while increasing latency, does not reach the bar to significantly impact AD system-level effects such as vehicle crashes. Even when perturbing the entire image in digital space, these increases in latency are not substantial enough. From the methodology point of view, this limitation is largely because object detection typically caps the number of detection boxes to avoid potential false positives [29, 30]. This inherent restraint significantly diminishes the effectiveness of attacks targeting object detection alone. This inherent restraint significantly diminishes the latency of attacks targeting object detection alone. To address the shortcomings, the state-of-the-art latency attack, SlowTrack (ST) [13], proposes a novel approach targeting the entire AD perception system, including both object detection and MOT. By exploiting latency vulnerabilities within the MOT, ST significantly amplifies the latency of the AD perception. This attack strategically partitions the entire image into different regions, manipulating the appearance and disappearance of phantom objects within these regions to inflate the tracking pool and, thus, the latency. While ST demonstrates high effectiveness in digital space, its efficacy in the physical world has shown limited, as demonstrated in §5.3. This limitation stems from an inefficient utilization of available attack capabilities in real-world scenarios, as analyzed in §3.2.
From the attack vector perception, the majority of prior latency attacks summarized in Table I leverage the adversarial perturbation on the whole image as the attack vector. However, this attack vector is not practical since it is impossible to perturb all the areas in the real world. Moreover, using printed patches as an attack vector such as DS [14] is limited by the physical perturbable surface area available for such patches. Thus, the increased latency is limited, unless the patch is extremely large or its distance to the camera is very close, which is difficult to execute in the physical world, especially for moving vehicles.
Thus, in this paper, we introduce a novel attack with a physically realizable attack vector (detailed in §2.3) targeting the entire AD perception to maximize latency. This approach not only achieves second-level physical latency but also inflicts significant AD system-level impact compared to previous latency attacks.
| DS [14] | PS [20] | OL [16] | SL [17] | ST [13] | Ours | |
| Entire AD perception | ✗ | ✗ | ✗ | ✗ | ✓ | ✓ |
| Physically realizable | ✗‡ | ✗ | ✗ | ✗ | ✗ | ✓ |
| AD system- level impact | ✗ | ✗ | ✗ | ✗ | ✓ | ✓ |
| Second-Level | ||||||
| physical latency | ✗ | ✗ | ✗ | ✗ | ✗ | ✓ |
| MOT transferability | ✗ | ✗ | ✗ | ✗ | ✓ | ✓ |
‡While the DS tries in physical attack, it fails to create sufficient latency to qualify as a latency attack: only achieve same latency as the benign.
Other Attacks on AD Perception Other attacks on AD can be generally classified as sensor-level attacks such as spoofing or jamming attacks on cameras [36, 15, 8] and software-level attacks such as camera object detection [10, 6, 7, 12], tracking [35, 37], and lane detection [38]. In this paper, we target vulnerabilities in the second one. However, none of these existing security analyses at the software level have specifically focused on effective latency attacks, particularly in physical-world scenarios. This paper represents the first effort to explore this dimension to fill the research gap in the study of AD system vulnerabilities.
2.3 Attack Vector and Threat Model
Attack Vector. As introduced in §2.2, the attack vectors used in the prior latency attacks are limited. However, as shown in the SlowTrack [13], dynamic perturbations can significantly increase the latency of AD perception. Given these considerations, we select to use a projector as our physical-world attack vector. This allows us to utilize existing surfaces to project the generated sets of perturbations to effectively overcome the limitations in §2.2 and inherit the advantages of dynamic perturbations.
Threat Model. In this paper, we assume a white-box threat model for object detection but a black-box threat model for multiple object tracking (MOT) within AD perception. Under the white-box model, the attacker has full knowledge of object detection, including its architecture and parameters. This approach is consistent with established the threat model in existing literature that explores adversarial vulnerabilities in AD perception systems [13, 6, 39, 38, 37, 10, 17, 20]. The use of a black-box model for MOT is based on the generally similar designs of MOT across different AD systems [34, 23, 25]. The attack can be launched physically by projecting perturbations onto the attack scene. This could be achieved by mounting a projector on an adversarial vehicle near the victim [37] or deploying an adversarial drone equipped with a projector [37, 15].
3 Design Motivation
Before our latency attack methodology, we provide our design motivations from the time complexity perspective.
3.1 AD Perception Time Complexity Analysis
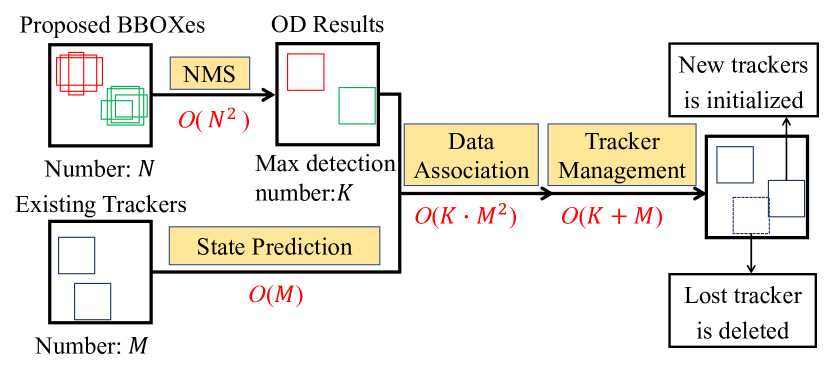
To assess the latency vulnerability of AD perception systems, we analyze the time complexity of AD perception including object detection and MOT. Given that the dimensions of the input images are fixed and that most activation values in the DNN detection model are non-zero for a majority of images, the latency is generally deterministic on these parts [13]. Thus, we choose not to emphasize the time complexity of these specific aspects in our analysis. The detailed illustration is shown in Fig. 1.
In the object detection pipeline, the non-maximum suppression (NMS) process is a common post-processing step [29, 30] for refining the proposed bounding boxes, which is obtained by the DNN detection model. Initially, NMS filters out objects that have low confidence. Subsequently, these remaining candidates are sorted based on confidence scores. Following this, NMS calculates the pairwise Intersection over Union (IoU) scores among the proposed bounding boxes. Ultimately, NMS prunes those candidates who do not meet the threshold criteria based on their IoU scores. These steps can take up to O() time complexity, where N is the total number of boxes input to NMS.
As shown in Fig. 1, MOT primarily comprises three key components: state prediction, data association, and tracker management. In state prediction, MOT typically leverages the Kalman filter to update and predict the tracker in the tracking pool. In data association, detection boxes are matched with existing trackers in the tracker pool based on their features using the Hungarian algorithm [40]. In the tracker management component, trackers are updated or removed based on the results from data association and are assigned various states. The operations involved in updating tracker states and their velocities and locations. Thus, the entire MOT has O() time complexity, where represents the number of trackers in the tracking pool, i.e., the number of existing trackers, and is the number of detection boxes.
To sum up, AD perception including object detection and MOT has the following time complexity:
-
•
Object Detection: O();
-
•
Multiple Object Tracking (MOT): O();
In the analysis of time complexity, we identify three key components vulnerable to latency attacks: the number of proposed bounding boxes (), the number of detection boxes (), and the number of trackers in the tracking pool (). AD perception is inherently limited by the maximum allowable number of detection boxes, denoted as [29, 30], which is an upper bound of . In addition, due to limitations in attack capabilities in the physical world and fixed upper limit of detection in NMS, it is challenging to significantly increase the latency on the NMS process even in the digital space [16, 20]. However, an increase in markedly escalates the latency across the entire AD perception pipeline [13]. Therefore, our strategy primarily focuses on increasing , enabling our attack to have a substantial AD system-level impact.
3.2 Opportunity of a Theoretically-Stronger Attack Design
Previous works [16, 20, 14] have sought to maximize NMS latency by blindly increasing the number of proposed boxes (). However, this approach is limited by two significant factors. First, to minimize false positives, state-of-the-art object detection typically imposes a cap on the number of detections, denoted as [29, 30, 41]. Second, in the physical world, the number of detection boxes an attacker can realistically generate is considerably less than that in the digital domain, a constraint for the physical attack capability denoted as . Given these constraints, and noting that the values of and are often comparable in these attacks—specifically -the resulting increase in time complexity can be expressed as O() + O().
SlowTrack (ST) [13] introduces a novel method to circumvent constraints, especially in the digital domain. It strategically distributes detection boxes across various regions in specific frames by dividing each frame into parts to improve the latency attack under the maximum detection constraint. However, given the attack capability constraint mentioned above, dividing into parts needs to satisfy this constraint resulting in each part being under . Thus, the number of detection boxes for the entire image is and the total number of detection boxes is . The overall time complexity of ST then becomes O() + O() = O() + O(). In the digital space, ST exhibits significant latency—particularly because typically renders its time complexity higher than previous NMS latency attacks. In the physical domain, however, its effectiveness is greatly reduced due to the inefficient use of available attack capabilities; it divides the utilizable attack surface into parts, thus reducing the number of phantom boxes generated by the perturbation to . This division represents the primary limitation of this attack, as it fails to optimally utilize the potential for inducing latency, especially under practical constraints in real-world settings.
To address the limitations of existing approaches, we find an opportunity to have a method that maximizes the use of available tracking resources by introducing as many trackers as possible into the tracking pool. By avoiding segmenting the frame into parts, we can have . To expand , the size of the tracking pool in MOT, our strategy involves creating a variety of universal perturbations. These perturbations are designed to minimize the association between detection boxes, a critical factor since any such associations can hinder the formation of new trackers. By doing this, we can have , where represents the number of perturbations, detailed further in §4.4. Thus, the total time complexity is , generally surpassing that of existing attacks. This provides an opportunity for a theoretically stronger attack, which will be detailed in §4 and evaluated in §5.
4 Methodology
In this section, we present the detailed methodology of the first physical-world universal latency attack named as SlowPerception on the entire AD perception including both object detection and multiple object tracking (MOT).
4.1 Attack Overview
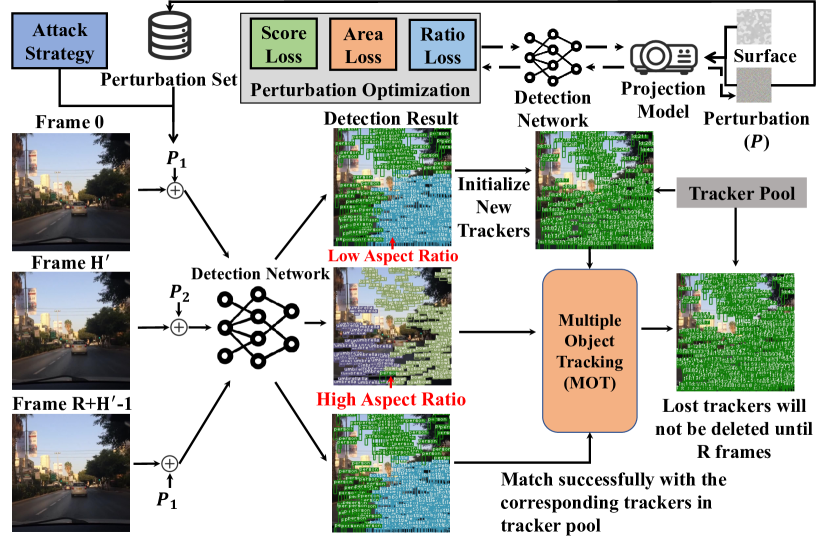
Fig. 2 presents the overview of SlowPerception. To use a projector as the attack vector §2.3, the attacker needs to train a projection model to simulate the color changes of perturbations projected onto different surfaces, which will be detailed in §4.2. This projector-based attack allows us to project a set of perturbations as a video stream, effectively increasing the latency in AD perception systems. Particularly, this impacts the tracking pool size, , as discussed in §3.1. Leveraging the functionalities of the tracker management module, we develop a universal attack strategy, detailed in Algorithm 1 and §4.3, designed specifically for latency attacks. This strategy provides a detailed mapping between frame indices and perturbation indices, which is illustrated in Fig. 2.
According to the mapping between frame indices and perturbation indices outlined in the attack strategy in §4.3, a sequence of perturbations is generated by utilizing the projection model, the detection network, and loss function detailed in §4.4. Each frame in this sequence is associated with a specific perturbation such as the perturbation that can make the bounding boxes have low or high aspect ratio as illustrated in Fig. 2. For instance, the first frame has the first perturbation projected onto it, the second frame uses the second perturbation, and so forth. By following this predetermined sequence in our attack strategy, a video composed of these specific perturbations is created. Projecting this video enables the systematic injection of perturbations into each corresponding frame, ensuring that the attack is executed as planned across the duration of the video.
Additionally, it is important to highlight that the generation of the adversarial perturbation video, as described above, does not need to occur directly within the attack scenario. Instead, the attacker can use arbitrary videos and simply project the pre-generated adversarial perturbation video within the attack environment. This capability suggests that SlowPerception can be generalized across various environments, such as different backgrounds. This flexibility enhances the practicality and applicability of SlowPerception, allowing it to be effectively deployed in diverse real-world settings without the need for on-site video generation.
4.2 Projection Model
To accurately simulate the appearance of adversarial perturbations when projected onto various surface types, we develop a projection model, denoted as , similar to prior research [12]. This model processes inputs consisting of an image of the surface and the adversarial perturbation . It then outputs the predicted color of the perturbation after projection onto the surface:
To build a dataset for training our projection model, we select a specific color and project it onto a surface, subsequently capturing the projected image using a camera. For practical purposes, each color channel , , , ranging from 0 to 255, was quantized into four discrete levels. This quantization approach reduced the total number of colors projected to , instead of exploiting the full spectrum of the color space. The data collection and model training are conducted in controlled indoor settings, which provide a stable environment to mitigate variables that are typically unmanageable in outdoor scenarios. Note that our projection model can be generalized to different real-world backgrounds and light conditions as detailed in our physical-world experiments in §5.3. Similar to prior research [12], we utilize the collected dataset to train a neural network with two hidden layers. These layers are fully connected layers and employ ReLU as the activation function.
4.3 Strategy Generation
MOT employs a tracker management module to regulate the creation and deletion of trackers. Specifically, a new tracker is added to the tracker pool once an object has been consistently detected for frames. Importantly, a newly created tracker will not be visible in the tracking results until it has been continuously detected for frames. This delay in visibility helps to filter out false positives that may be produced by object detectors. A tracker is removed from the tracker pool if no objects are associated with it for frames. This mechanism ensures that trackers are not prematurely deleted due to temporary occlusions or other interruptions, which might otherwise lead to the loss of tracking. It also helps in mitigating the impact of false negatives from the detection process, thereby enhancing the overall robustness of AD perception.
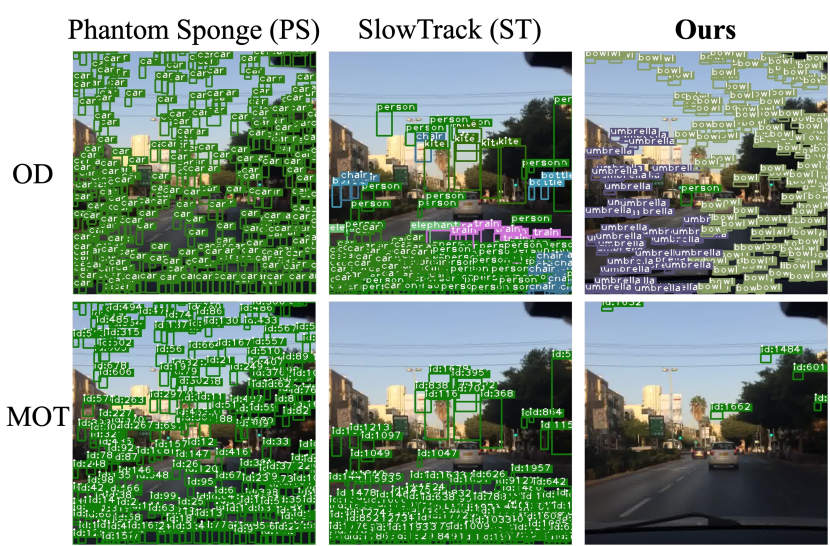
Leveraging the functionalities of the tracker management module, we develop a universal attack strategy, detailed in Algorithm 1, designed specifically for latency attacks. This strategy involves the continuous injection of detection boxes with varying shape features into the tracker pool to maximize the latency within the target tracking module. Moreover, our method effectively reduces the number of output trackers compared to prior latency attack [20, 13], as illustrated in Fig. 3. This, thus, improves the AD system-level effects such as vehicle collisions since a plethora of trackers in MOT from previous research can potentially lead the victim AD vehicle to stop before crashing.
We detail our attack strategy generation method as outlined in Algorithm 1. To effectively deploy the attack, it is crucial for attackers to know the approximate values of two critical parameters in MOT: and . Here, represents the reserved age, indicating that unmatched trackers are marked as lost and will be removed if they remain unassociated for frames. denotes the hit count, requiring detection boxes to be detected for frames before being added to the tracking pool. Through our investigation of the tracker management modules in mainstream MOT algorithms, we find that these MOTs generally employ similar parameters, which facilitates executing the attack under a black-box setting. The variations in these parameters are typically minor; the maximum value of is generally no more than 2 [42, 43, 34, 44, 45]. Additionally, instead of directly using , we employ -the number of perturbations-as a surrogate to guide the development of our attack strategies. This approach leverages the relatively consistent parameter settings across different MOTs to generate the latency attack in black-box settings.
After figuring out the important parameters, we explain the attack strategy generation process. During the initialization stage, we sequentially introduce all perturbations over frames. Additionally, perturbations with small differences in the shape features of the phantom detection boxes are avoided from being adjacent to each other when assigning indexes to perturbations. This process allows each set of detection boxes generated by these perturbations to create new trackers and inject them into the tracker pool. To maintain the presence of these trackers, we re-associate them before the trackers corresponding to each group of detection boxes are removed. This strategy helps to prevent the continuous association and output of trackers, effectively increasing the tracking pool size but reducing the number of output trackers as demonstrated in Fig. 3.
When implementing our attack in the physical world, achieving exact mapping between frame indices and perturbation indices as specified in Algorithm 1 is not crucial for the attack’s effectiveness. This flexibility has been substantiated through our physical-world experiments, as in §5.3, by directly cyclically looping the sequence of generated perturbations. Despite these imperfections, our approach consistently induces second-level latency in AD perception.
4.4 Loss Function Design
To generate universal perturbations that can successfully execute our attack method SlowPerception and overcome the limitations in prior latency attack methodology (§2.2), we propose several loss functions including (a) the score loss, (b) the bounding box area loss, and (c) the bounding box aspect ratio loss. Additionally, we use projected gradient descent (PGD) to minimize these designed loss functions under the norm constraints, enhancing attack stealthiness.
Score Loss. Increasing , the number of proposed bounding boxes introduced in §3.1, is crucial for maximizing the latency of the NMS process and retaining as many bounding boxes as possible after NMS to further increase the latency of MOT. To achieve this, the scores of the proposed bounding boxes must be greater than the NMS score threshold . Therefore, we propose the following score loss to increase the scores of the proposed bounding boxes, thus increasing :
where represents the confidence scores of the bounding boxes, represents the class scores from the object detection, is the total number of classes, represents the class score of the target class, and represents all proposed bounding boxes from the detection network. When is unknown, attackers can use a surrogate score threshold instead. To ensure robustness across different parameters and real-world scenarios, can be set higher than the commonly used . An untargeted attack selects the maximum of all class scores to find the most favorable class. Additionally, attackers can specify the target class to make SlowPerception generalize across different NMS designs [46].
Bounding Box Area Loss. To increase , the number of candidates reserved after the NMS process, it is necessary to reduce the area of the proposed bounding boxes since this reduction in area decreases the IOU between the candidates. By minimizing the area of each bounding box, the boxes generated in the region of perturbation can be positioned more tightly. This strategy is effective for increasing the number of bounding boxes in detection results, facilitating higher retention of candidates after NMS. Thus, we propose the following area loss function:
where represents all proposed bounding boxes from the detection network and and represent width and height of bounding box . and denote the width and height of the input image.
Bounding Box Aspect Ratio Loss. To increase , the size of the tracking pool in the MOT, we proposed a novel loss designed to generate various types of universal perturbations, aiming for minimal association between the detect boxes produced by these different perturbations. This minimal association is crucial because any association between detection boxes and trackers, induced by different perturbations, can impede the creation of new trackers. A key strategy involves ensuring that detection boxes generated by various perturbations exhibit distinct shape features, such as different area and aspect ratios.
An initial approach to achieve differentiation is by varying the area of bounding boxes. However, our findings indicate that minimizing bounding box area loss is super critical; reducing the area of the bounding boxes allows for a higher density of boxes within a constrained image space, which can increase the bounding box number. Thus, leveraging different areas of bounding boxes for minimal association may reduce the number of bounding boxes. Thereby, we use another effective strategy to change the aspect ratios of bounding boxes. We design an aspect ratio loss to ensure that bounding boxes closely align with a predefined aspect ratio, . This method helps maintain the distinctiveness of bounding boxes, facilitating the effective expansion of the tracking pool size in MOT systems.
To determine , the necessary first step is to obtain the upper and lower bounds of its value, essentially identifying the optimal range for . We achieve this by experimentally optimizing the following loss function to ascertain the ratio range, specifically the range of where and represent the width and height of the bounding box, respectively:
where P is the perturbation. and are hyperparameters. By assigning positive and negative values to the loss weight , we can effectively establish the upper and lower bounds of the aspect ratios that our attack can manipulate.
Next, utilizing the obtained range of , we divide it into equally spaced intervals to define distinct values for generating various perturbations (one value one perturbation). Thus, the final loss function for generating universal perturbation is defined as:
where and are the weights of the loss function.
Attack Robustness Enhancement. To enhance the effectiveness and robustness of SlowPerception especially under physical environment, the Expectation over Transformation (EoT) technique [6, 7] is employed. In our application of EoT, we impose milder color transformations on the adversarial perturbations when projected onto a surface and apply more intense color transformations to output images of projection model by the projection model, as detailed in Table IX in Appendix A. In addition to color transformations, we also introduce other variations such as the position and shape of the adversarial perturbations to enrich the distribution of image transformations, . These transformations collectively aim to simulate different environmental impacts that could affect the perturbations in physical scenarios. The specific transformation parameters and their implementation are comprehensively described in Appendix A. We formulate our final loss function with EoT:
Where is detection network, and are (perturbation) and (surface) after image transformation mentioned above.
5 Evaluation
In this section, we conduct empirical evaluations of SlowPerception.
5.1 Evaluation Methodology and Setup
AD Perception. In our evaluation, we include different AD perception encompassing YOLO v5 [29] as object detection, which is highlighted in recent adversarial attack research on AD [6] and SORT [42], BoostTrack+ [45], and OC-SORT [43] as MOT algorithms. SORT is one of the most classic Kalman Filter based MOTs in AD [26]. OC-SORT stands out as a fast MOT algorithm [43], which is suitable for evaluation on latency attacks. BoostTrack+ achieves state-of-the-art performance and ranks top 1 in MOT benchmark [47]. Note that in the evaluation, we denote the different MOT algorithm names as the different AD perception designs. We all use their default configurations.
Baseline Attacks. We include two representative baseline latency attacks: Phantom Sponges (PS) [20] and SlowTrack (ST) [13]. We leverage the official and publicly available source code for both. ST is recognized as the state-of-the-art latency attack on AD visual perception, having demonstrated superior effectiveness over existing latency attacks in its original paper. ST also claims the potential to be launched in the physical world. PS, another recently published study, employs universal perturbations.
Dataset. For our evaluation, we utilized two widely recognized datasets in AD research [35, 13, 48]: the Berkeley Deep Drive (BDD) dataset [49] and the KITTI dataset [50]. From the BDD dataset, we randomly select 10 clips, totaling 4000 images. A similar selection process is applied to the KITTI dataset, from which we chose 10 video clips comprising 2500 images. The positions for projecting perturbations in the images are determined based on our attack methodology.
Testing Hardware. Since latency is intrinsically tied to the hardware device [17, 13], we conducted tests of SlowPerception across multiple hardware settings as shown in Table II including CPU, GPU, Memory, and Disk. During the evaluation, we ensure that no other ensure that no co-located processes could introduce instability into our evaluation results.
| Name | CPU | GPU | Memory | Disk |
|---|---|---|---|---|
| H1 | Intel E5-2620 | Titan V | 128GB DDR4 | SSD 1TB |
| H2 | Intel i7-8700 | 2080 Ti | 64GB DDR4 | SSD 1TB |
| H3 | Intel 6226R | 3090 | 128GB DDR4 | SSD 2TB |
| Benign | SlowPerception | |||||||||
| AD perception | Dataset | Hardware | L-N (s) | L-M (s) | L-T (s) | #Track | L-N (s) | L-M (s) | L-T (s) | #Track |
| H1 | 0.002 | 0.003 | 0.016 | 0.014 (7) | 4.117 (1,372) | 4.145 (259) | ||||
| H2 | 0.001 | 0.002 | 0.009 | 0.008 (8) | 2.734 (1,367) | 2.750 (306) | ||||
| BDD | H3 | 0.001 | 0.002 | 0.010 | 19.2 | 0.014 (14) | 3.176 (1,588) | 3.201 (320) | 2413.5 (126) | |
| H1 | 0.002 | 0.005 | 0.023 | 0.009 (5) | 3.969 (794) | 3.993 (174) | ||||
| H2 | 0.001 | 0.003 | 0.013 | 0.005 (5) | 2.659 (886) | 2.672 (206) | ||||
| SORT | KITTI | H3 | 0.001 | 0.003 | 0.014 | 36.9 | 0.009 (9) | 3.045 (1,015) | 3.064 (219) | 2338.0 (63) |
| H1 | 0.002 | 0.004 | 0.015 | 0.034 (17) | 3.772 (943) | 3.815 (254) | ||||
| H2 | 0.001 | 0.002 | 0.009 | 0.019 (19) | 2.911 (1,456) | 2.935 (326) | 2166.2 (111) | |||
| BDD | H3 | 0.001 | 0.003 | 0.010 | 19.6 | 0.030 (30) | 3.253 (1,084) | 3.291 (329) | ||
| H1 | 0.002 | 0.006 | 0.020 | 0.020 (10) | 5.641 (940) | 5.670 (284) | ||||
| H2 | 0.001 | 0.004 | 0.013 | 0.015 (15) | 4.054 (1,014) | 4.075 (313) | ||||
| OC-SORT | KITTI | H3 | 0.001 | 0.003 | 0.011 | 40.2 | 0.018 (18) | 4.751 (1,584) | 4.777 (434) | 2345.9 (58) |
| H1 | 0.003 | 0.064 | 0.092 | 0.020 (7) | 15.670 (245) | 15.743 (171) | 3179.1 (175) | |||
| H2 | 0.001 | 0.031 | 0.044 | 0.011 (11) | 10.282 (332) | 10.306 (234) | ||||
| BDD | H3 | 0.002 | 0.045 | 0.063 | 18.2 | 0.019 (10) | 14.455 (321) | 14.496 (230) | ||
| H1 | 0.004 | 0.088 | 0.120 | 0.012 (3) | 24.700 (281) | 24.740 (206) | ||||
| H2 | 0.001 | 0.046 | 0.061 | 22.1 | 0.005 (5) | 16.058 (349) | 16.085 (264) | 3762.2 (170) | ||
| BoostTrack+ | KITTI | H3 | 0.003 | 0.074 | 0.117 | 0.011 (4) | 22.877 (309) | 22.918 (196) | ||
| Average | 0.002 | 0.022 | 0.037 | 26.0 | 0.015 (8) | 8.229 (374) | 8.260 (223) | 2700.8 (104) | ||
| Metric AD perception | SORT | OC-SORT | BoostTrack+ |
|---|---|---|---|
| L-N | 0.000 | 0.000 | 0.000 |
| L-M | 0.000 | 0.001 | 0.001 |
| L-T | 0.001 | 0.001 | 0.001 |
5.2 Attack Effectiveness
Evaluation Metrics. To assess the attack’s effectiveness, we measure latency at various stages of AD perception. The specific metrics include:
-
•
L-N: Latency in the NMS step of object detection.
-
•
L-M: Latency in MOT process.
-
•
L-T: Total latency in the entire AD perception.
All latency metrics are measured in seconds (s) units. Our evaluation focuses on these components as our attack methodology is specifically designed to increase latency in these areas. Additionally, we measure the average size of the tracking pool, denoted as #Track, which is a critical factor contributing to increased latency.
Results. The results are summarized in Table III, comparing both the benign case and our proposed attack, SlowPerception. SlowPerception can introduce an average total latency of 8.26 s in AD perception across various hardware, datasets, and AD perception designs, which is 223 times greater than the benign case. Additionally, SlowPerception introduces latency in both the NMS and MOT processes, with an average latency of around 0.02 s for NMS and 8.22 s for MOT. The latency in the MOT process is the most significant, accounting for 99.6% of the total latency since our attack aims to enlarge the tracking pool size, significantly increasing the latency of AD perception. The average tracking pool size is approximately 2700 under SlowPerception, compared to 26 in the benign case, which is 104 times larger. Furthermore, the minimum latency introduced to AD perception across different hardware, datasets, and AD perception designs is approximately 2.7 s. This level of latency is significant and intolerable for real-time systems such as AD systems. For the most advanced MOT algorithm, BoostTrack+ [45], which has high benign accuracy, SlowPerception can still introduce substantial latency, i.e., at least 10 s across different hardware and datasets. Such much higher latency compared to other MOTs on latency attacks is due to leveraging a visual embedding module to enhance benign accuracy. While it performs adequately in benign conditions, this design inherently makes it more susceptible to latency attacks. Note that in this evaluation, given the black-box threat model, we apply a single set of perturbations across various datasets, AD perception, and hardware configurations, thereby demonstrating the universality of SlowPerception.
Running Time Variance. To account for potential variability in system latency due to a range of factors, we replicate our experiments five times, following the same methodology as previous latency research [13, 17]. We then measure the variance of L-N, L-M, and L-T on the H2. The results are summarized in Table IV. As shown, the maximum variance across different settings is 0.001. The variance is negligible [13, 17] demonstrating that the latency measured in our evaluation is very stable.
Takeaway: SlowPerception can successfully induce high latency into AD perception with only a single set of universal perturbations, having an average latency of 8.3 seconds across various datasets, hardware platforms, and AD perception designs. The variance of measured latency is negligible with 0.001 maximum variance, indicating that the latency observed in our evaluation is stable.
| Phantom Sponges (PS) [20] | SlowTrack (ST) [13] | SlowPerception | ||||||||||||
| AD perception | Scenario | Hardware | L-N (s) | L-M (s) | L-T (s) | #Track | L-N (s) | L-M (s) | L-T (s) | #Track | L-N (s) | L-M (s) | L-T (s) | #Track |
| H1 | 0.002 | 0.086 | 0.103 | 0.002 | 0.121 | 0.135 | 0.002 | 1.453 | 1.469 | |||||
| H2 | 0.001 | 0.054 | 0.063 | 0.001 | 0.079 | 0.087 | 0.001 | 1.367 | 1.376 | |||||
| S1 | H3 | 0.002 | 0.058 | 0.069 | 521.7 | 0.001 | 0.087 | 0.097 | 980.2 | 0.002 | 1.313 | 1.325 | 1818.1 | |
| H1 | 0.002 | 0.085 | 0.101 | 0.002 | 0.113 | 0.127 | 0.002 | 1.668 | 1.684 | |||||
| H2 | 0.001 | 0.053 | 0.063 | 0.001 | 0.069 | 0.077 | 0.002 | 1.522 | 1.532 | |||||
| SORT | S2 | H3 | 0.002 | 0.059 | 0.070 | 515.8 | 0.001 | 0.084 | 0.094 | 911.4 | 0.002 | 1.463 | 1.474 | 1875.7 |
| H1 | 0.003 | 0.114 | 0.127 | 0.002 | 0.232 | 0.244 | 0.003 | 1.001 | 1.014 | |||||
| H2 | 0.002 | 0.073 | 0.081 | 0.001 | 0.154 | 0.161 | 0.002 | 0.790 | 0.798 | |||||
| S1 | H3 | 0.003 | 0.079 | 0.089 | 503.6 | 0.001 | 0.190 | 0.198 | 857.1 | 0.003 | 0.872 | 0.882 | 1433.1 | |
| H1 | 0.003 | 0.114 | 0.127 | 0.002 | 0.214 | 0.226 | 0.003 | 1.060 | 1.073 | |||||
| H2 | 0.002 | 0.071 | 0.079 | 0.001 | 0.140 | 0.147 | 0.002 | 0.873 | 0.881 | |||||
| OC-SORT | S2 | H3 | 0.003 | 0.077 | 0.086 | 497.7 | 0.001 | 0.170 | 0.178 | 798.4 | 0.003 | 0.957 | 0.968 | 1476.0 |
| H1 | 0.002 | 0.653 | 0.727 | 0.002 | 0.688 | 0.745 | 0.002 | 5.197 | 5.256 | |||||
| H2 | 0.001 | 0.471 | 0.506 | 0.002 | 0.465 | 0.495 | 0.001 | 3.652 | 3.684 | |||||
| S1 | H3 | 0.002 | 0.503 | 0.552 | 479.1 | 0.001 | 0.603 | 0.646 | 1050.0 | 0.002 | 4.508 | 4.560 | 2420.2 | |
| H1 | 0.002 | 0.625 | 0.701 | 0.002 | 0.542 | 0.595 | 0.002 | 5.623 | 5.683 | |||||
| H2 | 0.001 | 0.450 | 0.487 | 0.001 | 0.349 | 0.379 | 0.001 | 3.926 | 3.959 | |||||
| BoostTrack+ | S2 | H3 | 0.002 | 0.483 | 0.535 | 468.5 | 0.001 | 0.425 | 0.466 | 1013.5 | 0.002 | 4.946 | 4.998 | 2483.8 |
| Average | 0.002 | 0.228 | 0.254 | 497.7 | 0.001 | 0.263 | 0.283 | 935.1 | 0.002 | 2.430 | 2.455 | 1917.8 | ||
5.3 Attack Evaluation in the Physical World
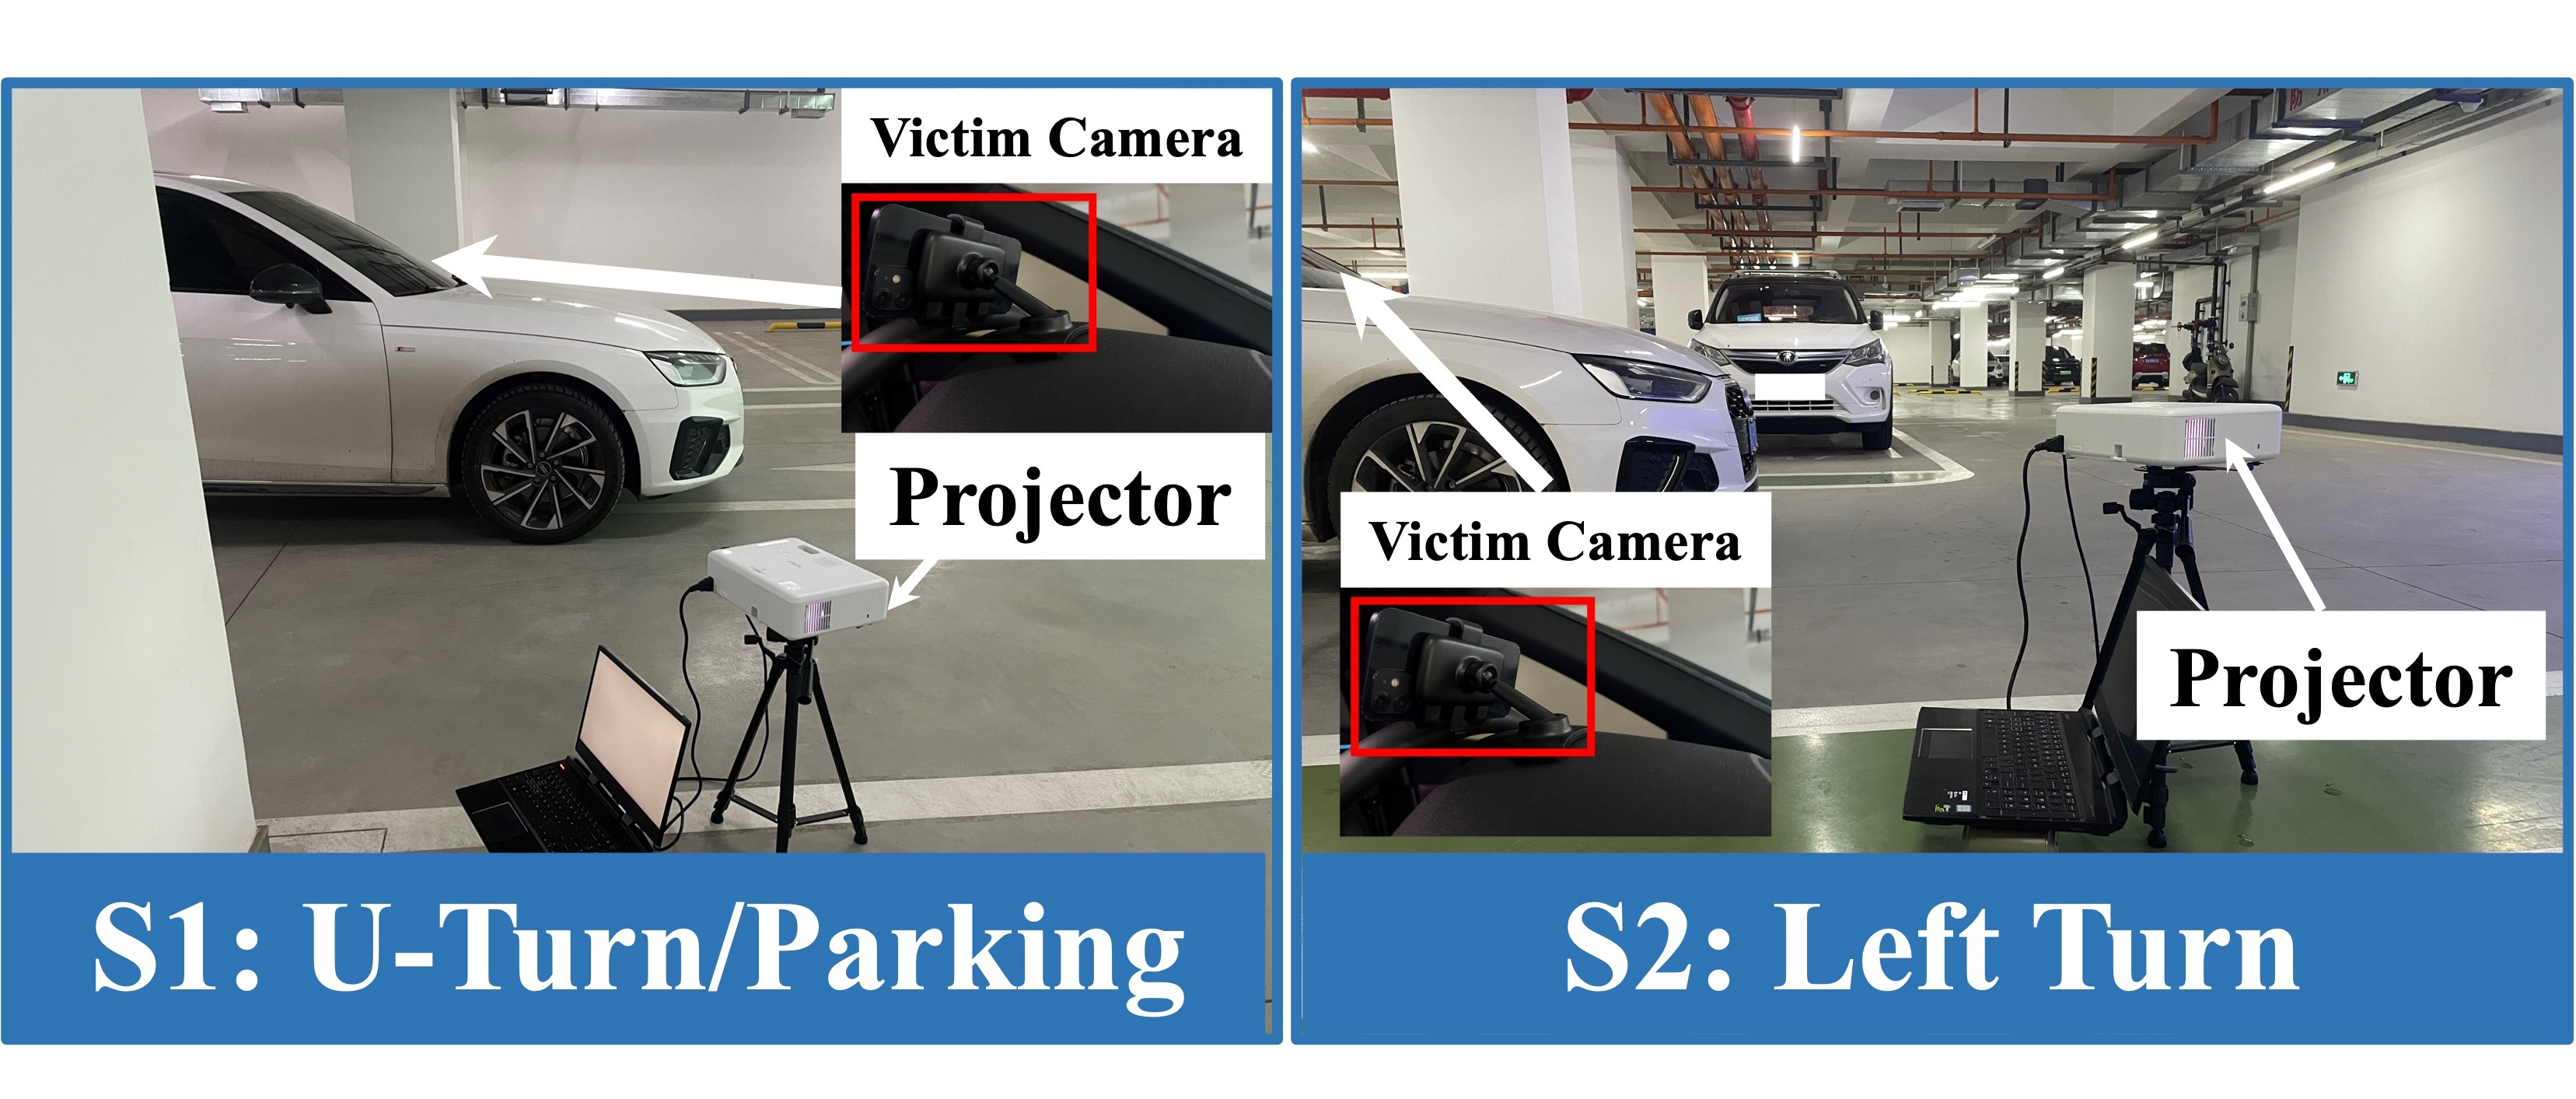
Evaluation Methodology and Setup. To assess the effectiveness of SlowPerception in the physical world, we employ an EPSON CO-FH01 projector with 1080P resolution to project perturbations within driving environments. Such a projector is cost-effective and priced at only around $500. Our evaluation targets two common scenarios found in parking lots at our institution: a U-turn scenario (S1) and a left-turn scenario (S2), as depicted in Fig. 4. These scenarios are typical ones for AD vehicles to park/turn automatically in an unsupervised manner, making these scenarios a realistic safety threat. Notably, the ambient light intensity in S2 is approximately twice that of S1. We apply the same set of universal perturbations to assess the SlowPerception’s robustness to minor changes in light conditions. We simulate the perspective of the victim AD vehicle performing routine operations (including normal driving, deceleration, and turning) and use a camera to capture videos of the vehicle in motion. The detailed EOT parameters for our experiments are listed in Table IX in Appendix A.
Results. As detailed in Table V, SlowPerception achieves an average latency of 2.5 s with 1,918 average #Track across all AD perception, scenarios, and hardware configurations. SlowPerception achieves a maximum latency of 5.7 s and a minimum of 0.8 seconds across all settings. State-of-the-art MOT BoostTrack+ consistently exhibits a latency of over 3 s. This duration exceeds the “3-second rule”, a common traffic safety guideline that requires maintaining a three-second gap between your vehicle and the one ahead to ensure sufficient reaction time and space for safe stopping [51]. Moreover, 99% of the latency is from the MOT, while only 1% is from the NMS. These findings are consistent with those observed in the digital space, underscoring that our attack, which primarily aims to increase the size of the tracking pool, thus significantly exacerbates latency in AD perception systems. Note that although latency decreases when transitioning from the digital to the physical domain, SlowPerception still achieves latency at the level of seconds on AD perception. This significant latency will be further evaluated within an AD system to fully understand system-level impact in §5.4.
Comparison with Baseline Attacks in Physical World. To understand the performance of SlowPerception compared to that of baseline attacks, we compare it PS [20] and ST [13] detailed in §5.1. To the best of our knowledge, SlowPerception is the first physical-world latency attack against AD perception. Therefore, we have adapted these two digital-domain latency attacks with our attack robustness enhancement method whose parameters are consistent with our attack, enabling them to function in the physical world. Besides this, we use the settings and hyperparameters recommended by the authors. We follow the same methodology and setup as our physical-world experiment to capture the data for baseline comparison. After the double-blind review process, we will make our data publicly available to benefit the research community in this domain.
The results are also summarized in Table V. SlowPerception significantly outperforms both PS and ST in terms of overall latency across various AD perception scenarios and hardware configurations, achieving latency that is 10 and 9 times greater, respectively. In terms of the tracking pool size (#Track), SlowPerception is 4 times larger than that of PS and 2 times larger than ST, indicating that our attack strategy significantly surpasses existing baseline attacks in contributing to latency, which can be a potential root cause of why SlowPerception can fundamentally achieve second-level latency compared to other attacks. Moreover, our L-N values are comparable to those of prior attacks, demonstrating that SlowPerception achieves similar levels of latency on NMS as previous methods. However, the significant increase in latency within MOT substantially enhances the effectiveness of our attack in the physical world. For BoostTrack+, ST generates roughly twice as many trackers compared to PS, yet both methods result in similar L-T. This is primarily because BoostTrack+ employs a method where it extracts the embedding features for each detection box, which is one of the most time-consuming parts. The effectiveness of the ST method can be significantly diminished when the MOT incorporates complex post-processing on the detection results. The reduction in the number of trackers generated in the physical world to 71% of those in the digital domain can be attributed to several constraints inherent in real-world scenarios. The limited attack surface available in the physical world plays a significant role, with environmental factors such as lighting conditions, background variability, and camera angles further impacting the effectiveness of the attack. These physical constraints lead to less effectiveness of adversarial perturbations compared to the controlled conditions of the digital domain.
Takeaway: SlowPerception effectively achieves second-level latency in the physical world using universal perturbations, with an average latency of 2.5 s across various AD perception systems, scenarios, and hardware configurations. Additionally, SlowPerception significantly outperforms the state-of-the-art latency attacks in physical-world setup, surpassing PS [20] and ST[13] by 10 and 9 times, respectively.
| Lane changing | STOP sign | |||||
|---|---|---|---|---|---|---|
| Speed (mph) | 25 | 30 | 35 | 25 | 30 | 35 |
| PS | 0% | 0% | 0% | 0% | 0% | 0% |
| ST | 0% | 0% | 0% | 0% | 0% | 20% |
| Ours | 80% | 100% | 100% | 100% | 100% | 100% |
5.4 System-Level Attack Effect Evaluation
Evaluation Methodology and Setup. To study the AD system-level attack effects of SlowPerception, we perform an attack evaluation on two common driving scenarios. The first scenario considers a lane-changing situation where a preceding vehicle is merging into the lane where the victim AD vehicle is located. We employ Baidu Apollo [23] and LGSVL simulator [24] for this evaluation. The attack objective is to inject latency into the victim AD vehicle, thereby preventing it from timely changing lanes or braking, and causing it to collide with the front vehicle, resulting in a severe safety accident. The second scenario is a STOP sign scenario, where the victim vehicle is driving toward the STOP sign. We use Pass platform [26, 52], a system-driven evaluation platform for AD safety and security, including an AD system and Carla simulator [22]. The attack goal is to make the victim AD vehicle violate the STOP sign traffic rule by the injected latency, which may lead to safety issues in the physical world. We use three common speeds within the STOP sign area [7]: 25 mph, 30 mph, and 35 mph on a sunny day. To enhance the perception fidelity of simulators, we model the physical-world latency and inject it into the AD perception, similar to prior research [7]. We calculate the average latency for OC-SORT to inject into AD perception, which exhibits the lowest latency among tested perceptions, representing a worst-case scenario evaluation from the attacker’s perspective. Ten runs for each scenario and each speed. We compare SlowPerception with the two baselines: PS [20] and ST [13].
Results. The outcomes of our experiments are summarized in Table VI. As demonstrated, SlowPerception achieves an impressive 97% average in AD system-level effects, significantly outperforming prior attacks like PS and ST, which both register 0%. This marked difference stems from SlowPerception ’s ability to inject latency at the second-level, whereas the others can only manage approximately 0.3 seconds.
Takeaway: SlowPerception can induce AD system-level impacts, like vehicle collisions and STOP sign traffic rule violations, with 97% average effectiveness in AD simulators.
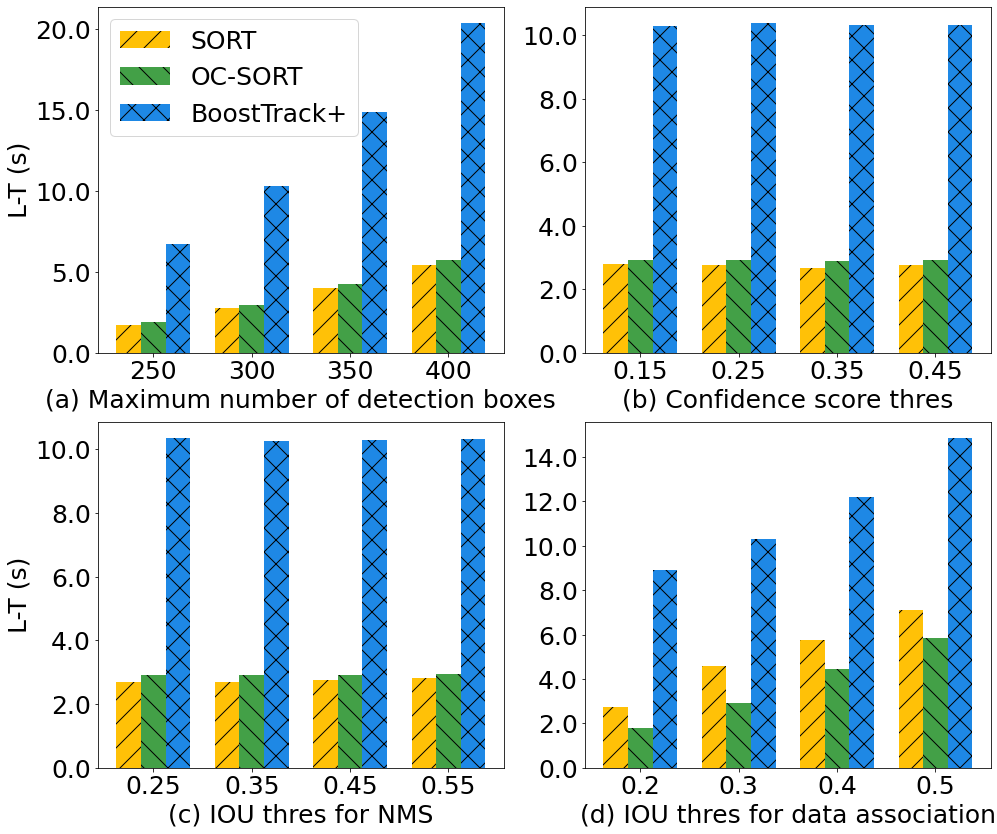
5.5 Attack Effectiveness across Different Parameters in AD Perception
Evaluation Methodology and Setup. The effectiveness of latency attacks is primarily influenced by various parameters in AD perception, including object detection and MOT [13, 17]. Key parameters include: the confidence score threshold in object detection, which determines whether an object is detected; the maximum number of detection boxes, which is a critical constraint for latency attacks, as discussed in §4 and determines the theoretical time complexity of AD perception, as explained in §3.1; IOU threshold for NMS, which significantly affects latency during the NMS process; IOU threshold for data association, which substantially influences latency in the MOT process. To evaluate the impact of these parameters, we vary their values and measure the total time (L-T) in seconds, as introduced in §5.2. These evaluations are conducted on the H2 hardware (specified in Table II) using the BDD dataset.
Results. The results depicted in Fig.5 demonstrate that variations in the confidence score threshold and the IOU threshold for NMS have a negligible impact on the latency of AD perception. Conversely, the maximum number of detection boxes and the IOU threshold for data association in MOT affect latency. These factors are closely tied to the tracking pool size, which in turn influences the time complexity, as analyzed in §3 and §4. Despite their impact on latency, SlowPerception consistently maintains a minimum latency of 1.7 s across all MOT settings and reasonable parameter ranges. This stability across different threshold parameters suggests that simply changing thresholds is insufficient as a defensive measure against SlowPerception. Moreover, fine-tuning these thresholds often substantially diminishes the system’s performance in benign scenarios. These findings underscore SlowPerception can be generalized to different reasonable threshold settings.
Takeaway: SlowPerception demonstrates effectiveness across various critical and reasonable latency-related parameters in AD perception. It consistently achieves a minimum latency of 1.7 s across different MOT and parameters.
| L-T (s) / #Track | |||
|---|---|---|---|
| YOLOv3 | YOLOv4 | YOLOv5 | |
| YOLOv5 | 0.021 / 24.6 | 0.029 / 17.8 | 4.145 / 2413.5 |
| 0.025 / 63.3 | 8.733 / 2941.8 | 3.635 / 2307.7 | |
| 4.370 / 2388.2 | 7.000 / 2743.1 | 3.058 / 2199.0 | |
5.6 Black-Box Attack Transferability Evaluation
Evaluation Methodology and Setup. We evaluate the attack transferability across different AD perceptions including object detection. For object detection, we select SORT as the MOT algorithm and employ three representative object detectors in AD systems: YOLOv3, YOLOv4, and YOLOv5. This setup mirrors configurations used in prior research [20, 16]. To enhance transferability, we also include an ensemble attack strategy against multiple object detectors, using the following configurations as source models: : YOLOv5 + YOLOv4; : YOLOv5 + YOLOv4 + YOLOv3. This methodology is widely recognized for improving attack transferability on object detectors [53, 54, 55]. In this paper, we generate the attack under a black-box threat model for MOT, as detailed in §2.3. Thus, all evaluation results presented in this paper using MOT are conducted under black-box conditions, using a single set of perturbations. This ensures that the results are inherently black-box results, indicating their transferability across different MOTs.
Results of Attack Transferability. The results, summarized in Table VII, demonstrate that the ensemble attack strategy can significantly improve attack transferability. Generating perturbations based on a single model compared to the ensemble attack, however, presents challenges in transferring to other object detection models in terms of latency impact—0.025 s versus 4.470 s. Employing more models in the ensemble can enhance transferability but may compromise the effectiveness of the attack. For example, when YOLOv5 is ensembled with other models, the latency effects can successfully transfer to these models with an approximately 200 times increase in latency. However, when evaluated directly on YOLOv5, the latency is 19% lower than in white-box settings. This indicates a trade-off between achieving broad transferability and maintaining a high impact in targeted white-box models on ensemble attack strategy.
Takeaway: Employing an ensemble attack method, SlowPerception effectively achieves transferable latency impacts across different object detectors in AD perception under black-box settings.
| w/o | w/o | Strategy in ST | SlowPerception | |
|---|---|---|---|---|
| L-T (s) | 0.018 | 1.275 | 3.103 | 3.201 |
| #Track | 158.9 | 1886.1 | 2389.1 | 2413.5 |
| Track-O | 0.1 | 29.6 | 13.2 | 3.9 |
5.7 Ablation Study
Evaluation Methodology and Setup. We evaluate the effectiveness of our designed loss function and the new attack strategy. In evaluating the loss function, we iteratively remove each component to quantify its individual impact on attack performance. For the attack strategy evaluation, we replaced our newly proposed attack strategy with the strategy in ST [13]. These evaluations are conducted on the H3 hardware using the BDD dataset. We use L-T, #Track, and Track-O (output tracker number of AD perception) as evaluation metrics. Track-O is measuring the effect introduced in Fig. 3.
Results. The results in Table VIII highlight the indispensability of all loss designs in achieving high attack effectiveness. Notably, the performs as the most pivotal element in enhancing attack effects. In the absence of , the L-T experiences reductions of approximately 60%. Our improved attack strategy yields a 71% reduction in Track-O, highlighting its effectiveness in reducing the number of output trackers and thus potentially improving the AD system-level effects. Moreover, contributes to reducing the Track-O as well, as minimizing the area of detection boxes helps prevent mis-associations between boxes generated by different perturbations.
6 Discussion
6.1 Defense
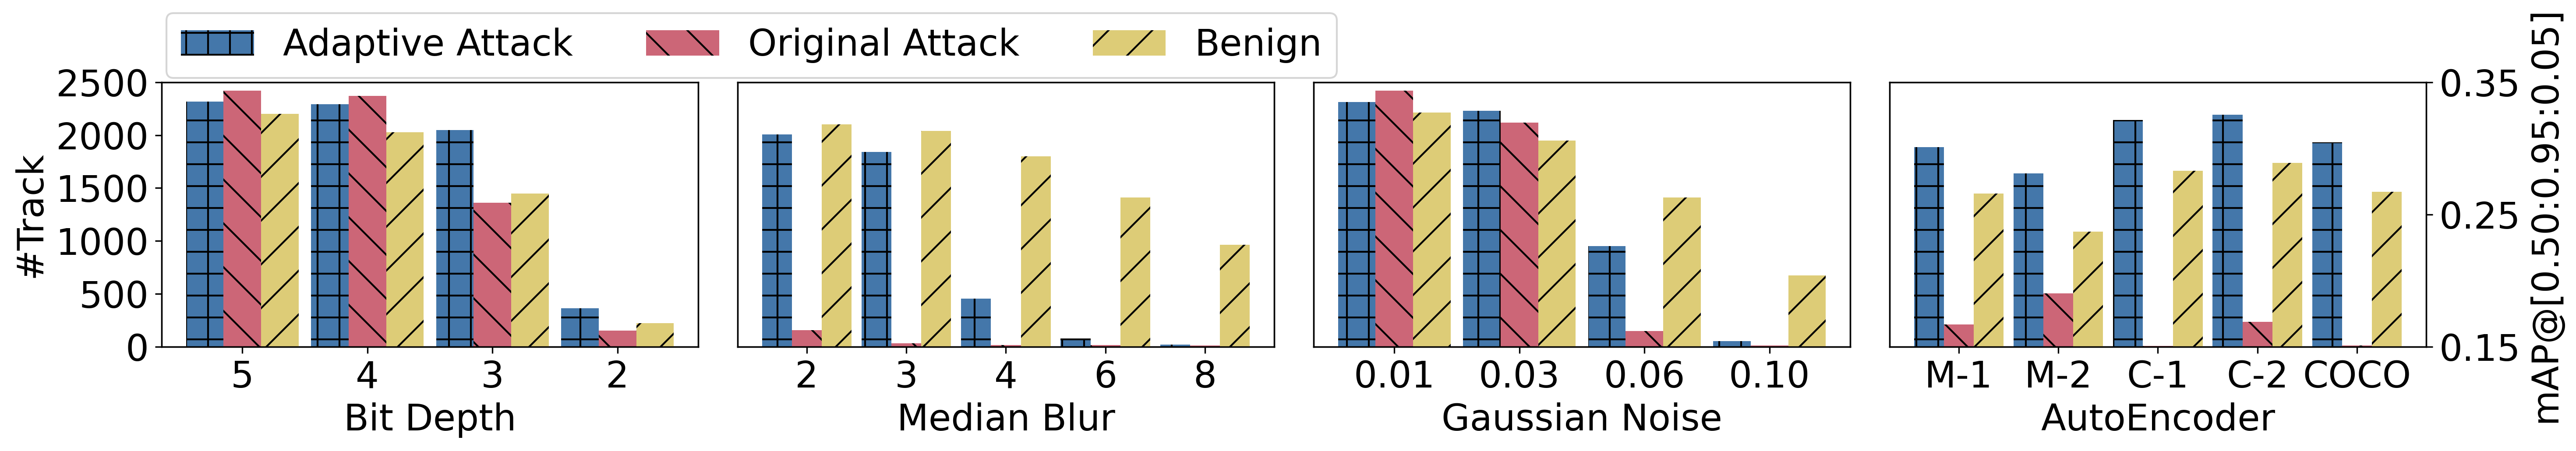
DNN-Based Defense. In the recent arms race between adversarial attacks and defenses in the field of DNN, a variety of defense or mitigation techniques have been proposed, such as input transformation [56, 57] and certified robustness [21, 58]. To date, no defense has been specifically designed to defend against latency attacks. Therefore, as a best effort and following prior research [8, 39, 38], we evaluate several adaptable DNN integrity defense methods on SlowPerception, including bit depth reduction [57], median blur [57], gaussian noise [59], and AutoEncoder [56], to understand their effect on latency attack. It is important to note that all these adaptable defenses are generally vulnerable to adaptive attacks. Thus, we also included an adaptive attack scenario where we assume that the attacker has integrated the defense method into the attack generation optimization pipeline, similar to strategies documented in prior works [60, 61]. The effectiveness of these defenses is measured by the size of the tracking pool (#Track), which is crucial for latency, while the impact on benign performance is assessed using the mean Average Precision (mAP) on the BDD dataset with SORT. The results are summarized in Fig. 6. Some defenses, such as median blur and AutoEncoders, can reduce the tracking pool size to around 500 in original latency attack scenarios. However, these defenses are almost entirely vulnerable to adaptive attacks, reaching similar tracking pool sizes as the results in Table III. In more extreme cases, such as with small bit depth and large Gaussian noise, although the adaptive attack may be rendered almost ineffective due to low #Track, the benign mAP is also significantly reduced. This severely impacts system performance and inevitably raises serious safety concerns in safety-critical applications like AD [8]. Therefore, these defenses may not be practically applicable given their considerable drawbacks.
Restriction on Tracking Pool Size (#Track). Imposing a threshold on the tracking pool size, #Track, can serve as an effective defense against latency attacks. This is primarily because the majority of latency in AD perception originates from the MOT process, and #Track is directly linked to latency, as evidenced in §5.2. By setting a limit on the tracking pool size, it may be possible to mitigate the impact of SlowPerception. However, implementing such a threshold raises concerns. For instance, the effect on benign performance must be carefully considered, as overly restrictive thresholds might impede the system’s ability to track legitimate objects effectively. Additionally, determining the optimal threshold is crucial. It requires a delicate balance to ensure it is neither too high, which would be ineffective in preventing attacks, nor too low, which could degrade system performance under normal operating conditions. Addressing these challenges—assessing the impact on benign cases and setting an appropriate threshold—requires thorough evaluation and analysis. We designate the exploration of these aspects as avenues for future research.
Sensor Fusion Based Defence. Multi-Sensor Fusion (MSF) can be a potential solution for SlowPerception in AD such as fusing with LiDAR or RADAR. However, MSF-based defense may significantly increase the cost of the AD system and may not fundamentally solve this attack [39]. Thus, we leave these as future directions to explore.
6.2 Limitation and Future Work
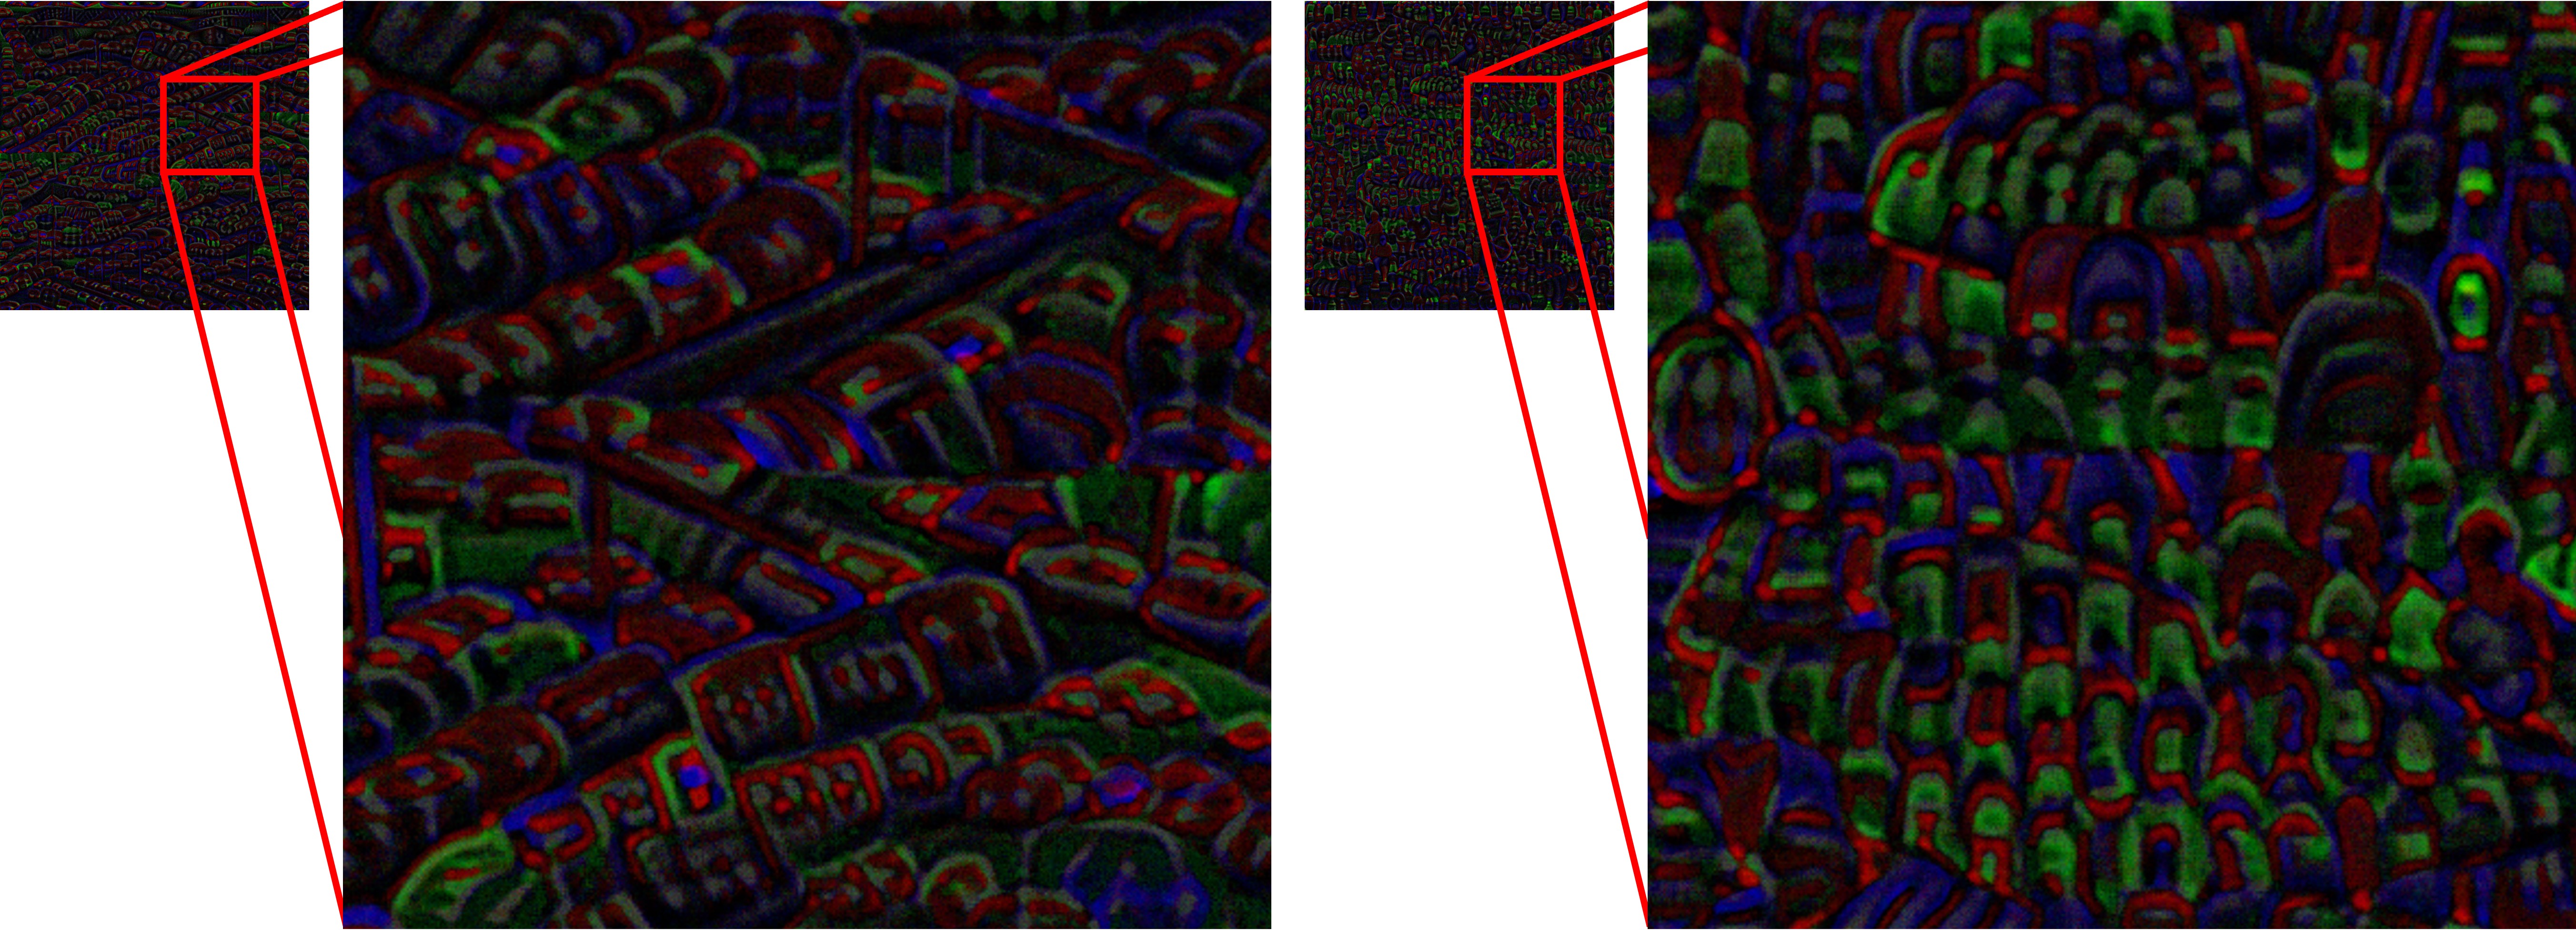
Stealthiness. In this paper, our focus has not extended to enhancing attack stealthiness. We provide visualizations of two adversarial perturbations used for projection in Fig. 7. The perturbation on the left is designed to create detection boxes with high aspect ratios horizontally, whereas the perturbation on the right aims to create detection boxes with low aspect ratios vertically. Recognizing the importance of stealthiness in adversarial perturbation, we plan to systematically explore and improve stealthiness in future work.
End-to-End Physical-World Evaluation. In this study, we do not conduct an end-to-end attack evaluation on an actual AD vehicle in the physical world due to cost and safety considerations. Instead, we assess the system-level impacts on AD using production-grade simulators. The comprehensive evaluation of the physical world remains a topic for future research.
Attack Vector. Similar to other projector-based physical-world attacks, SlowPerception is constrained by environmental brightness and the availability of surfaces suitable for projection [37, 17]. We leave overcoming the attack vector limitations as a future work such as systematically exploring advanced projectors and investigating the feasibility of projecting perturbations onto the road surface.
6.3 Ethics
We address the ethical considerations associated with our physical-world evaluation. Our experiments are conducted within a parking lot at our institution, selected for its controlled environment. This setting enables us to conduct tests in isolation, ensuring there is no unintended exposure to bystanders or traffic on public roads. Such precautions effectively avoid the risk of unintended consequences affecting the uninvolved public.
7 Conclusion
In this paper, we introduce SlowPerception, the first physical-world universal latency attack targeting entire AD perception using a projector-based perturbation as the attack vector. SlowPerception strategically generates numerous phantom objects with varied shape features on physically perturbable surfaces within the environment. We conduct evaluations on different AD perceptions using both representative AD datasets and physical-world scenarios. SlowPerception successfully induces second-level latency in the physical world, achieving an average latency of 2.5 seconds across various AD perception systems, scenarios, and hardware configurations. We also include an evaluation of AD system-level effects such as vehicle collision and STOP sign traffic rule violation focusing on latency impacts achieving a 97% average rate. We believe our findings and insights can serve as a catalyst for further research in this area, ultimately enhancing the robustness of AD systems.
References
- [1] “WAYMO ONE. The future of transportation is here.” https://waymo.com/waymo-one/, 2024.
- [2] E. Price, “Waymo Driverless Taxis Now Complete More Than 50K Rides a Week,” https://www.pcmag.com/news/waymos-driverless-taxis-now-complete-more-than-50k-rides-a-week, 2024.
- [3] Tesla, “Future of Driving,” https://www.tesla.com/autopilot.
- [4] L. SMILEY, “The Legal Saga of Uber’s Fatal Self-Driving Car Crash Is Over,” https://www.wired.com/story/ubers-fatal-self-driving-car-crash-saga-over-operator-avoids-prison/, 2023.
- [5] P. Zhang, “Taiwanese star Jimmy Lin injured in Tesla crash,” https://cnevpost.com/2022/07/22/taiwanese-star-jimmy-lin-injured-in-tesla-crash-report-says/, 2022.
- [6] W. Jia, Z. Lu, H. Zhang, Z. Liu, J. Wang, and G. Qu, “Fooling the Eyes of Autonomous Vehicles: Robust Physical Adversarial Examples Against Traffic Sign Recognition Systems,” in NDSS, 2022.
- [7] N. Wang, Y. Luo, T. Sato, K. Xu, and Q. A. Chen, “Does Physical Adversarial Example Really Matter to Autonomous Driving? Towards System-Level Effect of Adversarial Object Evasion Attack,” in Proceedings of the IEEE/CVF International Conference on Computer Vision (ICCV), October 2023, pp. 4412–4423.
- [8] W. Zhu, X. Ji, Y. Cheng, S. Zhang, and W. Xu, “TPatch: A Triggered Physical Adversarial Patch,” in USENIX Security, 2023.
- [9] C. He, X. Ma, B. B. Zhu, Y. Zeng, H. Hu, X. Bai, H. Jin, and D. Zhang, “DorPatch: Distributed and Occlusion-Robust Adversarial Patch to Evade Certifiable Defenses,” in NDSS, 2024.
- [10] Y. Zhao, H. Zhu, R. Liang, Q. Shen, S. Zhang, and K. Chen, “Seeing isn’t Believing: Towards More Robust Adversarial Attack Against Real World Object Detectors,” in Proceedings of the 2019 ACM SIGSAC conference on computer and communications security, 2019, pp. 1989–2004.
- [11] T. Sato, S. H. V. Bhupathiraju, M. Clifford, T. Sugawara, Q. A. Chen, and S. Rampazzi, “Invisible Reflections: Leveraging Infrared Laser Reflections to Target Traffic Sign Perception,” in NDSS, 2024.
- [12] G. Lovisotto, H. Turner, I. Sluganovic, M. Strohmeier, and I. Martinovic, “SLAP: Improving Physical Adversarial Examples with Short-Lived Adversarial Perturbations,” in 30th USENIX Security Symposium (USENIX Security 21), 2021, pp. 1865–1882.
- [13] C. Ma, N. Wang, Q. A. Chen, and C. Shen, “SlowTrack: Increasing the Latency of Camera-Based Perception in Autonomous Driving Using Adversarial Examples,” in Proceedings of the AAAI Conference on Artificial Intelligence, vol. 38, no. 5, 2024, pp. 4062–4070.
- [14] D. Wang, C. Li, S. Wen, Q.-L. Han, S. Nepal, X. Zhang, and Y. Xiang, “Daedalus: Breaking Nonmaximum Suppression in Object Detection via Adversarial Examples,” IEEE Transactions on Cybernetics, vol. 52, no. 8, pp. 7427–7440, 2021.
- [15] B. Nassi, Y. Mirsky, D. Nassi, R. Ben-Netanel, O. Drokin, and Y. Elovici, “Phantom of the ADAS: Securing Advanced Driver-Assistance Systems from Split-Second Phantom Attacks,” in ACM CCS, 2020.
- [16] E.-C. Chen, P.-Y. Chen, I. Chung, C.-r. Lee et al., “Overload: Latency Attacks on Object Detection for Edge Devices,” arXiv preprint arXiv:2304.05370, 2023.
- [17] H. Liu, Y. Wu, Z. Yu, Y. Vorobeychik, and N. Zhang, “SlowLiDAR: Increasing the Latency of LiDAR-Based Detection Using Adversarial Examples,” in Proceedings of the IEEE/CVF Conference on Computer Vision and Pattern Recognition, 2023, pp. 5146–5155.
- [18] Y. Luo, “Time Constraints and Fault Tolerance in Autonomous Driving Systems,” Tech. rep, Tech. Rep, 2019.
- [19] S.-C. Lin, Y. Zhang, C.-H. Hsu, M. Skach, M. E. Haque, L. Tang, and J. Mars, “The Architectural Implications of Autonomous Driving: Constraints and Acceleration,” in Proceedings of the Twenty-Third International Conference on Architectural Support for Programming Languages and Operating Systems, 2018, pp. 751–766.
- [20] A. Shapira, A. Zolfi, L. Demetrio, B. Biggio, and A. Shabtai, “Phantom Sponges: Exploiting Non-Maximum Suppression to Attack Deep Object Detectors,” in Proceedings of the IEEE/CVF Winter Conference on Applications of Computer Vision, 2023, pp. 4571–4580.
- [21] L. Li, T. Xie, and B. Li, “SoK: Certified Robustness for Deep Neural Networks,” in 2023 IEEE symposium on security and privacy (SP). IEEE, 2023, pp. 1289–1310.
- [22] A. Dosovitskiy, G. Ros, F. Codevilla, A. Lopez, and V. Koltun, “CARLA: An open urban driving simulator,” in Proceedings of the 1st Annual Conference on Robot Learning, 2017, pp. 1–16.
- [23] “Baidu Apollo,” http://apollo.auto, 2022.
- [24] G. Rong, B. H. Shin, H. Tabatabaee, Q. Lu, S. Lemke, M. Možeiko, E. Boise, G. Uhm, M. Gerow, S. Mehta et al., “LGSVL Simulator: A High Fidelity Simulator for Autonomous Driving,” in 2020 IEEE 23rd International conference on intelligent transportation systems (ITSC). IEEE, 2020, pp. 1–6.
- [25] S. Kato, S. Tokunaga, Y. Maruyama, S. Maeda, M. Hirabayashi, Y. Kitsukawa, A. Monrroy, T. Ando, Y. Fujii, and T. Azumi, “Autoware on Board: Enabling Autonomous Vehicles with Embedded Systems,” in 2018 ACM/IEEE 9th International Conference on Cyber-Physical Systems (ICCPS). IEEE, 2018, pp. 287–296.
- [26] J. Shen, N. Wang, Z. Wan, Y. Luo, T. Sato, Z. Hu, X. Zhang, S. Guo, Z. Zhong, K. Li et al., “SoK: On the Semantic AI Security in Autonomous Driving,” arXiv preprint arXiv:2203.05314, 2022.
- [27] M. Carranza-García, J. Torres-Mateo, P. Lara-Benítez, and J. García-Gutiérrez, “On the Performance of One-Stage and Two-Stage Object Detectors in Autonomous Vehicles Using Camera Data,” Remote Sensing, vol. 13, no. 1, p. 89, 2020.
- [28] Z. Zou, K. Chen, Z. Shi, Y. Guo, and J. Ye, “Object Detection in 20 Years: A Survey,” Proceedings of the IEEE, 2023.
- [29] G. Jocher, “YOLOv5,” https://github.com/ultralytics/yolov5, 2022.
- [30] J. Redmon and A. Farhadi, “YOLOv3: An Incremental Improvement,” arXiv preprint arXiv:1804.02767, 2018.
- [31] S. Ren, K. He, R. Girshick, and J. Sun, “Faster R-CNN: Towards Real-Time Object Detection with Region Proposal Networks,” Advances in neural information processing systems, vol. 28, 2015.
- [32] W. Luo, J. Xing, A. Milan, X. Zhang, W. Liu, and T.-K. Kim, “Multiple object tracking: A literature review,” Artificial intelligence, vol. 293, p. 103448, 2021.
- [33] A. Dhar, “Object Tracking for Autonomous Driving Systems,” Ph.D. dissertation, Master’s thesis, EECS Department, University of California, Berkeley, 2020.
- [34] Y. Zhang, P. Sun, Y. Jiang, D. Yu, F. Weng, Z. Yuan, P. Luo, W. Liu, and X. Wang, “ByteTrack: Multi-Object Tracking by Associating Every Detection Box,” in European Conference on Computer Vision. Springer, 2022, pp. 1–21.
- [35] Y. J. Jia, Y. Lu, J. Shen, Q. A. Chen, H. Chen, Z. Zhong, and T. W. Wei, “Fooling Detection Alone is Not Enough: Adversarial Attack against Multiple Object Tracking,” in International Conference on Learning Representations (ICLR’20), 2020.
- [36] C. Yan, W. Xu, and J. Liu, “Can You Trust Autonomous Vehicles: Contactless Attacks against Sensors of Self-driving Vehicle,” Def Con, vol. 24, no. 8, p. 109, 2016.
- [37] R. Muller, Y. Man, Z. B. Celik, M. Li, and R. Gerdes, “Physical Hijacking Attacks against Object Trackers,” in Proceedings of the 2022 ACM SIGSAC Conference on Computer and Communications Security, 2022, pp. 2309–2322.
- [38] T. Sato, J. Shen, N. Wang, Y. Jia, X. Lin, and Q. A. Chen, “Dirty Road Can Attack: Security of Deep Learning based Automated LaneCentering under Physical-World Attack,” in 30th USENIX Security Symposium (USENIX Security 21), 2021, pp. 3309–3326.
- [39] Y. Cao, N. Wang, C. Xiao, D. Yang, J. Fang, R. Yang, Q. A. Chen, M. Liu, and B. Li, “Invisible for both Camera and LiDAR: Security of Multi-Sensor Fusion based Perception in Autonomous Driving Under Physical-World Attacks,” in 2021 IEEE Symposium on Security and Privacy (SP). IEEE, 2021, pp. 176–194.
- [40] “Hungarian algorithm,” https://en.wikipedia.org/wiki/Hungarian_algorithm, 2024.
- [41] K. Chen, J. Wang, J. Pang, Y. Cao, Y. Xiong, X. Li, S. Sun, W. Feng, Z. Liu, J. Xu, Z. Zhang, D. Cheng, C. Zhu, T. Cheng, Q. Zhao, B. Li, X. Lu, R. Zhu, Y. Wu, J. Dai, J. Wang, J. Shi, W. Ouyang, C. C. Loy, and D. Lin, “MMDetection: Open mmlab detection toolbox and benchmark,” arXiv preprint arXiv:1906.07155, 2019.
- [42] A. Bewley, Z. Ge, L. Ott, F. Ramos, and B. Upcroft, “Simple Online and Realtime Tracking,” in 2016 IEEE international conference on image processing (ICIP). IEEE, 2016, pp. 3464–3468.
- [43] J. Cao, J. Pang, X. Weng, R. Khirodkar, and K. Kitani, “Observation-Centric SORT: Rethinking SORT for Robust Multi-Object Tracking,” in Proceedings of the IEEE/CVF Conference on Computer Vision and Pattern Recognition, 2023, pp. 9686–9696.
- [44] K. Yi, K. Luo, X. Luo, J. Huang, H. Wu, R. Hu, and W. Hao, “Ucmctrack: Multi-object tracking with uniform camera motion compensation,” in Proceedings of the AAAI Conference on Artificial Intelligence, vol. 38, no. 7, 2024, pp. 6702–6710.
- [45] V. D. Stanojevic and B. T. Todorovic, “BoostTrack: boosting the similarity measure and detection confidence for improved multiple object tracking,” Machine Vision and Applications, vol. 35, no. 3, pp. 1–15, 2024.
- [46] “Non-Maximum Suppression,” https://github.com/ultralytics/yolov5/tree/master/utils/general.py#L1007, 2022.
- [47] A. Milan, L. Leal-Taixé, I. Reid, S. Roth, and K. Schindler, “MOT16: A benchmark for multi-object tracking,” arXiv:1603.00831 [cs], Mar. 2016, arXiv: 1603.00831. [Online]. Available: http://arxiv.org/abs/1603.00831
- [48] Y. Cao, C. Xiao, B. Cyr, Y. Zhou, W. Park, S. Rampazzi, Q. A. Chen, K. Fu, and Z. M. Mao, “Adversarial Sensor Attack on LiDAR-based Perception in Autonomous Driving,” in ACM CCS, 2019.
- [49] F. Yu, H. Chen, X. Wang, W. Xian, Y. Chen, F. Liu, V. Madhavan, and T. Darrell, “BDD100K: A Diverse Driving Dataset for Heterogeneous Multitask Learning,” in Proceedings of the IEEE/CVF conference on computer vision and pattern recognition, 2020, pp. 2636–2645.
- [50] A. Geiger, P. Lenz, C. Stiller, and R. Urtasun, “Vision meets Robotics: The KITTI Dataset,” International Journal of Robotics Research (IJRR), 2013.
- [51] DMV, “CALIFORNIA DRIVER’S HANDBOOK,” https://www.dmv.ca.gov/portal/handbook/california-driver-handbook/safe-driving/, 2024.
- [52] Z. Hu, J. Shen, S. Guo, X. Zhang, Z. Zhong, Q. A. Chen, and K. Li, “PASS: A System-Driven Evaluation Platform for Autonomous Driving Safety and Security,” in NDSS Workshop on Automotive and Autonomous Vehicle Security (AutoSec), 2022.
- [53] K. Xu, G. Zhang, S. Liu, Q. Fan, M. Sun, H. Chen, P.-Y. Chen, Y. Wang, and X. Lin, “Adversarial T-Shirt! Evading Person Detectors in a Physical World,” in Computer Vision–ECCV 2020: 16th European Conference, Glasgow, UK, August 23–28, 2020, Proceedings, Part V 16. Springer, 2020, pp. 665–681.
- [54] H. Huang, Z. Chen, H. Chen, Y. Wang, and K. Zhang, “T-sea: Transfer-based self-ensemble attack on object detection,” in Proceedings of the IEEE/CVF Conference on Computer Vision and Pattern Recognition, 2023, pp. 20 514–20 523.
- [55] B. Chen, J. Yin, S. Chen, B. Chen, and X. Liu, “An adaptive model ensemble adversarial attack for boosting adversarial transferability,” in Proceedings of the IEEE/CVF International Conference on Computer Vision, 2023, pp. 4489–4498.
- [56] D. Meng and H. Chen, “Magnet: a two-pronged defense against adversarial examples,” in Proceedings of the 2017 ACM SIGSAC conference on computer and communications security, 2017, pp. 135–147.
- [57] W. Xu, D. Evans, and Y. Qi, “Feature squeezing: Detecting adversarial examples in deep neural networks,” in NDSS, 2018.
- [58] C. Xiang, S. Mahloujifar, and P. Mittal, “PatchCleanser: Certifiably Robust Defense against Adversarial Patches for Any Image Classifier,” in 31st USENIX Security Symposium (USENIX Security 22), 2022, pp. 2065–2082.
- [59] Y. Zhang and P. Liang, “Defending against Whitebox Adversarial Attacks via Randomized Discretization,” in The 22nd International Conference on Artificial Intelligence and Statistics. PMLR, 2019, pp. 684–693.
- [60] X. Zhang, N. Wang, H. Shen, S. Ji, X. Luo, and T. Wang, “Interpretable Deep Learning under Fire,” in 29th USENIX Security Symposium (USENIX Security 20), 2020.
- [61] F. Tramer, N. Carlini, W. Brendel, and A. Madry, “On Adaptive Attacks to Adversarial Example Defenses,” Advances in neural information processing systems, vol. 33, pp. 1633–1645, 2020.
Appendix A Expectation over Transformation Parameters
The detailed Expectation over Transformation (EoT) parameters are shown in Table IX.
| Transformation | Factor | Random Sampling Range |
| Color Jitter | Brightness | [0.7,1.05] [0.95,1.05] |
| Contrast | [0.7,1.1] [0.95,1.0] | |
| Saturation | [0.85,1.1] [0.95,1.0] | |
| Hue | [-0.1,0.1] [-0.05,0.05] | |
| Affine | Degrees | (-5,5) |
| Horizontal Translation | ||
| Vertical Translation | ||
| Scale | [0.6,0.9] | |
| Perspective | Distortion Scale | 0.05 |
| Gaussian Blur | Kernel Size | {(3,3), (5,5)} |
| Random Noise | Strength | {0, 0.01} |
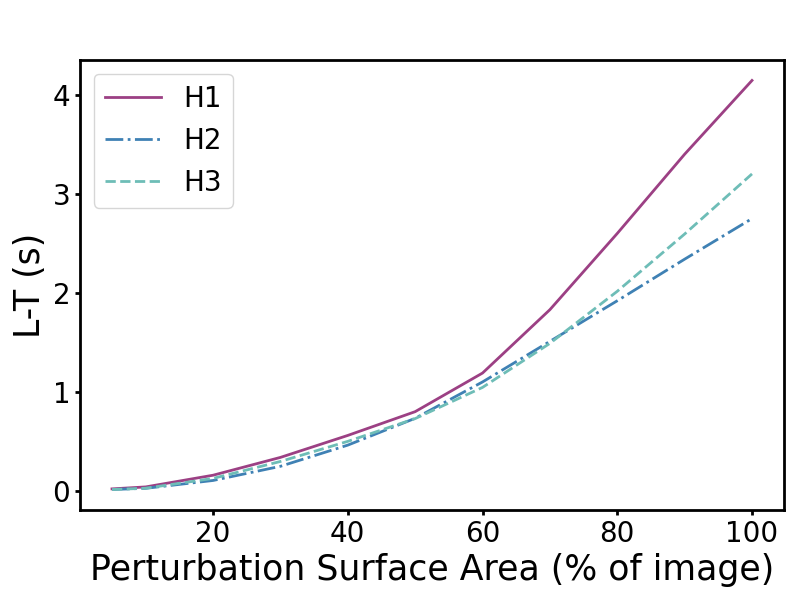
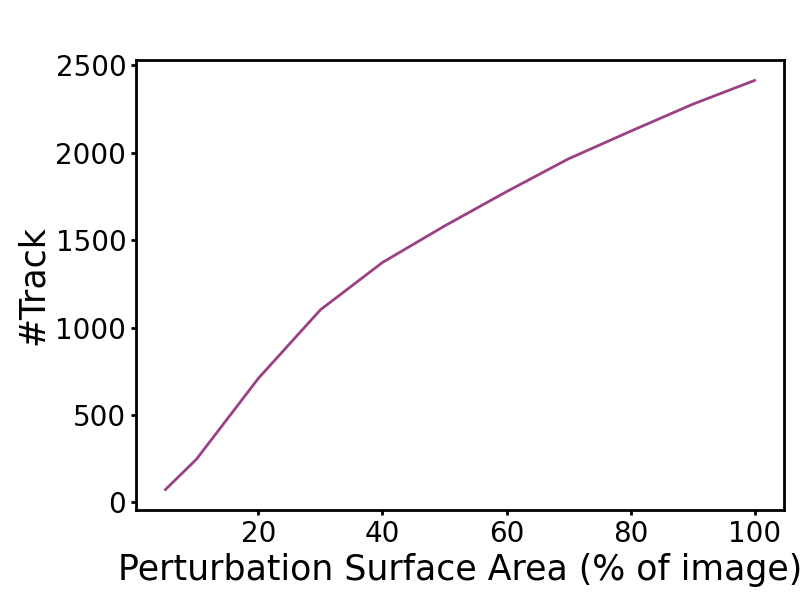
Appendix B Perturbation Surface Analysis
The effectiveness of latency attacks is heavily influenced by the exploitable perturbation surface area available. This dependency arises because the prevalent object detection models used today primarily employ CNN-based architectures. In these models, adversarial perturbations are localized in effect, meaning they can only influence the detection outcomes within their immediate vicinity. Essentially, adversarial perturbations in any given region can induce phantom objects only within that specific area and its immediate surroundings. As illustrated in Fig. 8, the perturbation surface area significantly affects both the L-T and #Track, which are key metrics in evaluating the latency attack. The relationship between the perturbation surface and latency/#Track is exponential. As the exploitable perturbation surface area increases, there is a disproportionately large increase.