LEMMA-RCA: A Large Multi-modal Multi-domain Dataset for Root Cause Analysis
Abstract
Root cause analysis (RCA) is crucial for enhancing the reliability and performance of complex systems. However, progress in this field has been hindered by the lack of large-scale, open-source datasets tailored for RCA. To bridge this gap, we introduce LEMMA-RCA, a large dataset designed for diverse RCA tasks across multiple domains and modalities. LEMMA-RCA features various real-world fault scenarios from IT and OT operation systems, encompassing microservices, water distribution, and water treatment systems, with hundreds of system entities involved. We evaluate the quality of LEMMA-RCA by testing the performance of eight baseline methods on this dataset under various settings, including offline and online modes as well as single and multiple modalities. Our experimental results demonstrate the high quality of LEMMA-RCA. The dataset is publicly available at https://lemma-rca.github.io/.
1 Introduction
Root cause analysis (RCA) is essential for identifying the underlying causes of system failures, ensuring the reliability and robustness of real-world systems. Recent advancements in artificial intelligence and software development have led to increased complexity and interdependence in modern systems. This complexity heightens their vulnerability to faults arising from interactions among modular services, which can disrupt user experiences and incur significant financial losses. Traditional manual RCA, however, is labor-intensive, costly, and prone to errors due to the complexity of systems and the extensive data involved. Therefore, efficient and effective data-driven RCA methods are crucial for pinpointing failures and mitigating financial losses when system faults occur.
Root cause analysis has been extensively studied across various domains and settings [1; 2; 3; 4; 5]. Based on the application scenarios, RCA can be carried out in offline/online fashion with single/multi-modal system data. Existing studies on RCA in these settings involve numerous learning techniques such as Bayesian methods [6], decision trees [7], etc. Particularly, causal structure learning technique [8; 9; 10; 11; 12; 13; 14; 15] has proven effective in constructing causal or dependency graphs between different system entities and key performance indicators (KPIs), thereby enabling the tracing of underlying causes through these structures.
Data is the oxygen of data-driven methods. Despite significant progress in RCA techniques, the availability of large-scale public datasets remains limited, often due to confidentiality concerns [16]. This scarcity hinders fair comparisons between RCA methods. Additionally, publicly accessible datasets often contain manually injected faults rather than real faults, and each dataset typically covers only a single domain. These limitations can prevent existing RCA methods from effectively identifying various types of system faults in real-world scenarios, potentially leading to regulatory and ethical consequences in critical sectors.
To address these limitations, we introduce LEMMA-RCA, a collection of Large-scalE Multi-ModAl datasets with various real system faults to facilitate future research in Root Cause Analysis. LEMMA-RCA is multi-domain, encompassing real-world applications such as IT operations and water treatment systems, with hundreds of system entities involved. LEMMA-RCA accommodates multi-modal data including textual system logs with millions of event records and time series metric data with more than timestamps. We annotate LEMMA-RCA with ground truth labels indicating the precise time stamps when real system faults occur and their corresponding root-cause system entities.
Dataset Public Real Faults Large-scale Multi-domain Modality Single Multiple LEMMA-RCA ✓ ✓ ✓ ✓ ✓ ✓ NeZha ✓ ✗ ✗ ✗ ✓ ✓ PetShop ✓ ✗ ✗ ✗ ✓ ✗ ITOps ✗ ✓ ✓ ✗ ✓ ✗ Murphy ✗ ✓ ✗ ✗ ✓ ✗
A comparison between LEMMA-RCA and existing datasets for RCA is presented in Table 1. We briefly discuss the status of existing datasets: 1) NeZha [12] has limited size and contains many missing parts in the monitoring data, and it is confined to one domain: microservice architectures. 2) PetShop [17] has a small size. Additionally, the system comprises only components, limiting its complexity and reducing the practicality for real-world scenarios. 3) ITOps [18] dataset is not public and contains structured logs that do not contribute to comprehending the underlying causal mechanism of system failures, making it difficult to conduct fine-grained RCA. 4) Murphy [16] is collected from a simple system and also not public. In comparison to prior work, LEMMA-RCA demonstrates a comprehensive maturity on the accessibility, authenticity, and diversity.
LEMMA-RCA enables fair comparisons among different RCA methods. We evaluate eight baseline methods, with five suited for offline settings and the remaining three designed for online RCA. The quality of various data modalities is assessed in both online and offline setups. As previously mentioned, causal-graph-based RCA methods provide deeper insights into system failures; hence, all baseline methods fall into this category. The experimental results demonstrate the high quality of LEMMA-RCA and its extensive utility for advanced research in root cause analysis.
2 Preliminaries
Key Performance Indicator (KPI) is a monitoring time series that indicates the system status. For instance, latency and service response time are two common KPIs used in microservice systems. A large value of latency or response time usually indicates a low-quality system performance or even a system failure.
Entity Metrics are multivariate time series collected by monitoring numerous system entities or components. For example, in a microservice system, a system entity can be a physical machine, container, pod, etc. Some common entity metrics in a microservice system include CPU utilization, Memory utilization, disk IO utilization, etc. An abnormal system entity is usually a potential root cause of a system failure.
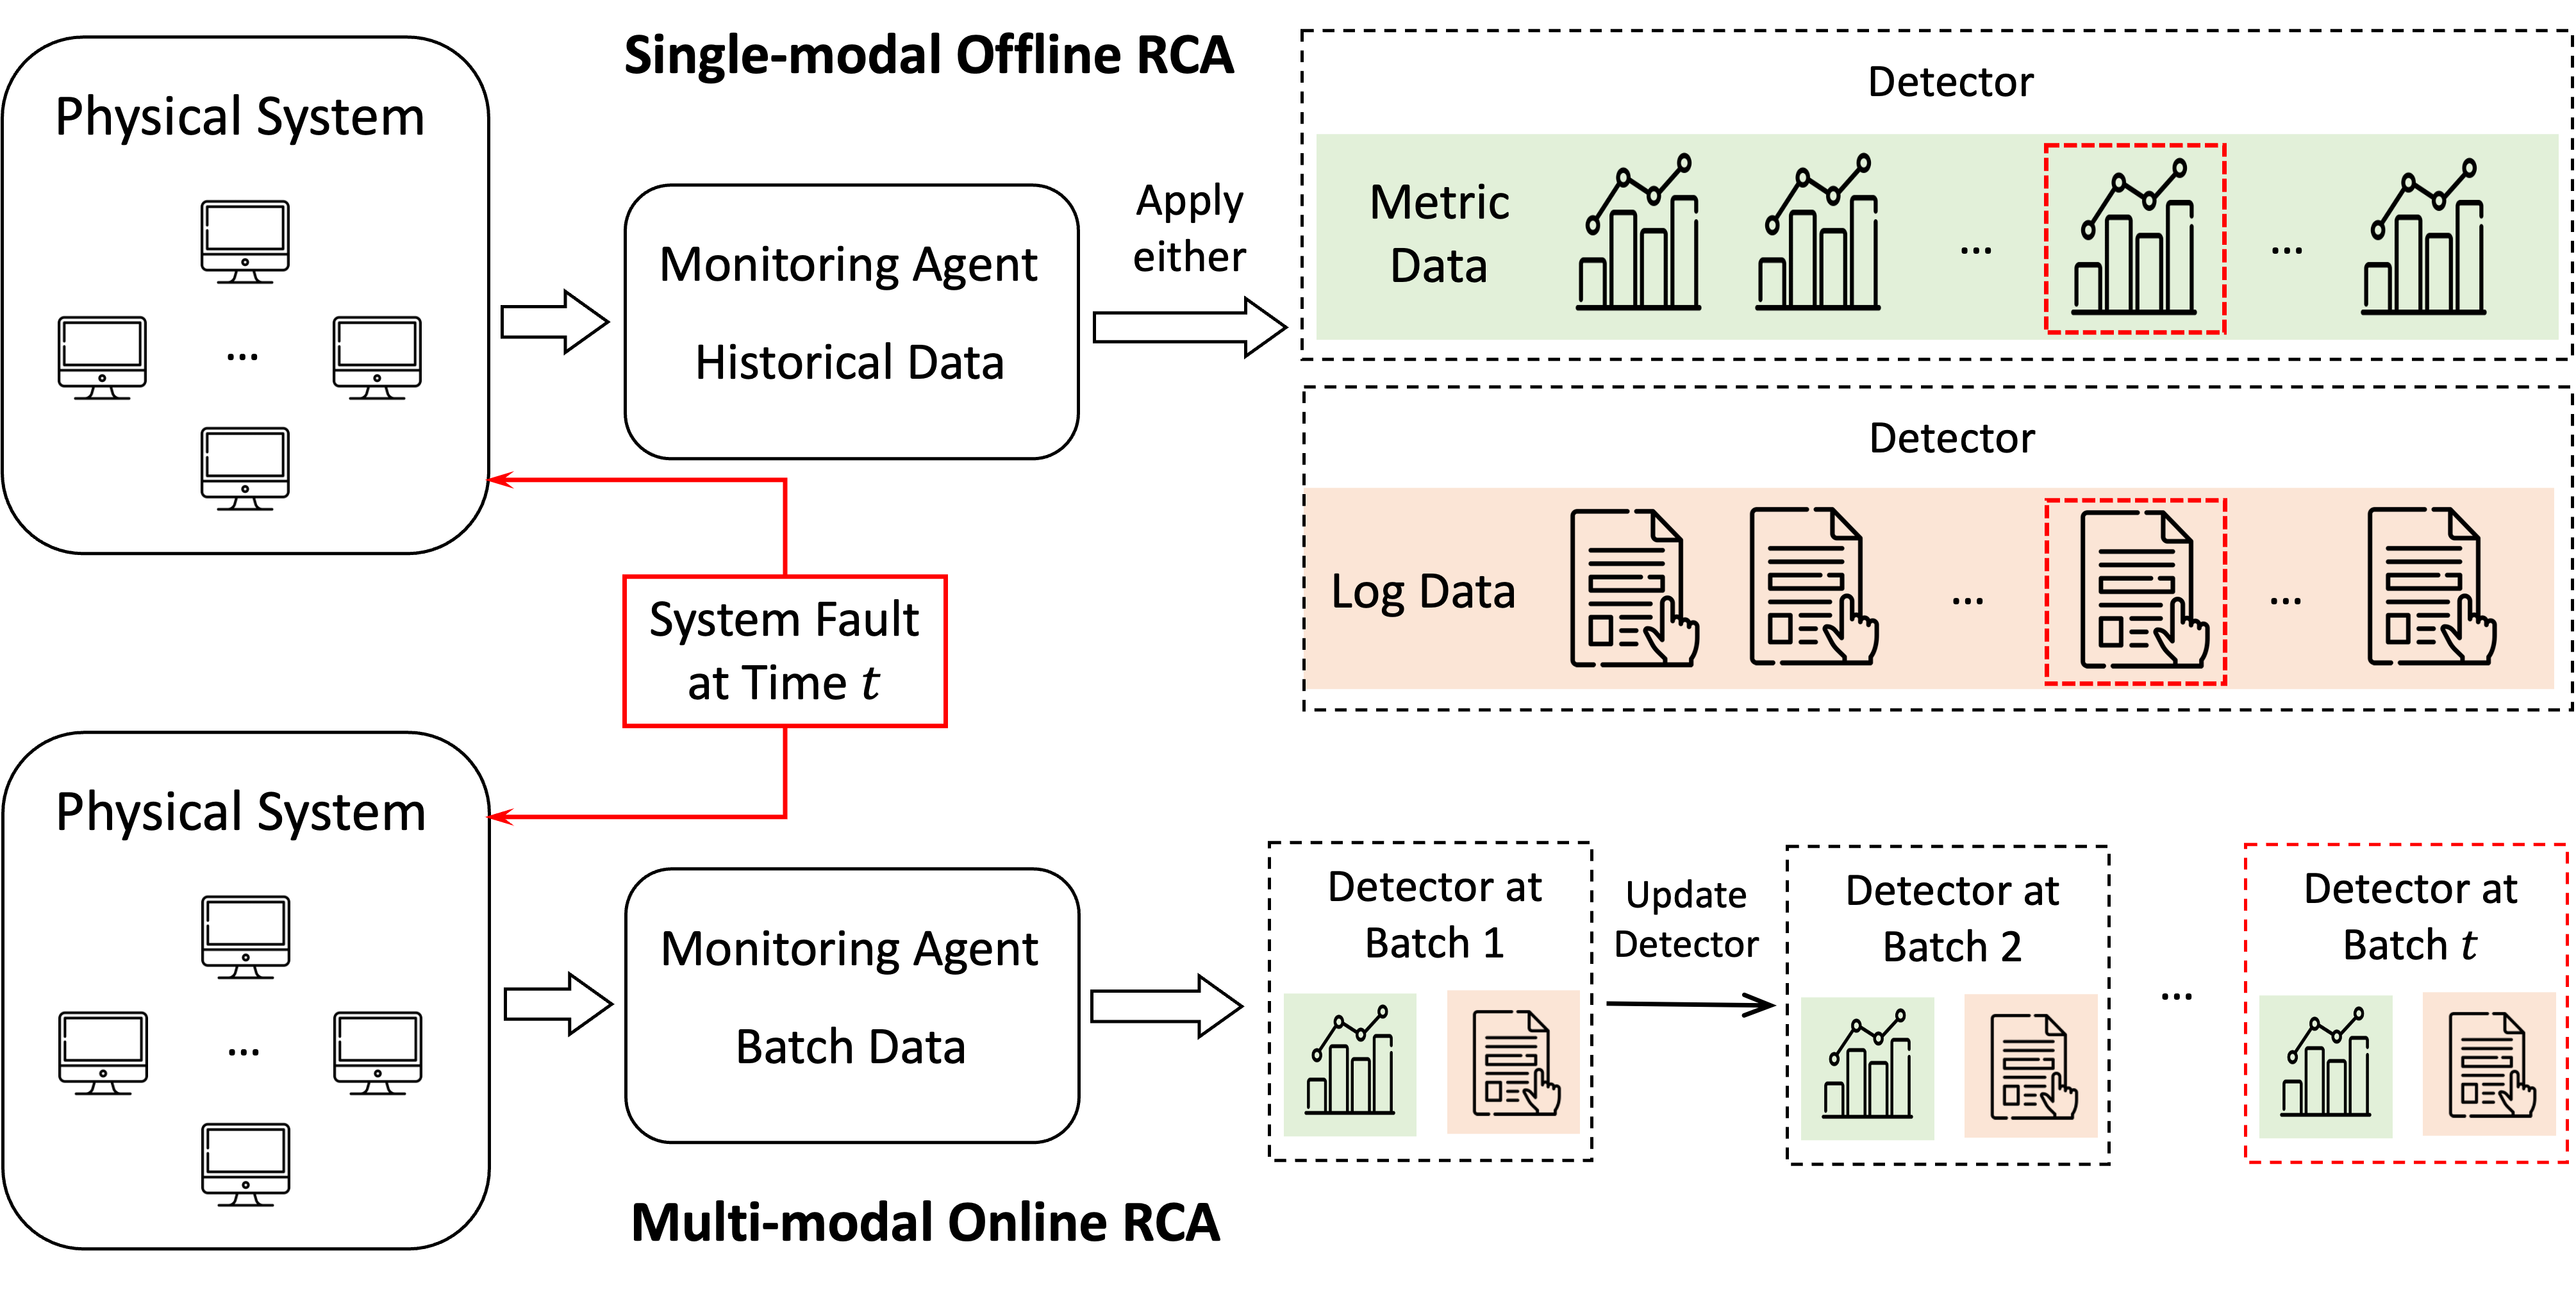
Data-driven Root Cause Analysis Problem. Given the monitoring data (including metrics and logs) of system entities and system KPIs, the root cause analysis problem is to identify the top system entities that are most relevant to KPIs when a system fault occurs. RCA techniques can be implemented in various settings, where offline/online and single-modal/multi-modal are mostly commonly concerned. Offline RCA is conducted retrospectively with historical data to determine past failures, whereas online RCA operates in real-time using current data streams to promptly address issues. On the other hand, single-modal RCA relies solely on one type of data for a focused analysis, while multi-modal RCA uses multiple data sources for a comprehensive assessment. We illustrate the procedure of RCA in single-modal offline and multi-modal online settings in Figure 1.
3 LEMMA-RCA Dataset
This section outlines the data resources, details the preprocessing steps, and presents visualizations to illustrate the characteristics of the data released.
3.1 Data Collection
We collect real-world data from two domains: IT operations and OT operations. The IT domain includes sub-datasets from Product Review and Cloud Computing microservice systems, while the OT domain includes SWaT and WADI sub-datasets from water treatment and distribution systems. Data specifics are provided in Table 2 and Table 3.
 |
 |
| (a) The architecture of Product Review Platform | (b) Log data captured by the ElasticSearch |
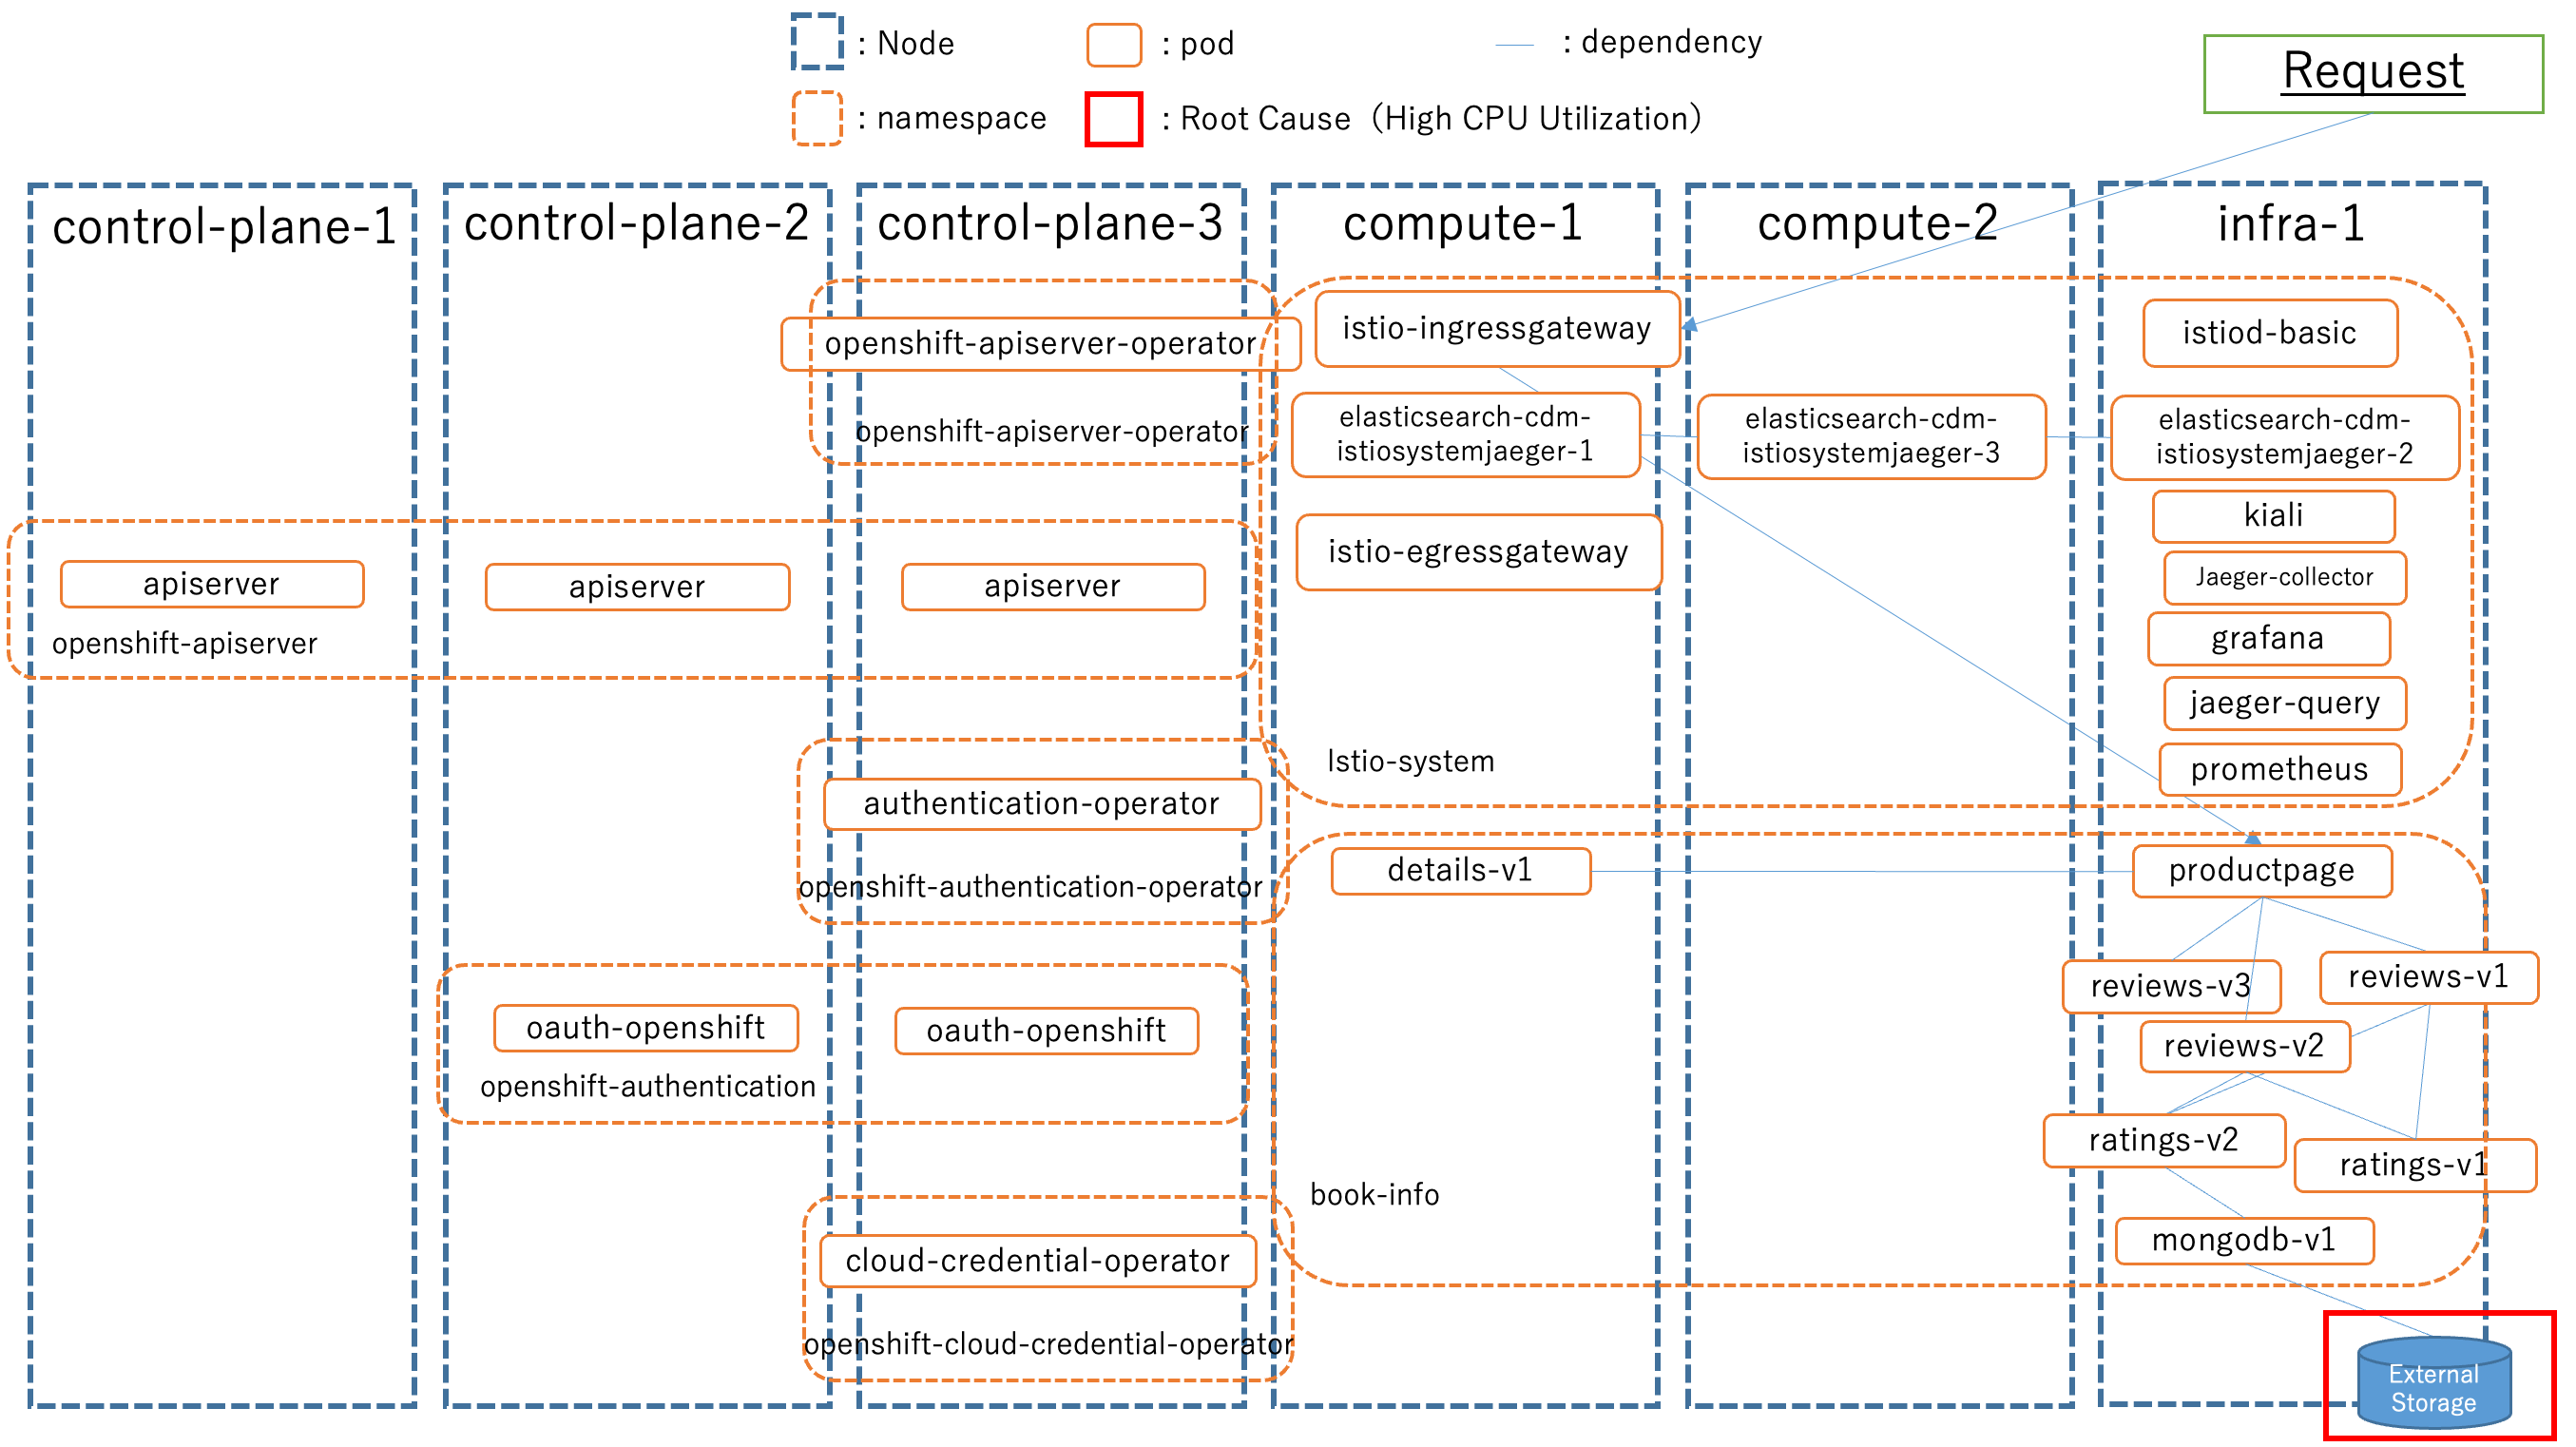
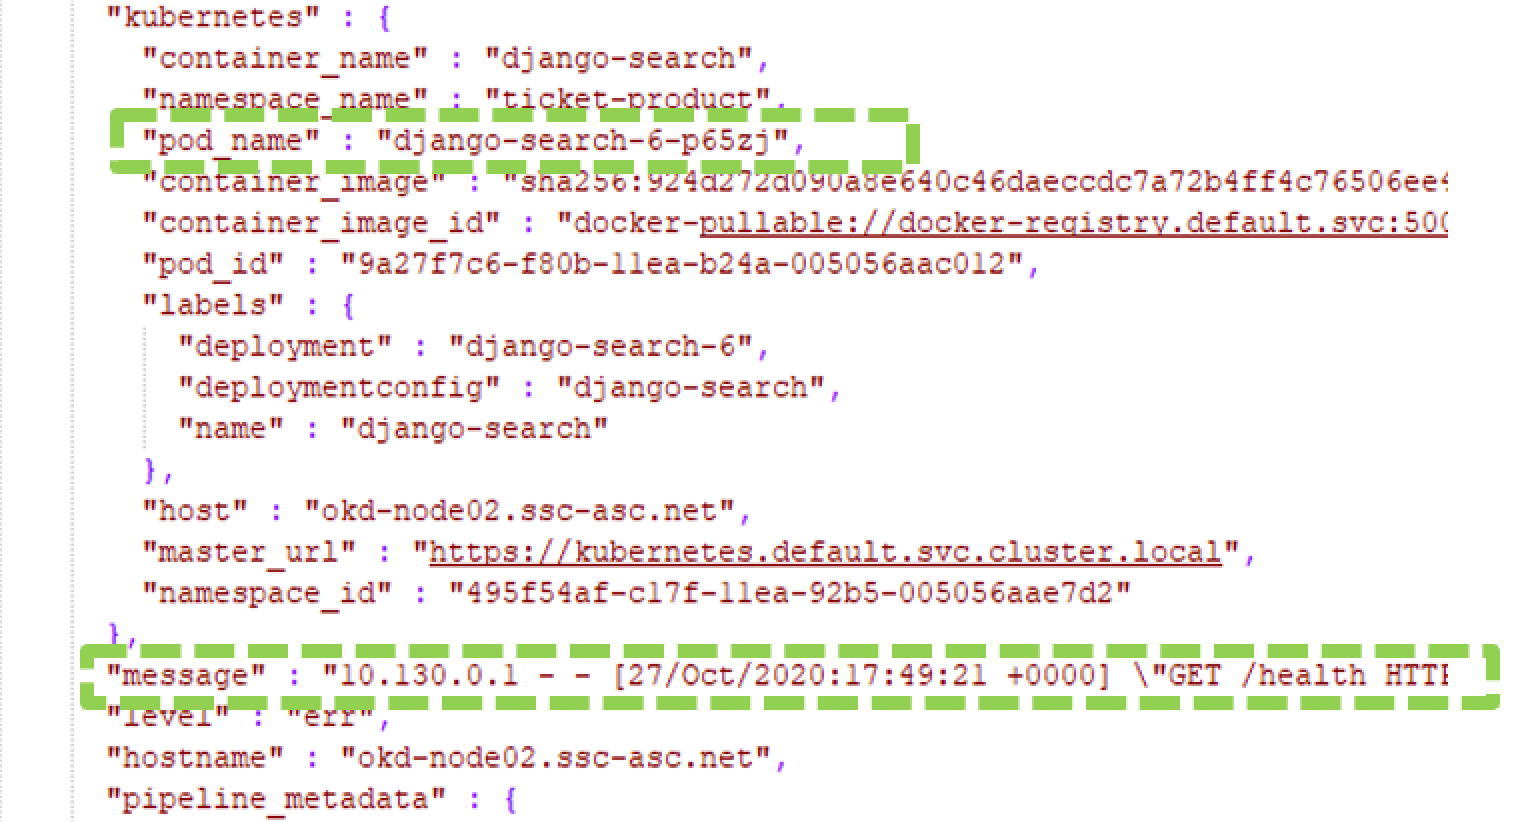
In the IT domain, we developed two microservice platforms: the Product Review Platform and the Cloud Computing Platform. The Product Review Platform is composed of six OpenShift nodes (such as ocp4-control-plane-1 through ocp4-control-plane-3, ocp4-compute-1 and ocp4-compute-2, and ocp4-infra-1) and system pods (including ProductPage, MongoDB, review, rating, payment, Catalogue, shipping, etc.). In this setup, we simulated four distinct system faults, including out-of-memory, high-CPU-usage, external-storage-full, and DDoS attack, on four different dates. Each simulation operated the microservice system for at least hours with different pods involved. The structure of this microservice system with some key pods of one simulation is depicted Figure 2 (a). Both log and metric data were generated and stored systematically to ensure comprehensive monitoring. Specifically, eleven types of node-level metrics (e.g., net disk IO usage, net disk space usage, etc.) and six types of pod-level metrics (e.g., CPU usage, memory usage, etc.) were recorded by Prometheus [19], and the time granularity of these system metrics is 1 second. Log data, on the other hand, were collected by ElasticSearch [20] and stored in JSON files with detailed timestamps and retrieval periods. The contents of system logs include timestamp, pod name, log message, etc., as shown in Figure 2 (b). The JMeter [21] was employed to collect the system status information, such as elapsed time, latency, connect time, thread name, throughput, etc. The latency is considered as system KPI as the system failure would result in the latency significantly increasing.
For the Cloud Computing Platform, we simulated six different types of faults (such as cryptojacking, mistakes made by GitOps, configuration change failure, etc.) on eleven system nodes. At each simulation, we gathered both system metrics and logs from various sources. In contrast to the Product Review platform, system metrics were directly extracted from CloudWatch Metrics on EC2 instances, and the time granularity of these system metrics is 1 second. Log events were acquired from CloudWatch Logs, consisting of three data types (i.e., log messages, api debug log, and mysql log). Log message describes general log message about all system entities; api debug log contains debug information of the AP layer when the API was executed; mysql logs contain log information from database layer, including connection logs to mysql, which user connected from which host, and what queries were executed. Latency, error rate, and utilization rate were tracked using JMeter tool, serving as Key performance indicators (KPIs). This comprehensive logging and data storage setup facilitates detailed monitoring and analysis of the system’s performance and behavior.
Microservice System Product Review Cloud Computing Original Dataset Size 765 GB 540 GB Number of fault types 4 6 Average number of entities per fault 216.0 167.71 Average number of metrics per fault 11 (node-level) + 6 (pod-level) 6 (node-level) + 7 (pod-level) Average number of timestamps per fault 131,329.25 109,350.57 Average max log events per fault across pods 153,081,219.0 63,768,587.25
In the OT domain, we constructed two sub-datasets, SWaT and WADI, using monitoring data collected by the iTrust lab at the Singapore University of Technology and Design [22]. These two sub-datasets consist of time-series/metrics data, capturing the monitoring status of each sensor/actuator as well as the overall system at each second. Specifically, SWaT [23] was collected over an 11-day period from a water treatment testbed equipped with sensors. The system operated normally during the first days, followed by attacks over the last days, resulting in 16 system faults. Similarly, WADI [24] was gathered from a water distribution testbed over days, featuring sensors and actuators. The system maintained normal operations for the first days before experiencing attacks in the final days, with system faults recorded.
Water Treatment/Distribution SWaT WADI Original Dataset Size 235.5 MB 847.6 MB Number of fault types 16 9 Average number of entities per fault 51.0 123.0 Average number of metrics per fault 7 (node-level) + 7 (pod-level) 7 (node-level) + 7 (pod-level) Average number of timestamps per fault 56239.88 85248.47
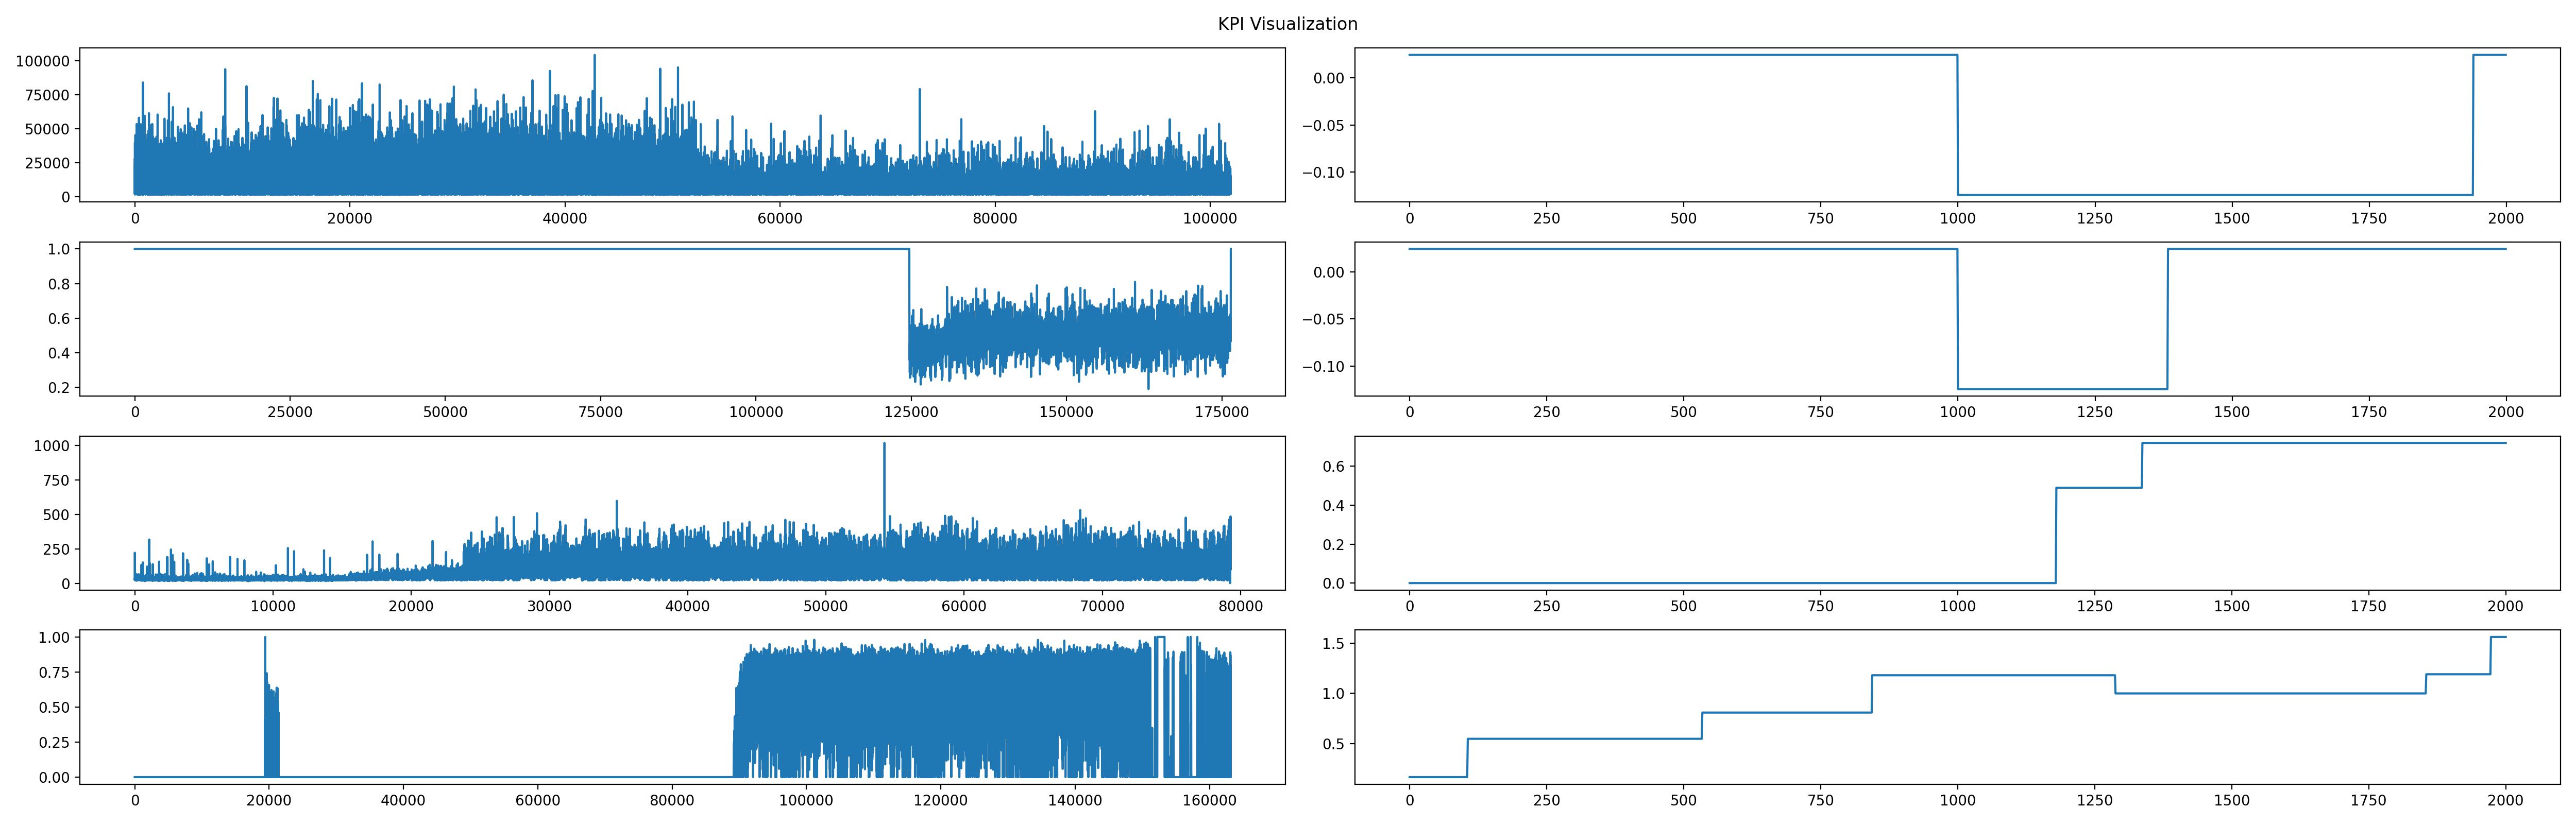
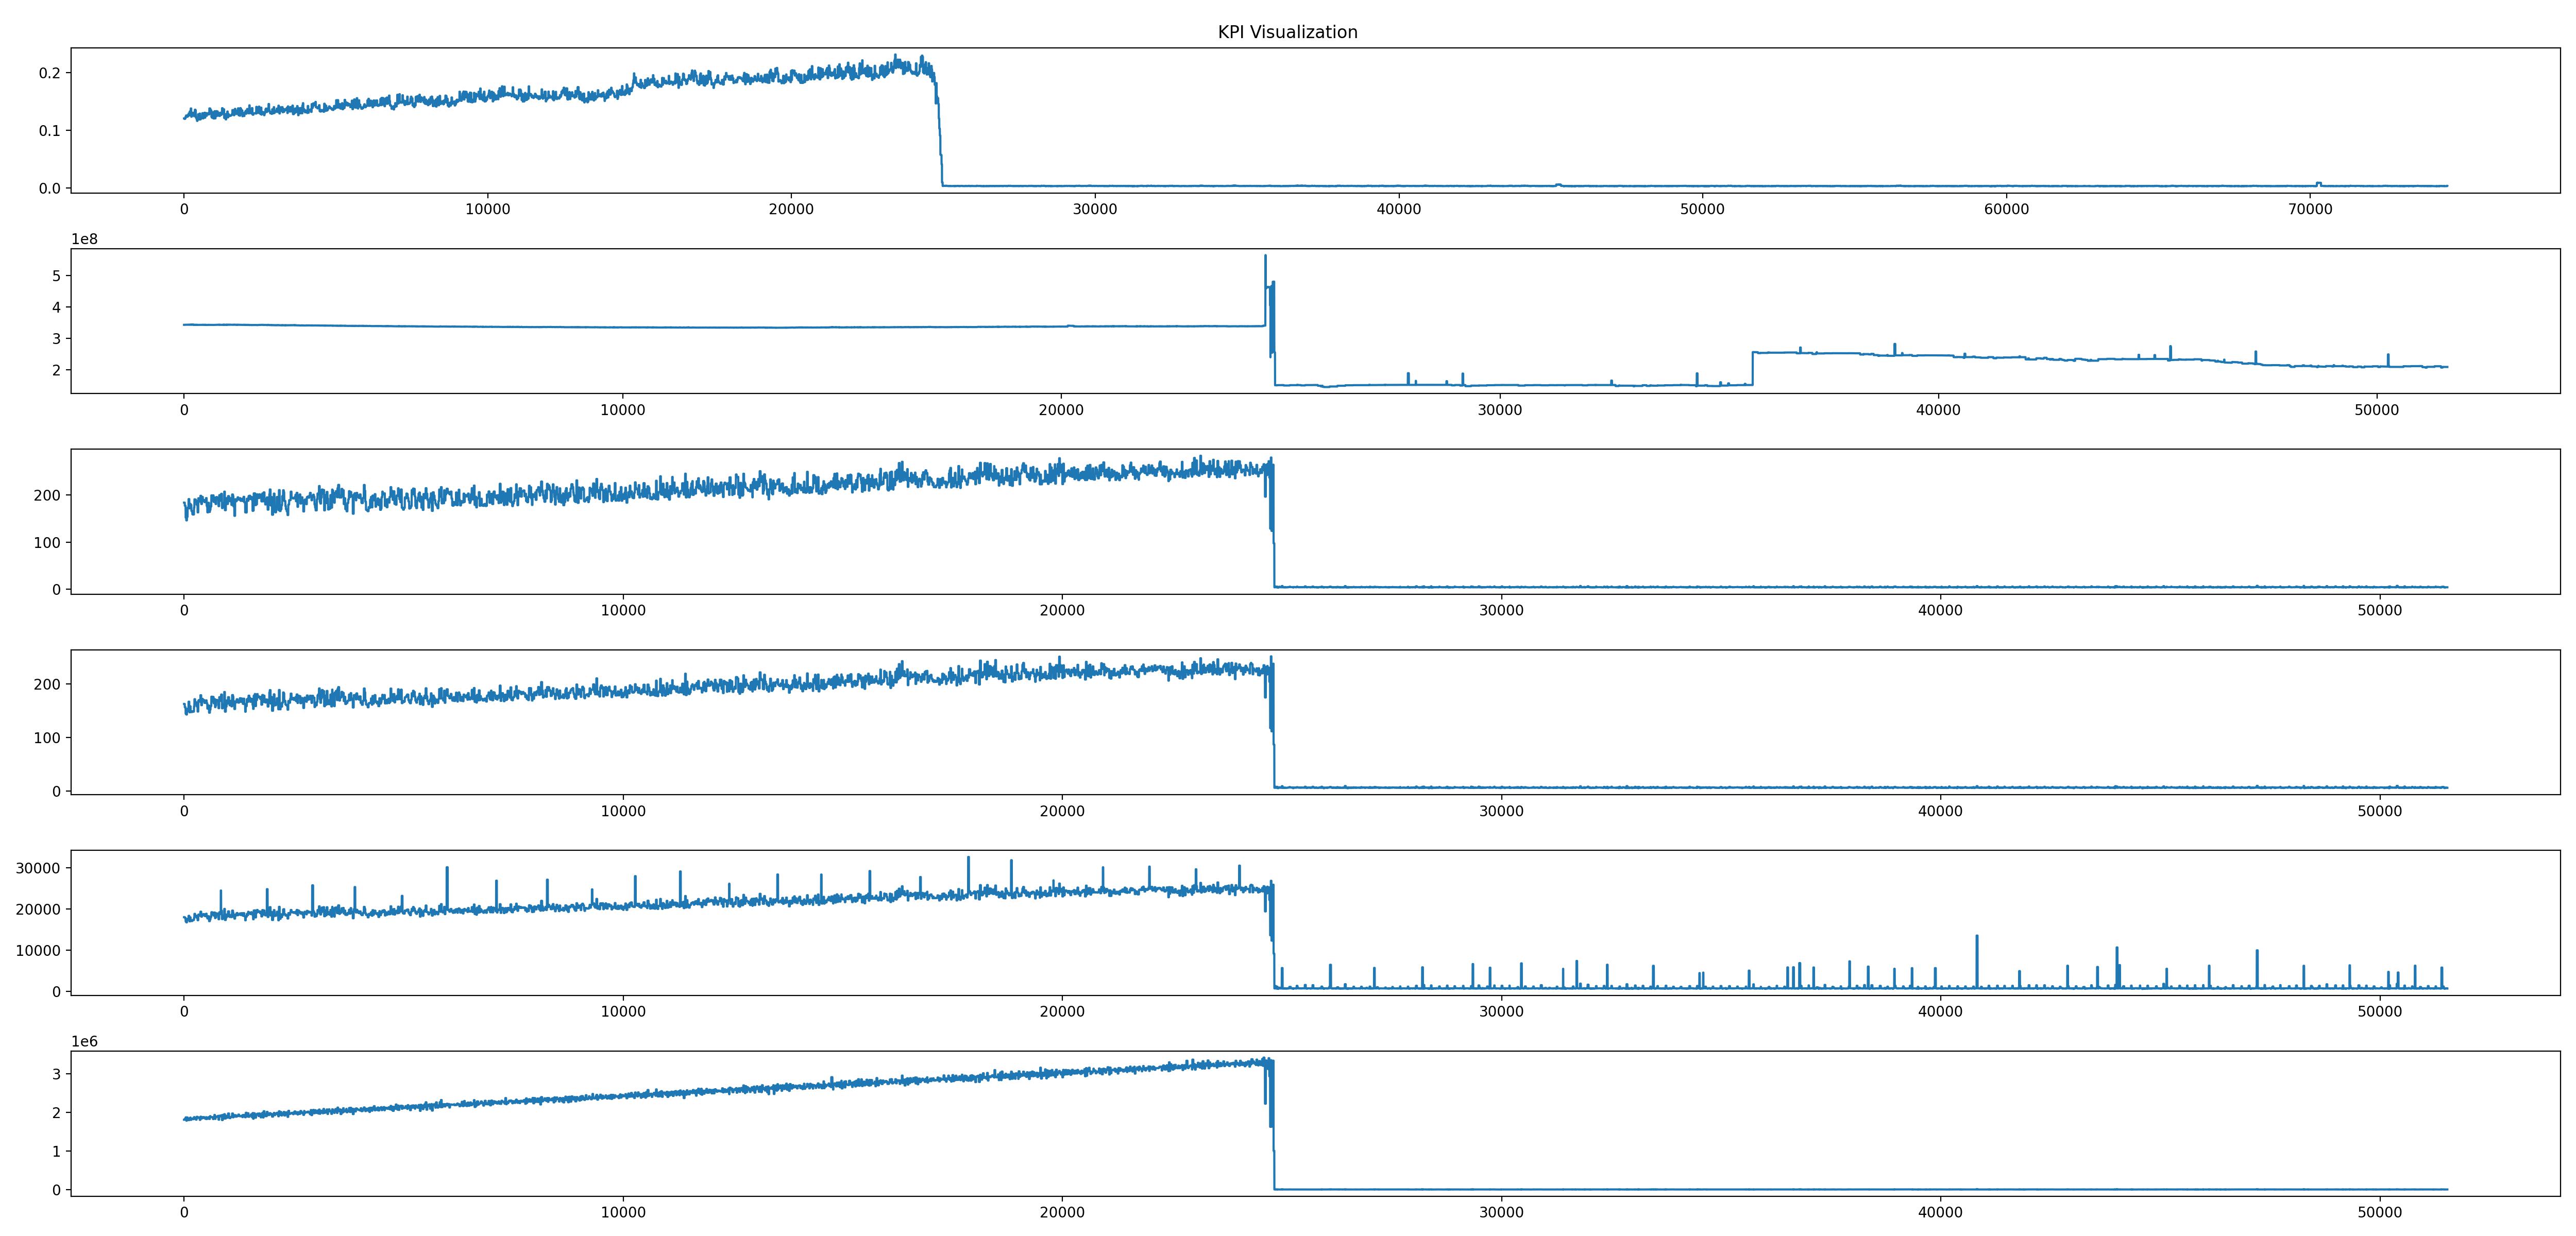
We visualized the key performance indicator (KPI) for eight failure cases in Figure 3, where sudden spikes or drops in latency indicate system failures. The first two sub-figures on the left show the KPIs for two faults in the Product Review sub-dataset, while the third and fourth sub-figures depict faults in the Cloud Computing sub-dataset. The first two sub-figures on the right display faults in the SWaT dataset, and the last two show faults in the WADI dataset. The x-axis represents the timestamp, and the y-axis shows the system latency.
3.2 Data Preprocessing
After collecting system metrics and logs, we assess whether each pod exhibits stationarity, as non-stationary data are unpredictable and cannot be effectively modeled. Consequently, we exclude non-stationary pods, retaining only stationary ones for subsequent data preprocessing steps.
Log Feature Extraction for Product Review and Cloud Computing. The logs of some system entities we collected are limited and insufficient for meaningful root cause analysis. Thus, we exclude them from further analysis. Additionally, the log data is unstructured and frequently uses a special token, complicating its direct application for analysis. How to extract useful information from unstructured log data remains a great challenge. Following [15], we preprocess the log data into time-series format. We first utilize a log parsing tool, such as Drain, to transform unstructured logs into structured log messages represented as templates. We then segment the data using fixed 10-minute windows with 30-second intervals, calculating the occurrence frequency of each log template. This frequency forms our first feature type, denoted as , where is the number of timestamps. We prioritize this feature because frequent log templates often indicate critical insights, particularly useful in identifying anomalies such as Distributed Denial of Service (DDoS) attacks, where a surge in template frequency can indicate unusual activity.
Moreover, we introduce a second feature type based on ‘golden signals’ derived from domain knowledge, emphasizing the frequency of abnormal logs associated with system failures like DDoS attacks, storage failures, and resource over-utilization. Identifying specific keywords like ‘error,’ ‘exception,’ and ‘critical’ within log templates helps pinpoint anomalies. This feature, denoted as , assesses the presence of abnormal log templates to provide essential labeling information for anomaly detection.
Lastly, we implement a TF-IDF based method, segmenting logs using the same time windows and applying Principal Component Analysis (PCA) to reduce feature dimensionality, selecting the most significant component as . We concatenate these three feature types to form the final feature matrix , enhancing our capacity for a comprehensive analysis of system logs and improving anomaly detection capabilities.
KPI Construction for SWaT and WADI. The SWaT and WADI sub-datasets include the label column that reflects the system status; however, the values within this column are discrete. To facilitate the root cause analysis, it is beneficial to transform these values into a continuous format. Specifically, we propose to convert the label into a continuous time series. To achieve this, we employ anomaly detection algorithms, such as Support Vector Data Description and Isolation Forest, to model the data. Subsequently, the anomaly score, as determined by the model, will be utilized as the system KPI.
3.3 System Fault Scenarios
We simulate different types of real system faults in Product Review and Cloud Computing platforms. Due to the space limitation, we select two representative cases (one from each) and provide the details below. We also visualize the system fault of these two cases in Figure 4.
 |
 |
-
•
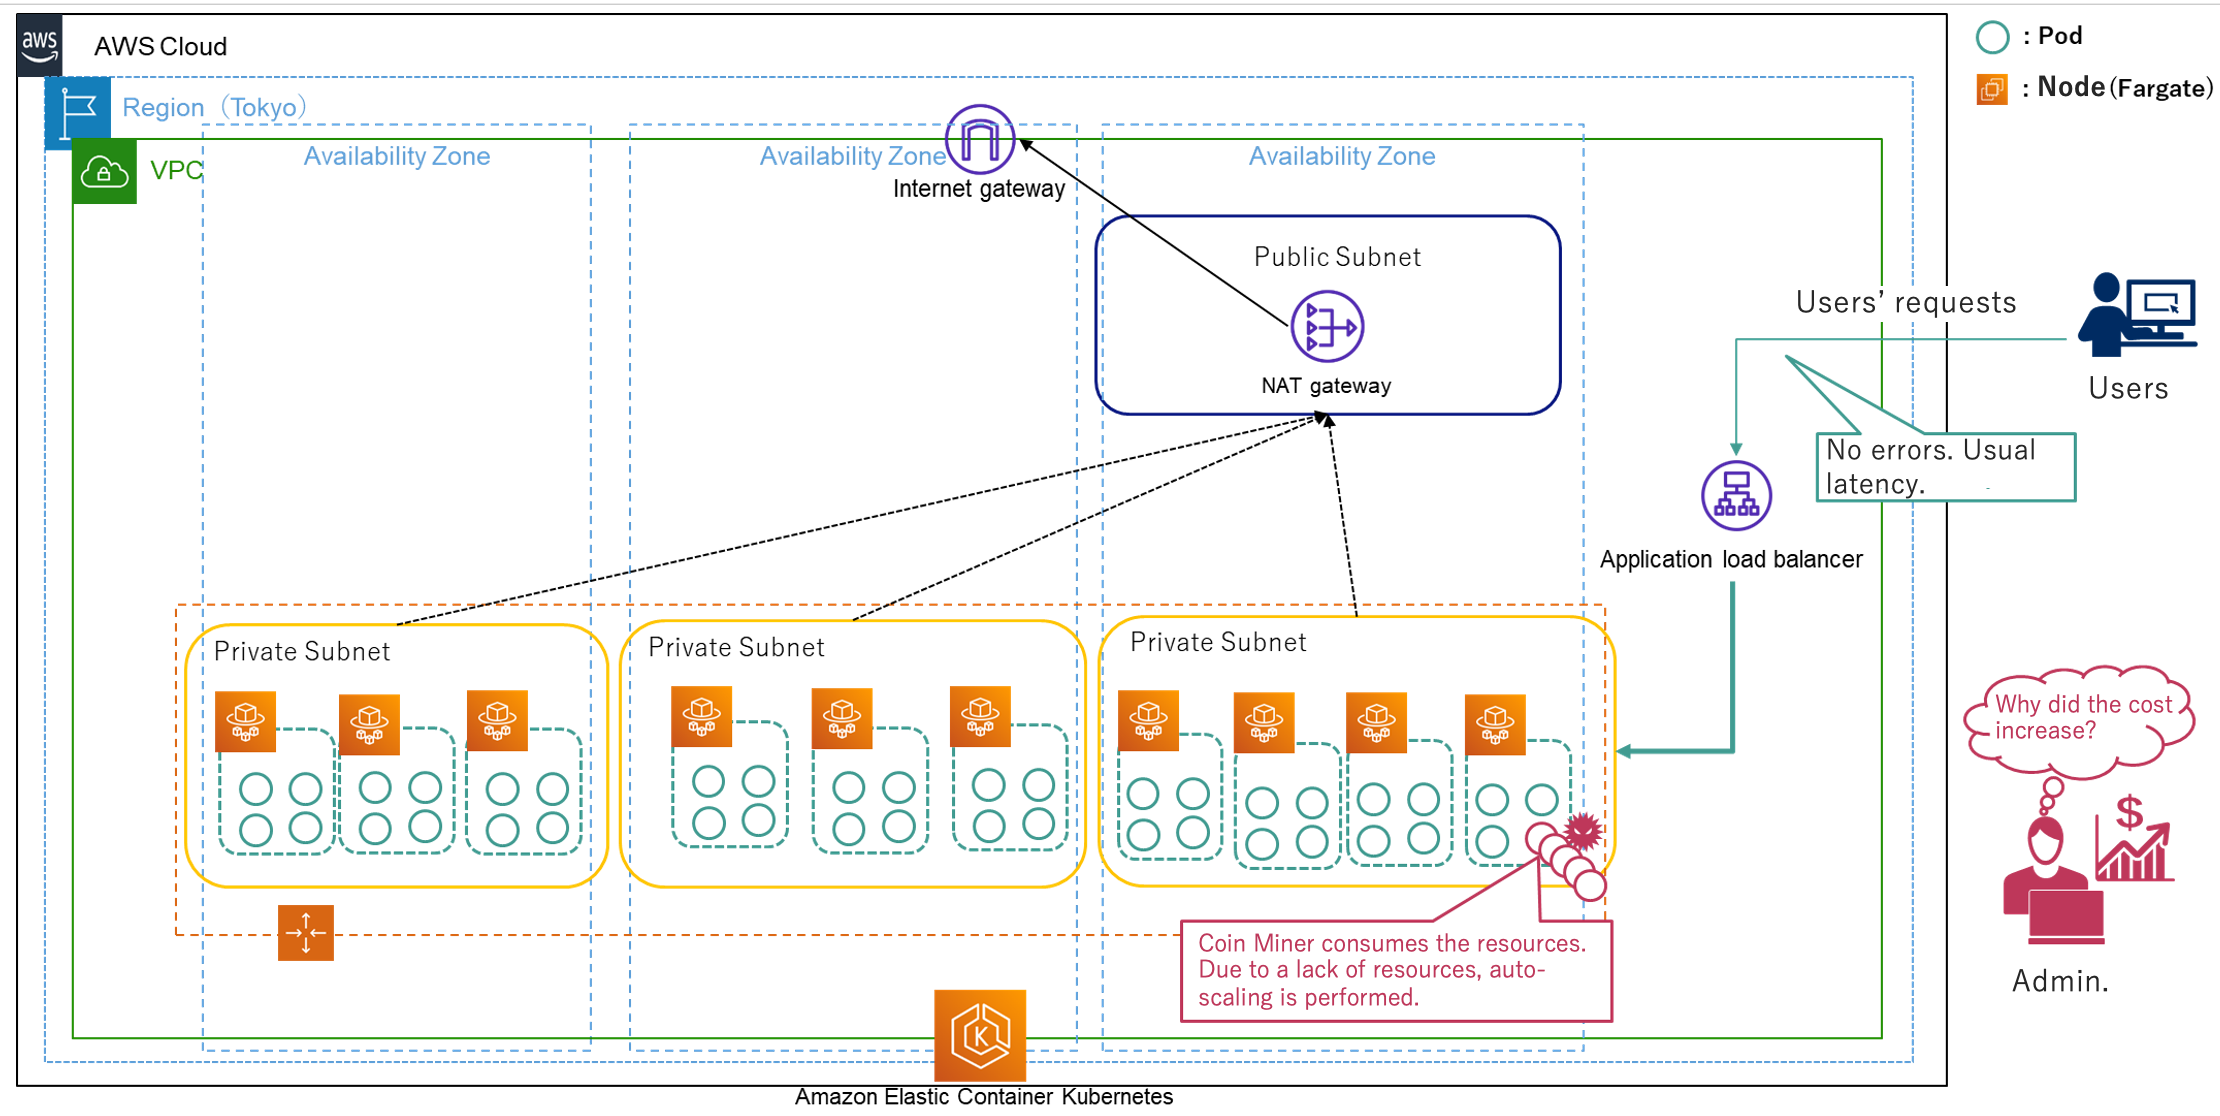
Cryptojacking. In this scenario, cloud usage fees increase due to cryptojacking, where a Coin Miner is covertly downloaded and installed on a microservice (details-v1 pod) in an EKS cluster. This miner gradually consumes IT resources, escalating the cloud computing costs. Identifying the root cause is challenging because the cost (SLI) encompasses the entire system, and no individual service errors are detected. Periodic external requests are sent to microservices, and after a day, the miner’s activity triggers auto-scaling in details-v1, increasing resource usage. Fargate’s impact on EKS costs is significant due to its resource dependency. KPI (SLI) is calculated from resource usage, with all pod and node metrics collected from CloudWatch. However, there are no node logs for Fargate, complicating diagnosis.
-
•
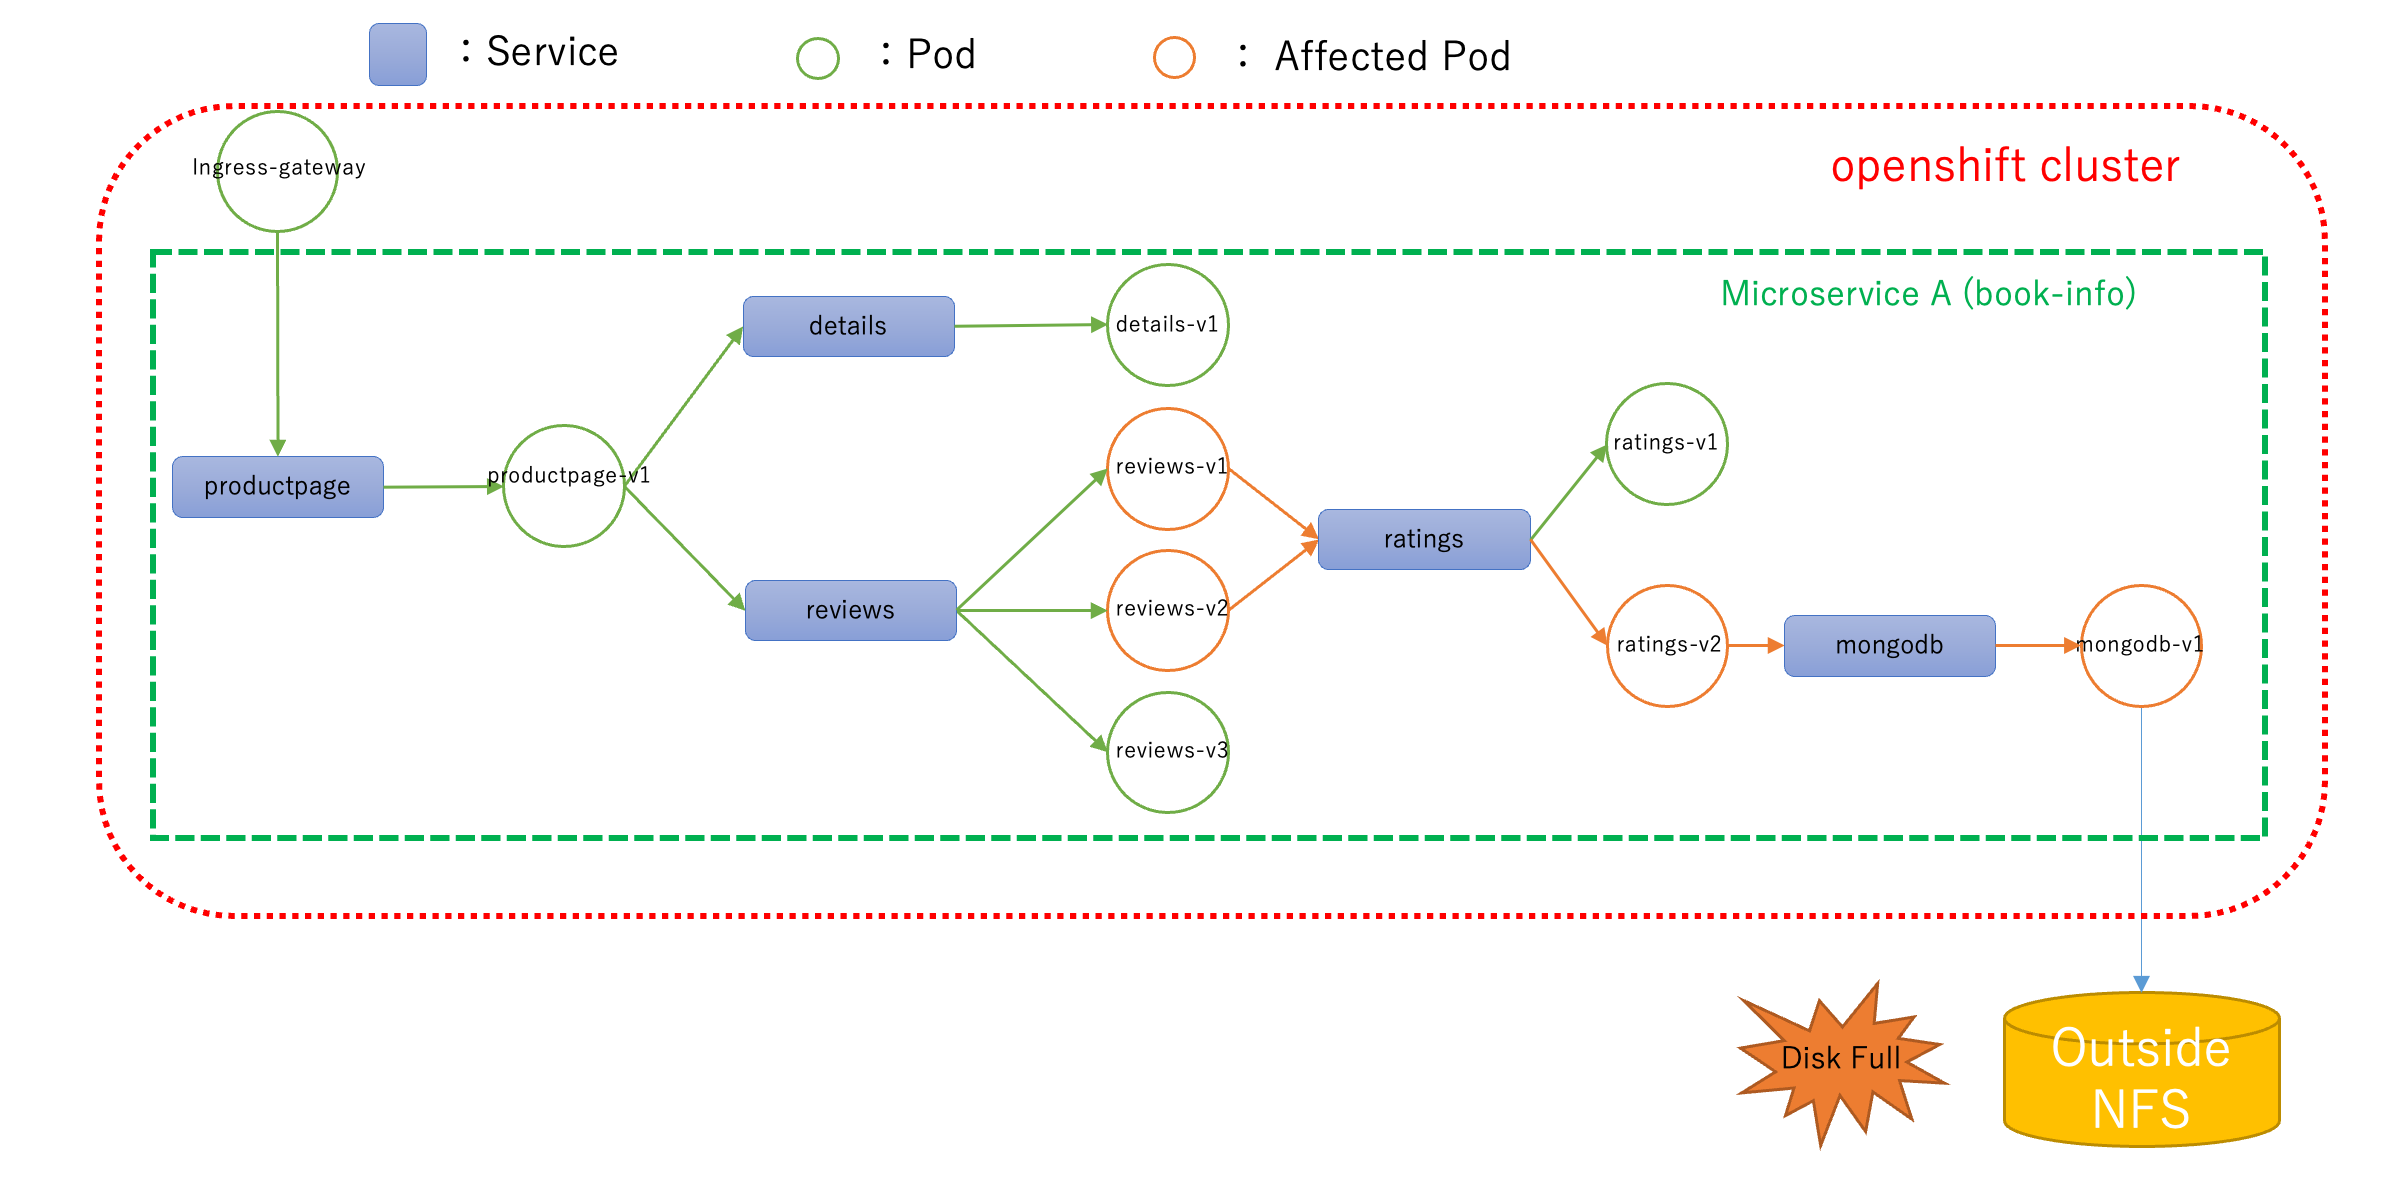
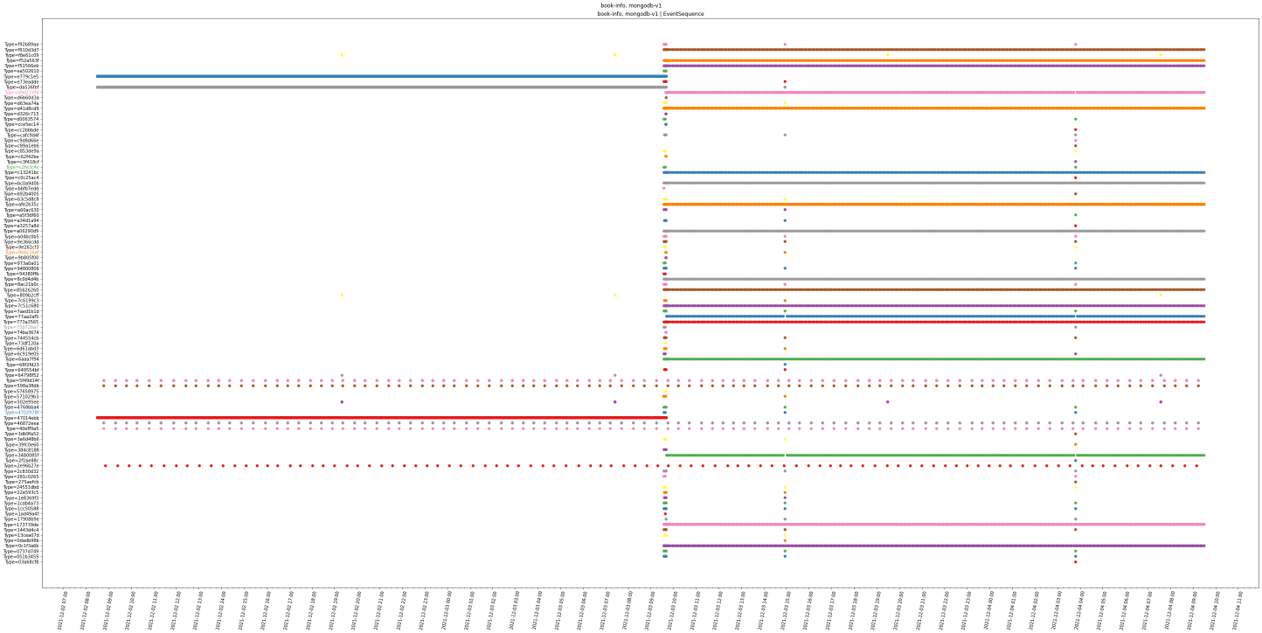
External Storage Failure. In this system failure, we fill up the external storage disk connected to the Database (DB) pod (i.e., mongodb-v1) within Microservice A’s OpenShift cluster. When the storage becomes full, the DB pod cannot add new data, resulting in system errors. These errors propagate to pods that depend on the DB pod, causing some services (ratings) within Microservice A to encounter errors. We monitor changes in response and error information for Microservice A using Jaeger logs. Metrics for all containers and nodes, including CPU and memory usage, are obtained from Prometheus within OpenShift. Logs for all containers and nodes are retrieved from Elasticsearch within OpenShift. Additionally, we collect message logs from the external storage. We illustrate the metrics and log data of the root cause pod in Figure 5.
 |
 |
4 Experiments
4.1 Experimental Setup
Evaluation Metrics. To asses baseline RCA method on LEMMA-RCA, we choose three widely-used metrics [14; 25; 15] and introduce them below.
(1). Precision@K (PR@K): It measures the probability that the top predicted root causes are real, defined as:
| (1) |
where is the set of system faults, is one fault in , is the real root causes of , is the predicted root causes of , and is the -th predicted cause of .
(2). Mean Average Precision@K (MAP@K): It assesses the top predicted causes from the overall perspective, defined as:
| (2) |
where a higher value indicates better performance.
(3). Mean Reciprocal Rank (MRR): It evaluates the ranking capability of models, defined as:
| (3) |
where is the rank number of the first correctly predicted root cause for system fault .
Baselines. We evaluate the performance of the following causal discovery based RCA models on the benchmark sub-datasets: (1). PC [8]: This classic constraint-based causal discovery algorithm is designed to identify the causal graph’s skeleton using an independence test. (2) Dynotears [9]: It constructs dynamic Bayesian networks through vector autoregression models. (3). C-LSTM [11]: This model utilizes LSTM to model temporal dependencies and capture nonlinear Granger causality. (4). GOLEM [10]: GOLEM relaxes the hard Directed Acyclic Graph (DAG) constraint of NOTEARS [26] with a scoring function. (5). REASON [14]: An interdependent network model learning both intra-level and inter-level causal relationships. (6). Nezha [12]: A multi-modal method designed to identify root causes by detecting abnormal patterns. (7). MULAN [15]: A multi-modal RCA method that learns the correlation between different modalities and co-constructs a causal graph for root cause identification. (8). CORAL [13]: An online single-modal RCA method based on incremental disentangled causal graph learning.
The fist four models can only learn the causal structure from time series data. Thus, we first collect monitoring data from the beginning until system failures occur as historical records. Then, based on the collected records, we apply the causal discovery models to learn causal graphs and leverage random walk with restarts on such graphs [13] to identify the top nodes as the root causes. Besides we extend NOTEARS and GOLEM to the online learning setting, denoted by NOTEARS∗ and GOLEM∗, respectively111Other baselines are not extended to the online setting as they are time-intensive when there are multiple data batches.. For the online setting, we use the historical normal data (e.g., hours for the Product Review sub-dataset, and hour for the SWaT and WADI sub-datasets) to construct the initial causal graph and update iteratively for each new batch of data. CORAL can inherit the causations from the previous data batch, while NOTEARS∗ and GOLEM∗ have to learn from scratch for each new data batch.
4.2 Offline Root Cause Analysis Results
Product Review and Cloud Computing. We evaluate seven offline RCA methods including both single-modal and multi-modal methods on Product Review and Cloud Computing sub-dataset. The experimental results are presented in Table 4 with respect to Precision at K (PR@K), Mean Reciprocal Rank (MRR), and Mean Average Precision at K (MAP@K). Our observations reveal the following insights: (1) The REASON method demonstrates notable success in identifying the root cause in 75% of system fault scenarios, achieving a PR@1 score of 75%. This indicates the utility of metric data alone in facilitating root cause identification. (2) The performance of these RCA methods is diminished when relying solely on log data for root cause analysis. (3) Integrating both metric and log data enhances the performance of most RCA methods in terms of MRR, compared to using only metric data. This suggests that log data complements these methods, aiding in more accurate identification of potential root causes.
Modality Model PR@1 PR@5 PR@10 MRR MAP@3 MAP@5 MAP@10 Metric Only Dynotears 0 0 50.0% 6.96% 0 0 7.50% PC 0 0 25.0% 5.32% 0 0 5.0% C-LSTM 25.0% 75.0% 75.0% 47.39% 50.0% 25.0% 67.50% GOLEM 0 0 25.0% 4.31% 0 0 2.50% REASON 75.0% 100.0% 100.0% 87.50% 91.67% 95.0% 97.5% Log Only Dynotears 0 0 25.0% 5.84% 0 0 7.50% PC 0 0 25.0% 6.93% 0 0 12.50% C-LSTM 0 0 25.0% 5.90% 0 0 7.50% GOLEM 0 0 25.0% 5.83% 0 0 7.50% REASON 0 50.0% 75.0% 21.56% 16.67% 25.0% 40.0% Multi-Modality Dynotears 0 0 50.0% 9.52% 0 0 15.0% PC 0 0 25.0% 6.43% 0 0 12.5% C-LSTM 50.0% 75.0% 75.0% 59.25% 58.33% 65.0% 70.0% GOLEM 0 0 25.0% 6.43% 0 0 5.0% REASON 75.0% 100.0% 100.0% 87.50% 91.67% 95.0% 97.5% Nezha 0 50.0% 75.0% 19.29% 8.33% 25.0% 47.50% MULAN 100.0% 100.0% 100.0% 100.0% 100.0% 100.0% 100.0%
Dataset Model PR@1 PR@5 PR@10 MRR MAP@3 MAP@5 MAP@10 SWaT Dynotears 12.5% 32.29% 42.71% 27.85% 20.14% 24.38% 30.83% PC 12.5% 34.38% 58.33% 26.16% 12.85% 20.42% 35.0% C-LSTM 12.5% 28.13% 52.08% 29.35% 13.89% 17.71% 31.88% GOLEM 6.25% 12.5% 47.92% 22.36% 7.64% 9.58% 25.0% REASON 25.0% 66.67% 84.38% 40.99% 23.96% 35.0% 57.60% WADI Dynotears 7.14% 30.0% 47.62% 22.23% 10.71% 17.43% 26.81% PC 7.14% 35.0% 50.0% 27.74% 16.27% 23.90% 34.57% C-LSTM 0% 35.0% 51.19% 24.40% 11.51% 18.55% 32.73% GOLEM 0% 40.0% 53.57% 23.48% 9.92% 20.38% 34.83% REASON 28.57% 65.0% 79.76% 53.35% 42.46% 50.62% 63.76%
Water Treatment/Distribution. We employ five single-modal RCA methods to assess root cause localization performance on the SWaT and WADI sub-datasets. The comparative results, presented in Table Table 5, are evaluated in terms of PR@K, MRR, and MAP@K. Consistent with observations on the Product Review and Cloud Computing sub-datasets, REASON outperforms the other four baseline methods. However, a decline in performance for the best baseline method, REASON, is noted when compared to its results on the Product Review and Cloud Computing datasets. This decrease in performance can be attributed to the nature of the SWaT and WADI sub-datasets, where faults are brief and the intervals between them are short. These fleeting events can be easily missed by most RCA methods, thus posing a significant challenge in accurately identifying the root causes within these two sub-datasets.
4.3 Online Root Cause Analysis Results
We evaluate three RCA methods on all sub-datasets to assess the quality of the LEMMA-RCA sub-dataset in an online setting. Notice that due to the lack of multi-modal online RCA methods, we measure the performance of these single-modal baseline methods using only metric data shown in Table 6. By observation, we find that the online version of RCA models (e.g., GOLEM∗) outperform their offline version (e.g., GOLEM) as online methods can rapidly capture the changing patterns of the metric data, thus learning a more accurate and noise-free causal structure for RCA. Among online methods, CORAL significantly outperforms NOTEARS∗ and GOLEM∗ due to the design of state-invariant and state-dependent representations learning tailored for the online setting. Notably, LEMMA-RCA is a large-scale real-world dataset, consisting of more than 100,000 timestamps across several days with various system fault scenarios, which can be naturally transformed to the online setting, compared with small datasets (e.g., NeZha [12]) with limited timestamps for online RCA.
Dataset Model PR@1 PR@5 PR@10 MRR MAP@3 MAP@5 MAP@10 Product Review CORAL 75.0% 100.0% 100.0% 87.50% 91.67% 95.0% 97.50% NOTEARS∗ 25.0% 75.0% 75.0% 48.11% 50.0% 60.0% 67.50% GOLEM∗ 50.0% 75.0% 75.0% 64.58% 66.67% 70.0% 72.50% SWaT CORAL 6.25% 55.21% 92.71% 31.72% 15.63% 29.79% 53.96% NOTEARS∗ 6.25% 36.46% 67.71% 26.30% 14.93% 23.54% 42.19% GOLEM∗ 6.25% 42.71% 68.75% 28.09% 17.01% 26.04% 43.65% WADI CORAL 35.71% 60.0% 83.33% 51.90% 28.71% 36.05% 56.0% NOTEARS∗ 14.29% 45.71% 72.62% 37.74% 18.65% 27.48% 48.38% GOLEM∗ 21.43% 60.0% 73.81% 40.24% 19.84% 30.33% 48.98%
5 Discussions
Broader impact: To facilitate accurate, efficient, and multi-modal root cause analysis research across diverse domains, we introduce LEMMA-RCA as a new benchmark dataset. Our dataset also offers significant potential for advancing research in areas like multi-modal anomaly detection, change point detection, causal structure learning, and LLM-based system diagnosis. Based on the thorough data analysis and extensive experimental results, we highlight the following areas for future research:
-
•
Expanding Domain Applications: To enhance the LEMMA-RCA dataset’s versatility and impact, we plan to incorporate data from additional domains such as cybersecurity and healthcare. This integration of diverse data sources will facilitate the development of more comprehensive root cause analysis technologies, significantly extending the dataset’s applicability across various industries.
-
•
Online Multi-Modal Root Cause Analysis: The majority of RCA methods are offline and typically single-modal. However, our research highlights a notable gap in online, multi-modal approaches. This presents an opportunity to develop real-time, multi-modal root cause analysis methods that can instantly process and analyze diverse data streams. Such advancements are crucial for dynamic environments like industrial automation and real-time monitoring services, where immediate response is essential.
Limitations: Despite its broad capabilities, the LEMMA-RCA dataset may have limitations in terms of the dataset generalizability, as the system fault scenarios we created may not adequately reflect the diversity of conditions prevalent in broader real-world applications. Another limitation is the LEMMA-RCA dataset is associated with some missing data in the system metric readings. These issues can arise from factors such as system interruptions and other unforeseen circumstances.
6 Conclusion
In this work, we present LEMMA-RCA, the first large-scale, open-source dataset featuring real system faults across various application domains and multiple modalities. We evaluate the quality of LEMMA-RCA by testing the performance of eight baseline methodologies on this dataset under different settings, including offline/online modes and single/multiple-modality data. Our experimental results demonstrate the high quality of LEMMA-RCA. By making this dataset publicly available, we aim to facilitate further research and innovation in root cause analysis for complex systems, contributing significantly to the development of more robust and secure methodologies that ensure the high performance of modern systems, particularly those that are mission-critical.
References
- [1] Alfonso Capozzoli, Fiorella Lauro, and Imran Khan. Fault detection analysis using data mining techniques for a cluster of smart office buildings. Expert Systems with Applications, 42(9):4324–4338, 2015.
- [2] Ailin Deng and Bryan Hooi. Graph neural network-based anomaly detection in multivariate time series. In Proceedings of the AAAI Conference on Artificial Intelligence, volume 35, pages 4027–4035, 2021.
- [3] Álvaro Brandón, Marc Solé, Alberto Huélamo, David Solans, María S Pérez, and Victor Muntés-Mulero. Graph-based root cause analysis for service-oriented and microservice architectures. Journal of Systems and Software, 159:110432, 2020.
- [4] George K Fourlas and George C Karras. A survey on fault diagnosis methods for uavs. In 2021 International Conference on Unmanned Aircraft Systems (ICUAS), pages 394–403. IEEE, 2021.
- [5] Zhiwei Gao, Carlo Cecati, and Steven X. Ding. A survey of fault diagnosis and fault-tolerant techniques—part i: Fault diagnosis with model-based and signal-based approaches. IEEE Transactions on Industrial Electronics, 62(6):3757–3767, 2015.
- [6] Adel Alaeddini and Ibrahim Dogan. Using bayesian networks for root cause analysis in statistical process control. Expert Systems with Applications, 38(9):11230–11243, 2011.
- [7] Mike Chen, Alice X Zheng, Jim Lloyd, Michael I Jordan, and Eric Brewer. Failure diagnosis using decision trees. In International Conference on Autonomic Computing, 2004. Proceedings., pages 36–43. IEEE, 2004.
- [8] Tom Burr. Causation, prediction, and search. Technometrics, 45(3):272–273, 2003.
- [9] Roxana Pamfil, Nisara Sriwattanaworachai, Shaan Desai, Philip Pilgerstorfer, Konstantinos Georgatzis, Paul Beaumont, and Bryon Aragam. DYNOTEARS: structure learning from time-series data. In Silvia Chiappa and Roberto Calandra, editors, The 23rd International Conference on Artificial Intelligence and Statistics, AISTATS 2020, 26-28 August 2020, Online [Palermo, Sicily, Italy], volume 108 of Proceedings of Machine Learning Research, pages 1595–1605. PMLR, 2020.
- [10] Ignavier Ng, AmirEmad Ghassami, and Kun Zhang. On the role of sparsity and DAG constraints for learning linear dags. In Hugo Larochelle, Marc’Aurelio Ranzato, Raia Hadsell, Maria-Florina Balcan, and Hsuan-Tien Lin, editors, Advances in Neural Information Processing Systems 33: Annual Conference on Neural Information Processing Systems 2020, NeurIPS 2020, December 6-12, 2020, virtual, 2020.
- [11] Alex Tank, Ian Covert, Nicholas J. Foti, Ali Shojaie, and Emily B. Fox. Neural granger causality. IEEE Trans. Pattern Anal. Mach. Intell., 44(8):4267–4279, 2022.
- [12] Guangba Yu, Pengfei Chen, Yufeng Li, Hongyang Chen, Xiaoyun Li, and Zibin Zheng. Nezha: Interpretable fine-grained root causes analysis for microservices on multi-modal observability data. In Proceedings of the 31st ACM Joint European Software Engineering Conference and Symposium on the Foundations of Software Engineering, pages 553–565, 2023.
- [13] Dongjie Wang, Zhengzhang Chen, Yanjie Fu, Yanchi Liu, and Haifeng Chen. Incremental causal graph learning for online root cause analysis. In Proceedings of the 29th ACM SIGKDD Conference on Knowledge Discovery and Data Mining, pages 2269–2278, 2023.
- [14] Dongjie Wang, Zhengzhang Chen, Jingchao Ni, Liang Tong, Zheng Wang, Yanjie Fu, and Haifeng Chen. Interdependent causal networks for root cause localization. In Proceedings of the 29th ACM SIGKDD Conference on Knowledge Discovery and Data Mining, KDD 2023, Long Beach, CA, USA, August 6-10, 2023, pages 5051–5060. ACM, 2023.
- [15] Lecheng Zheng, Zhengzhang Chen, Jingrui He, and Haifeng Chen. Multi-modal causal structure learning and root cause analysis. arXiv preprint arXiv:2402.02357, 2024.
- [16] Vipul Harsh, Wenxuan Zhou, Sachin Ashok, Radhika Niranjan Mysore, Brighten Godfrey, and Sujata Banerjee. Murphy: Performance diagnosis of distributed cloud applications. In Proceedings of the ACM SIGCOMM 2023 Conference, pages 438–451, 2023.
- [17] Saurabh Garg, Imaya Kumar Jagannathan. Root cause analyses on petshop application, 2024. https://github.com/amazon-science/petshop-root-cause-analysis/tree/main?tab=readme-ov-file.
- [18] Zeyan Li, Nengwen Zhao, Shenglin Zhang, Yongqian Sun, Pengfei Chen, Xidao Wen, Minghua Ma, and Dan Pei. Constructing large-scale real-world benchmark datasets for aiops. arXiv preprint arXiv:2208.03938, 2022.
- [19] James Turnbull. Monitoring with Prometheus. Turnbull Press, 2018.
- [20] Vlad-Andrei Zamfir, Mihai Carabas, Costin Carabas, and Nicolae Tapus. Systems monitoring and big data analysis using the elasticsearch system. In 2019 22nd International Conference on Control Systems and Computer Science (CSCS), pages 188–193. IEEE, 2019.
- [21] Dmitri Nevedrov. Using jmeter to performance test web services. Published on dev2dev, pages 1–11, 2006.
- [22] iTrust. The website of itrust lab. [EB/OL], 2022. https://itrust.sutd.edu.sg/itrust-labs_datasets/dataset_info/.
- [23] Aditya P Mathur and Nils Ole Tippenhauer. Swat: A water treatment testbed for research and training on ics security. In 2016 international workshop on cyber-physical systems for smart water networks (CySWater), pages 31–36. IEEE, 2016.
- [24] Chuadhry Mujeeb Ahmed, Venkata Reddy Palleti, and Aditya P Mathur. Wadi: a water distribution testbed for research in the design of secure cyber physical systems. In Proceedings of the 3rd International Workshop on Cyber-Physical Systems for Smart Water Networks, pages 25–28, 2017.
- [25] Yuan Meng, Shenglin Zhang, Yongqian Sun, Ruru Zhang, Zhilong Hu, Yiyin Zhang, Chenyang Jia, Zhaogang Wang, and Dan Pei. Localizing failure root causes in a microservice through causality inference. In 28th IEEE/ACM International Symposium on Quality of Service, IWQoS 2020, Hangzhou, China, June 15-17, 2020, pages 1–10. IEEE, 2020.
- [26] Xun Zheng, Bryon Aragam, Pradeep K Ravikumar, and Eric P Xing. Dags with no tears: Continuous optimization for structure learning. Advances in neural information processing systems, 31, 2018.