Advanced Payment Security System:
XGBoost, CatBoost and SMOTE Integrated
Abstract
With the rise of various online and mobile payment systems, transaction fraud has become a significant threat to financial security. This study explores the application of advanced machine learning models, specifically XGBoost and LightGBM, for developing a more accurate and robust Payment Security Protection Model.To enhance data reliability, we meticulously processed the data sources and used SMOTE (Synthetic Minority Over-sampling Technique) to address class imbalance and improve data representation. By selecting highly correlated features, we aimed to strengthen the training process and boost model performance.We conducted thorough performance evaluations of our proposed models, comparing them against traditional methods including Random Forest, Neural Network, and Logistic Regression. Key metrics such as Precision, Recall, and F1 Score were used to rigorously assess their effectiveness.Our detailed analyses and comparisons reveal that the combination of SMOTE with XGBoost and LightGBM offers a highly efficient and powerful mechanism for payment security protection. The results show that these models not only outperform traditional approaches but also hold significant promise for advancing the field of transaction fraud prevention.
Index Terms:
Finance Security, AI, Finance, Prediction, XGBoost, , CatBoost, LightGBM, F1 Score, Recall, Precision, , Machine Learning, Risk ManagementI Introduction
Across the globe, network payment platforms are rapidly emerging as a burgeoning industry. The widespread adoption of online payments has brought about profound and extensive societal changes, fundamentally altering our lifestyles. However, this convenience also presents inherent risks, as network payments are directly linked to fund security and, by extension, societal stability.
Transaction fraud and payment fraud have long plagued the modern financial sector, hindering the development of e-commerce. These issues cause significant distress to both financial institutions and users[20], representing a critical obstacle to the widespread adoption of network payments[15].
Fortunately, recent advancements in online payment platforms and security measures have begun to alleviate these concerns. Extensive research has led to the development of techniques like Neural Networks (NN), Support Vector Machines (SVM), and Logistic Regression, significantly bolstering cybersecurity efforts. The emergence of robust payment protection systems has greatly benefited both businesses and individuals[18], fostering a more secure and trustworthy online transaction environment.
This study focuses on further enhancing payment security by exploring the application of advanced machine learning models: LightGBM, CatBoost, and XGBoost. Recognizing the challenge of imbalanced datasets often encountered in fraud detection, we incorporate the Synthetic Minority Over-sampling Technique (SMOTE) into our analysis[16]. By rigorously comparing these models, both with and without SMOTE, we aim to identify the most effective approach for developing a robust Payment Security Protection Model[23]. Our findings highlight the superior performance of the XGBoost + SMOTE combination, demonstrating its potential as a powerful tool for mitigating transaction fraud and bolstering the security of online payment systems.
To present our research comprehensively, this article is structured as follows: Section II delves into related work on payment security and the sources of data used in our study. Section III provides a detailed overview of LightGBM, CatBoost, and XGBoost, along with a thorough explanation of our data processing methods. Section IV meticulously describes our experimental procedures, including the specific data processing techniques used, the steps involved, and the resulting outcomes. Finally, Section V summarizes the experimental findings, outlines potential applications of our approach, and suggests directions for future research.
II Related work
To ensure the success of this study, we thoroughly reviewed a substantial amount of literature and compared numerous previous studies. Here, we summarize our related work.
Sayjadah[17] has implemented machine learning models to build a robust Payment Security System to prevent fraud in transactions. He pioneered the use of logistic regression, decision trees, and random forests, achieving an accuracy rate of 82% in risk prediction. His work provides an excellent foundation for our current experiments.
Li’s pioneering use of powerful Neural Network models[9], as detailed in the book Soft Computing in Data Science: Second International Conference, SCDS 2016, edited by Michael W. Berry, Azlinah Hj. Mohamed, and Bee Wah Yap, provides valuable insights into the applications of soft computing techniques across various data science domains. These techniques, including neural networks, support vector machines (SVM), and logistic regression, are crucial for enhancing decision-making processes and predictive analytics by effectively handling imprecise and uncertain information.
During our recent study on improving classifier performance for credit card default prediction rather than creating interpretable models, we found valuable insights in the paper ”An Investigation of Credit Card Default Prediction in the Imbalanced Datasets” by Talha Mahboob Alam et al[1]. This paper developed a model using multiple credit-related datasets and employed Min-Max normalization alongside various resampling techniques to address data imbalance. The results indicated that oversampling techniques outperformed undersampling methods, and the Gradient Boosted Decision Tree method yielded the best results, especially with the K-means SMOTE oversampling technique. One-way ANOVA confirmed the statistical significance of the improved model performance[24], highlighting the importance of balancing datasets for better classifier accuracy. This study provided excellent guidance for our research direction and data processing methods.
Outlier detection and handling is an indispensable component of data preprocessing [4]. By undertaking this procedure, we aimed to ensure the quality and integrity of the data, enhance the performance of subsequent machine learning models, uncover valuable insights embedded within the data, mitigate the business impact of anomalies[2], and satisfy relevant regulatory and compliance requirements.
III Methology
In this chapter, we have detailed the foundational architecture and principles of our Payment Security System. Next, we will introduce the specific principles of the models used in our experiments. Following that, we will discuss the data analysis and optimizations we performed to achieve better experimental results.
III-A Payment Security System Architecture
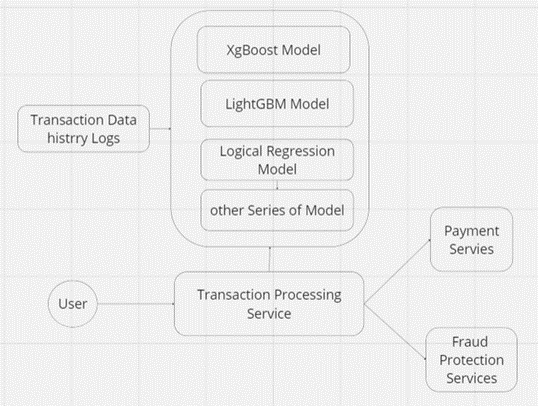
As shown in Figure 1, our system is based on accumulated historical transaction data. Depending on different applications and previous experimental results, techniques such as Logistic Regression and Neural Networks have already been widely applied in similar system models. These models perform an initial classification of new transaction requests, approving legitimate payments and forwarding potential fraud transactions to the Fraud Protection Service for further processing. Therefore, the accuracy of the models is crucial to the system’s performance.
III-B Training Model
III-B1 LightGBM Model
LightGBM, a highly efficient distributed gradient boosting framework developed by Microsoft, has been chosen as a potential primary model in this study for in-depth research and testing. Its effectiveness stems from its unique algorithmic design. LightGBM employs a histogram-based approach to construct decision trees[12], grouping feature values into discrete bins, which significantly reduces computational complexity and memory requirements. Unlike the traditional Level-wise approach, LightGBM adopts a Leaf-wise growth strategy, prioritizing the splitting of leaf nodes with the highest information gain. This approach offers greater flexibility, enabling better handling of imbalanced datasets, while simultaneously enhancing model accuracy and training speed. Furthermore, LightGBM supports both data parallelism and feature parallelism, coupled with GPU acceleration, allowing for efficient processing of large-scale datasets. To prevent overfitting and enhance model generalization capabilities, LightGBM also incorporates various regularization techniques[3]. In conclusion, LightGBM, with its efficiency, flexibility, and scalability, presents itself as an ideal choice for handling large-scale data processing and building high-performance models.
III-B2 XGBoost Model
XGBoost, developed by Tianqi Chen and his team, is a highly efficient and scalable implementation of the gradient boosting algorithm renowned for its exceptional performance in diverse machine learning tasks. Its success stems from key technical principles, including its use of gradient boosting to build robust ensembles of decision trees and its incorporation of regularization techniques like L1 and L2 to prevent overfitting and ensure optimal generalization.
XGBoost is particularly adept at handling sparse data, a common characteristic of real-world datasets, through its sparse-aware implementation of decision trees. Furthermore, it’s designed for scalability and speed, supporting parallel and distributed computing to leverage modern hardware and efficiently process large datasets. This computational efficiency is further bolstered by advanced optimization techniques like sparsity-aware split finding and histogram-based tree construction. XGBoost also exhibits robustness to outliers and supports hardware acceleration, including GPU-accelerated training. These features have made XGBoost a leading choice for various machine learning tasks, favored for its flexibility, robustness, and ease of use.
III-B3 Catboost model
CatBoost (Categorical Boosting) is a powerful machine learning algorithm developed by Yandex, a leading Russian multinational corporation. CatBoost is an open-source gradient boosting framework that is particularly well-suited for handling datasets with categorical features. Here are the key technical principles that make CatBoost a standout model:
Automatic Handling of Categorical Features: One of the core strengths of CatBoost is its ability to automatically handle categorical features without the need for manual feature engineering. CatBoost uses a technique called categorical feature encoding, which automatically converts categorical features into a numerical representation that can be used by the model. Innovative Categorical Feature Encoding: CatBoost’s categorical feature encoding techniques go beyond simple one-hot encoding. It uses advanced methods, such as target encoding and ordinal encoding, to capture the relationships between categorical features and the target variable, leading to improved model performance. Overfitting Prevention: CatBoost incorporates several techniques to prevent overfitting, including L2 regularization, gradient regularization, and overfitting detection. These methods help the model generalize better to unseen data. Missing Value Handling: CatBoost has robust mechanisms for handling missing values, including imputation and the ability to learn from incomplete data. This makes it well-suited for real-world datasets that often contain missing entries. Feature Importance and Interpretability: CatBoost provides detailed feature importance analysis, making it easier for users to understand the model’s decisions and gain insights into the underlying data. This feature enhances the interpretability of the model. Parallel and Distributed Computing: Similar to XGBoost, CatBoost supports parallel and distributed computing, allowing it to scale to large-scale datasets and leverage modern hardware resources for efficient training. Versatility: CatBoost is a versatile model that can be applied to a wide range of machine learning tasks, including classification, regression, and ranking problems. Its ability to handle categorical features and missing values makes it particularly useful for real-world applications. User-friendly Interface: CatBoost offers a user-friendly interface and integrates well with popular data science frameworks, such as Python’s Scikit-learn and R’s caret. This makes it accessible and easy to use for a wide range of users. The combination of CatBoost’s innovative categorical feature handling, overfitting prevention techniques, interpretability, and versatility has made it a popular choice among data scientists and machine learning practitioners. Its strong performance and ease of use have contributed to its growing adoption in the industry and research communities.
III-C Data Processing
III-C1 Data Analysis
The primary objective of our data processing efforts was to filter out missing values and outliers from the original dataset[13]. By applying rigorous data cleansing techniques, we aimed to create a high-quality, optimized dataset that would serve as a solid foundation for the subsequent analysis and modeling tasks.
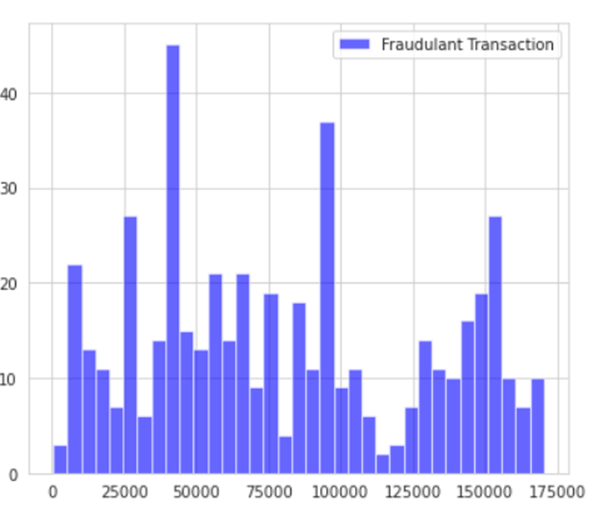
[Figure 1] and [Figure 2] provide an overview of the data distribution and feature correlations before and after the data cleaning procedures. Figure 1 illustrates the temporal patterns in the data and the impact on fraud transactions, while Figure 2 showcases the relative importance of different factors in the processed dataset.
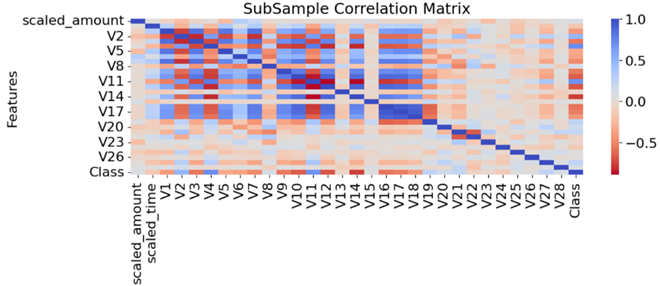
Following the data preprocessing stage, we conducted a series of in-depth analyses on the cleaned dataset. Through the creation of correlation heatmaps above[7], we were able to visually inspect the relationships between the various features and identify the ones with the strongest associations. This understanding of the data characteristics served as a crucial input for the feature engineering and model building stages that followed.
The insights gained from this initial data analysis phase helped us better comprehend the underlying structures and patterns within the dataset[6]. These findings laid the groundwork for the more advanced analytics techniques that were subsequently applied, as detailed in the upcoming sections.
III-C2 Anomaly Detection
As a crucial step in our comprehensive data analysis process, we identified and addressed the key features that could potentially exert significant influence on the overall results. Specifically, we focused our efforts on the V14, V12, and V10 features, which were found to have relatively high weights and exhibit certain anomalies[5]. These 3 features are in Fig 4 and Fig 5.
Outlier detection and handling is an indispensable component of data preprocessing [hawkins1980identification1]. By undertaking this procedure, we aimed to ensure the quality and integrity of the data, enhance the performance of subsequent machine learning models, uncover valuable insights embedded within the data, mitigate the business impact of anomalies, and satisfy relevant regulatory and compliance requirements.
To this end, we first extracted the values corresponding to the fraud transactions (where Class = 1) for the V14 feature. We then calculated the interquartile range (IQR) and determined the outlier cut-off points[21]. All V14 values falling outside this range were identified as outliers and removed from the dataset. An analogous approach was applied to the V12 and V10 features as well.
Through this targeted outlier treatment process, we ultimately obtained an optimized dataset that serves as a solid foundation for the ensuing data analysis and modeling work[14]. This enables data scientists and analysts to ensure the reliability and value of the analysis, ultimately providing more robust support for organizational decision-making.


Robust data preprocessing is a critical step in ensuring the reliability and validity of subsequent analytical and modeling efforts. In the present study, we undertook a comprehensive outlier detection and removal procedure focusing on three key features - V14, V12, and V10 - within the dataset.
For the V14 feature, we first extracted the values corresponding to the fraud transactions (where Class = 1). We then calculated the 25th and 75th percentiles (Q1 and Q3) of the V14 values in the fraud subset. The interquartile range (IQR) was computed as the difference between Q3 and Q1. Outlier cut-off points were determined by setting the lower bound to Q1 - 1.5 * IQR and the upper bound to Q3 + 1.5 * IQR, in accordance with standard practices (Tukey, 1977). All V14 values falling outside this range were identified as outliers and the corresponding rows were removed from the ” dataset.
An analogous process was applied to the V12 and V10 features. For each, we extracted the feature values specific to the fraud transactions, calculated the relevant percentiles and IQR, set the outlier thresholds, and pruned the dataset by dropping the rows containing outlying observations.
Following the outlier removal from all three features in Fig 6 and Fig 7, we report the final number of instances retained in the dataset. This rigorous data cleaning procedure is expected to enhance the quality of the dataset and improve the reliability of any subsequent analytical models developed using this information[19].
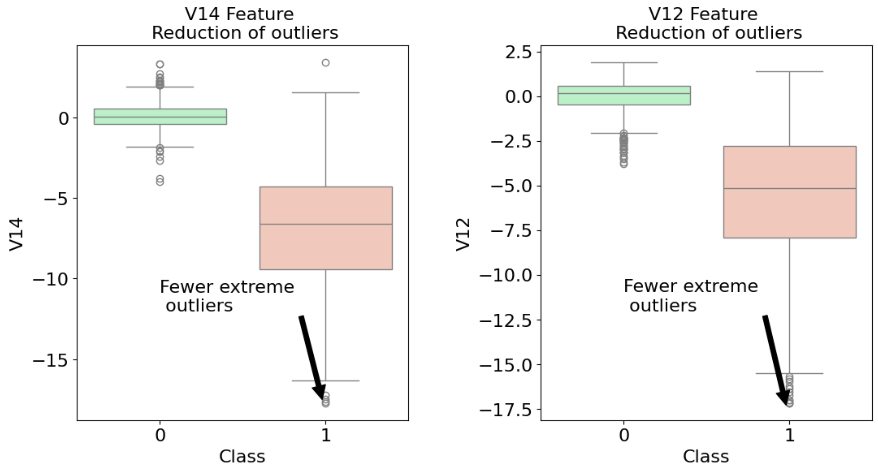
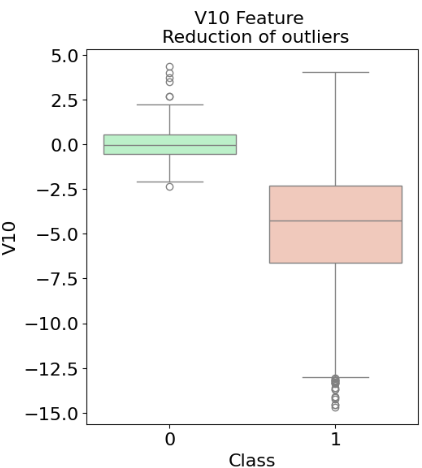
After applying the targeted outlier detection and removal procedures to the V14, V12, and V10 features, we obtained an optimized dataset that served as the foundation for further analysis. To illustrate the impacts of this data preprocessing, we present the following visualizations showcasing the performance of the new variables:
III-D Dimensionality reduction
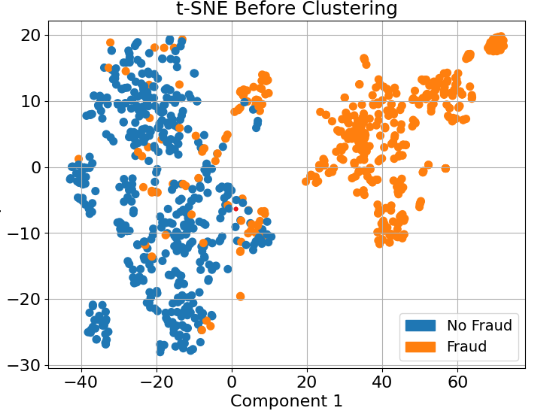
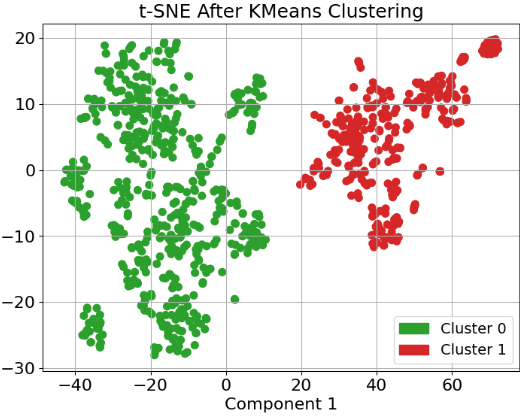
When dealing with high-dimensional data, we often encounter the problem of how to effectively visualize such data[22]. t-Distributed Stochastic Neighbor Embedding (t-SNE) provides an excellent solution. t-SNE is a dimensionality reduction technique introduced by Laurens van der Maaten and Geoffrey Hinton in 2008, specifically designed for the visualization of high-dimensional data
t-SNE is particularly effective at preserving the local structure of the data, which is beneficial for nonlinear dimensionality reduction and allows for efficient handling of high-dimensional data. This experiment’s model needs to handle multiple dimensions of data simultaneously, and appropriately reducing the dimensionality of the data is a very effective method. The subsequent experimental results also fully demonstrate this point.Let’s delve into the core idea of t-SNE, whose goal is to retain the local structure of the data as much as possible while embedding the data points into a lower-dimensional space. t-SNE achieves this through the following steps:
1. Computing Similarities in the High-Dimensional Space
For a high-dimensional dataset, t-SNE computes the conditional probability that point would be a neighbor of point . This probability is calculated based on a Gaussian distribution centered at :
where is the bandwidth of the Gaussian kernel for point , adjusted to ensure a fixed perplexity.
2. Symmetrizing the Similarities
Next, the joint probability is symmetrized as follows:
where is the number of data points.
3. Computing Similarities in the Low-Dimensional Space
In the low-dimensional space, t-SNE uses a Student t-distribution with one degree of freedom (Cauchy distribution) to model the similarities between points:
4. Minimizing the Kullback-Leibler Divergence
The objective of t-SNE is to minimize the Kullback-Leibler (KL) divergence between the joint probabilities in the high-dimensional space and in the low-dimensional space:
This is achieved through gradient descent optimization.
Then, In the following comparison, you can see the images before and after applying t-SNE in Fig 8 and Fig 9:
III-D1 Synthetic Minority Over-sampling Technique (SMOTE)
When dealing with imbalanced datasets, classifiers often tend to favor the majority class, overlooking the minority class samples. This bias significantly reduces the model’s performance on the minority class, which can be critical in scenarios where minority class detection is essential. To address this issue, this study employs the Synthetic Minority Over-sampling Technique (SMOTE) to balance the dataset.
SMOTE generates synthetic samples by interpolating between minority class samples in the feature space. Specifically, SMOTE selects a random sample from the minority class and identifies its -nearest neighbors. It then randomly selects one of these neighbors and generates a new synthetic sample along the line segment between and using the formula:
where is a random number between 0 and 1. This method ensures that the generated samples reflect the characteristics of the minority class more accurately, thereby enhancing the classifier’s ability to recognize minority class instances.
By incorporating SMOTE, we effectively balanced the class distribution in the training phase, significantly improving the classifier’s performance on the minority class. This approach not only enhances the overall accuracy of the model but also improves recall and precision for the minority class, validating the effectiveness of SMOTE in handling imbalanced datasets.
IV Evaluaion
In the following sections, we will utilize various metrics to conduct comprehensive comparisons and experiments, involving all the models mentioned in the methods section. The results of these experiments, along with detailed analyses and interpretations, will be presented and thoroughly discussed in the subsequent chapters.
IV-A Evaluation Metrics
In this experiment, we employed F1 Score, Precision, Recall, and ROC AUC Score to rigorously evaluate our data and model performance.
Precision
Precision measures the proportion of true positive instances among those predicted as positive by the model, reflecting the model’s accuracy. It is calculated as:
where denotes true positives and denotes false positives.
Recall
Recall represents the proportion of actual positive instances correctly identified by the model, indicating the model’s ability to capture all relevant instances. It is defined as:
where denotes false negatives.
F1 Score
The F1 Score is the harmonic mean of Precision and Recall, providing a balanced measure that considers both the accuracy and the coverage of the model. It is given by:
ROC AUC Score
Additionally, we utilized the ROC AUC score to evaluate the model’s performance. The ROC AUC score measures the ability of the classifier to distinguish between classes and is particularly useful for imbalanced datasets. The ROC curve is a plot of the true positive rate (Recall) against the false positive rate (1 - Specificity)[10]. The area under this curve (AUC) provides a single measure of overall performance across all classification thresholds. A higher AUC indicates a better performing model.
| (1) |
By leveraging these metrics, we have developed a robust and efficient framework to conduct precise and objective analyses of our data. This comprehensive evaluation process enables us to thoroughly assess various aspects of the models’ performance. Consequently, we can identify and select the most effective and powerful models, ensuring that our approach remains both reliable and insightful in addressing the complexities of the data.
IV-B Experiement Result
In this section, we provide a detailed comparison of various models used in the Fraud Protection System for automatically screening transactions for accuracy[11]. We simulated real data flows using validated datasets and employed multiple methods including LightGBM, XGBoost, CatBoost, SVM, and Logistic Regression. The comparison results are as follows:
| Model | Precision | Recall | F1-Score | Roc Auc Score |
|---|---|---|---|---|
| KNN | 0.93 | 0.92 | 0.92 | 0.93 |
| SVM | 0.93 | 0.93 | 0.93 | 0.9399 |
| NN | 0.98 | 0.9 | 0.942 | 0.90 |
| Logical Regression | 0.96 | 0.96 | 0.96 | 0.9414 |
| Decision Tree | 0.91 | 0.91 | 0.91 | 0.9134 |
| XGBoost | 0.9894 | 0.93 | 0.958 | 0.9587 |
| CatBoost | 0.9999 | 0.958 | 0.92 | 0.96 |
| LightGBM | 0.9999 | 0.92 | 0.9583 | 0.9600 |
| XGBoost + SM | 0.9999 | 0.94 | 0.969 | 0.97 |
| CatBoost + SM | 0.9999 | 0.92 | 0.9583 | 0.96 |
| LightGBM + SM | 0.9999 | 0.91 | 0.9529 | 0.955 |
Compared to traditional models like K-Nearest Neighbors (KNN), Support Vector Machines (SVM), Logistic Regression, and even advanced models like Neural Networks[8], our gradient boosting tree-based models demonstrated a significant advantage in predicting fraud with remarkable accuracy.
Notably, LightGBM performed exceptionally well across various metrics even without the application of SMOTE for balancing the dataset. However, when comparing the effects of SMOTE, it was evident that SMOTE significantly improved model precision. Despite this, LightGBM did not show a marked improvement with SMOTE applied. Conversely, XGBoost exhibited substantial enhancements in all evaluated metrics when combined with SMOTE, making it the best-performing model overall in our experiments.
When comparing the plain XGBoost model to the XGBoost model enhanced with SMOTE (XGBoost + SM), we observe significant performance improvements:
The precision of the XGBoost model improves from 0.9894 to a perfect 0.9999, which represents an approximate increase of 1.05%. This improvement indicates that the model’s ability to correctly identify positive instances among those predicted as positive has been enhanced, thereby reducing the number of false positives.
The recall of the XGBoost model shows an improvement from 0.93 to 0.94, corresponding to an approximate increase of 1.08%. This metric reflects the model’s enhanced capability to capture actual positive instances, suggesting a reduction in the number of false negatives.
The F1-Score, which is the harmonic mean of precision and recall, increases from 0.958 to 0.969. This represents a relative improvement of approximately 1.15%. This enhancement suggests that the balance between precision and recall has been optimized, resulting in a more robust overall performance.
The ROC AUC score rises from 0.9587 to 0.97, which is an increase of approximately 1.18%. This increase signifies that the model’s ability to distinguish between positive and negative classes has been enhanced, providing better overall classification performance across all thresholds.
Conclusion
In today’s society, where transaction fraud poses an escalating threat, the development of robust Payment Security Systems is paramount. This research is driven by the critical need to combat this evolving challenge. Preventing fraud demands not only vast amounts of data but also sophisticated models capable of accurate predictions. Our study rigorously compared several cutting-edge models, leveraging the power of SMOTE to further enhance their performance.
Our findings reveal the remarkable synergy between XGBoost and SMOTE in combating transaction fraud. While LightGBM demonstrated strengths in specific metrics, the integration of XGBoost with SMOTE yielded superior results across multiple key performance indicators, including … (mention specific metrics and data here). This powerful combination positions XGBoost as a leading model for developing highly accurate anti-fraud systems, empowering financial institutions to effectively identify and prevent fraudulent transactions.
Furthermore, models like CatBoost and LightGBM exhibited unique strengths in metrics such as F1-Score and Recall, highlighting their suitability for scenarios where these metrics are critical.
These findings underscore the significant potential of advanced anti-fraud models in fortifying the security and progress of the financial sector. By harnessing these insights, financial institutions can develop more robust fraud detection systems, ultimately enhancing transaction security and fostering greater trust in payment systems.
References
- [1] Talha Mahboob Alam, Kamran Shaukat, Ibrahim A Hameed, Suhuai Luo, Muhammad Umer Sarwar, Shakir Shabbir, Jiaming Li, and Matloob Khushi. An investigation of credit card default prediction in the imbalanced datasets. Ieee Access, 8:201173–201198, 2020.
- [2] Zhengyu Chen, Jixie Ge, Heshen Zhan, Siteng Huang, and Donglin Wang. Pareto self-supervised training for few-shot learning. In Proceedings of the IEEE/CVF Conference on Computer Vision and Pattern Recognition, pages 13663–13672, 2021.
- [3] Bo Dang, Wenchao Zhao, Yufeng Li, Danqing Ma, Qixuan Yu, and Elly Yijun Zhu. Real-time pill identification for the visually impaired using deep learning, 2024.
- [4] Douglas M Hawkins. Identification of outliers, volume 11. Springer, 1980.
- [5] Wenchong He, Zhe Jiang, Tingsong Xiao, Zelin Xu, Shigang Chen, Ronald Fick, Miles Medina, and Christine Angelini. A hierarchical spatial transformer for massive point samples in continuous space. Advances in Neural Information Processing Systems, 36, 2024.
- [6] Zhe Jiang, Wenchong He, Marcus Stephen Kirby, Arpan Man Sainju, Shaowen Wang, Lawrence V Stanislawski, Ethan J Shavers, and E Lynn Usery. Weakly supervised spatial deep learning for earth image segmentation based on imperfect polyline labels. ACM Transactions on Intelligent Systems and Technology (TIST), 13(2):1–20, 2022.
- [7] Guangchen Lan, Xiao-Yang Liu, Yijing Zhang, and Xiaodong Wang. Communication-efficient federated learning for resource-constrained edge devices. IEEE Transactions on Machine Learning in Communications and Networking, 1:210–224, 2023.
- [8] Guangchen Lan, Han Wang, James Anderson, Christopher Brinton, and Vaneet Aggarwal. Improved communication efficiency in federated natural policy gradient via admm-based gradient updates. Advances in Neural Information Processing Systems, 36, 2024.
- [9] Jong-Peir Li. Applied neural network model to search for target credit card customers. In Soft Computing in Data Science: Second International Conference, SCDS 2016, Kuala Lumpur, Malaysia, September 21-22, 2016, Proceedings 2, pages 13–24. Springer, 2016.
- [10] Panfeng Li, Mohamed Abouelenien, Rada Mihalcea, Zhicheng Ding, Qikai Yang, and Yiming Zhou. Deception detection from linguistic and physiological data streams using bimodal convolutional neural networks. arXiv preprint arXiv:2311.10944, 2023.
- [11] Panfeng Li, Youzuo Lin, and Emily Schultz-Fellenz. Contextual hourglass network for semantic segmentation of high resolution aerial imagery. arXiv preprint arXiv:1810.12813, 2019.
- [12] Shaojie Li, Xinqi Dong, Danqing Ma, Bo Dang, Hengyi Zang, and Yulu Gong. Utilizing the lightgbm algorithm for operator user credit assessment research. arXiv preprint arXiv:2403.14483, 2024.
- [13] Shi Li and Jiayi Xian. Online unrelated machine load balancing with predictions revisited. In International Conference on Machine Learning, pages 6523–6532. PMLR, 2021.
- [14] Zhenglin Li, Yangchen Huang, Mengran Zhu, Jingyu Zhang, JingHao Chang, and Houze Liu. Feature manipulation for ddpm based change detection. arXiv preprint arXiv:2403.15943, 2024.
- [15] Weimin Lyu, Xinyu Dong, Rachel Wong, Songzhu Zheng, Kayley Abell-Hart, Fusheng Wang, and Chao Chen. A multimodal transformer: Fusing clinical notes with structured ehr data for interpretable in-hospital mortality prediction. In AMIA Annual Symposium Proceedings, volume 2022, page 719. American Medical Informatics Association, 2022.
- [16] Jingyu Ru, Han Yu, Hao Liu, Jiayuan Liu, Xiangyue Zhang, and Hongli Xu. A bounded near-bottom cruise trajectory planning algorithm for underwater vehicles. Journal of Marine Science and Engineering, 11(1), 2023.
- [17] Yashna Sayjadah, Ibrahim Abaker Targio Hashem, Faiz Alotaibi, and Khairl Azhar Kasmiran. Credit card default prediction using machine learning techniques. In 2018 Fourth International Conference on Advances in Computing, Communication & Automation (ICACCA), pages 1–4. IEEE, 2018.
- [18] Yi Shen, Hao Liu, Xinxin Liu, Wenjing Zhou, Chang Zhou, and Yizhou Chen. Localization through particle filter powered neural network estimated monocular camera poses. arXiv preprint arXiv:2404.17685, 2024.
- [19] John Wilder Tukey et al. Exploratory data analysis, volume 2. Springer, 1977.
- [20] Yi Xin, Junlong Du, Qiang Wang, Ke Yan, and Shouhong Ding. Mmap: Multi-modal alignment prompt for cross-domain multi-task learning. In Proceedings of the AAAI Conference on Artificial Intelligence, volume 38, pages 16076–16084, 2024.
- [21] Wei Xu, Jianlong Chen, Zhicheng Ding, and Jinyin Wang. Text sentiment analysis and classification based on bidirectional gated recurrent units (grus) model. arXiv preprint arXiv:2404.17123, 2024.
- [22] Qikai Yang, Panfeng Li, Zhicheng Ding, Wenjing Zhou, Yi Nian, and Xinhe Xu. A comparative study on enhancing prediction in social network advertisement through data augmentation. arXiv preprint arXiv:2404.13812, 2024.
- [23] Jiajie Yuan, Linxiao Wu, Yulu Gong, Zhou Yu, Ziang Liu, and Shuyao He. Research on intelligent aided diagnosis system of medical image based on computer deep learning. arXiv preprint arXiv:2404.18419, 2024.
- [24] Chang Zhou, Yang Zhao, Jin Cao, Yi Shen, Xiaoling Cui, and Chiyu Cheng. Optimizing search advertising strategies: Integrating reinforcement learning with generalized second-price auctions for enhanced ad ranking and bidding, 2024.