Femtoscopy at NA61/SHINE using symmetric Lévy sources
in central 40Ar+45Sc from 40 GeV/c to 150 GeV/c
Abstract
In the recent decades of high energy physics research, it was demonstrated that strongly interacting quark-gluon plasma (sQGP) is created in ultra-relativistic nucleus-nucleus collisions. Investigation and understanding of properties of the hadronic matter is among the important goals of NA61/SHINE collaboration at CERN SPS. Mapping of the phase diagram is achieved by varying the collision energy (5 GeV 17 GeV) and by changing the collision system (p+p, p+Pb, Be+Be, Ar+Sc, Xe+La, Pb+Pb).
We report on the measurement of femtoscopic correlations in intermediate systems at intermediate SPS energies. Interpreting the results of measurements within the symmetric Lévy source formalism, we discuss the values of Lévy source parameters as a function of average pair transverse mass. One of the physical parameters is particularly important, the Lévy exponent , which describes the shape of the source and may be related to the critical exponent in the proximity of the critical point. Therefore, measuring it may shed light on the location of the critical endpoint of the QCD phase diagram.
keywords:
quark-gluon plasma; strong interaction; fixed-target experiment; femtoscopy; heavy-ion; HBT; Lévy-shapePACS numbers: 25.75.-q, 25.75.Ag, 25.75.Gz, 25.75.Nq
1 Introduction
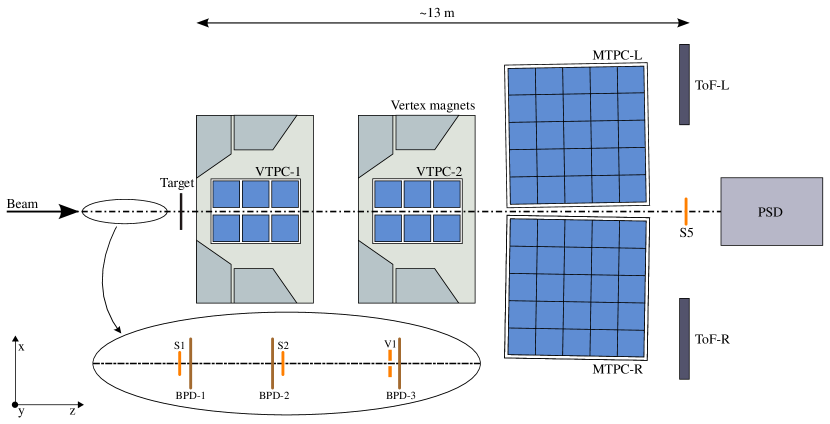
The NA61/SHINE is a fixed-target experiment located on the North Area H2 beam line of the CERN SPS. The experiment utilizes multiple Time Projection Chambers (TPCs) that cover the entire forward hemisphere, effectively functioning as a large-acceptance hadron spectrometer, more details in Ref. \refciteAbgrall:2014xwa. The detector setup of NA61/SHINE, depicted in Fig. 1, enables exceptional tracking capabilities down to GeV/c.
The primary objectives of NA61/SHINE include investigating and mapping the phase diagram of strongly interacting matter at various temperatures and baryon-chemical potentials, essentially creating a system and beam energy scan. This proceedings focuses on our study using intermediate (40Ar+45Sc) collision system at 40A GeV/c and 75A GeV/c beam momentum ( and GeV, respectively), at 0-10% centrality comparing to our previous analysis at 150A GeV/c ( GeV). Our analysis studies the QCD phase diagram using quantum-statistical (Bose-Einstein) correlations with final state interactions, with spherically symmetric Lévy distributions:
| (1) |
where is the Lévy scale parameter, is the Lévy stability index, is the vector of spatial coordinates and the vector represents the integration variable (we also use in all of the equations).
The key relationship for measuring Bose-Einstein correlations shows that the momentum correlations, , are related to the properties of the particle emitting source, , which describes the probability density of particle creation for a relative coordinate x. This is expressed as
| (2) |
where is the Fourier transform of , and q is the relative momentum of the particle pair (with the dependence on the average momentum, , of the pair suppressed. See more details in Ref. 2).
The Lévy assumption results in a statistically acceptable description of the source. Two special cases of the distribution in Eq.(1) are the Gaussian distribution for and Cauchy distribution with . Unlike the Gaussian assumption, in our case a more general approach is taken by not restricting our assumption to . Non-Gaussianity may arise due to critical fluctuations and the emergence of large-scale spatial correlations [3]. Moreover, Lévy distribution shows a power-law tail in three dimensions for , where . Critical behavior is characterized by, among others the critical exponent related to spatial correlations, , which follows a power-law tail as well, with d denoting dimensions. It is suggested in Refs. 4, 5 that the universality class of quantum chromodynamics (QCD) matches that of the 3D Ising model. In the 3D Ising model, [6]. Alternatively, the random external field 3D Ising model’s universality class may be considered, corresponding to [7]. The Lévy exponent has been proposed to be directly related to or explicitly equal to the critical exponent [8], in absence of other phenomena affecting the source shape. However, the Lévy-shape of the source can also be influenced to several different factors besides critical phenomena, including QCD jets, anomalous diffusion, and others, more in Refs. 9, 10, 11, 12, 13. Therefore, while a non-monotonic behavior of is expected based on the above simple picture, to understand the physical processes influencing the spatial structure of the hadron emission, measurements of are needed in different collision systems at various energies. For an overview of recent experimental results, see Ref. \refciteCsanad:2024hva.
The Lévy exponent of the source distribution can be measured using femtoscopic correlation functions. These correlation functions admit the following form for Lévy sources:
| (3) |
where is the correlation function in absence of interaction. If , the correlation function is exponential, while if , the function becomes a Gaussian. The third physical parameter appearing in the above equation is the correlation strength (often called intercept parameter) which is interpreted in terms of the core-halo model in Refs. 15, 16.
At vanishing relative momentum, the correlation function of Eq.(3) reaches the intercept value . Since zero relative momentum is not accessible in the measurements, extrapolation from the region where two tracks are experimentally resolved, is needed. It is commonly observed that the intercept parameter is less than 1, as also expected from Eq.(4). It is important to highlight that can also be attributed to other factors, such as coherent pion production [15, 17] or background noise from improperly reconstructed particles.
The core-halo model proposes that the source S is made up of two parts, the core and the halo and , respectively [16, 15]. The core contains pions created close to the center, directly from hadronic freeze-out (primordial pions) or from extremely short lived (strongly decaying) resonances. The halo consists of pions created from longer-lived resonances and the general background. It may extend to thousands of femtometers, while core part has a size of around a few femtometers. The intercept parameter then can be expressed as
| (4) |
where N denotes their respective multiplicities in the given event class and contains all pions created.
2 Measurement details
We discuss the measurements of one-dimensional two-pion femtoscopy correlation functions for identified pion pairs in Ar+Sc collisions at 40A GeV/c and 75A GeV/c with 0-10% centrality. We investigate the combination of positive pion pairs () and negative pion pairs (). Event and track quality cuts were applied before particle identification (PID). The PID was done by measuring the energy loss in the TPC gas (d/d) and comparison with the Bethe-Bloch curves. The contribution from track merging were eliminated with momentum based two-track distance cut, mentioned in Ref. \refciteCzopowicz:2022nzy.
The centrality interval was selected by measuring the forward energy with the PSD. The measured pion pairs were grouped into seven average transverse momentum bins ranging from 0 to 500 MeV/c.
In this analysis, as mentioned above, we investigate like-charged pion pairs that are influenced by the Coulomb repulsion. The final state Coulomb effect has been neglected in the previously defined correlation function. The correction necessitated by this effect can be done by simply taking the ratio of and :
| (5) |
where is the interference of solutions of the two-particle Schrödinger equation with a Coulomb-potential [19, 20]. The numerator in Eq.(5) cannot be calculated analytically and requires numerical calculations. Due to the assumption of Lévy-shaped sources a new treatment is needed. The treatment method used in this analysis is a novel numerical calculation of the Coulomb final-state interaction for Bose-Einstein correlation functions, presented in Ref. \refciteNagy:2023zbg. Then, one can modify the correlation function, Eq.(3), coupling it with the core-halo picture by utilizing the Bowler-Sinyukov method [22, 23]. The halo part contributes at very small values of relative momenta, q. Therefore, it does not affect the source radii of the core part [24]. Then the correlation function takes the following form:
| (6) |
where is introduced as normalization parameter and handles the Coulomb interaction, additionally is introduced to describe a possible long-range linear background in the form of . It is important to highlight that the Coulomb correction is calculated in the pair-center-of-mass (PCMS) system, while the measurement is often done in the longitudinally co-moving system (LCMS). The assumption of Coulomb correction for the one-dimensional Bose-Einstein correlations in LCMS picture is that the shape of the source is spherical, i.e. . The shape of the source, however, is spherical in the LCMS and not in the PCMS. Therefore, an approximate one-dimensional PCMS size parameter is needed. In a recent study detailed in [25], the average PCMS radius was calculated using the following formula:
| (7) |
where . Moreover, momentum difference in the Coulomb correction is in PCMS as a function of (the invariant four-momentum difference equals the three-momentum difference in the PCMS). Furthermore,, one would need to perform the measurement as a function of both and . Following the estimation in Ref. \refciteKurgyis:2020vbz, a simple, approximate relation of the two may be given as . Implementing both of the above mentioned effects results in the following formula for the Coulomb correction expressed in terms of and , based on the 3D calculation in PCMS:
| (8) |
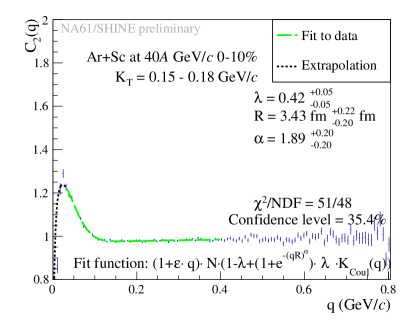
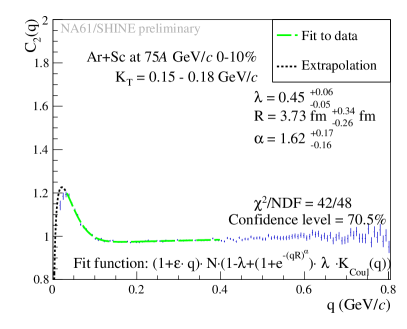
To illustrate, two example fits using Eq.(6) are shown on Fig. 2. Based on the goodness-of-fit of the measured correlation functions, the Lévy-stable source assumption is statistically acceptable.
3 Results
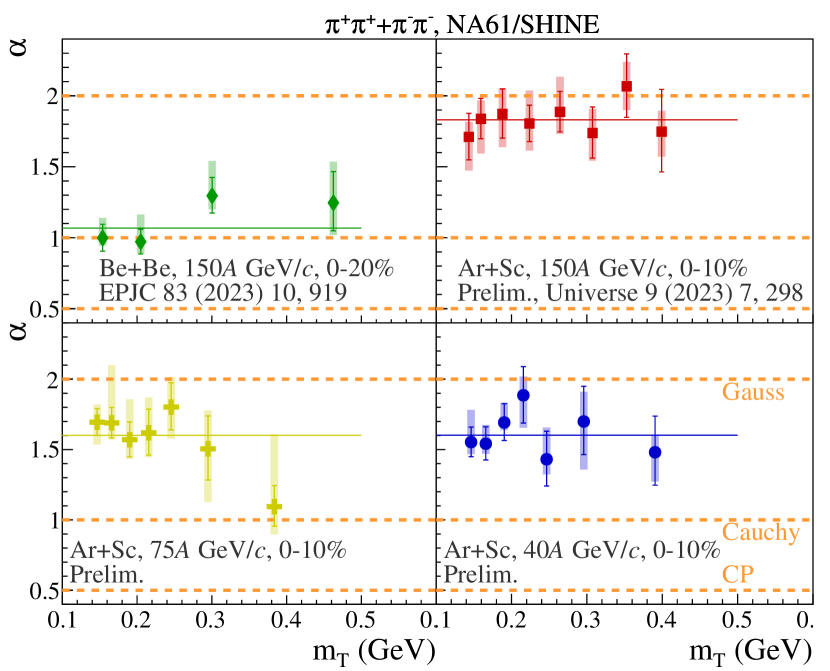
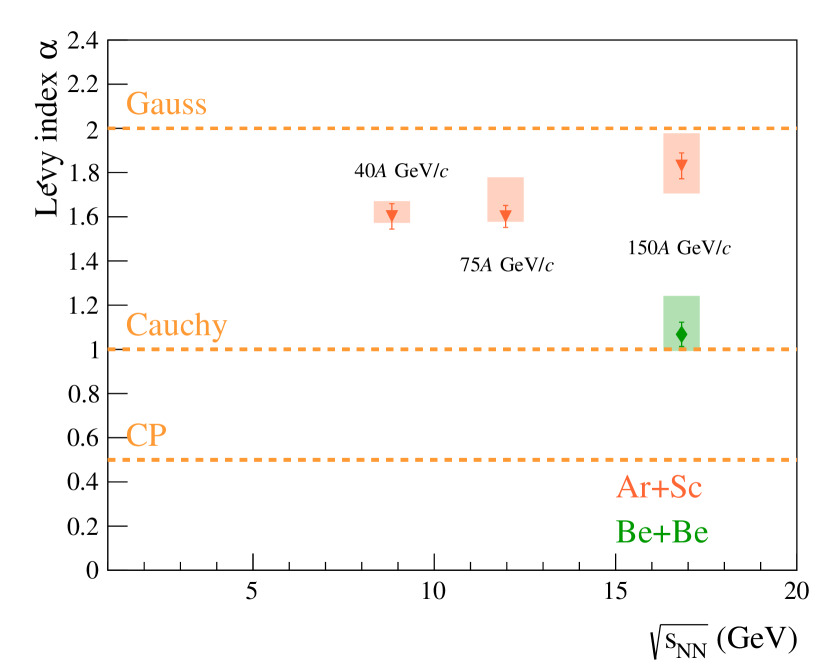
The three physical parameters (, , and ) were measured in seven bins of pair transverse momentum, . The three mentioned parameters were obtained through fitting the measured correlation functions with the formula shown in Eq.(6). The results were investigated regarding their transverse momentum dependence. In the following, we discuss the transverse mass dependence of , , and ; where transverse mass is expressed as . As explained above, the shape of the source is often assumed to be Gaussian. The Lévy stability exponent, , can be used to extract the shape of the tail of the source. Our results for 40A GeV/ and 75A GeV/, shown on bottom part of Fig. 3, yield values for between 1.5 and 2.0, comparable to the highest beam energy result in Ar+Sc at 150A GeV/ [26], which imply a source closer to the Gaussian shape ( case). Contrary to the one in Be+Be collisions [2] which shows approximately Cauchy shaped source ( case). The observed parameter is also significantly higher than the conjectured value at the CP (). Assuming no dependence for the shape of the source ( on m, one can fit a constant to (or equivalently, calculate a weighted average of) the parameter values. In our case, we performed the fit using only the statistical uncertainties of parameter values, shown on Fig. 4. In the lower energies of Ar+Sc system, an interesting trend seem to be developing which will be explored further. Other experimental results can be found in Ref. \refciteCsanad:2024hva.
The Lévy scale parameter is related to kind of homogeneity scale (usually referred as homogeneity length for Gaussian sources [27]) of the pion emitting source. From simple hydrodynamical models [16, 28] one obtains a decreasing trend of Gaussian radii with transverse-mass. In Fig. 6 a slight decrease for higher values are observed for the Lévy scale in both systems and in all energies. This might be the result of transverse flow. Furthermore, parameter values seem to be similar at all energies in the Ar+Sc system and slightly smaller in the Be+Be system which might be attributed to the difference in initial geometrical size of the two collision systems. We observe an trend compatible with prediction, which is particularly interesting as this type of dependence was predicted for Gaussian sources () in Ref. \refciteSinyukov:1994vg. The origin of this dependence is presently unknown, and it may form in the QGP or at a later stage. This phenomenon was also observed at RHIC [30, 31] and LHC [32] and in simulations (at RHIC and LHC energies) [12, 13].
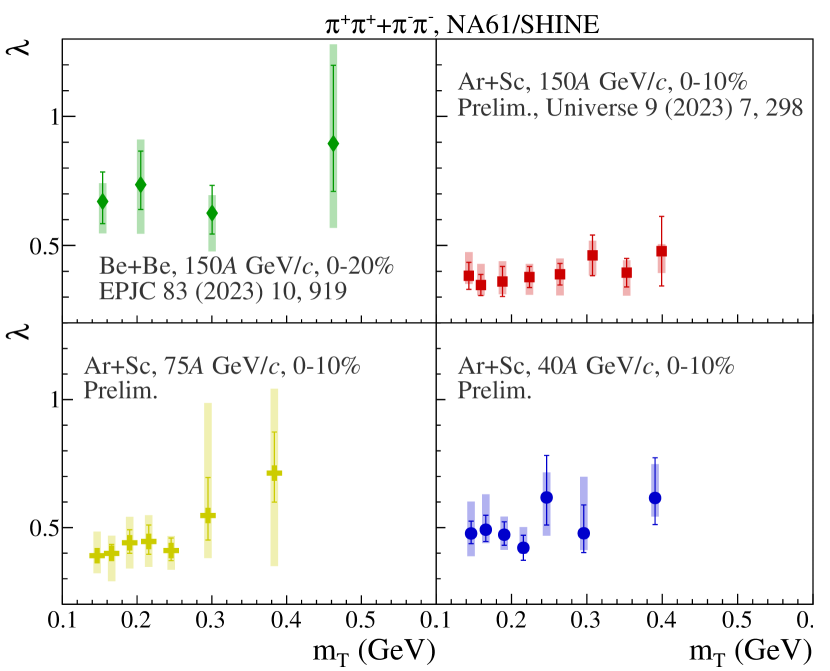
The final parameter to investigate is the correlation strength (also known as the intercept) parameter , defined in Eq.(4). The transverse mass dependence of is shown in Fig. 5. One may observe that this parameter is slightly dependent on but mostly constant within uncertainties. When compared to measurements from RHIC Au+Au collisions [30, 33, 34] and from SPS Pb+Pb interactions [35, 36], an interesting phenomenon is observed. In the case of SPS experiments, there is no visible decrease at lower values, however it appears in the case of RHIC experiments. The decrease (or “hole”) was interpreted in Ref. \refcitePHENIX:2017ino to be a sign of in-medium mass modification of . Our results, at the given statistical precision, do not indicate the presence of such a low- decrease, although in 75A GeV/ there seems to be some dependence on , however still within uncertainties. Furthermore, it is important to note that our values for are significantly smaller than unity, which might imply that a significant fraction of pions are the decay products of long lived resonances or weak decays.

4 Conclusion
In this paper, we presented the NA61/SHINE measurements of one-dimensional two-pion femtoscopic correlation functions in Ar+Sc collisions at 40A GeV/c and 75A GeV/c beam momentum within the 0-10% centrality range. We fitted these correlation functons based on the assumption of Lévy-shaped source distributions, and investigated the transverse mass dependence of the source parameters. We furthermore compared them to previous NA61/SHINE results. Our analysis revealed that the Lévy scale parameter, , deviates from Gaussian sources and does not align with the conjectured value at the critical point. Additionally, the Lévy scale parameter, , exhibits a noticeable decrease with . Unlike RHIC results but consistent with earlier SPS measurements, the correlation strength parameter, , shows no significant dependence on . In future studies, we plan to measure Bose-Einstein correlations in larger systems and at lower energies to further investigate the phase diagram of strongly interacting matter.
Acknowledgments
The author acknowledges support of the DKOP-23 Doctoral Excellence Program of the Ministry for Culture and Innovation, and was furthermore supported by K-138136 and K-138152 grants of the National Research, Development and Innovation Fund.
References
- [1] NA61/SHINE Collaboration (N. Abgrall et al.), JINST 9, P06005 (2014), arXiv:1401.4699 [physics.ins-det], 10.1088/1748-0221/9/06/P06005.
- [2] NA61/SHINE Collaboration (H. Adhikary et al.), Eur. Phys. J. C 83, 919 (2023), arXiv:2302.04593 [nucl-ex], 10.1140/epjc/s10052-023-11997-8.
- [3] T. Csörgő, PoS HIGH-PTLHC08, 027 (2008), arXiv:0903.0669 [nucl-th], 10.22323/1.076.0027.
- [4] A. M. Halász et al., Phys. Rev. D 58, 096007 (1998), arXiv:hep-ph/9804290, 10.1103/PhysRevD.58.096007.
- [5] M. A. Stephanov, K. Rajagopal and E. V. Shuryak, Phys. Rev. Lett. 81, 4816 (1998), 10.1103/PhysRevLett.81.4816.
- [6] S. El-Showk et al., J. Stat. Phys. 157, 869 (2014), arXiv:1403.4545 [hep-th], 10.1007/s10955-014-1042-7.
- [7] H. Rieger, Physical Review B 52, 6659 (1995), 10.1103/PhysRevB.52.6659.
- [8] T. Csörgő, S. Hegyi, T. Novák and W. A. Zajc, AIP Conf. Proc. 828, 525 (2006), 10.1063/1.2197465.
- [9] R. Metzler, E. Barkai and J. Klafter, Phys. Rev. Lett. 82, 3563 (1999), 10.1103/PhysRevLett.82.3563.
- [10] T. Csörgő, S. Hegyi and W. A. Zajc, Eur. Phys. J. C 36, 67 (2004), arXiv:nucl-th/0310042, 10.1140/epjc/s2004-01870-9.
- [11] T. Csörgő, S. Hegyi, T. Novak and W. A. Zajc, Acta Phys. Polon. B 36, 329 (2005).
- [12] D. Kincses, M. Stefaniak and M. Csanád, Entropy 24, 308 (2022), arXiv:2201.07962 [hep-ph], 10.3390/e24030308.
- [13] B. Kórodi, D. Kincses and M. Csanád, Phys. Lett. B 847, 138295 (2023), arXiv:2212.02980 [nucl-th], 10.1016/j.physletb.2023.138295.
- [14] M. Csanád and D. Kincses, Universe 10, 54 (2024), arXiv:2401.01249 [hep-ph], 10.3390/universe10020054.
- [15] T. Csörgő, Acta Phys. Hung. A 15, 1 (2002), arXiv:hep-ph/0001233, 10.1556/APH.15.2002.1-2.1.
- [16] T. Csörgő and B. Lörstad, Phys. Rev. C 54, 1390 (1996), arXiv:hep-ph/9509213, 10.1103/PhysRevC.54.1390.
- [17] R. M. Weiner, Phys. Rept. 327, 249 (2000), arXiv:hep-ph/9904389, 10.1016/S0370-1573(99)00114-3.
- [18] NA61/SHINE Collaboration (T. Czopowicz), PoS CPOD2021, 039 (2022), 10.22323/1.400.0039.
- [19] D. Kincses, M. I. Nagy and M. Csanád, Phys. Rev. C 102, 064912 (2020), arXiv:1912.01381 [hep-ph], 10.1103/PhysRevC.102.064912.
- [20] M. Csanád, S. Lökös and M. Nagy, Phys. Part. Nucl. 51, 238 (2020), arXiv:1910.02231 [hep-ph], 10.1134/S1063779620030089.
- [21] M. Nagy, A. Purzsa, M. Csanád and D. Kincses, Eur. Phys. J. C 83, 1015 (2023), arXiv:2308.10745 [nucl-th], 10.1140/epjc/s10052-023-12161-y.
- [22] Y. Sinyukov et al., Phys. Lett. B 432, 248 (1998), 10.1016/S0370-2693(98)00653-4.
- [23] M. G. Bowler, Phys. Lett. B 270, 69 (1991), 10.1016/0370-2693(91)91541-3.
- [24] R. Maj and S. Mrowczynski, Phys. Rev. C 80, 034907 (2009), arXiv:0903.0111 [nucl-th], 10.1103/PhysRevC.80.034907.
- [25] B. Kurgyis, D. Kincses, M. Nagy and M. Csanád, Universe 9, 328 (2023), arXiv:2007.10173 [nucl-th], 10.3390/universe9070328.
- [26] NA61/SHINE Collaboration (B. Porfy), Universe 9, 298 (2023), arXiv:2306.08696 [nucl-ex], 10.3390/universe9070298.
- [27] Y. M. Sinyukov, Hot Hadronic Matter: Theory and Experiment , 309 (1995).
- [28] M. Csanád and M. Vargyas, Eur. Phys. J. A 44, 473 (2010), arXiv:0909.4842 [nucl-th], 10.1140/epja/i2010-10973-3.
- [29] Y. M. Sinyukov, Nucl. Phys. A 566, 589C (1994), 10.1016/0375-9474(94)90700-5.
- [30] PHENIX Collaboration (A. Adare et al.), Phys. Rev. C 97, 064911 (2018), arXiv:1709.05649 [nucl-ex], 10.1103/PhysRevC.97.064911.
- [31] STAR Collaboration (D. Kincses), Universe 10, 102 (2024), arXiv:2401.11169 [nucl-ex], 10.3390/universe10030102.
- [32] CMS Collaboration, M. Csanad, Two-particle Bose-Einstein correlations and their Levy parameters in PbPb collisions at 5.02 TeV, in 16th Workshop on Particle Correlations and Femtoscopy, (3 2024). arXiv:2403.14722 [nucl-ex].
- [33] R. Vértesi, T. Csörgő and J. Sziklai, Phys. Rev. C 83, 054903 (2011), arXiv:0912.0258 [nucl-ex], 10.1103/PhysRevC.83.054903.
- [34] STAR Collaboration (B. I. Abelev et al.), Phys. Rev. C 80, 024905 (2009), arXiv:0903.1296 [nucl-ex], 10.1103/PhysRevC.80.024905.
- [35] NA44 Collaboration (H. Beker et al.), Phys. Rev. Lett. 74, 3340 (1995), 10.1103/PhysRevLett.74.3340.
- [36] NA49 Collaboration (C. Alt et al.), Phys. Rev. C 77, 064908 (2008), arXiv:0709.4507 [nucl-ex], 10.1103/PhysRevC.77.064908.