WISDOM project XX. – Strong shear tearing molecular clouds apart in NGC 524
Abstract
Early-type galaxies (ETGs) are known to harbour dense spheroids of stars but scarce star formation (SF). Approximately a quarter of these galaxies have rich molecular gas reservoirs yet do not form stars efficiently. We study here the ETG NGC 524, with strong shear suspected to result in a smooth molecular gas disc and low star-formation efficiency (SFE). We present new spatially-resolved observations of the 12CO(2-1)-emitting cold molecular gas from the Atacama Large Millimeter/sub-millimeter Array (ALMA) and of the warm ionised-gas emission lines from SITELLE at the Canada-France-Hawaii Telescope. Although constrained by the resolution of the ALMA observations ( pc), we identify only GMCs with radii ranging from to pc, a low mean molecular gas mass surface density M⊙ pc-2 and a high mean virial parameter . We measure spatially-resolved molecular gas depletion times () with a spatial resolution of pc within a galactocentric distance of kpc. The global depletion time is Gyr but increases toward the galaxy centre, with a maximum Gyr. However, no pure H ii region is identified in NGC 524 using ionised-gas emission-line ratio diagnostics, so the inferred are in fact lower limits. Measuring the GMC properties and dynamical states, we conclude that shear is the dominant mechanism shaping the molecular gas properties and regulating SF in NGC 524. This is supported by analogous analyses of the GMCs in a simulated ETG similar to NGC 524.
keywords:
galaxies: bulge – galaxies: individual: NGC 524 – galaxies: elliptical and lenticular – galaxies: ISM – ISM: clouds – ISM: H ii regions1 Introduction
Results from the past two decades of optical imaging (e.g. the Sloan Digital Sky Survey, SDSS; York et al. 2000) of the local (redshifts ) Universe have revealed the existence of a bimodality in the distribution of local galaxies: blue star-forming late-type galaxies (LTGs) form a so-called star-forming ‘main sequence’ and red quiescent early-type galaxies (ETGs) form a ‘red sequence’ (e.g. Kauffmann et al., 2003; Cirasuolo et al., 2007). Despite their name, ETGs are the more evolved systems, having gone through mergers and intense star formation (SF) and now harbouring large spheroids of old stars. The SF rates (SFRs) of ETGs are thus well below those of main-sequence galaxies (e.g. Noeske et al., 2007; Schiminovich et al., 2007; Wuyts et al., 2011; Salmi et al., 2012). One well-accepted theory associates insufficient SF with a lack of cold molecular gas. While it is true that many ETGs have had their cold gas depleted and/or heated as a result of merger-triggered starbursts and/or active galactic nucleus (AGN) feedback, recent molecular gas surveys of nearby galaxies raise another question: why is SF quenched in gas-rich ETGs? In the local Universe, of ETGs harbour substantial molecular gas reservoirs (Young et al., 2011a; Davis et al., 2019). This gas is typically located in centrally-concentrated discs that are dynamically cold (Alatalo et al., 2013; Davis et al., 2013; Ruffa et al., 2019a, b). To preserve the quenched SF observed in these ETGs, the physical conditions of the cold molecular gas reservoirs must be significantly different from those of LTGs.
The cold molecular gas in the interstellar medium (ISM) is closely linked to ongoing SF (e.g. Leroy et al., 2008) and thus the evolution of galaxies. Molecular gas in present-day galaxy discs is formed from the dense atomic gas, compressed by external forces (e.g. spiral density waves) and/or its own gravity via local instabilities. Under the correct conditions (e.g. shielded from hard radiation), cold molecular gas fragments into giant molecular clouds (GMCs) that are the birthplaces of star clusters. The properties of GMCs are governed by mechanisms that clump gas together as well as dissipative forces that tend to break clouds apart (e.g. shear and turbulence). Therefore, quantitative analyses of GMC properties and their governing mechanisms should disentangle what separates ETGs from LTGs in terms of (quenched) SF (see e.g. Chevance et al., 2022).
The first systematic study of GMCs in an ETG was carried out by Utomo et al. (2015a) using Combined Array for Research in Milimeter-wave Astronomy observations of NGC 4526. These authors showed that the basic properties (e.g. size, linewidth or velocity dispersion and luminosity) of the GMCs of this ETG deviate from those of Milky Way (MW) GMCs. NGC 4526 GMCs have a much larger linewidth and luminosity at a given radius and no size – linewidth correlation. Another ETG, NGC 4429, was studied by Liu et al. (2021) and has smaller, denser and more elongated GMCs than the MW. The properties of the NGC 4429 GMCs are shaped by galactic shear. However, a similar ETG, NGC 1387, has GMCs that resemble those of the MW disc (Liang et al., 2024). Williams et al. (2023) recently performed a beam-by-beam analysis of the molecular gas of ETGs as part of the mm-Wave Interferometric Survey of Dark Object Masses (WISDOM; Onishi et al. 2017). Molecular gas in these ETGs has higher velocity dispersions, virial parameters and internal turbulent pressures than those of nearby star-forming galaxies. As these works have established, while there are variations, the properties of ETG GMCs are generally different from those of GMCs in the MW and nearby star-forming galaxies.
ETGs are characterised by large stellar spheroids. This type of centrally-concentrated stellar distribution creates a deep gravitational potential well that leads to a sharply rising circular velocity curve in the inner regions (e.g. Yoon et al., 2021), and in turn to strong shear. This is known to impact GMC shapes and properties (e.g. Liu et al., 2021) and to be associated with a low star-formation efficiency (SFE; Davis et al. 2014). Large stellar mass volume density gradients, which are the origin of strong shear, are also associated with smoother molecular gas discs (Davis et al., 2022). The influence of strong external forces, such as shear and turbulent pressure, on ETG GMCs has also been confirmed by simulations (e.g. Martig et al., 2009; Gensior et al., 2020, 2023).
Here we present a case study of the galaxy NGC 524, an ETG with a very centrally-concentrated stellar mass distribution. We use new spatially-resolved observations of the 12CO(2-1)-emitting cold molecular gas (spatial resolution pc) from the Atacama Large Millimeter/sub-millimeter Array (ALMA) and of the warm ionised-gas emission lines (resolution pc) from the imaging Fourier transform spectrograph SITELLE at the Canada-France-Hawaii Telescope (CFHT) to study the GMC properties and SFEs. We present our observational data in Section 2 while we identify GMCs and discuss their properties and SFEs in Section 3. We make a comparison to a simulated ETG in Section 4 and discuss the unique role of strong shear to quench SF in Section 5. We summarise and conclude in Section 6.
2 Target and data
2.1 NGC 524
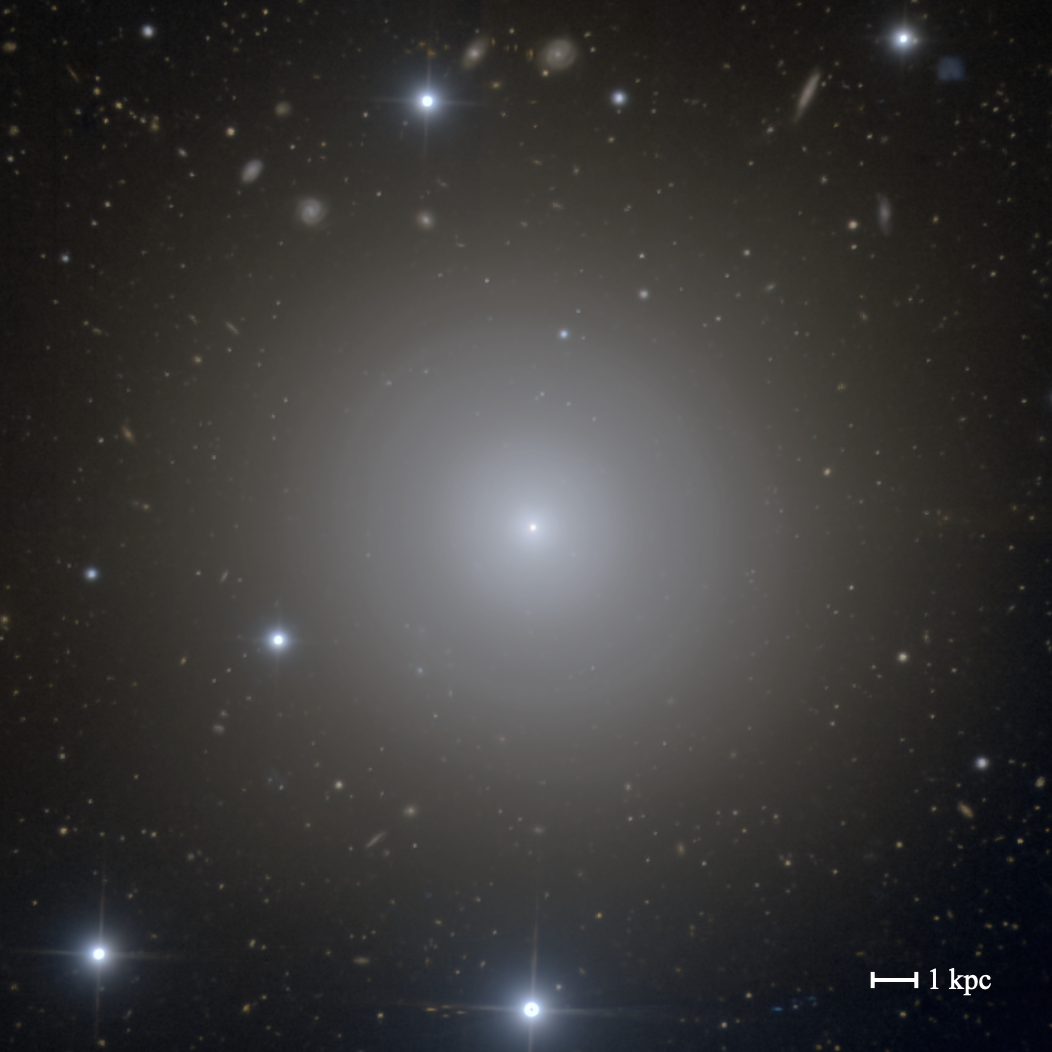
NGC 524 is a nearly face-on SA0 ETG with a cored stellar light profile (Faber et al., 1997). It has an -band effective radius ( kpc) and a stellar velocity dispersion within km s-1 (Cappellari et al., 2006, 2013). It is a fast rotator, with a systemic velocity of km s-1 and a specific angular momentum within (Emsellem et al., 2007). NGC 524 harbours a dense stellar bulge (shown in Figure 1) and a regular central dust disc with flocculent spiral arms, visible in absorption in Hubble Space Telescope (HST) images (Sil’chenko, 2000; Crocker et al., 2011a). Throughout this paper we adopt a distance to NGC 524 Mpc, as used in previous studies (e.g. Smith et al., 2019), derived using surface brightness fluctuations (Tonry et al., 2001) with the Cepheid zero-point of Freedman et al. (2001). At this distance, corresponds to pc. NGC 524 has a total stellar mass of M⊙, SFR of M⊙ yr-1 and molecular gas mass of M⊙ (Davis et al., 2022). This unique combination of high stellar mass, relatively low molecular gas mass and low SFR makes NGC 524 an ideal system in which to study the influence of the gravitational potential on GMCs and SF.
NGC 524 exhibits nuclear activity and is revealed as a compact radio source at GHz by the Very Large Array (Nyland et al., 2016) and Very Long Baseline Interferometry (Filho et al., 2004), with a mJy core (Wrobel & Heeschen, 1991). However, NGC 524 is under-luminous and does not show any nuclear activity at X-ray wavelengths (Dwarakanath & Nath, 2006). Based on stellar kinematics obtained with the adaptive optics-assisted Gemini-North telescope, Krajnović et al. (2009) inferred a supermassive black hole (SMBH) mass M⊙. They also inferred a stellar mass-to-light ratio in the -band M⊙/L⊙,I, having assumed an inclination of from Cappellari et al. (2006). Smith et al. (2019) subsequently used ALMA 12CO(2-1) observations to dynamically infer a SMBH mass of M⊙, roughly consistent with the earlier measurement.
2.2 Molecular gas observations
NGC 524’s molecular gas was first observed as a follow-up to the SAURON (de Zeeuw et al., 2002) and ATLAS3D (Cappellari et al., 2011) projects. Observations of both the 12CO(2-1) and 12CO(1-0) lines with the Institut de Radioastronomie Millimétrique (IRAM) 30-m telescope revealed a double-horned profile typical of a rotating disc and a total molecular hydrogen mass of M⊙ (Young et al., 2011b). Spatially-resolved observations were also obtained using the IRAM Plateau de Bure Interferometer, with a resolution of ( pc2), showing that NGC 524 has a fast-rotating molecular gas disc with a total molecular hydrogen mass of M⊙ and a maximum radius of kpc (Crocker et al., 2011b).
The NGC 524 molecular gas data used here were obtained with ALMA using both the 12-m array and 7-m Atacama Compact Array (ACA, also known as the Morita array; Iguchi et al. 2009). Data were taken as part of the WISDOM project observing programmes 2015.1.00466.S (PI: Onishi), 2016.2.00053.S (PI: Liu) and 2017.1.00391.S (PI: North). These data were first used to measure the supermassive black hole mass at the centre of NGC 524 by Smith et al. (2019). The 12-m data span baselines from m to km, providing the high spatial resolution required for our project, and were taken in four tracks on 26 March 2016, 17 July 2016, 2 May 2017 and 16 September 2018. The ACA observations span shorter baselines from to m, providing the -plane coverage necessary to map more extended gas structures, and were taken in a single track on 25 June 2017. The total on-source time achieved was hr with the 12-m array and hr with the ACA.
For both arrays, a spectral window was positioned to observe the redshifted transition of 12CO at a velocity resolution of km s-1 over a bandwidth of km s-1. Three additional spectral windows were positioned to observe the continuum emission, each with a bandwidth of GHz and a lower velocity resolution.
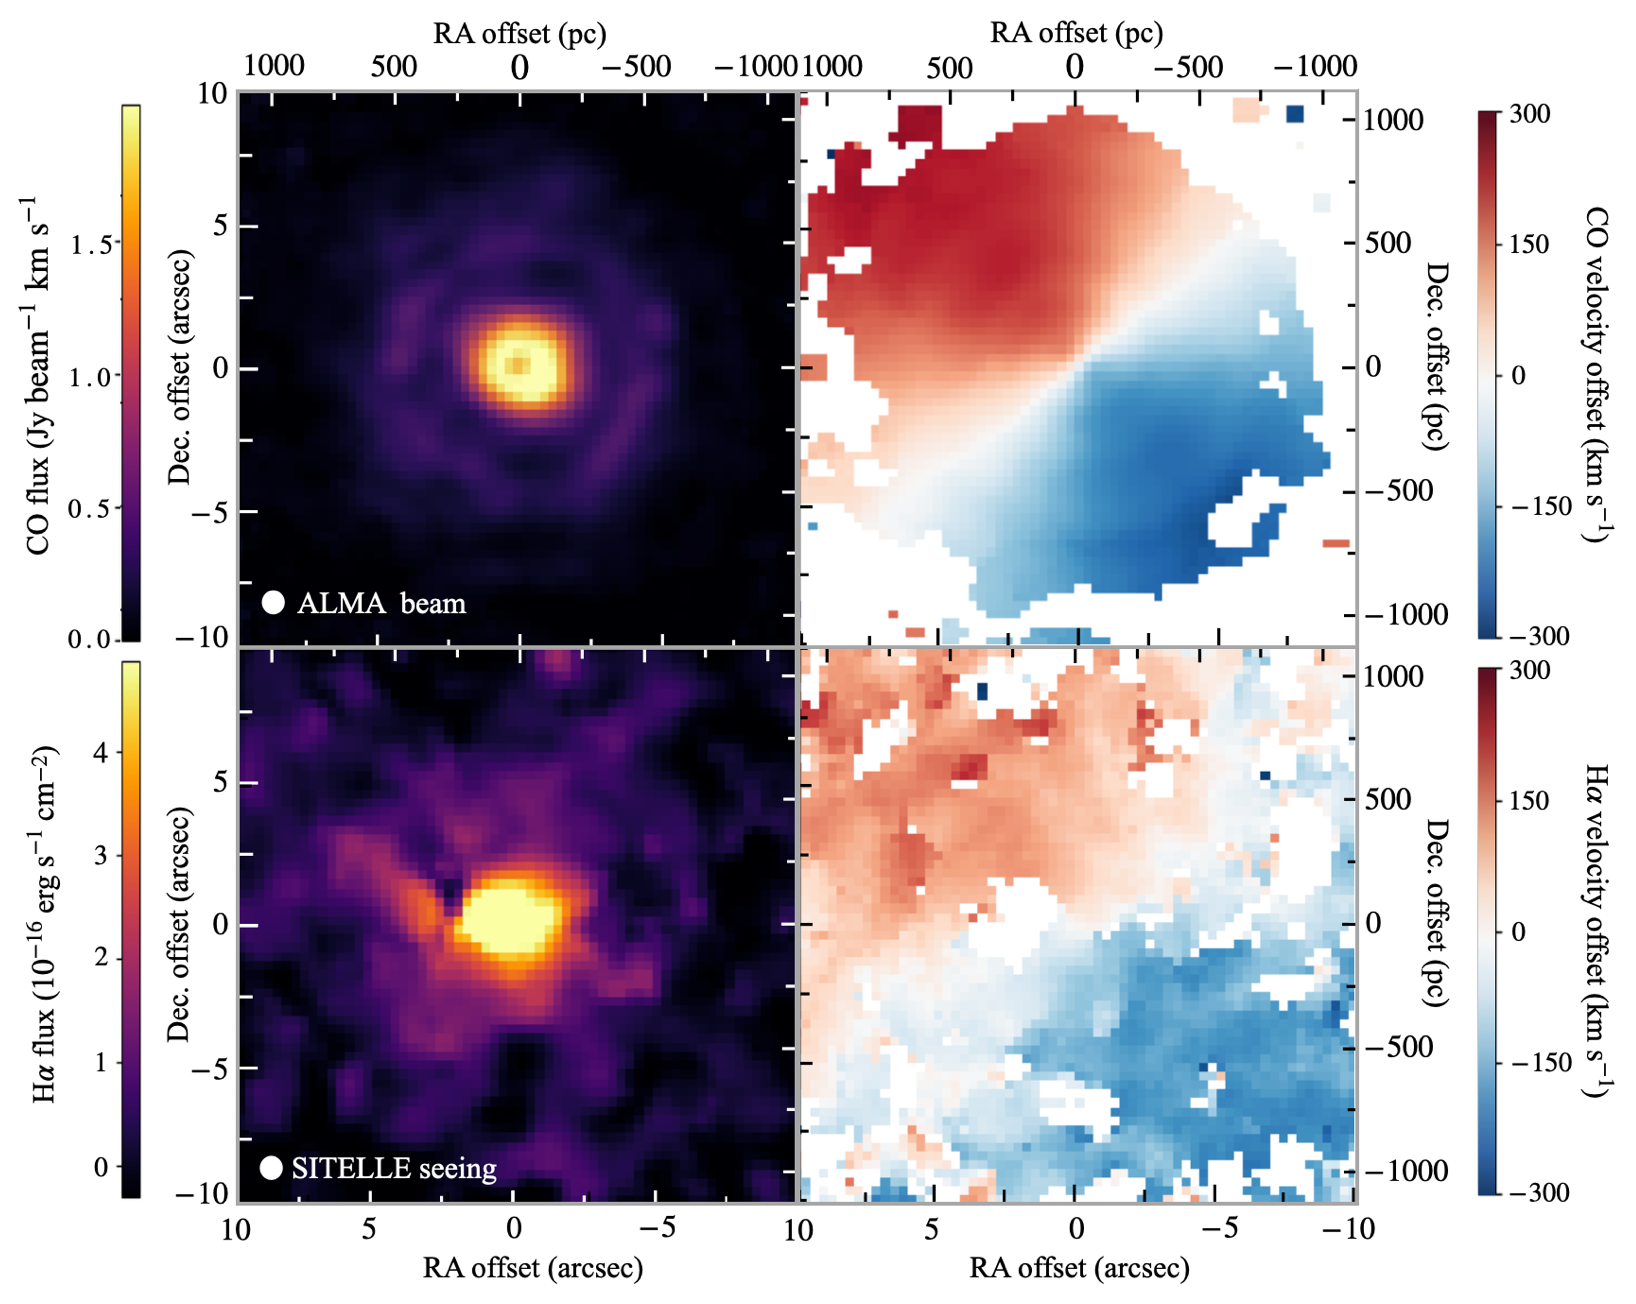
The data were calibrated and combined using the Common Astronomy Software Applications (CASA; McMullin et al. 2007) pipeline. To remove the continuum emission from the line spectral window, a linear fit was made to the line-free channels at both ends of that window as well as the three pure continuum spectral windows and was subtracted from the plane using the CASA task uvcontsub. The resulting line data were imaged into two RA-Dec.-velocity cubes with different synthesised beam sizes and channel widths. A first cube was created for the GMC analyses of this paper, with km s-1 channels and Briggs’ weighting with a robust parameter of , resulting in a synthesised beam of ( pc2) full-width at half-maximum (FWHM) and a sensitivity of mJy beam-1 per channel. A second data cube was created for the SFE studies, with km s-1 channels, Briggs’ weighting with a robust parameter of and a -taper of , thus achieving a synthesised beam of ( pc2), roughly matching the seeing of the H observations (see Section 2.3). We then convolved this data cube spatially with a narrow and slightly elongated two-dimensional Gaussian, to achieve a perfectly circular synthesised beam of ( pc2) and a sensitivity of mJy beam-1 per channel, that perfectly matches the seeing of the H observations. The moment-0 (total intensity) and moment-1 (intensity-weighted mean line-of-sight velocity) map of this data cube are shown in Figure 2, while the moment-0 map of the km s-1 channel data cube is illustrated in the top panel of Figure 3.
The 12CO(2-1) flux () within each spaxel is obtained from the resolution moment-0 map by dividing the surface brightness in each spaxel (in units of Jy beam-1 km s-1) by the synthesised beam area in spaxels. This flux is then converted into a luminosity according to
| (1) |
(e.g. Decarli et al., 2016), where is the galaxy redshift and is the observed frequency (i.e. the redshifted frequency of the 12CO(2-1) line). The luminosity-based molecular gas mass within each spaxel is then calculated using
| (2) |
where is the 12CO(1-0) luminosity and is the 12CO(1-0)-to-molecules conversion factor. We adopt a 12CO(2-1)/12CO(1-0) ratio of (in brightness temperature units), typical of spiral galaxies (e.g. Lamperti et al., 2020), and cm-2 (K km s-1)-1, commonly used in extragalactic studies (e.g. Hughes et al., 2013; Utomo et al., 2015b; Sun et al., 2018), although the latter can depend on the metallicity and environment of a molecular cloud (e.g. radiation field; Bolatto et al. 2013). The mass contribution of helium and other heavy elements is included in this coefficient (Strong et al., 1988; Bolatto et al., 2013). The complete conversion thus becomes
| (3) |
The molecular gas mass surface density within one spaxel () is then calculated as divided by the spaxel area. The molecular gas mass surface density within a region tightly encompassing the molecular gas disc (a or kpc2 box centred at the galaxy centre; see Figure 2) is M⊙ pc-2, calculated as the sum of divided by the area of the region. Within a kpc galactocentric distance circular aperture, we measure M⊙ pc-2, consistent with the molecular hydrogen mass surface density within that same aperture reported by Davis et al. (2022).
2.3 Ionised-gas observations
NGC 524 was observed at CFHT with SITELLE (Drissen et al., 2019), an optical imaging Fourier transform spectrograph equipped with two E2V detectors each with pixels. The SITELLE field of view is , resulting in a mean spaxel size on the sky of ( pc2). Two data cubes were obtained: one centred on the emission lines of [N ii], H, [N ii], [S ii] and [S ii] with the SN3 filter ( – Å) at a mean spectral resolution (2022B semester, programme number 22Bc09); the other centred on the emission lines of H, [O iii] and [O iii] with the SN2 filter ( – Å) at a mean spectral resolution (2020B semester, programme number 20Bc25). The observations were centred at and .
The data reduction was performed with the ORBS software developed for SITELLE (Martin et al., 2015, 2021). The seeing was measured to be ( pc) from the FWHM of Gaussian fits to foreground stars from the Gaia catalogue (Lindegren et al., 2018). The SN3 data were further calibrated in wavelength based on velocity measurements of the OH sky line, allowing to use this cube for line-of-sight velocity measurements with an absolute precision of a few km s-1 (Martin et al., 2016). Sky subtraction was performed using a median sky spectrum extracted from a spaxels region located far away from the galaxy.
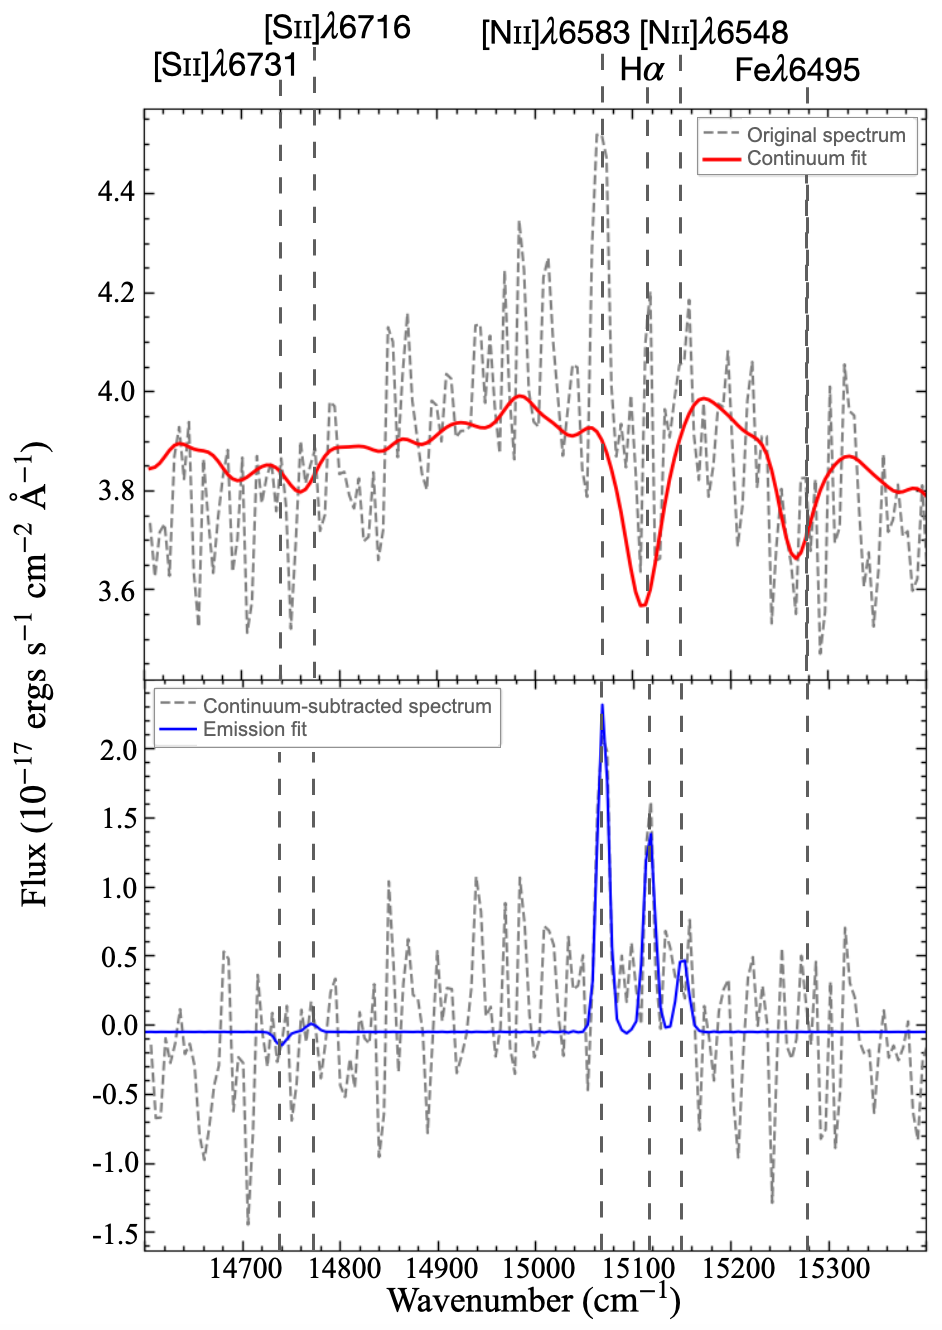
NGC 524 is an ETG with a high-surface brightness core of old stars, so to measure faint emission-line fluxes, additional care must be taken to accurately remove the strong stellar continuum. At each spaxel and for each of the SN3 and SN2 filters, we integrate spectra within a nearby region allowing for the best signal-to-noise ratio (; see Appendix A), fit the stellar continuum of this region using penalised pixel fitting (pPXF; Cappellari 2022) and then subtract this stellar continuum from the original spectrum. This process is critical for the accurate fitting of emission-line fluxes in the SN3 data cube, as illustrated in Appendix A. For the SN2 data cube, larger binning is required to achieve sufficiently high .
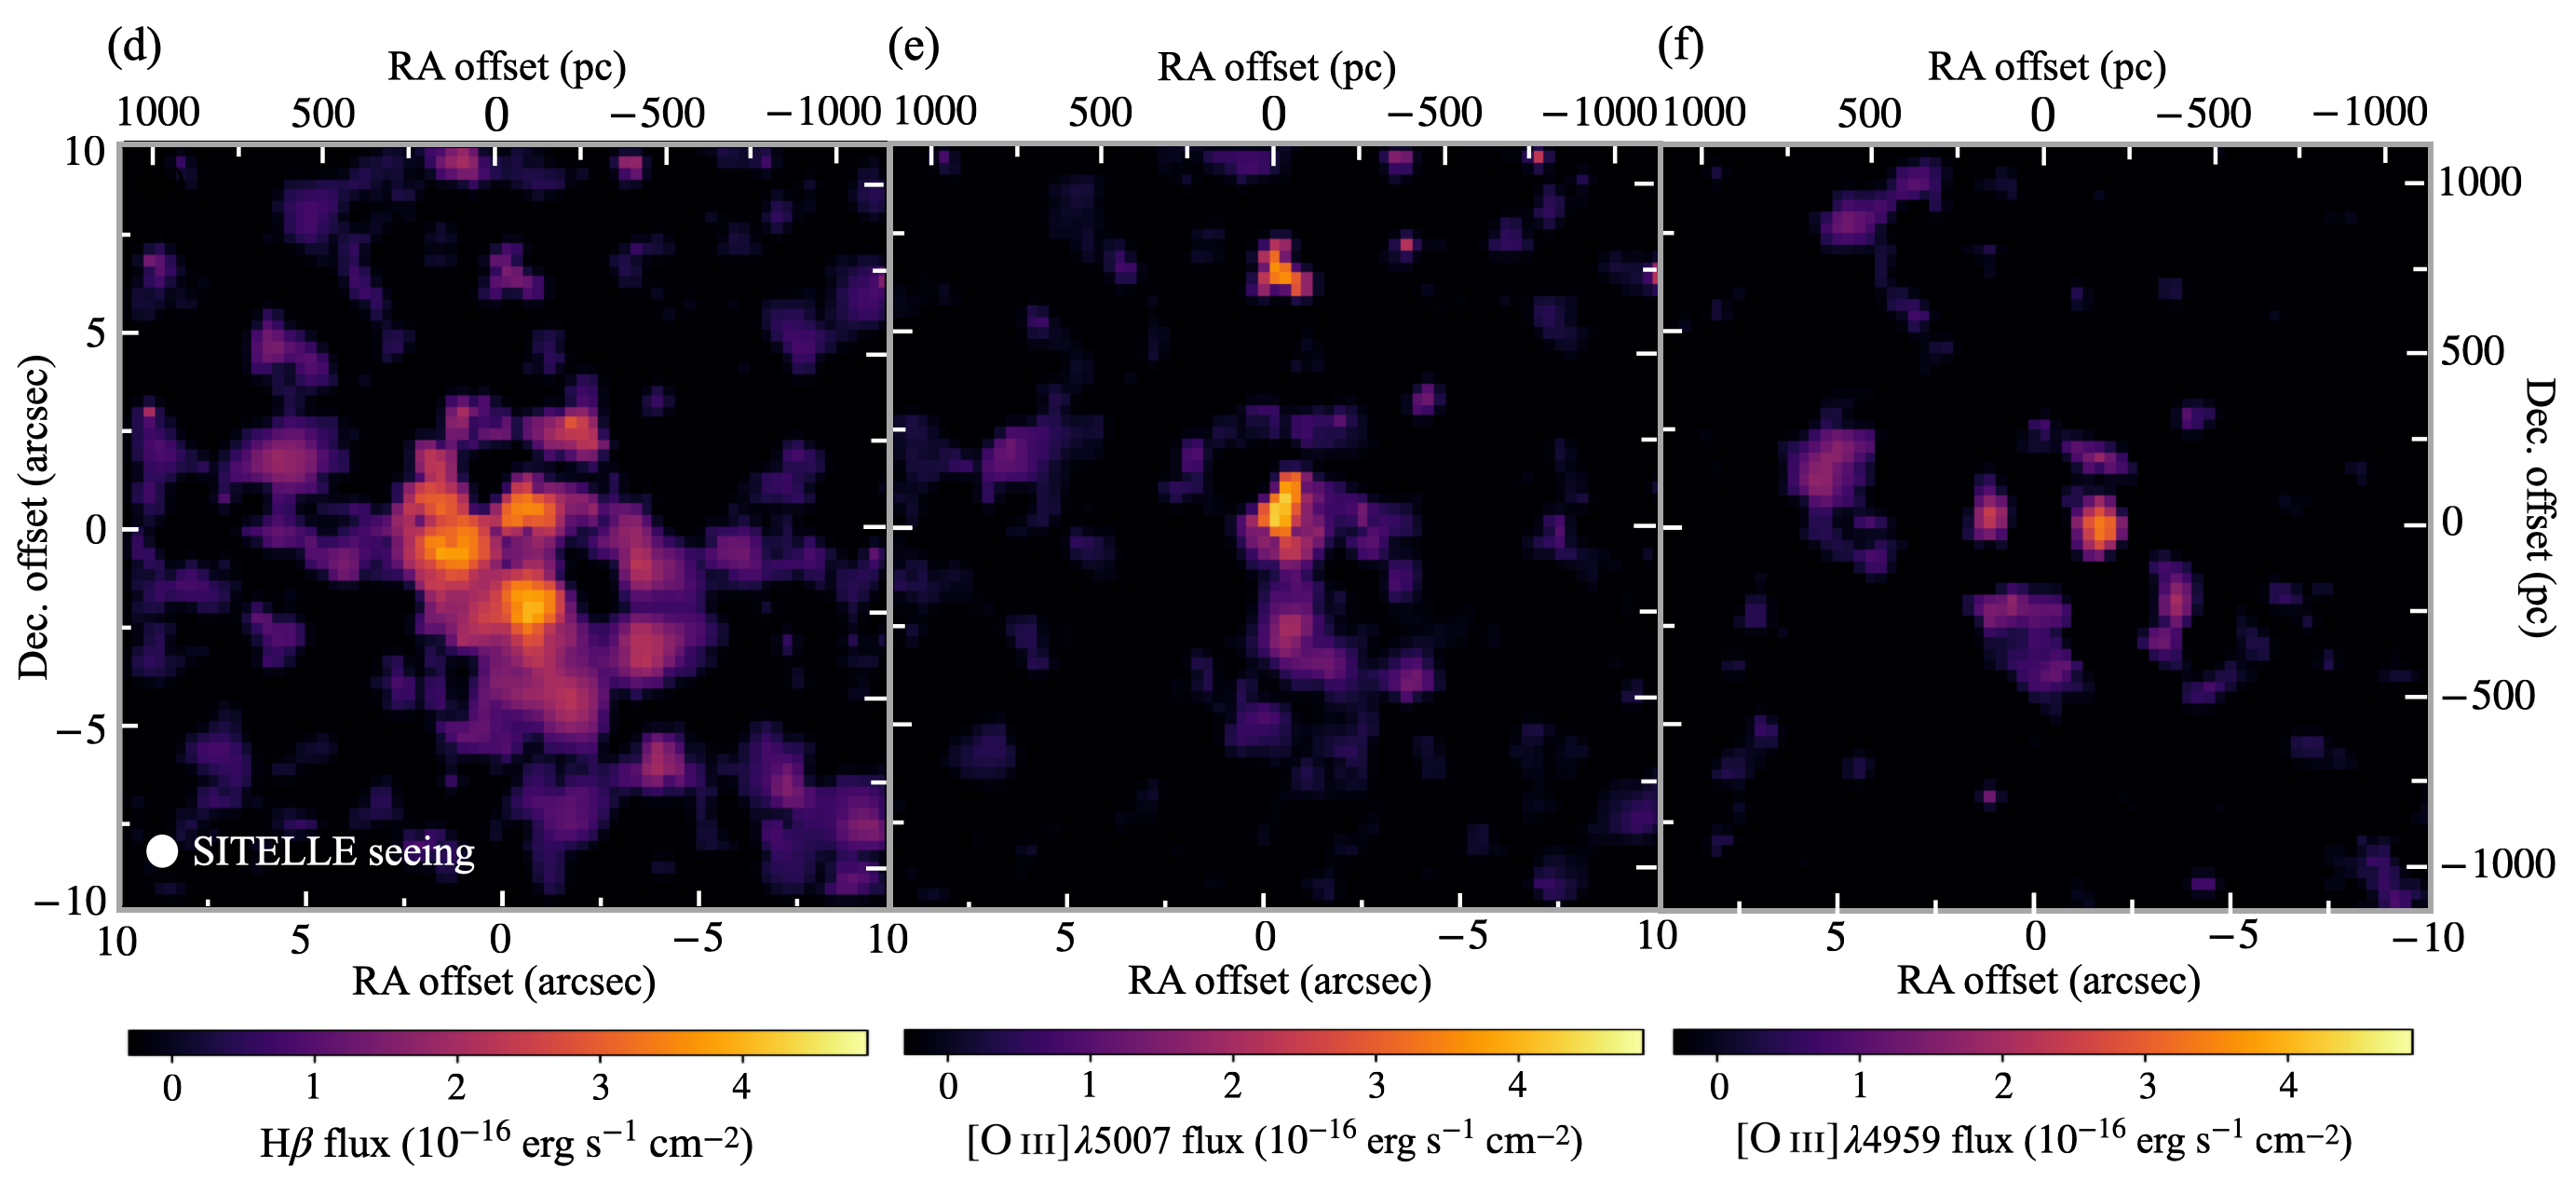
After subtracting the stellar continuum from the spectrum of each spaxel in each filter, the emission lines were fitted using the extraction software ORCS (Martin et al., 2015). For each emission line, ORCS outputs parameters (and their uncertainties) including the integrated flux, peak flux, intensity-weighted mean line-of-sight velocity and FWHM, and continuum level. From these, maps of flux, intensity-weighted mean line-of-sight velocity and intensity-weighted line-of-sight velocity dispersion are generated. A detection threshold is then applied to each spaxel based on the noise level of the summed H and [N ii] flux. The H surface brightness map is shown in Figure 2, while the N ii and S ii surface brightness maps are shown in Appendix A. The ionised gas of NGC 524 is diffuse, without the ring structures present in the molecular gas map.
Due to the low of the SN2 data cube, we cannot use the H fluxes of individual spaxels for extinction-correction purposes. Thus, we identify H emission peaks and associated regions (analogous to H ii regions, but mixed with the diffused gas), spatially bin the SN2 and SN3 spectra within these regions and fit for H and H (see Appendix A). Assuming a constant ratio of H () to H () flux within each region, a map of is generated, which is used to calculate the colour excess of H over H:
| (4) |
where we assume , as expected for case B recombination at a temperature of K (Osterbrock & Ferland, 2006). The H extinction is then calculated as
| (5) |
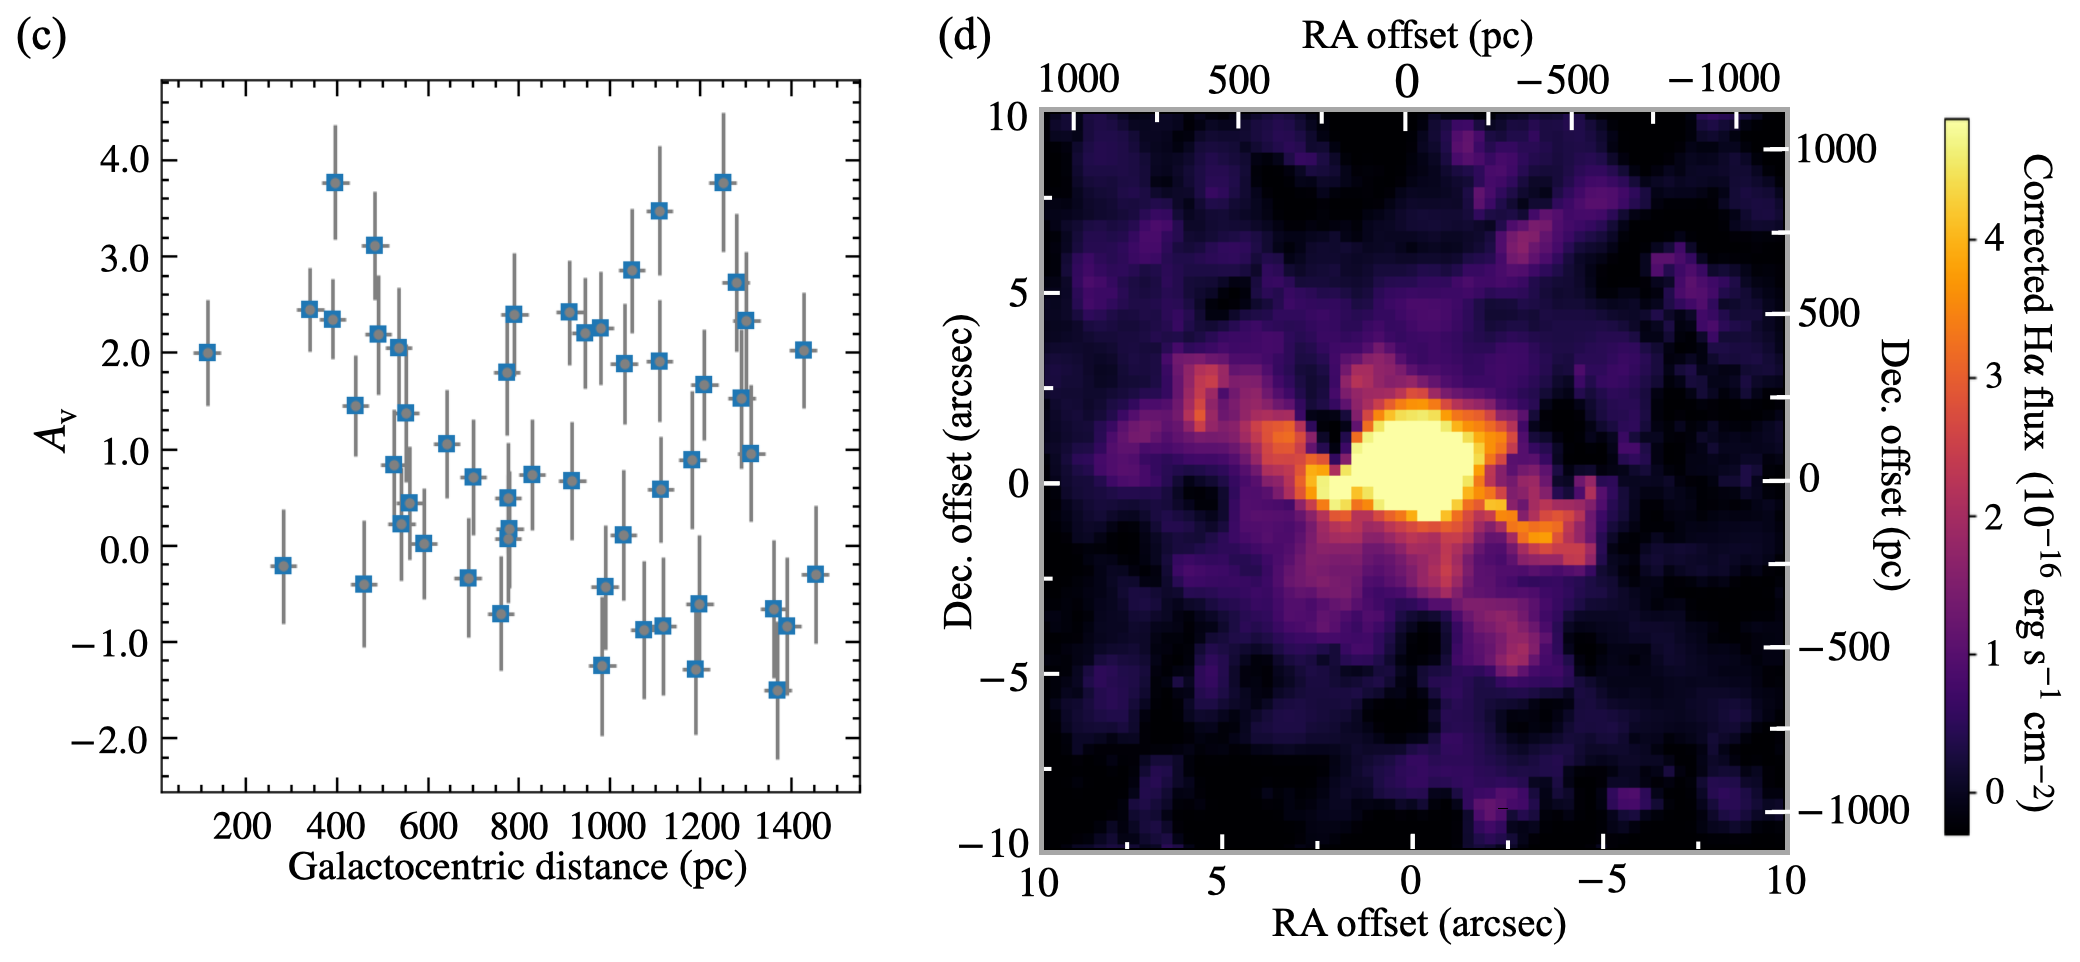
following Nelson et al. (2016), where is the reddening curve of Fitzpatrick (1986) and and are evaluated at the wavelengths of H and H, respectively. We show as a function of galactocentric distance in Appendix A. There are a few regions with negative , potentially due to different ionisation conditions in the diffused gas and uncertainties of the measurements. For these regions, we use the upper limit of that is positive. Finally, the extinction-corrected H flux () is calculated as
| (6) |
We show the extinction-corrected H surface brightness map of NGC 524 in Appendix A and as contours in the top panel of Figure 4.
This extinction-corrected H flux is converted to a SFR using the relation of Kennicutt Jr & Evans (2012):
| (7) |
where is the extinction-corrected H luminosity. We note that when probing spatial scales smaller than pc, this conversion relation can break down, as seen in examples of Kennicutt Jr & Evans (2012). Local SFRs depend on the environment and age of the stellar population, that we do not consider here. Nevertheless, this conversion holds true for the radial profile of SFE (see Section 3.2), which is calculated within apertures sufficiently large for confident H-to-SFR conversions.
The surface density of SFR () within one spaxel is then calculated as the SFR within that spaxel divided by the spaxel area. The SFR surface density within the ( kpc2) region tightly encompassing the molecular gas disc (see Figure 2) is , calculated as the sum of the SFRs divided by the area of the region (see Section 2.2). This is slightly larger than that reported by Davis et al. (2014) within an area of kpc2 ( ), measured from integrated Wide-field Infrared Survey Explorer m and Galaxy Evolution Explorer far-ultraviolet (FUV) flux densities.
We note that the SFRs calculated here are really upper limits, as large fractions of the H fluxes arise from diffuse emission that can not be characterised as arising from star-forming regions. This is confirmed by the ionised-gas emission-line ratios of [O iii]/H and [N ii]/H (see Appendix A), that are not typical of star-forming regions.
3 Results: smooth gas disc and suppressed SF
3.1 Molecular gas properties
NGC 524 is characterised by a high stellar mass surface density ( , Davis et al. 2022) and a low molecular gas mass surface density ( ) within a galactocentric distance of kpc. The molecular gas disc is also relatively smooth, as indicated by the smoothness index , that quantifies the smoothness of a two-dimensional distribution on a given spatial scale (Conselice, 2003), and the Gini coefficient , that quantifies the (in)equality of a distribution (Abraham et al., 1996). Davis et al. (2022) reports and for the 12CO(2-1) distribution of NGC 524. Both parameters are at the low end of the ETG sample distribution, indicating that NGC 524 has a smooth and uniform molecular gas distribution. Here we nevertheless attempt to identify GMCs in NGC 524 and analyse their properties.
3.1.1 GMC identification
We identify GMCs using our ALMA 12CO(2-1) data and adapted versions of the CPROPS algorithms (Rosolowsky & Leroy, 2006; Liu et al., 2021). CPROPS picks out ‘islands’ of emission in the position-position-velocity data cube, beginning from pixels brighter than times the root mean square (rms) noise and growing to neighbouring pixels brighter than rms. The structures identified are also required to be larger than an area of pixels (twice the synthesised beam area), so that they are physically meaningful, and they are used to create a moment-0 map and identify GMCs. These thresholds are selected to retain almost all diffuse gas while limiting the inclusion of noise. Within these islands, CPROPS identifies local maxima and their uniquely associated spaxels as candidate GMCs. Within this pool of GMC candidates, additional criteria are set to select physically-meaningful structures as GMCs. These include a minimum area ( spaxels or times the synthesised beam area), minimum velocity width ( km s-1 or one channel), minimum contrast above the brightest merging brightness level with an adjacent local maximum ( K or rms) and minimum convexity (, lower than typical for ETG and LTG GMCs). The convexity threshold is used to avoid GMCs having too many sub-structures, and is explained in detail in our previous works (Liu et al., 2021; Choi et al., 2023; Liang et al., 2024). We note that these criteria are less stringent than those normally used, but using any higher and/or minimum convexity does not allow for the detection of any GMC.
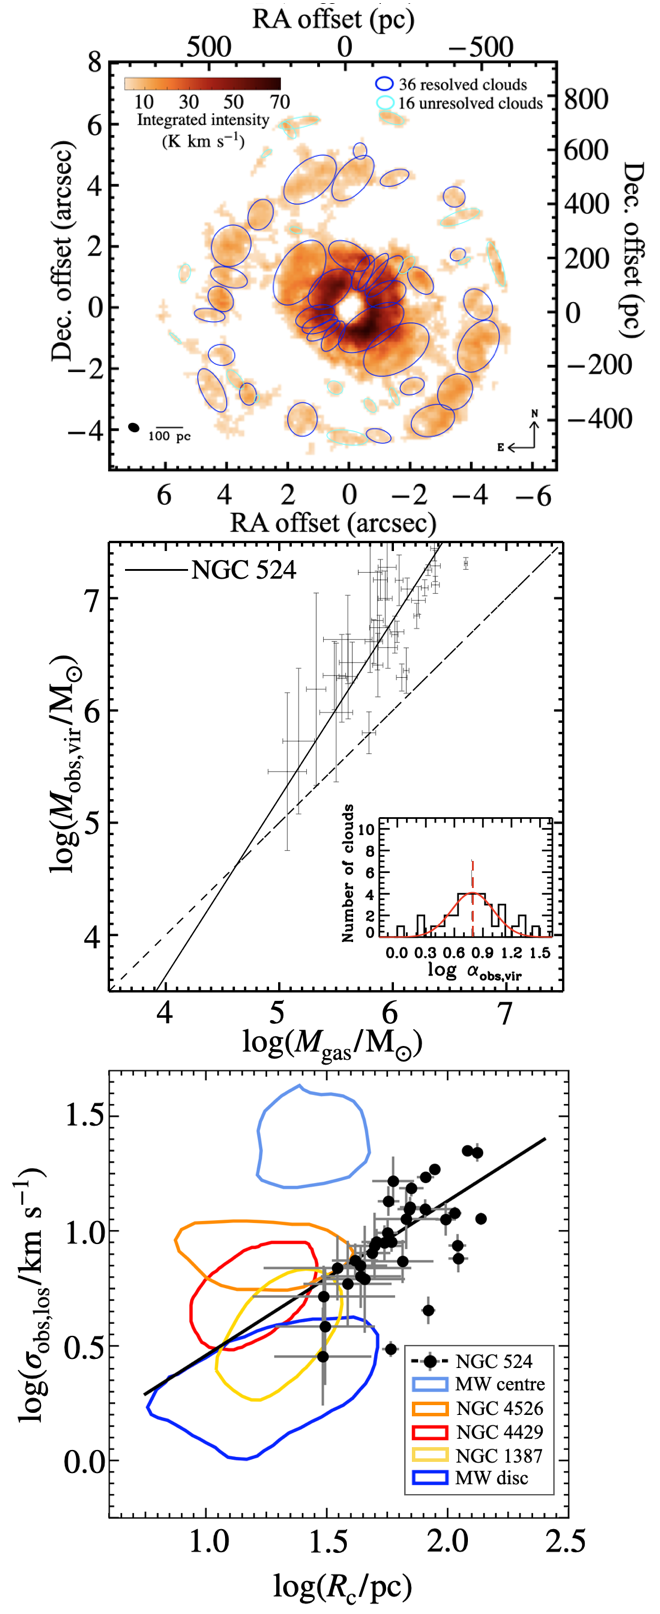
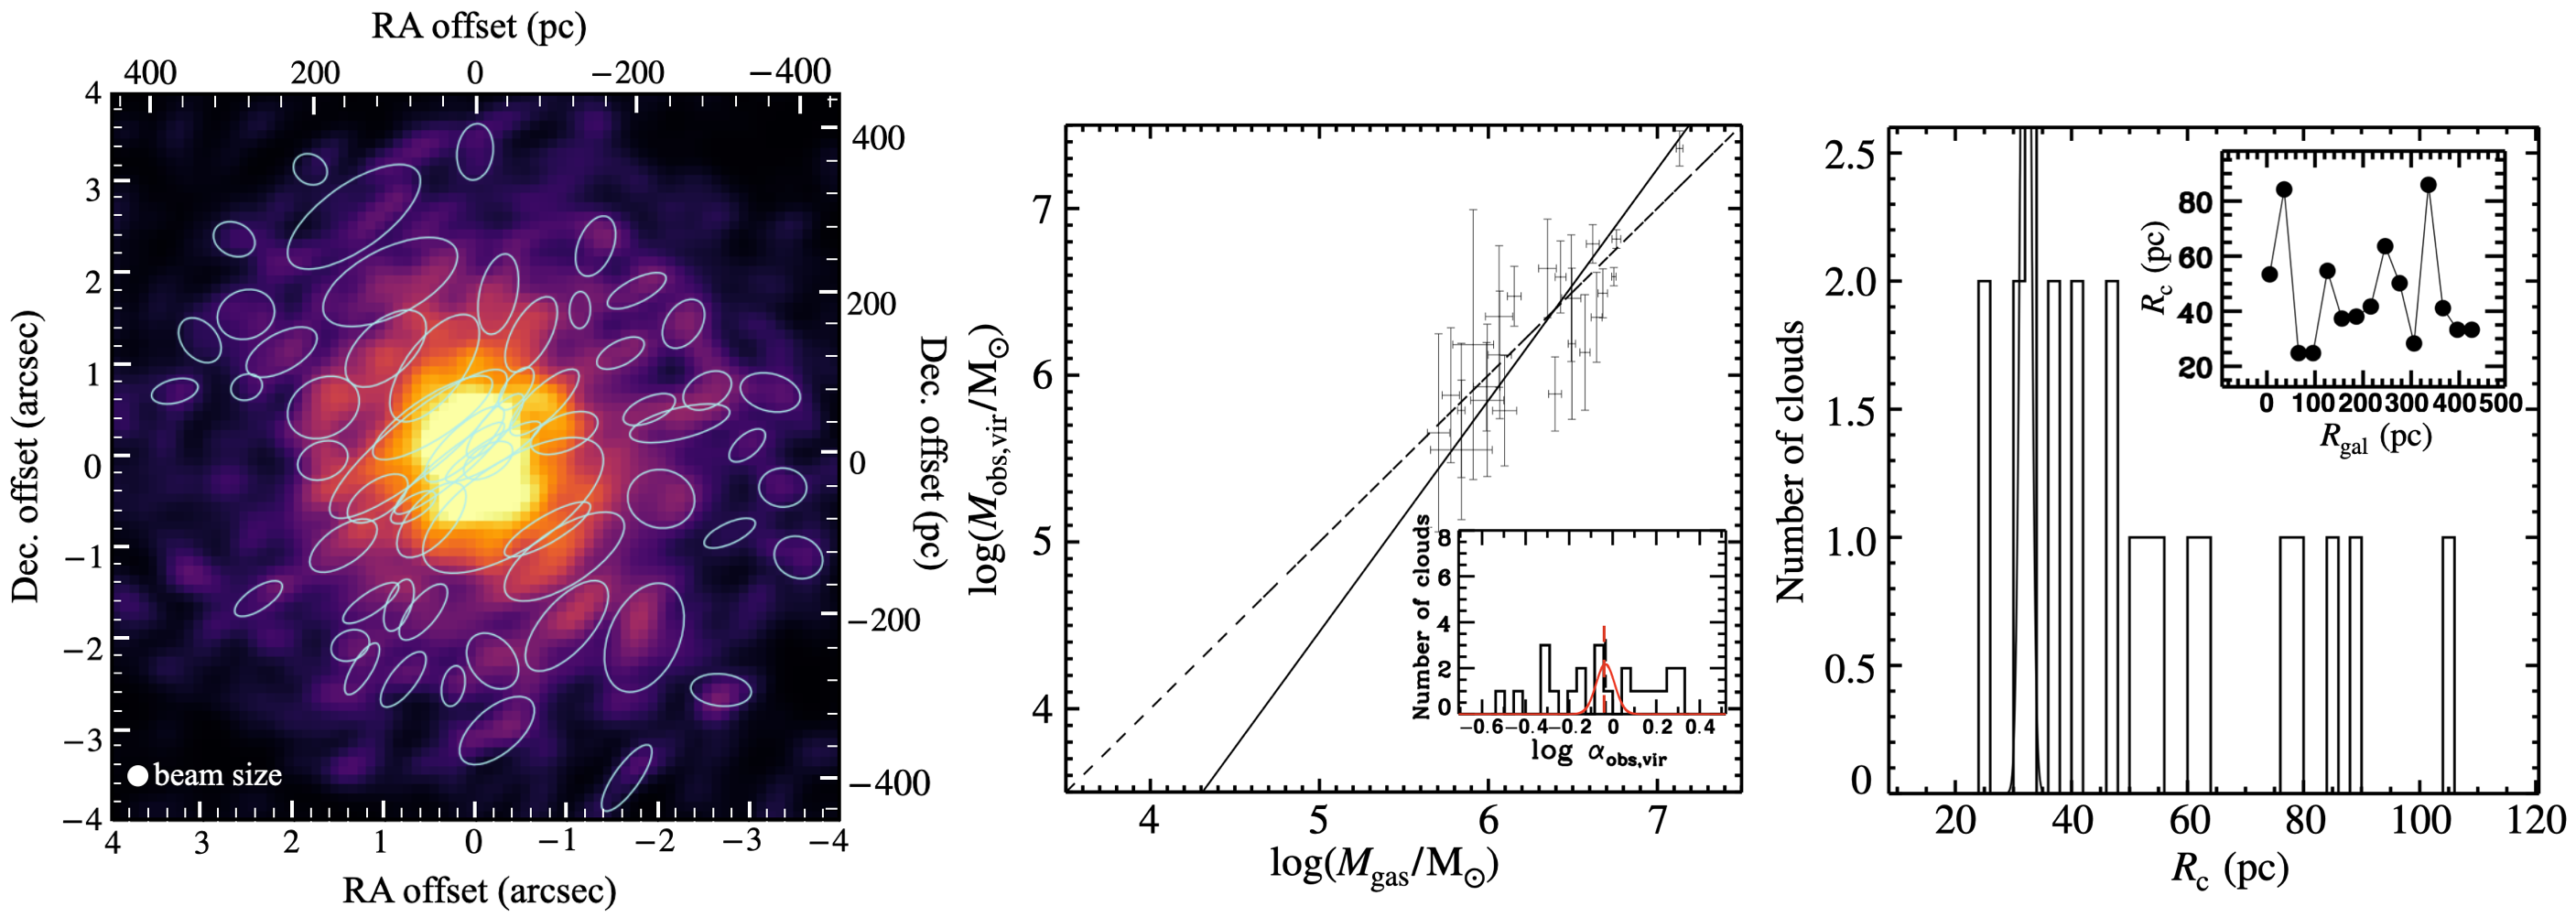
With this set of rather loose parameters, we identify resolved clouds and unresolved clouds, illustrated in Figure 3. For a cloud to be regarded as resolved, its deconvolved radius and velocity dispersion must be larger than the spatial and spectral instrumental resolution, respectively. Compared to other ETGs (e.g. NGC 4526, with a synthesised beam size of pc, Utomo et al. 2015b; NGC 4429, with a synthesised beam size of pc, Liu et al. 2021), that typically have hundreds of well-identified GMCs at this spatial scale ( pc), NGC 524 has a much smaller number of GMCs, without well-identified boundaries (low ) and shapes (low minimum convexity). This suggests that the GMCs identified are well mixed into a smooth and diffuse molecular gas disc, in line with the disc’ small smoothness index.
We note that the datacube used for GMC identification (with a synthesised beam and km s-1 channels) was also used by Smith et al. (2019) for a different purpose. They showed that these ALMA observations actually recover more flux than the IRAM -m telescope single-dish observations of Young et al. (2011a), presumably due to the larger primary beam. Considering the inclusion of the short ACA baselines that cover the entire CO disc (smaller than the maximum recoverable scale) and the well-sampled plane, it is therefore likely that (almost) all the flux has been recovered.
Another caveat is that our GMC identification is constrained by the spatial resolution of our ALMA observations. NGC 524 was observed with a synthesised beam size of pc, larger than those of some recent ETG studies (e.g. Utomo et al., 2015b; Liu et al., 2021). It is therefore likely that higher-resolution observations would lead to more robust GMC detections. Nevertheless, the synthesised beam size of our ALMA observations is comparable to that of some GMC surveys of nearby galaxies that successfully identified hundreds of GMCs with radii of – pc in each galaxy (e.g. Rosolowsky et al., 2021). Thus, the paucity of robustly-identified GMCs at this spatial resolution indicates that the small-scale molecular gas morphology of NGC 524 deviates from the norm of nearby galaxies. In Sections 4 and 5.1, we will attempt to estimate the sizes of NGC 524’s GMCs.
3.1.2 GMC properties
We measure cloud properties including radius (), molecular gas mass () and mass surface density () and velocity dispersion () following Liu et al. (2021) and references therein (particularly Rosolowsky & Leroy 2006). Due to the small size of the GMC sample of NGC 524, the GMC properties do not follow well-defined Gaussian distributions. The GMC radii range from to pc with a mean of pc. We note that the GMC radii are constrained by the limited spatial resolution of our observations ( pc). In Section 4, we quantify this effect by performing a comparison to GMCs identified in a simulated galaxy with a spatial resolution of pc within the molecular gas reservoir. The means of the other properties are M⊙, and km s-1. Compared to other ETGs with GMC catalogues, the clouds of NGC 524 are larger, have higher velocity dispersions and have lower molecular gas mass surface densities.
Using these cloud properties, we can derive the virial parameters of the GMCs. The virial parameter of a cloud is generically defined as the ratio of its virial mass to its luminous mass, where the virial mass is defined as the dynamical mass at equilibrium. In practice, we measure here the ratio of a cloud’s virial mass to its molecular gas mass (), where the virial mass is calculated from the measured cloud properties:
| (8) |
(MacLaren et al., 1988), where is the gravitational constant. In the middle panel of Figure 3, we show as a function of , with the distribution of shown in an inset. The identified GMCs have a very high mean virial parameter . This is consistent with the beam-by-beam analysis of Williams et al. (2023), who reported a virial parameter of at a pc spatial scale, at pc scale and at pc scale. A virial parameter significantly higher than suggests that either the structures are not gravitationally bound and are thus transient, or there are large non-gravitational forces (e.g. magnetic fields and/or external pressure) keeping the structures together. It has also been shown by Williams et al. (2023) that the virial parameters do not vary significantly as a function of beam size, but are usually slightly smaller with smaller beam sizes. Thus, it is likely that the virial parameters of the NGC 524 GMCs will remain higher than even if the spatial resolution of our observations is improved. In Section 4, we further confirm this with a simulated galaxy.
Following the Larson relations (Larson, 1981), the bottom panel of Figure 3 shows the size – linewidth relation of the NGC 524 GMCs, which allows to probe GMC turbulence. The black line is the best-fitting power-law relation between and , with a power-law index of and a Spearman rank correlation coefficient of . The size – linewidth relations of the MW (disc and centre) GMCs and ETG GMCs (NGC 4429, Liu et al. 2021; NGC 4526, Utomo et al. 2015b; NGC 1387, Liang et al. 2024) are shown with coloured contours encompassing of the distributions of the data points. Although constrained by the limited spatial resolution of our 12CO(2-1) observations, the NGC 524 GMCs are larger than all other GMCs. At fixed similar cloud size, the linewidths of the NGC 524 GMCs are larger than those of the MW disc and NGC 1387 GMCs but smaller than those of the MW centre and NGC 4526 GMCs (similar to those of the NGC 4429 GMCs), although the overlap in size is limited. The power-law index of the size –linewidth relation of NGC 524 is similar to that found in the MW ( – ; Solomon et al. 1987; Kauffmann et al. 2017) and nearby glaxies ( – ; Rosolowsky et al. 2003; Rosolowsky 2007; Bolatto et al. 2008; Wong et al. 2011). It is neither particularly shallow nor steep compared to the size – linewidth relations measured in the centres of other ETGs (e.g. no correlation in NGC 4526, Utomo et al. 2015b; in NGC 4429, Liu et al. 2021; in NGC 1387, Liang et al. 2024).
3.2 Star formation efficiency
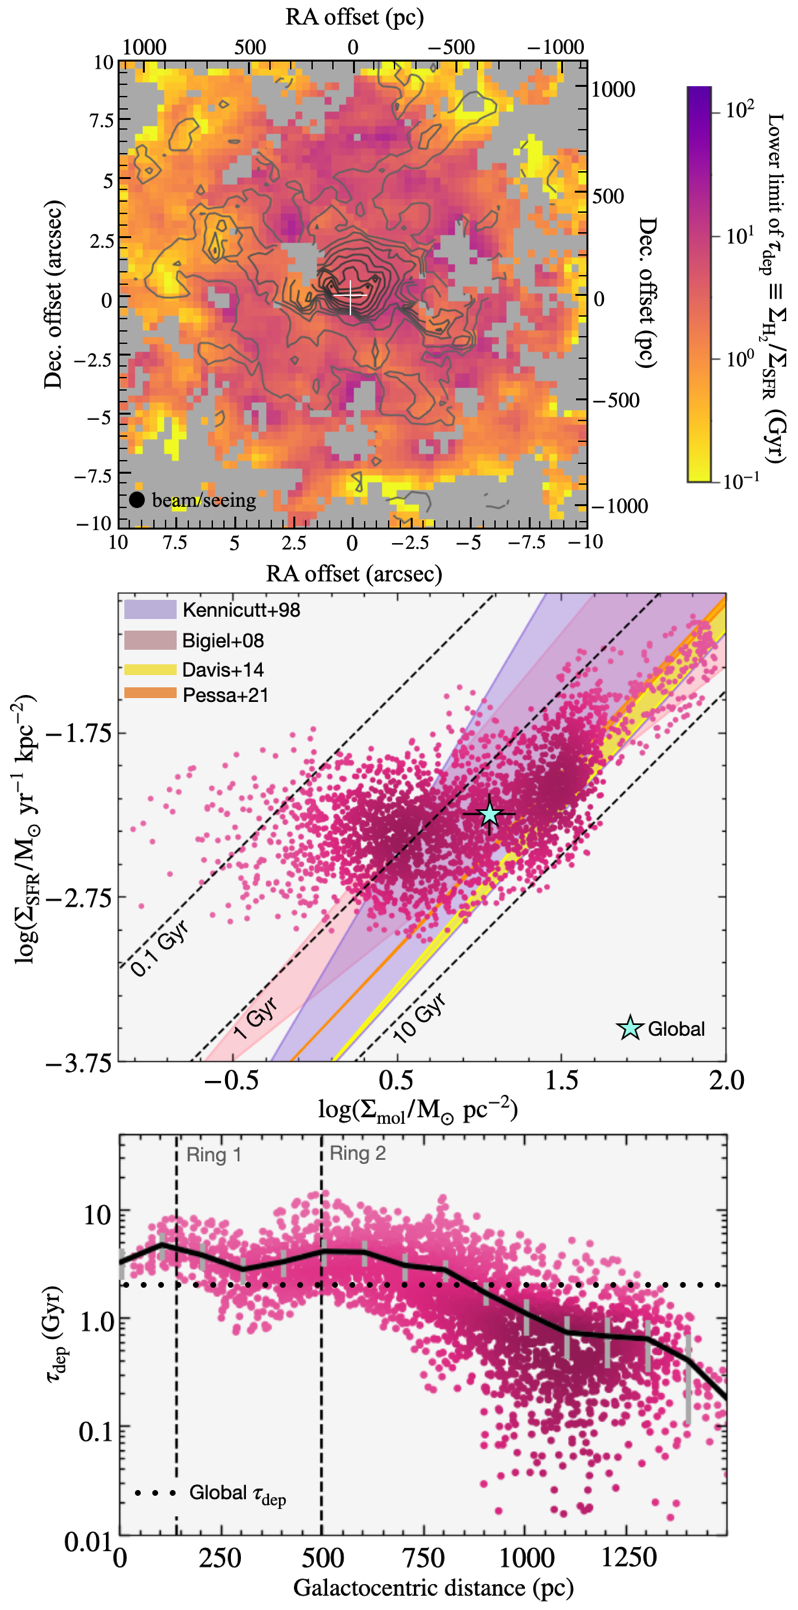
Taking the ratio of the molecular gas mass of a region and its SFR yields a measurement of the region’s depletion time (), that is the time it would take for the region’s gas reservoir to be depleted by star formation should star formation continue at its current rate uninterrupted. The depletion time is the inverse of the SFE. Combining the molecular gas mass surface density map generated in Section 2.2 with the SFR surface density map generated in Section 2.3, we obtain a spatially-resolved map of depletion time, shown in the top panel of Figure 4. We include all spaxels for which both the molecular gas and the ionised gas emission have . At the spatial resolution of the SITELLE data ( pc), both the molecular gas and the ionised gas extend to and cover almost entirely the central kpc in galactocentric distance. We overlay on the map the extinction-corrected H surface brightness map, to illustrate that regions with smaller (yellow to light orange colors) are often co-spatial with H emission peaks, especially in the outskirts of the galaxy.
We show the spatially-resolved relation between and in the middle panel of Figure 4 (shaded by the density of data points), and compare the data to the original – power-law relations of Kennicutt Jr (1998; purple region), Bigiel et al. (2008; pink region), Davis et al. (2014; yellow region) for ETGs and Pessa et al. (2021; orange region) for nearby star-forming galaxies. The global , calculated as the ratio of the total molecular gas mass over the total SFR within the ( kpc2) region tightly encompassing the molecular gas disc (see Figure 2 and Sections 2.2 and 2.3), is shown as a cyan star. This global is marginally longer than that expected from Kennicutt Jr (1998) and Bigiel et al. (2008) but shorter than that expected from Davis et al. (2014) and Pessa et al. (2021). The distribution of the NGC 524 data points covers a wide region in the parameter space of SFR and molecular gas mass surface densities. At the high end of , the distribution of depletion time spans to Gyr. At the low end of , a tail of depletion times spans (and even less) to Gyr, and remains approximately constant independently of .
The galactocentric distance profile of the depletion time is shown in the bottom panel of Figure 4 (shaded by the density of data points) and reveals a gradually increasing with decreasing galactocentric distance. The global depletion time of Gyr is marked in the figure as a black dotted horizontal line. Although the global is similar to that of nearby star-forming galaxies, is higher than the mean by a factor of – within a galactocentric distance of pc, and it approaches its maximum Gyr near the centre of the galaxy. The two molecular gas rings of NGC 524 (see Section 2.2) are also marked in the panel, and has local maxima at the locations of these rings (due to the overdensity of molecular gas but the roughly constant ionised-gas surface brightness).
We note again however the major bias of our analyses, that all H emission is included as a SF tracer. We attempted to separate the different potential ionisation mechanisms using standard emission-line ratio diagnostics (e.g. Baldwin et al., 1981), but the diagnostics indicate that all the ionised gas (i.e. all spaxels/data points) is ionised by old stellar populations, and no emission is characteristic of star-forming regions (see Appendix A). Therefore, the SFRs calculated here are really upper limits. Conversely, the depletion times are really lower limits. Of course, this strongly suggests that H emission arising from SF is very limited, which strengthens our argument that SF is suppressed in NGC 524.
Another parameter that may affect the measurements of is . In this work, we adopted the MW , that has also been applied to other nearby galaxies (e.g. Sun et al., 2018; Liu et al., 2021). Recent spatially-resolved investigations of nearby galaxies have however uncovered that can be smaller in galaxy centres than in galaxy discs (Sandstrom et al., 2013; Teng et al., 2022). Such a radial dependence of could therefore (partially) explain the trend of increasing with decreasing galactocentric radius. However, due to a lack of measurements in ETGs, whether lower are the result of the bulge-disc transition or whether they are similar in ETGs with pure spherical potentials is currently unknown.
4 Comparison with a simulated ETG
As our ability to study GMC properties is constrained by the spatial resolution of our ALMA 12CO(2-1) observations, we compare our results to those obtained from analogous mock observations of the CO emission from a simulated ETG. The initial conditions and properties of the simulation are described in detail in Jeffreson et al. (in prep.), but we provide a brief description here.
The simulated galaxy is part of a suite of isolated galaxy simulations of ETGs, with initial conditions based on ATLAS3D (Cappellari et al., 2011) and MASSIVE (Ma et al., 2014) measurements of ETG properties. We consider here only the simulated galaxy of total stellar mass M⊙, which most closely resembles NGC 524. The initial conditions were generated with MakeNewDisk (Springel et al., 2005) and consist of a Hernquist (1990) dark matter halo (total halo mass of M⊙) and an initial stellar component split into an exponential disc (of mass M⊙) and a Hernquist (1990) bulge (of mass M⊙ and stellar half-mass radius kpc). The initial cold gas fraction is and only a negligible amount of gas is converted into stars across the Myr runtime. Gas particles have a mass resolution of M⊙ and employ an adaptive gravitational softening with a minimum softening length of pc. Star (dark matter) particles have a mass resolution of M⊙ ( M⊙) and a fixed gravitational softening of pc ( pc).
The simulations were run with the moving mesh code Arepo, including the non-equilibrium network for hydrogen, carbon and oxygen chemistry described in Nelson & Langer (1997) and Glover & Mac Low (2007), coupled to the atomic and molecular cooling function of Glover et al. (2010), which self-consistently allows the formation of a multi-phase ISM that includes a cold molecular phase. Stars can form in cold and dense gas with a SFE that depends on the turbulent state of the gas via the virial parameter (Padoan et al., 2016), using the implementation of Gensior et al. (2020). Stellar feedback is included via energy and momentum injections from supernovae as well as pre-supernova feedback from H ii regions, following the prescription of Jeffreson et al. (2021).
Once it has reached a state of dynamical equilibrium, the simulated galaxy has properties (stellar mass , molecular hydrogen mass and SFR ) that are comparable to those of NGC 524 (, and ). The SFR of the simulated galaxy is formally much lower than that of NGC 524, but it is measured very differently. Specifically, the SFR of the simulated galaxy is obtained by summing up the initial masses of all star particles formed within the past Myr and then dividing by the Myr timescale. While the Myr timescale is chosen in analogy to the timescales/lifetime of stars traced by H, it is only an approximation of the flux-based SFR measurement for NGC 524.
Based on the molecular gas mass distribution and kinematics of the simulated galaxy, we create mock data cubes that incorporate observational effects such as beam smearing and velocity binning, using the Kinematic Molecular Simulation (KinMS) tool of Davis et al. (2013). The input parameters of KinMS include the positions, circular velocity curve and CO luminosity (generated using DESPOTIC) of the simulation particles, as well as the distance, inclination and other observational properties of NGC 524. DESPOTIC is a software library that calculates the energy and spectra of optically-thick interstellar clouds (Krumholz, 2014).
To better understand the GMC sizes and properties under this kind of gravitational potential and gas fraction, we generated two data cubes from the simulated galaxy: one matching the spatial resolution of our observations ( pc), the other at the highest resolution possible ( pc). We also matched the of these simulated data cubes to those of our observational data of NGC 524. To achieve this, we created random noise following a Gaussian distribution at each position-position-velocity pixel, and scaled this noise so that the (i.e. the ratio of the mean CO surface brightness of the galaxy disc to the standard deviation of the noise pixels) is the same as that of the NGC 524 data cube.
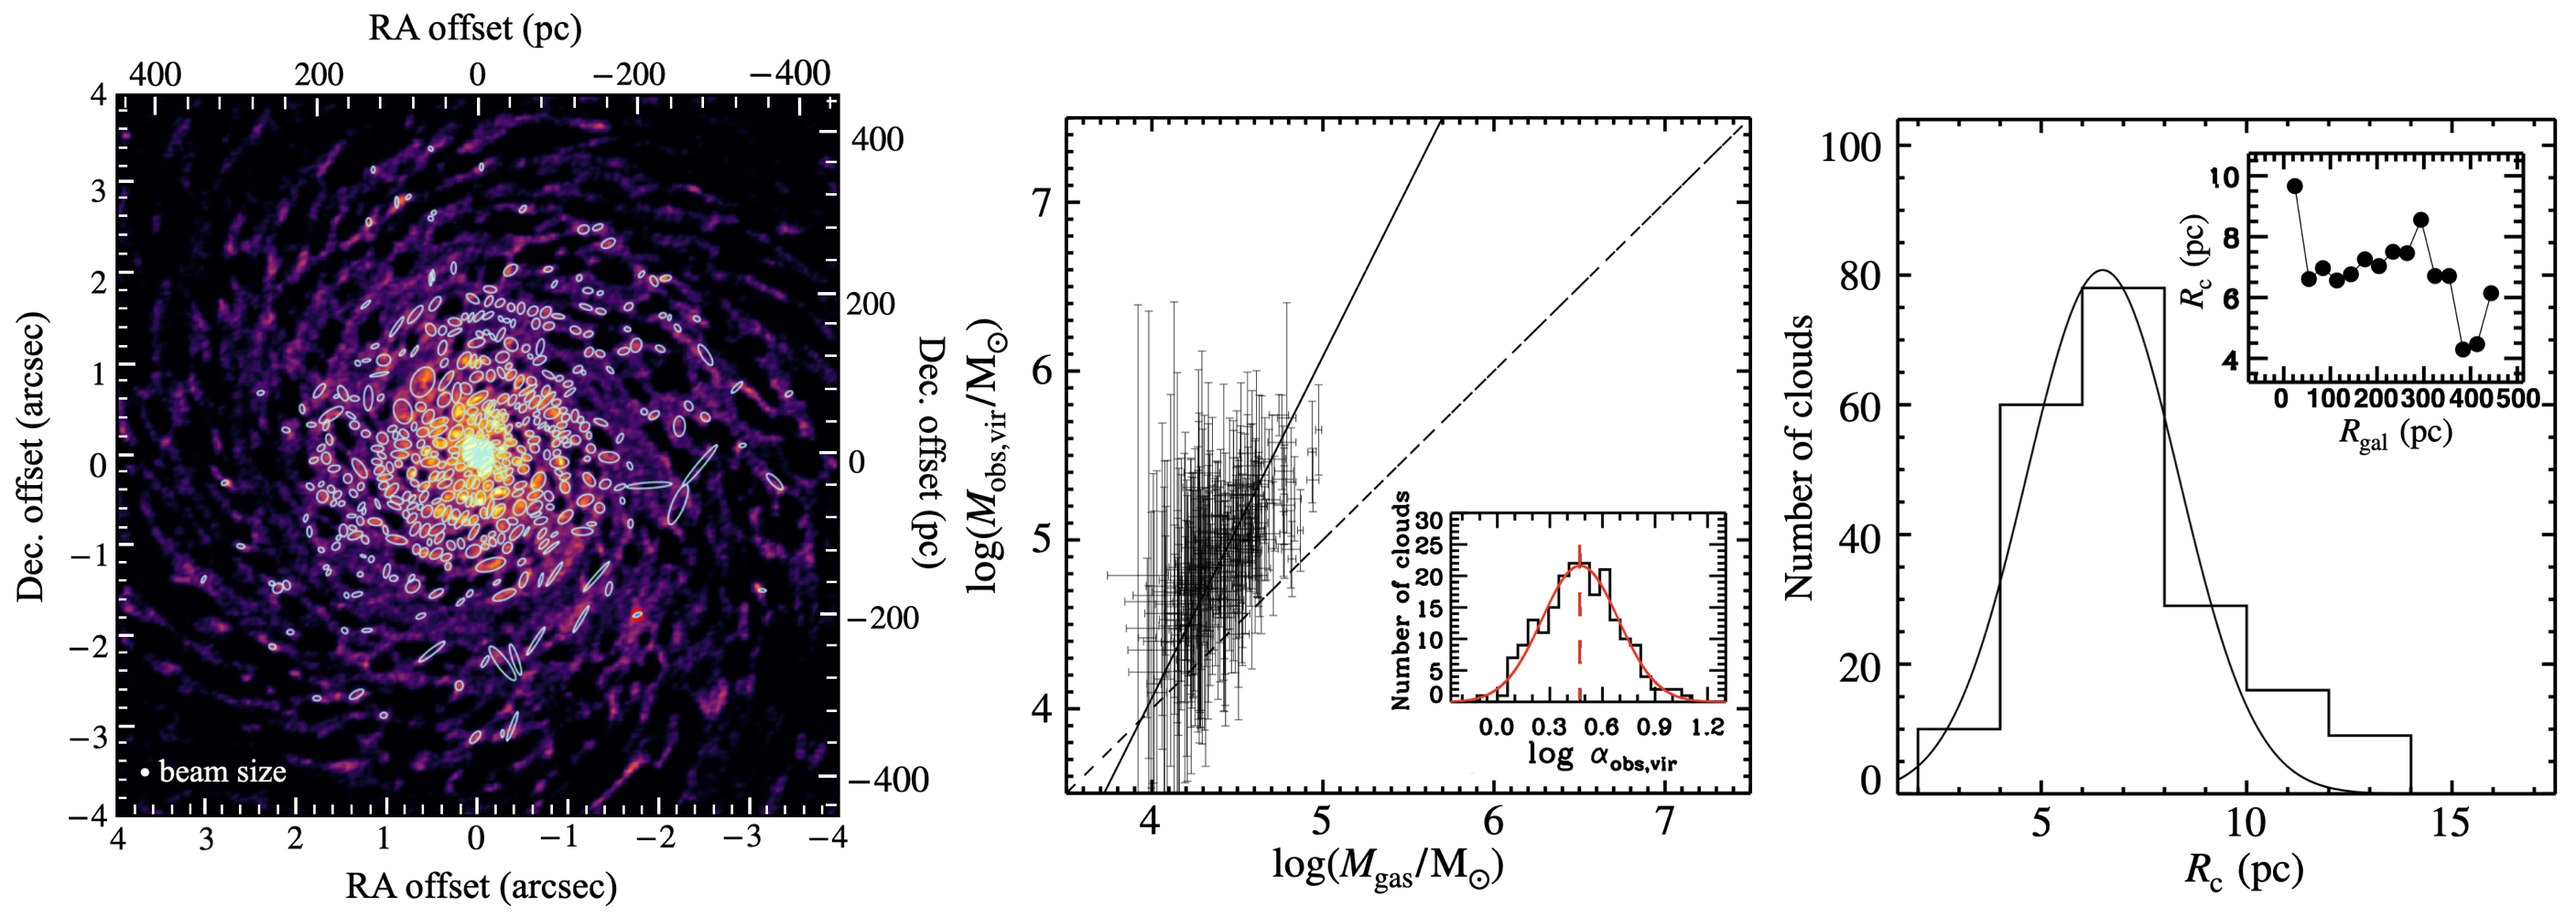
We then used CPROPS (Rosolowsky & Leroy, 2006; Liu et al., 2021) to identify and measure the properties of the GMCs in both data cubes. To ensure a fair comparison to the observations, we used the same GMC selection criteria as stated in Section 3.1.1: minimum area limit of spaxels, minimum channel width of km s-1, K and minimum convexity of . The GMCs identified are overlaid on the moment-0 map of the associated data cube in Figure 5. The differences between the two data cubes (and identified GMCs) are significant. At low spatial resolution, matching our observations, the simulated molecular gas disc appears similarly smooth, with just a few large GMCs identified. At high resolution, tightly wound spiral features are revealed, that enable the detection of hundreds more GMCs. With the high resolution data, we are able to constrain the average GMC size to be pc. The average virial parameter is , higher than typical for nearby spirals () but lower than that of NGC 524 (), indicating that like the observed structures, none of the resolved, simulated GMCs are gravitationally bound. Although the stellar, molecular gas and SF properties of this simulated galaxy are all similar to those of NGC 524, this simulation does not contain the molecular gas rings detected.
Comparing these two data cubes from the same simulated galaxy to our observational data cube of NGC 524, we conclude that it is highly likely that the identification (and thus properties) of the GMCs of NGC 524 is limited by the spatial resolution of the observations. For both NGC 524 and the simulated galaxy at low resolution, the molecular gas disc appears smooth, enabling the detection of only a few large GMCs of sizes pc, similar to the spatial resolution. However, for the simulated galaxy at high resolution, hundreds of GMCs are detected, with sizes pc. Interestingly, this is much smaller than the GMCs detected in a simulated Milky Way-like galaxy ( pc; see Jeffreson et al. 2020), as well as the typical GMC sizes of nearby galaxies ( – pc), although for nearby galaxies the GMC sizes are always constrained by the spatial resolutions of the observations.
5 Discussion
With our ALMA and SITELLE observations, we have established that NGC 524 has a smooth molecular gas disc and diffuse ionised gas. We are only able to identify a few dozens GMCs, that all have very high virial parameters, suggesting that these GMCs are unbound and unlikely to form stars. By comparing with a similar simulated ETG, we showed that the real GMCs could in fact be much smaller than observed. The SFE upper limits are low (high lower limits) compared to those of nearby star-forming galaxies, particularly in the central kpc galactocentric distance region. These low SFEs are confirmed by m + FUV SFRs, as discussed in Section 3.2. Here, we discuss what is shaping the molecular gas properties and SFE of NGC 524.
5.1 Strong shear
A unique feature of NGC 524 is the very high rotation velocity of the molecular gas ( km s-1). The associated high stellar mass surface density creates a deep and steep gravitational potential well, and in turn strong shear affecting the molecular gas. Here we adopt the circular velocity curve derived by Smith et al. (2019) through modelling of the stellar mass distribution and molecular gas kinematics. The circular velocity increases rapidly from the center of the galaxy to reach km s-1 at a galactocentric distance of only pc, and then gradually rises to km s-1 at a galactocentric distance of kpc.
5.1.1 Cloud mass surface density
One way to assess the strength of shear is to evaluate the equilibrium between a cloud’s self-gravitational energy and its kinetic energy associated with shear motions. For a cloud to be gravitationally bound, the contribution of external gravity to the cloud’s energy budget must not exceed the cloud’s self-gravitational energy. Assuming that the cloud’s external energy is from shear motions due to the circular rotation of the galactic disc, this requirement can be expressed as (see Equations 32 and 48 of Liu et al. 2021, where is Oort’s constant evaluated at the cloud centre , is the galactocentric distance and is the angular frequency of circular motion, where is the circular velocity curve). This implies that for a given cloud radius , there is a minimum surface density required for the cloud to remain marginally bound (see also Equation 55 of Liu et al. 2021):
| (9) |
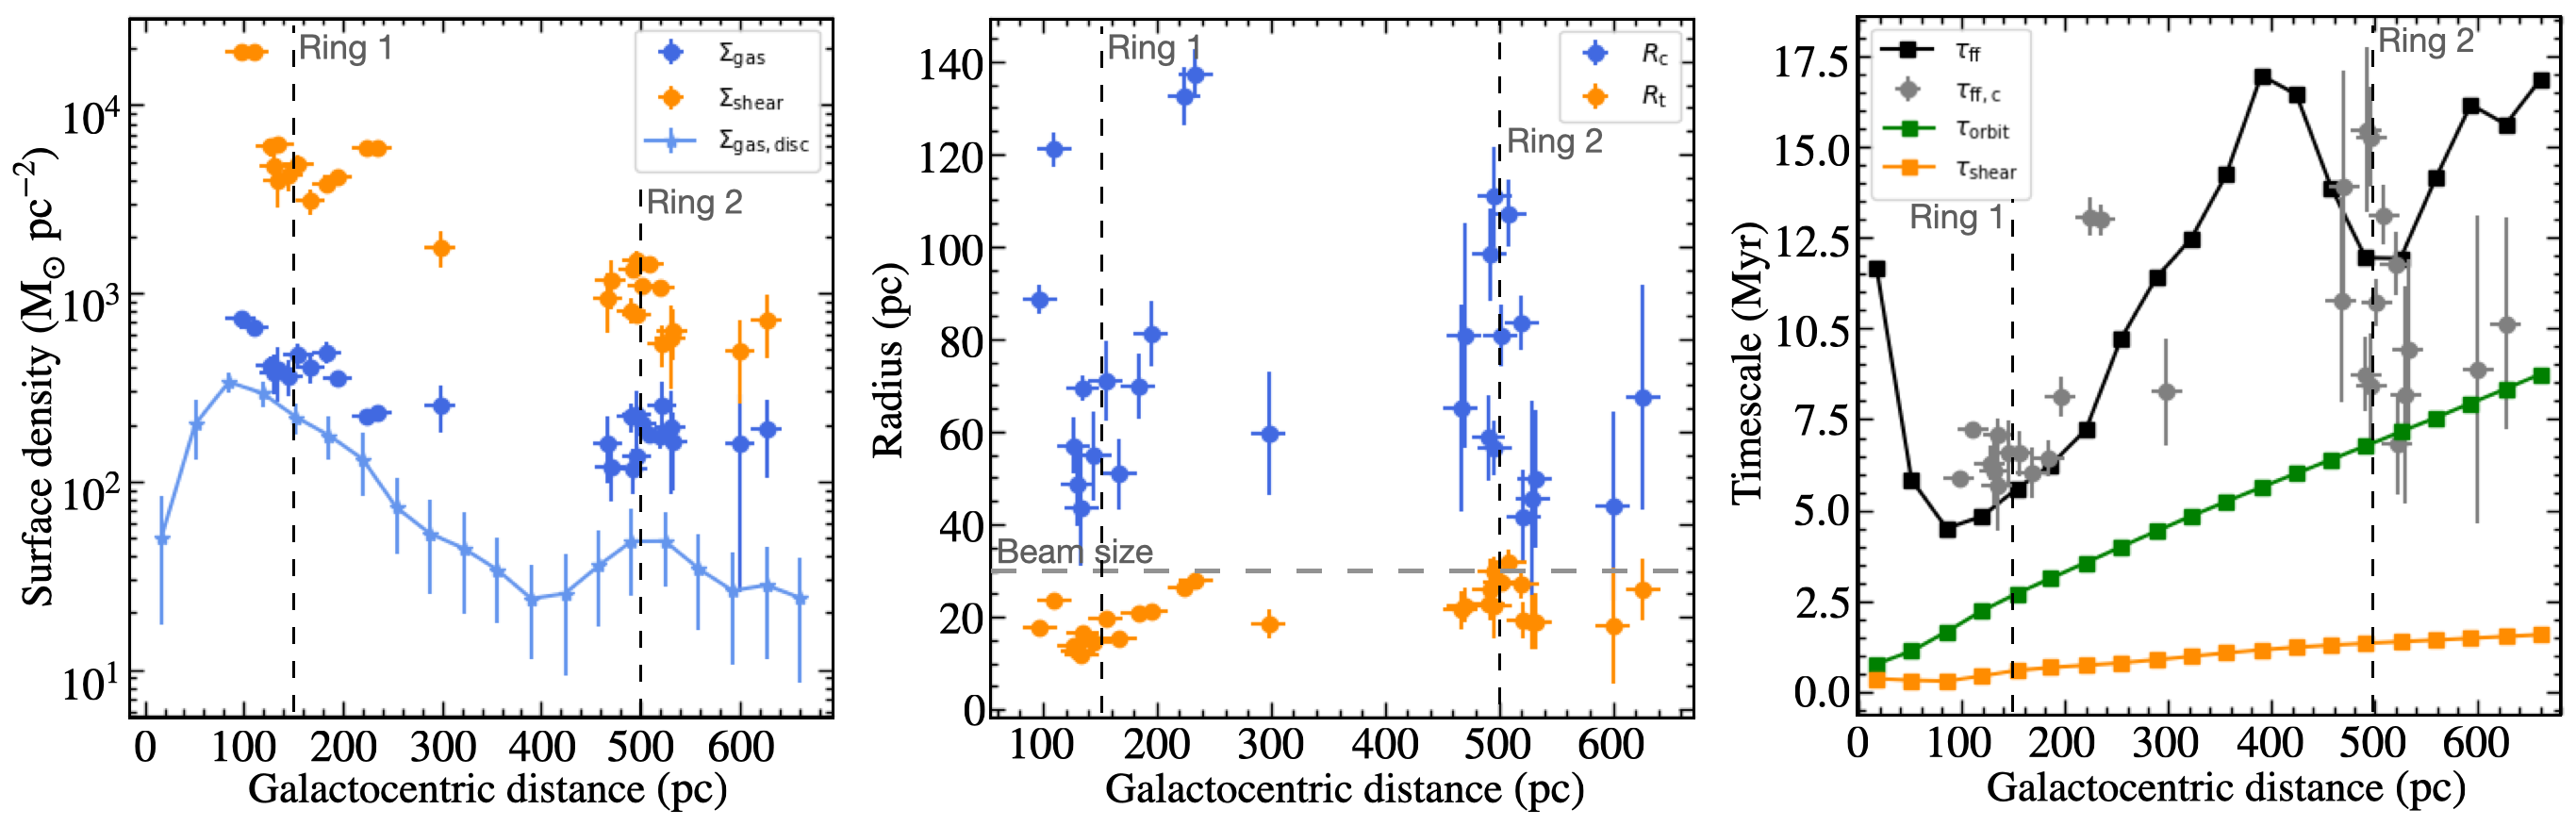
A comparison of , and the azimuthally-averaged molecular gas mass surface density of the disc () of NGC 524 is shown in the left panel of Figure 6. As by construction the GMCs identified are over-densities of the molecular gas disc, it is expected that is larger than . However, across the galaxy disc is also systematically larger than , and the difference gradually increases toward the galaxy centre, where is almost one order of magnitude higher than . This indicates that the energy associated with shear motions significantly exceeds the self-gravitational energy of the identified GMCs, strongly suggesting that the NGC 524 GMCs are not gravitationally bound.
5.1.2 Cloud radius
Similarly, we use Equation 52 of Liu et al. (2021) to estimate the tidal radius of each GMC:
| (10) |
where is the mass of the cloud, taken here to be . This tidal radius is defined as the distance from the GMC centre where the shear velocity due to differential galactic circular rotation is equal to the escape velocity of the cloud (Gammie et al., 1991; Tan, 2000). We compare to our measured for the identified GMCs of NGC 524 in the middle panel of Figure 6. The cloud radii are systematically much larger than the tidal radii, suggesting again that the identified clouds are gravitationally unbound.
This analysis also suggests that gravitationally-bound clouds in NGC 524 cannot have radii larger than pc, which is about the synthesised beam size of our ALMA observations. This may be the reason we cannot confidently identify GMCs in NGC 524 (see Section 3.1.1). Compared to the clouds of other ETGs (Utomo et al., 2015b; Liu et al., 2021; Liang et al., 2024), the mean tidal radius of the identified NGC 524 clouds is the smallest, and the difference between and is the largest. In such a system with a smooth molecular gas disc and strong shear, the clouds formed will likely be very small, with a radius of only a few parsecs. The spatial resolution of our observation would have to be much higher to be able to distinguish such clouds. Using the simulated galaxy discussed in Section 4 at very high resolution, we do detect GMCs with a mean radius of pc, in line with our expectations. Therefore, based on our calculations and the comparison with a simulated galaxy, we estimate that a spatial resolution better than pc, preferably better than pc, is necessary to determine if there are any gravitationally-bound GMCs.
5.1.3 Timescales
We compare each cloud’s shear and orbital timescales ( and ) with its free-fall timescale () to establish which is more important: shear or self gravity. The mechanism with the shorter timescale must dictate the structure and dynamics of the cloud. The orbital timescale describes the time taken by a GMC to complete one circular orbit. As a cloud moves along its orbit and experiences shear, it becomes larger and less bound over the shear timescale. The orbital and shear timescales are intrinsically related:
| (11) |
and
| (12) |
where the last expression is only valid for a flat circular velocity curve. The free-fall time (, where is the mass volume density) is the timescale over which a molecular gas cloud will collapse under its own gravity. Following Utomo et al. (2018), we use
| (13) |
where is the line-of-sight depth of the molecular gas layer, taken here to be pc based on the characteristic thickness of the molecular gas layer of the MW and other galaxies (Pety et al., 2013; Yim et al., 2014; Heyer & Dame, 2015). This allows us to estimate the free-fall time of structures with radii of pc throughout the molecular gas disc. As a comparison, we also calculate the free-fall time of our identified cloud () assuming a spherical shape ().
We compare these timescales in the right panel of Figure 6, showing that and are significantly shorter than (for structures within the molecular gas disc) and (for all identified GMCs) across NGC 524. This indicates again that shear is the dominant mechanism regulating the molecular gas behaviour in NGC 524, consistent with the smooth molecular gas disc observed and the long molecular gas depletion times.
5.2 Non-circular motions
As discussed in Smith et al. (2019), there are non-circular molecular gas motions in NGC 524, due to weak bi-symmetric spiral structures revealed by the mean line-of-sight velocity residual map and the velocity dispersion map. The former was generated by subtracting an axisymmetric rotating disc model from the observed velocity field. At the same location as the observed spiral pattern, there is also an annular structure with higher velocity dispersions, clearly visible in the observed moment-2 map. This is interpreted as due to beam smearing of both the rotation velocities and the spiral structures.
The line-of-sight velocities were further separated into azimuthal and radial components by Smith et al. (2019), using the harmonics of the observed velocity field. This decomposition indicates that the non-circular motions can be explained by either a warped disc or an outflow, potentially driven by the AGN. As discussed in Section 2.1, there is a compact radio source at the centre of NGC 524, but no clear evidence of nuclear activity from either radio observations or our ionised-gas maps.
Overall, while non-circular motions are present in NGC 524, especially in the central pc in galactocentric distance, there is no direct link between them and potential radial inflows or outflows that can add turbulence to the GMCs and affect their SFEs. Even if these non-circular motions were associated with inflows/outflows, the residual velocities are only of the rotational velocities, so their amplitudes are limited, especially compared to the dominant shear motions due to the fast-rotating disc.
5.3 Comparison to other ETGs
Compared to other ETGs in the WISDOM sample (Davis et al., 2022), NGC 524 has almost the highest stellar mass surface density, but there are a few galaxies that appear smoother (lower smoothness index). Interestingly, the ETGs that are smoother (e.g. NGC 4429, NGC 1387 and NGC 383) all have well-identified GMCs with sizes pc. The NGC 4429 GMCs have properties that suggest self gravity at best just counterbalances shear (Liu et al., 2021). The GMCs of NGC 1387 are more similar to those of the MW, with virialised clouds of sizes comparable to their tidal radii (Liang et al., 2024). Although these ETGs have a variety of GMC properties, it is unusual that it is so difficult to identify GMCs in NGC 524, with at best a few GMCs with very high virial parameters.
Within the WISDOM sample of ETGs, NGC 524 is a rare case that clearly demonstrates the impact of the deep and steep gravitational potentials of spheroids and the associated strong shear. As shown in Williams et al. (2023), the molecular gas of NGC 524 has high virial parameters that are typical of ETGs, but the turbulent pressures are the lowest, indicating that the GMCs of NGC 524 are not bound by gravity but are also not turbulent. This is in line with what was demonstrated in Section 5.1: shear is the dominant force shaping the molecular gas properties of NGC 524. Another unique feature of NGC 524 is that it has the smallest molecular gas fraction of the WISDOM ETG sample (Davis et al., 2022). This may also offer an explanation for the strong impact of shear, as simulations show that the impact of the potential becomes stronger with lower cold gas fractions (Gensior & Kruijssen, 2021). Although all of the sample ETGs have deep gravitational potential wells created by the centrally-concentrated stellar distributions, NGC 524 has the lowest molecular gas mass surface density within the central kpc, and hence the weakest molecular cloud self gravity to balance the strong shear from the galaxy rotation. This strong shear does not imply that the GMCs are particularly turbulent, but it can destroy GMCs before they collapse and form stars. This is in line with the observed long depletion times discussed in Section 3.2.
6 Conclusions
In this work, we have used ALMA and SITELLE observations to study the molecular and ionised gas of NGC 524. We find that:
-
1.
Based on our ALMA observations (synthesised beam size of pc), NGC 524 has a smooth molecular gas disc, with at best a few dozens GMCs that have small molecular gas mass surface densities, high virial parameters () and no well-defined edge.
-
2.
The ionised-gas emission is not directly associated with star formation. The SFR upper limits inferred from the H emission imply depletion time lower limits with a global of Gyr and a maximum of Gyr near the galaxy centre.
-
3.
Based on analyses of the identified GMC molecular gas mass surface densities, radii and relevant timescales, shear is the dominant force regulating GMC properties and the resultant SF in NGC 524.
-
4.
The GMC analyses of this work are constrained by the spatial resolution of our observations. It is likely that GMCs in galaxies similar to NGC 524 have sizes of only a few parsecs, a behaviour supported by the comparison of our observations with a simulated galaxy whose properties closely match those of NGC 524. Thus, molecular gas observations with better spatial resolutions are required to unveil the details of the NGC 524 GMCs.
Acknowledgements
We thank the anonymous referee for suggestions and comments. This research is based on observations obtained with the SITELLE instrument on the Canada-France-Hawaii Telescope (CFHT) which is operated from the summit of Maunakea, and the Atacama Large Millimeter/submillimeter Array (ALMA) in the Atacama desert. This paper makes use of the following ALMA data: ADS/JAO.ALMA#2015.1.00466.S, ADS/JAO.ALMA#2016.2.00053.S, and ADS/JAO.ALMA#2017.1.00391.S. ALMA is a partnership of ESO (representing its member states), NSF (USA) and NINS (Japan), together with NRC (Canada), MOST and ASIAA (Taiwan), and KASI (Republic of Korea), in cooperation with the Republic of Chile. The Joint ALMA Observatory is operated by ESO, AUI/NRAO and NAOJ. The National Radio Astronomy Observatory is a facility of the National Science Foundation operated under cooperative agreement by Associated Universities, Inc.
We are grateful to the CFHT and ALMA scheduling, data processing and archive teams. We also wish to acknowledge that the summit of Maunakea is a significant cultural and historic site for the indigenous Hawaiian community, while the the high-altitude plateau Chajnantor on which the ALMA telescope sits is sacred to indigenous Likanantai people. We are most grateful to have the opportunity of observing there. We thank Nicole Ford for the scientific and aesthetic support.
AL, HB, DH, CR, LD and LRN acknowledge funding from the NSERC Discovery Grant and the Canada Research Chairs (CRC) programmes. MB was supported by STFC consolidated grant ‘Astrophysics at Oxford’ ST/H002456/1 and ST/K00106X/1. JG gratefully acknowledges financial support from the Swiss National Science Foundation (grant no CRSII5_193826). SMRJ is supported by Harvard University through the Institute for Theory and Computation Fellowship. IR acknowledges support from grant ST/S00033X/1 through the UK Science and Technology Facilities Council (STFC). TAD acknowledges support from the UK Science and Technology Facilities Council through grant ST/W000830/1.
Data Availability
The raw data underlying this article are publicly available on the National Radio Astronomy Observatory (programmes 2015.1.00466.S, 2016.2.00053.S, and 2017.1.00391.S) and CFHT archives (programmes 22Bc09 and 20Bc25). All analysed data products are available upon request.
References
- Abraham et al. (1996) Abraham R. G., Tanvir N. R., Santiago B. X., Ellis R. S., Glazebrook K., van den Bergh S., 1996, MNRAS, 279, L47
- Alatalo et al. (2013) Alatalo K., et al., 2013, MNRAS, 432, 1796
- Baldwin et al. (1981) Baldwin J. A., Phillips M. M., Terlevich R., 1981, PASP, 93, 5
- Bigiel et al. (2008) Bigiel F., Leroy A., Walter F., Brinks E., De Blok W., Madore B., Thornley M. D., 2008, AJ, 136, 2846
- Bolatto et al. (2008) Bolatto A. D., Leroy A. K., Rosolowsky E., Walter F., Blitz L., 2008, ApJ, 686, 948
- Bolatto et al. (2013) Bolatto A. D., Wolfire M., Leroy A. K., 2013, Annual Review of Astronomy and Astrophysics, 51, 207
- Cappellari (2022) Cappellari M., 2022, MNRAS submitted
- Cappellari et al. (2006) Cappellari M., et al., 2006, MNRAS, 366, 1126
- Cappellari et al. (2011) Cappellari M., et al., 2011, MNRAS, 413, 813
- Cappellari et al. (2013) Cappellari M., et al., 2013, MNRAS, 432, 1709
- Chevance et al. (2022) Chevance M., Krumholz M. R., McLeod A. F., Ostriker E. C., Rosolowsky E. W., Sternberg A., 2022, arXiv preprint arXiv:2203.09570
- Choi et al. (2023) Choi W., et al., 2023, Monthly Notices of the Royal Astronomical Society, 522, 4078
- Cirasuolo et al. (2007) Cirasuolo M., et al., 2007, MNRAS, 380, 585
- Conselice (2003) Conselice C. J., 2003, ApJS, 147, 1
- Crocker et al. (2011a) Crocker A. F., Bureau M., Young L. M., Combes F., 2011a, MNRAS, 410, 1197
- Crocker et al. (2011b) Crocker A. F., Bureau M., Young L. M., Combes F., 2011b, MNRAS, 410, 1197
- Davis et al. (2013) Davis T. A., et al., 2013, MNRAS, 429, 534
- Davis et al. (2014) Davis T. A., et al., 2014, MNRAS, 444, 3427
- Davis et al. (2019) Davis T. A., Greene J. E., Ma C.-P., Blakeslee J. P., Dawson J. M., Pandya V., Veale M., Zabel N., 2019, MNRAS, 486, 1404
- Davis et al. (2022) Davis T. A., et al., 2022, MNRAS, 512, 1522
- Decarli et al. (2016) Decarli R., et al., 2016, The Astrophysical Journal, 833, 69
- Drissen et al. (2019) Drissen L., et al., 2019, Monthly Notices of the Royal Astronomical Society, 485, 3930
- Dwarakanath & Nath (2006) Dwarakanath K. S., Nath B. B., 2006, ApJ, 653, L9
- Emsellem et al. (2007) Emsellem E., et al., 2007, MNRAS, 379, 401
- Faber et al. (1997) Faber S. M., et al., 1997, AJ, 114, 1771
- Filho et al. (2004) Filho M. E., Fraternali F., Markoff S., Nagar N. M., Barthel P. D., Ho L. C., Yuan F., 2004, A&A, 418, 429
- Fitzpatrick (1986) Fitzpatrick E. L., 1986, The Astronomical Journal, 92, 1068
- Freedman et al. (2001) Freedman W. L., et al., 2001, ApJ, 553, 47
- Gammie et al. (1991) Gammie C. F., Ostriker J. P., Jog C. J., 1991, ApJ, 378, 565
- Gensior & Kruijssen (2021) Gensior J., Kruijssen J. D., 2021, Monthly Notices of the Royal Astronomical Society, 500, 2000
- Gensior et al. (2020) Gensior J., Kruijssen J. D., Keller B. W., 2020, Monthly Notices of the Royal Astronomical Society, 495, 199
- Gensior et al. (2023) Gensior J., Davis T. A., Bureau M., Kruijssen J. D., Cappellari M., Ruffa I., Williams T. G., 2023, Monthly Notices of the Royal Astronomical Society, 526, 5590
- Glover & Mac Low (2007) Glover S. C., Mac Low M.-M., 2007, The Astrophysical Journal Supplement Series, 169, 239
- Glover et al. (2010) Glover S. C., Federrath C., Mac Low M.-M., Klessen R. S., 2010, Monthly Notices of the Royal Astronomical Society, 404, 2
- Hernquist (1990) Hernquist L., 1990, Astrophysical Journal, Part 1 (ISSN 0004-637X), vol. 356, June 20, 1990, p. 359-364., 356, 359
- Heyer & Dame (2015) Heyer M., Dame T. M., 2015, ARA&A, 53, 583
- Hughes et al. (2013) Hughes A., et al., 2013, The Astrophysical Journal, 779, 44
- Iguchi et al. (2009) Iguchi S., et al., 2009, PASJ, 61, 1
- Jeffreson et al. (2020) Jeffreson S. M. R., Kruijssen J. M. D., Keller B. W., Chevance M., Glover S. C. O., 2020, MNRAS, 498, 385
- Jeffreson et al. (2021) Jeffreson S. M., Keller B. W., Winter A. J., Chevance M., Kruijssen J. D., Krumholz M. R., Fujimoto Y., 2021, Monthly Notices of the Royal Astronomical Society, 505, 1678
- Kauffmann et al. (2003) Kauffmann G., et al., 2003, MNRAS, 341, 54
- Kauffmann et al. (2017) Kauffmann J., Pillai T., Zhang Q., Menten K. M., Goldsmith P. F., Lu X., Guzmán A. E., 2017, A&A, 603, A89
- Kennicutt Jr (1998) Kennicutt Jr R. C., 1998, The astrophysical journal, 498, 541
- Kennicutt Jr & Evans (2012) Kennicutt Jr R. C., Evans N. J., 2012, Annual Review of Astronomy and Astrophysics, 50, 531
- Krajnović et al. (2009) Krajnović D., McDermid R. M., Cappellari M., Davies R. L., 2009, MNRAS, 399, 1839
- Krumholz (2014) Krumholz M. R., 2014, MNRAS, 437, 1662
- Lamperti et al. (2020) Lamperti I., et al., 2020, The Astrophysical Journal, 889, 103
- Larson (1981) Larson R. B., 1981, MNRAS, 194, 809
- Law et al. (2021) Law D. R., et al., 2021, The Astrophysical Journal, 915, 35
- Leroy et al. (2008) Leroy A. K., Walter F., Brinks E., Bigiel F., de Blok W. J. G., Madore B., Thornley M. D., 2008, AJ, 136, 2782
- Liang et al. (2024) Liang F.-H., et al., 2024, MNRAS, submitted
- Lindegren et al. (2018) Lindegren L., et al., 2018, Astronomy & astrophysics, 616, A2
- Liu et al. (2021) Liu L., Bureau M., Blitz L., Davis T. A., Onishi K., Smith M., North E., Iguchi S., 2021, MNRAS, 505, 4048
- Ma et al. (2014) Ma C.-P., Greene J. E., McConnell N., Janish R., Blakeslee J. P., Thomas J., Murphy J. D., 2014, ApJ, 795, 158
- MacLaren et al. (1988) MacLaren I., Richardson K. M., Wolfendale A. W., 1988, ApJ, 333, 821
- Martig et al. (2009) Martig M., Bournaud F., Teyssier R., Dekel A., 2009, ApJ, 707, 250
- Martin et al. (2015) Martin T., Drissen L., Joncas G., 2015, Astronomical Data Analysis Software an Systems, 24, 327
- Martin et al. (2016) Martin T. B., Prunet S., Drissen L., 2016, Monthly Notices of the Royal Astronomical Society, 463, 4223
- Martin et al. (2021) Martin T., Drissen L., Prunet S., 2021, Monthly Notices of the Royal Astronomical Society, 505, 5514
- McMullin et al. (2007) McMullin J. P., Waters B., Schiebel D., Young W., Golap K., 2007, in Shaw R. A., Hill F., Bell D. J., eds, Astronomical Society of the Pacific Conference Series Vol. 376, Astronomical Data Analysis Software and Systems XVI. p. 127
- Nelson & Langer (1997) Nelson R. P., Langer W. D., 1997, The Astrophysical Journal, 482, 796
- Nelson et al. (2016) Nelson E. J., et al., 2016, The Astrophysical Journal Letters, 817, L9
- Noeske et al. (2007) Noeske K. G., et al., 2007, ApJ, 660, L43
- Nyland et al. (2016) Nyland K., et al., 2016, MNRAS, 458, 2221
- Onishi et al. (2017) Onishi K., Iguchi S., Davis T. A., Bureau M., Cappellari M., Sarzi M., Blitz L., 2017, MNRAS, 468, 4663
- Osterbrock & Ferland (2006) Osterbrock D. E., Ferland G. J., 2006, Astrophysics Of Gas Nebulae and Active Galactic Nuclei. University science books
- Padoan et al. (2016) Padoan P., Pan L., Haugbølle T., Nordlund Å., 2016, ApJ, 822, 11
- Pessa et al. (2021) Pessa I., et al., 2021, A&A, 650, A134
- Pety et al. (2013) Pety J., et al., 2013, ApJ, 779, 43
- Rosolowsky (2007) Rosolowsky E., 2007, ApJ, 654, 240
- Rosolowsky & Leroy (2006) Rosolowsky E., Leroy A., 2006, PASP, 118, 590
- Rosolowsky et al. (2003) Rosolowsky E., Engargiola G., Plambeck R., Blitz L., 2003, ApJ, 599, 258
- Rosolowsky et al. (2021) Rosolowsky E., et al., 2021, MNRAS, 502, 1218
- Ruffa et al. (2019a) Ruffa I., et al., 2019a, MNRAS, 484, 4239
- Ruffa et al. (2019b) Ruffa I., et al., 2019b, MNRAS, 489, 3739
- Salmi et al. (2012) Salmi F., Daddi E., Elbaz D., Sargent M. T., Dickinson M., Renzini A., Bethermin M., Le Borgne D., 2012, ApJ, 754, L14
- Sánchez-Blázquez et al. (2006) Sánchez-Blázquez P., et al., 2006, MNRAS, 371, 703
- Sandstrom et al. (2013) Sandstrom K. M., et al., 2013, ApJ, 777, 5
- Schiminovich et al. (2007) Schiminovich D., et al., 2007, ApJS, 173, 315
- Sil’chenko (2000) Sil’chenko O. K., 2000, AJ, 120, 741
- Smith et al. (2019) Smith M. D., et al., 2019, MNRAS, 485, 4359
- Solomon et al. (1987) Solomon P. M., Rivolo A. R., Barrett J., Yahil A., 1987, ApJ, 319, 730
- Springel et al. (2005) Springel V., Di Matteo T., Hernquist L., 2005, Monthly Notices of the Royal Astronomical Society, 361, 776
- Strong et al. (1988) Strong A., et al., 1988, Astronomy and Astrophysics, 207, 1
- Sun et al. (2018) Sun J., et al., 2018, The Astrophysical Journal, 860, 172
- Tan (2000) Tan J. C., 2000, ApJ, 536, 173
- Teng et al. (2022) Teng Y.-H., et al., 2022, ApJ, 925, 72
- Tonry et al. (2001) Tonry J. L., Dressler A., Blakeslee J. P., Ajhar E. A., Fletcher A. B., Luppino G. A., Metzger M. R., Moore C. B., 2001, ApJ, 546, 681
- Utomo et al. (2015a) Utomo D., Blitz L., Davis T., Rosolowsky E., Bureau M., Cappellari M., Sarzi M., 2015a, ApJ, 803, 16
- Utomo et al. (2015b) Utomo D., Blitz L., Davis T., Rosolowsky E., Bureau M., Cappellari M., Sarzi M., 2015b, The Astrophysical Journal, 803, 16
- Utomo et al. (2018) Utomo D., et al., 2018, ApJ, 861, L18
- Williams et al. (2023) Williams T. G., et al., 2023, Monthly Notices of the Royal Astronomical Society, 525, 4270
- Wong et al. (2011) Wong T., et al., 2011, ApJS, 197, 16
- Wrobel & Heeschen (1991) Wrobel J. M., Heeschen D. S., 1991, AJ, 101, 148
- Wuyts et al. (2011) Wuyts S., et al., 2011, ApJ, 742, 96
- Yim et al. (2014) Yim K., Wong T., Xue R., Rand R. J., Rosolowsky E., van der Hulst J. M., Benjamin R., Murphy E. J., 2014, AJ, 148, 127
- Yoon et al. (2021) Yoon Y., Park C., Chung H., Zhang K., 2021, ApJ, 922, 249
- York et al. (2000) York D. G., et al., 2000, AJ, 120, 1579
- Young et al. (2011a) Young L. M., et al., 2011a, MNRAS, 414, 940
- Young et al. (2011b) Young L. M., et al., 2011b, MNRAS, 414, 940
- de Zeeuw et al. (2002) de Zeeuw P. T., et al., 2002, MNRAS, 329, 513
Appendix A Ionised-gas maps
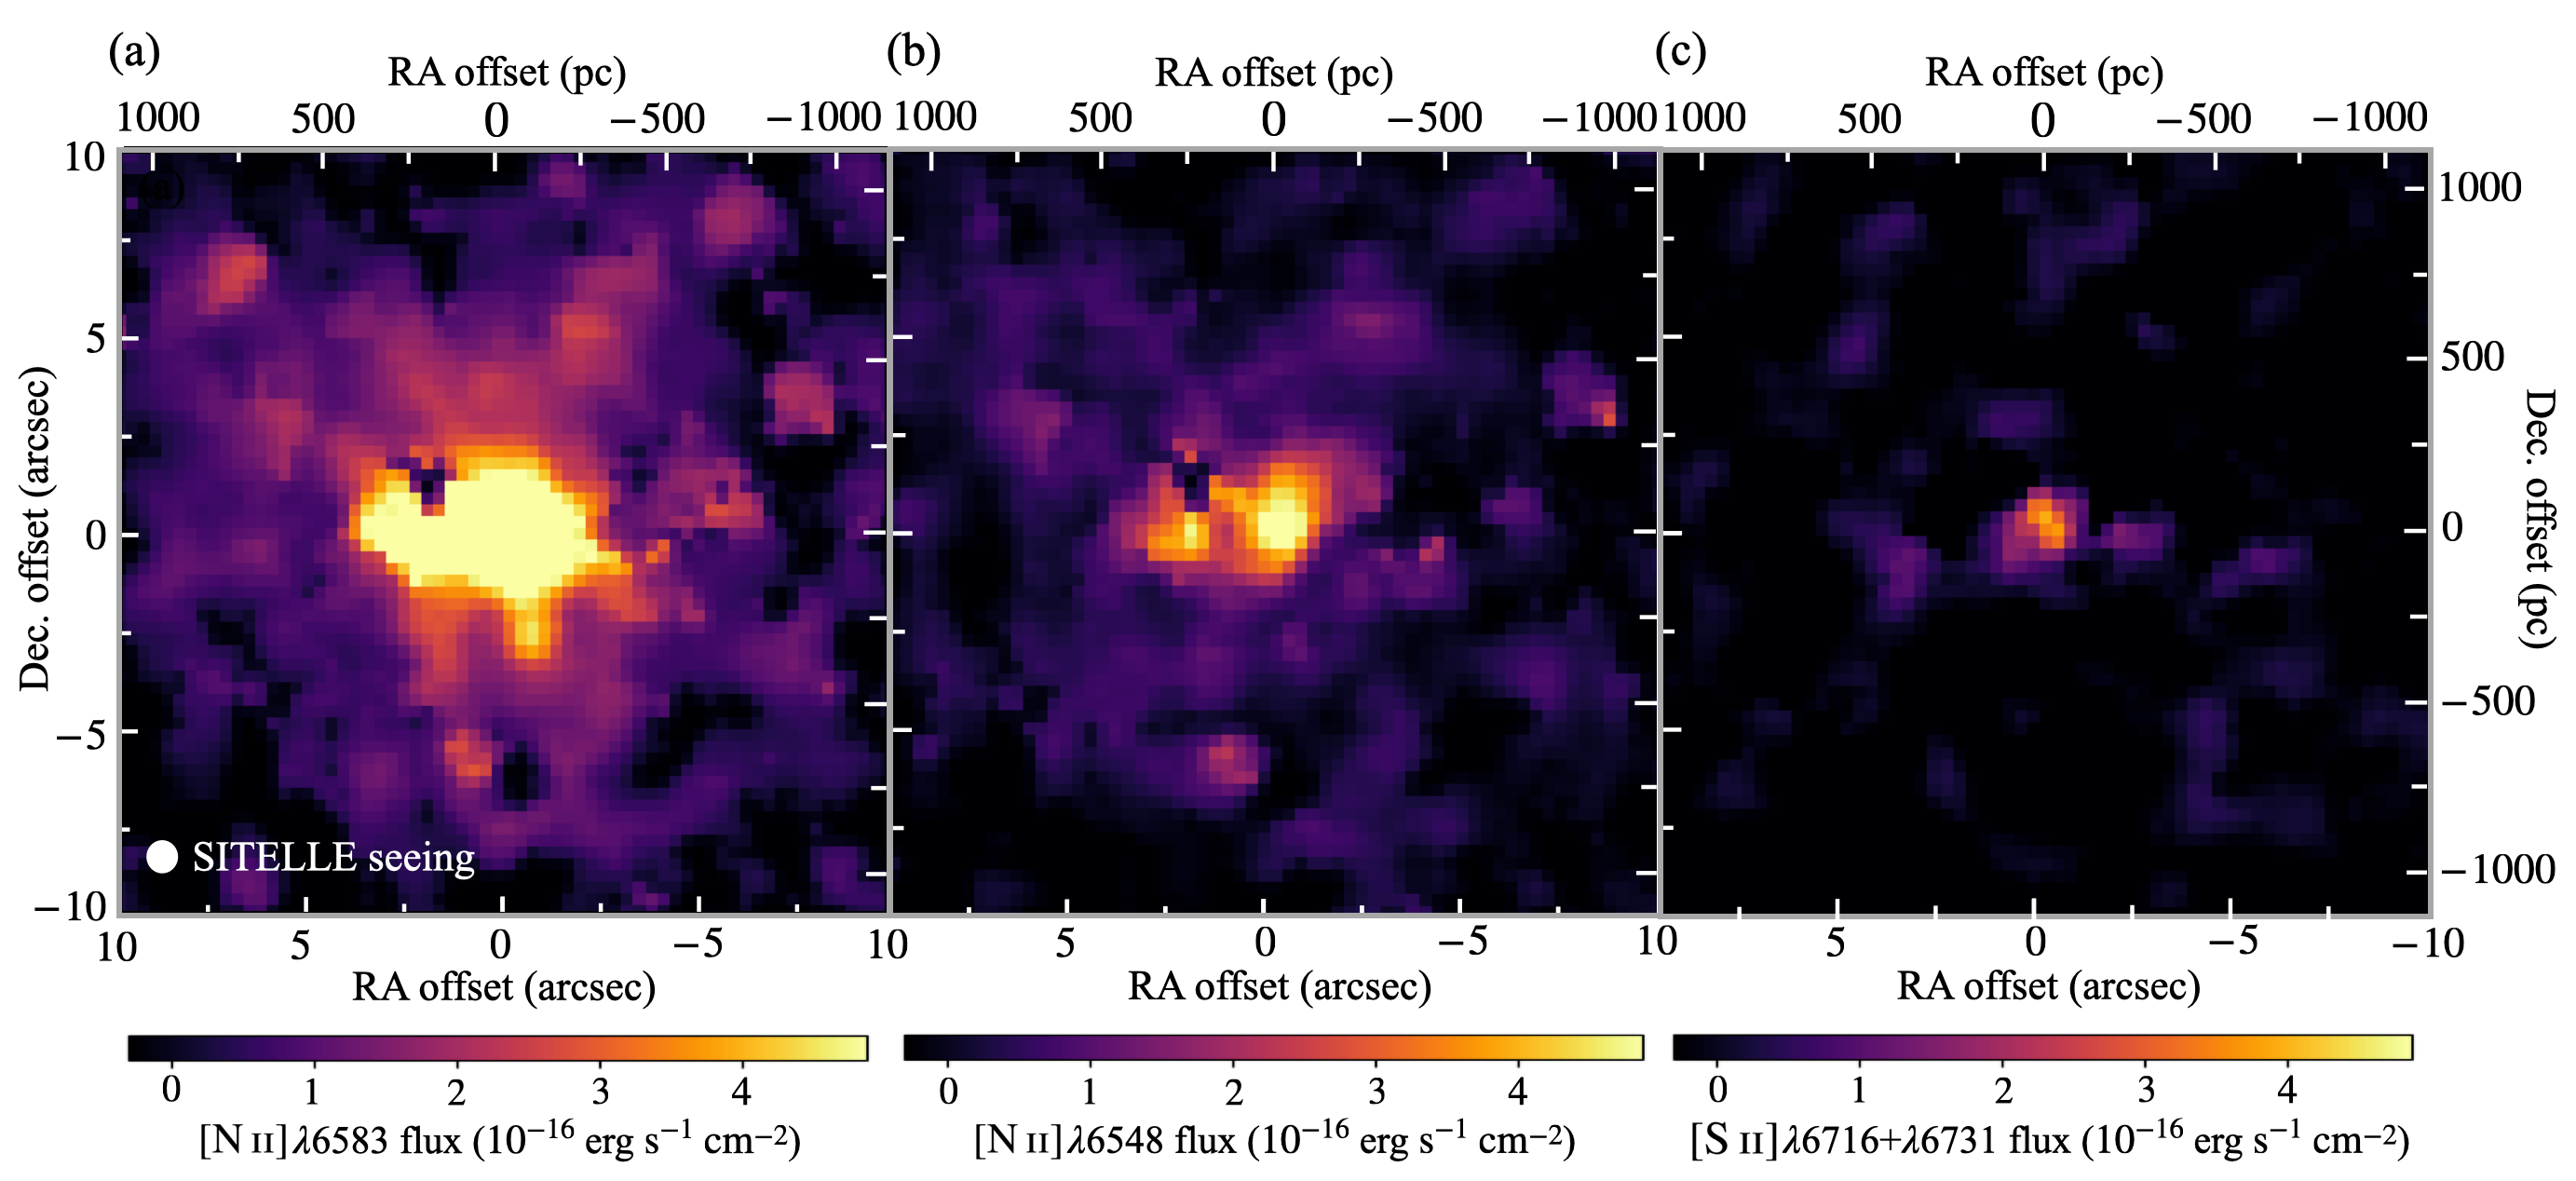
Figure 7 shows the surface brightness (i.e. the flux within one pixel corrected for absorption but not extinction, divided by the pixel area) maps of emission lines from the SN3 data cube, as measured with ORCS. We note that the H map is shown in Figure 2 and is not repeated there.
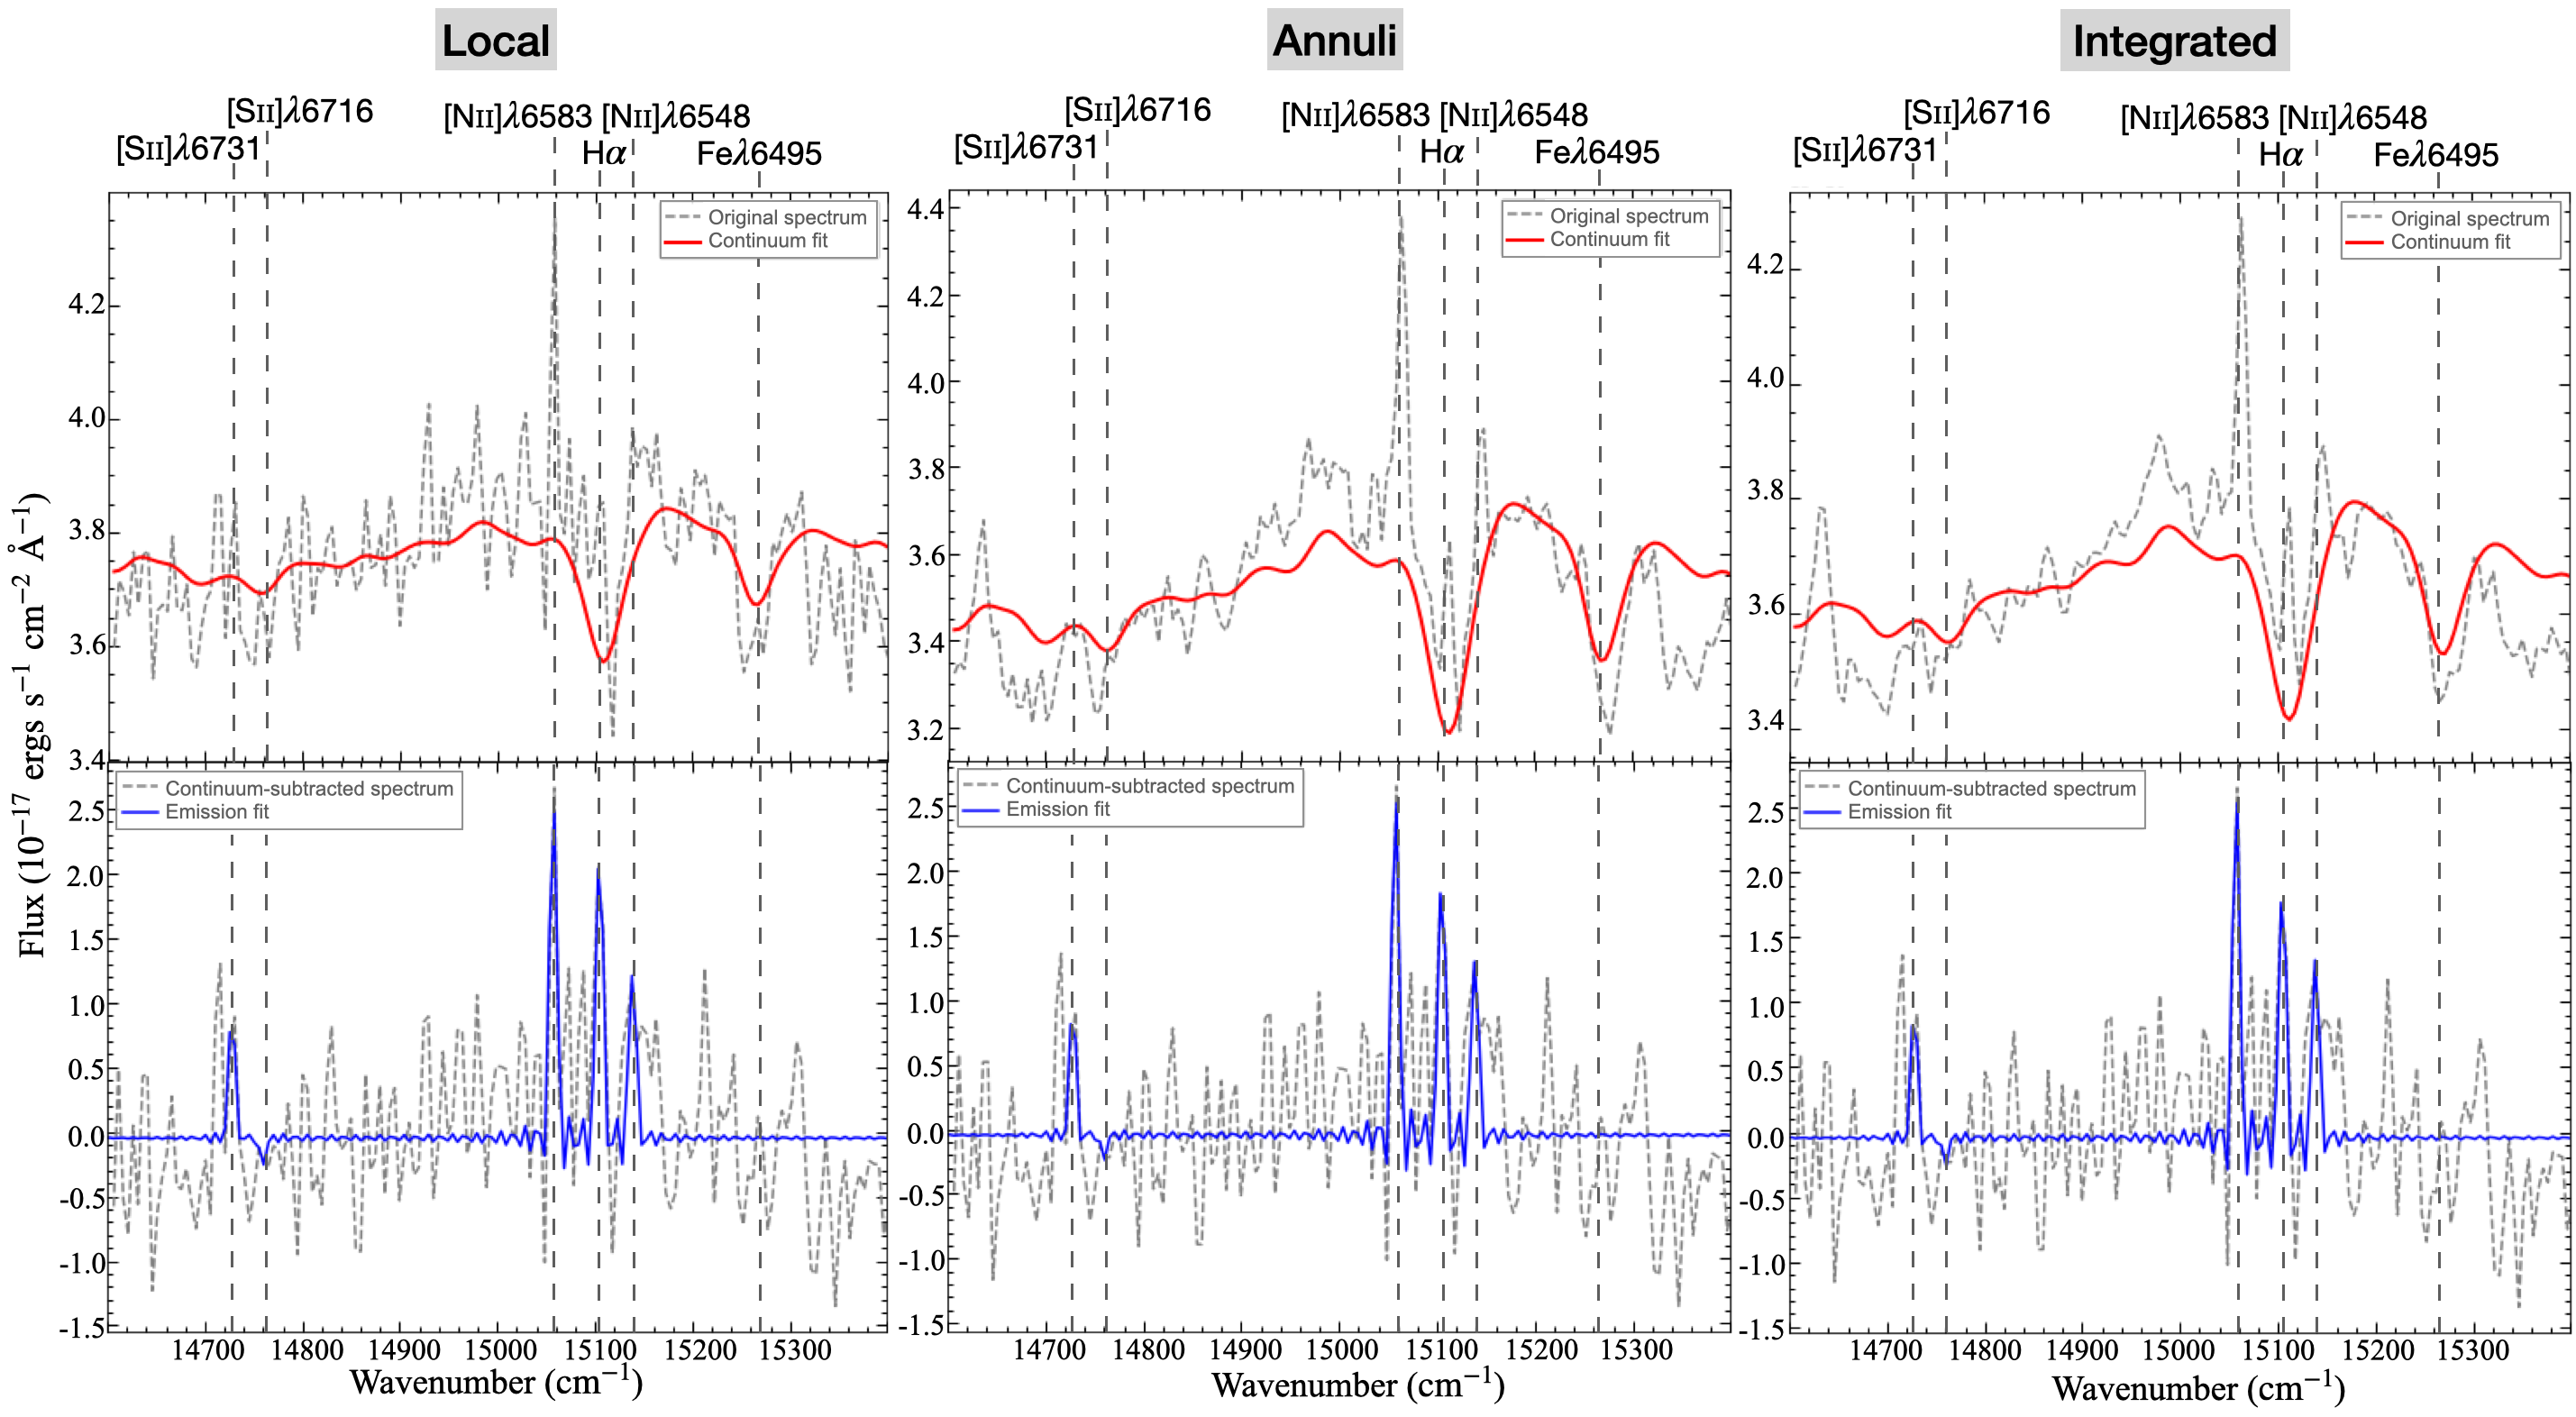
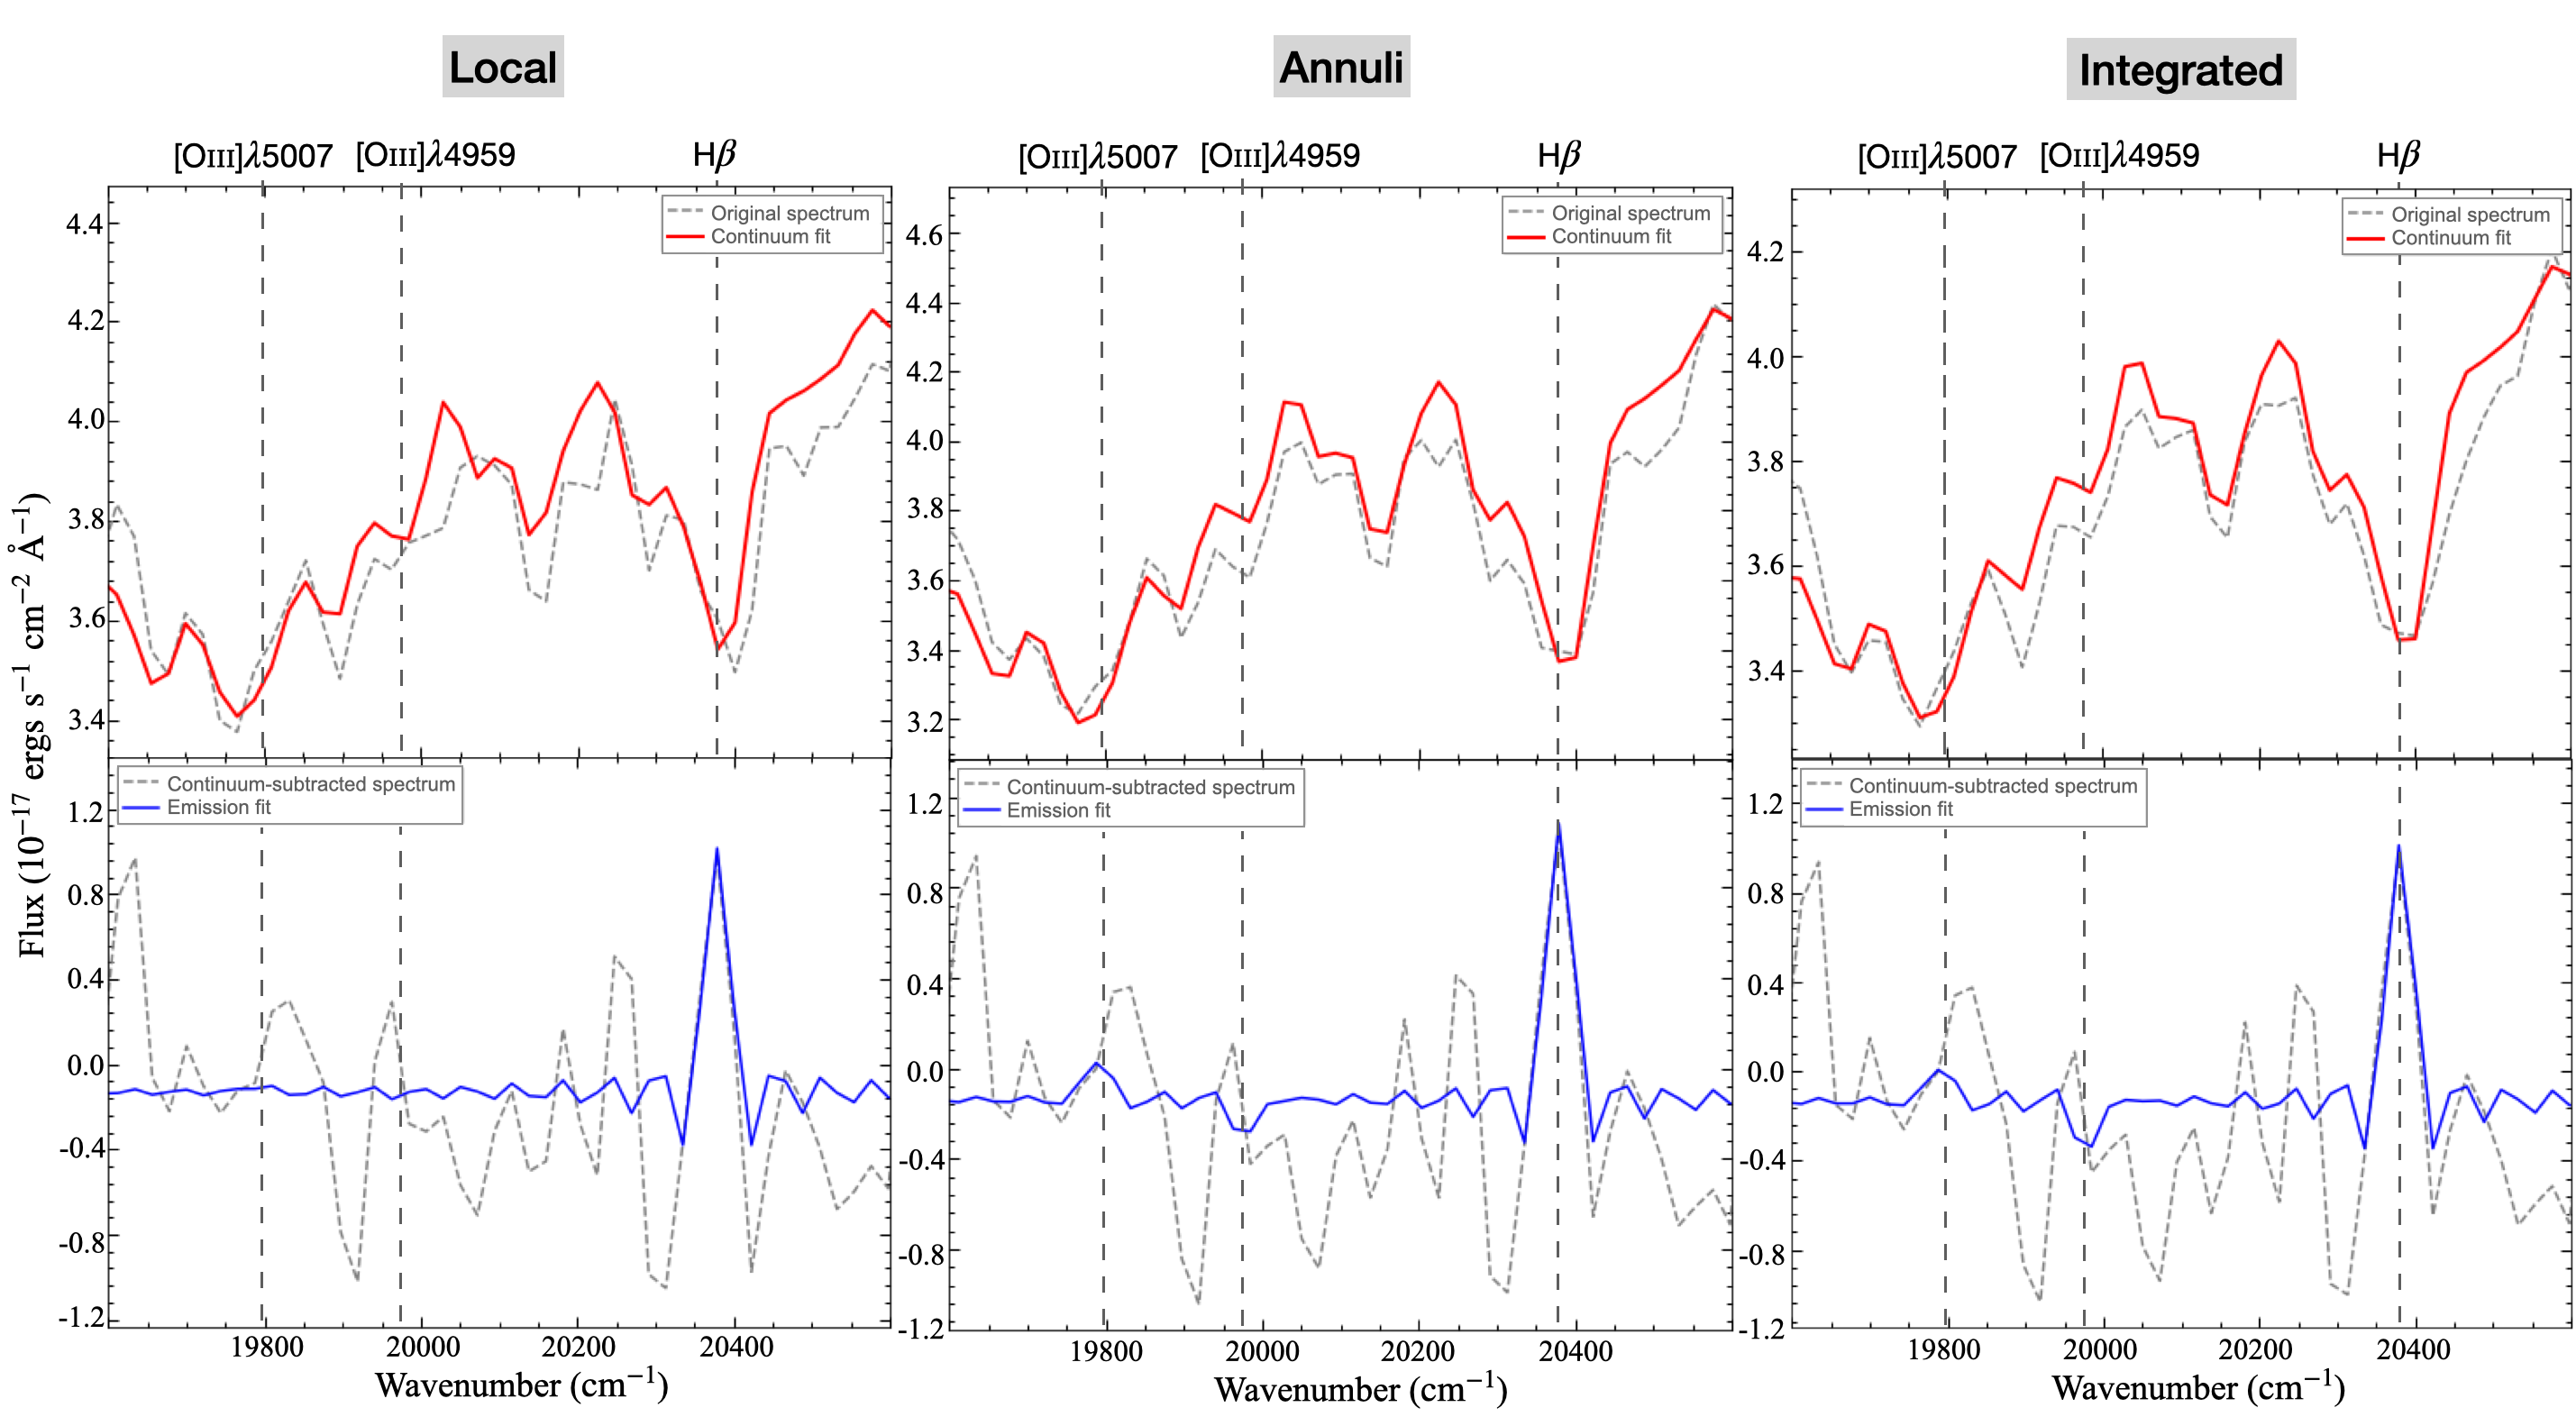
To subtract the stellar continuum (and thus the stellar absorption) co-spatial with the emission lines, we use the pPXF algorithm (Cappellari, 2022) with the Medium-resolution Isaac Newton Telescope Library of Empirical Spectra (MILES; Sánchez-Blázquez et al. 2006), while the emission lines are modelled using the SITELLE ‘sinc’ line spread function implemented into the pPXF routines (as described in Massé et al. in prep.). As the in any single spaxel is generally too low to obtain a reliable fit to the stellar continuum, it is necessary to combine several spaxels (for the stellar continuum subtraction only, not the emission-line fits). To optimise this process, we experimented with combining spaxels using three different methods: 1) spaxels centred on each spaxel, 2) annuli of pc width centred on the galaxy centre and 3) spaxels centred on the galaxy centre. In all cases, the spectrum of each spaxel is shifted to the galaxy rest frame using the H velocity map (Figure 2) prior to being added and subsequently fitted with pPXF. Examples of stellar continuum models generated by pPXF for these spectra are shown in Figure 8. The pPXF best-fitting models are then subtracted from every spaxel after being shifted to that spaxel’s mean velocity and scaled to the correct continuum level. We show the corresponding emission-line best-fitting results using ORCS in Figure 8. All three methods perform reasonably well to capture and correct for the absorption features. To obtain the most reliable emission-line measurements, we select the method that yields the highest at each spaxel. All the analyses discussed in this work are based on emission-line maps obtained in this manner.
To characterise the ionisation mechanisms of the ionised gas, emission-line regions must first be defined. To do this, the positions of the emission-line local maxima and their associated emission were identified using the algorithm described by Savard et al. (in prep.). To minimise the impact of noise, we use here the peak flux rather than the integrated flux of the H emission line. The Laplacian of the H peak flux map (corrected for absorption) was first used to identify local maxima in running spaxels boxes, and only the maxima above a certain threshold were kept. To account for the H background, this threshold is equal to times the H peak flux noise calculated in larger spaxels running boxes. The positions of these (remaining) maxima are shown on the H peak flux map of Figure 9 (a).
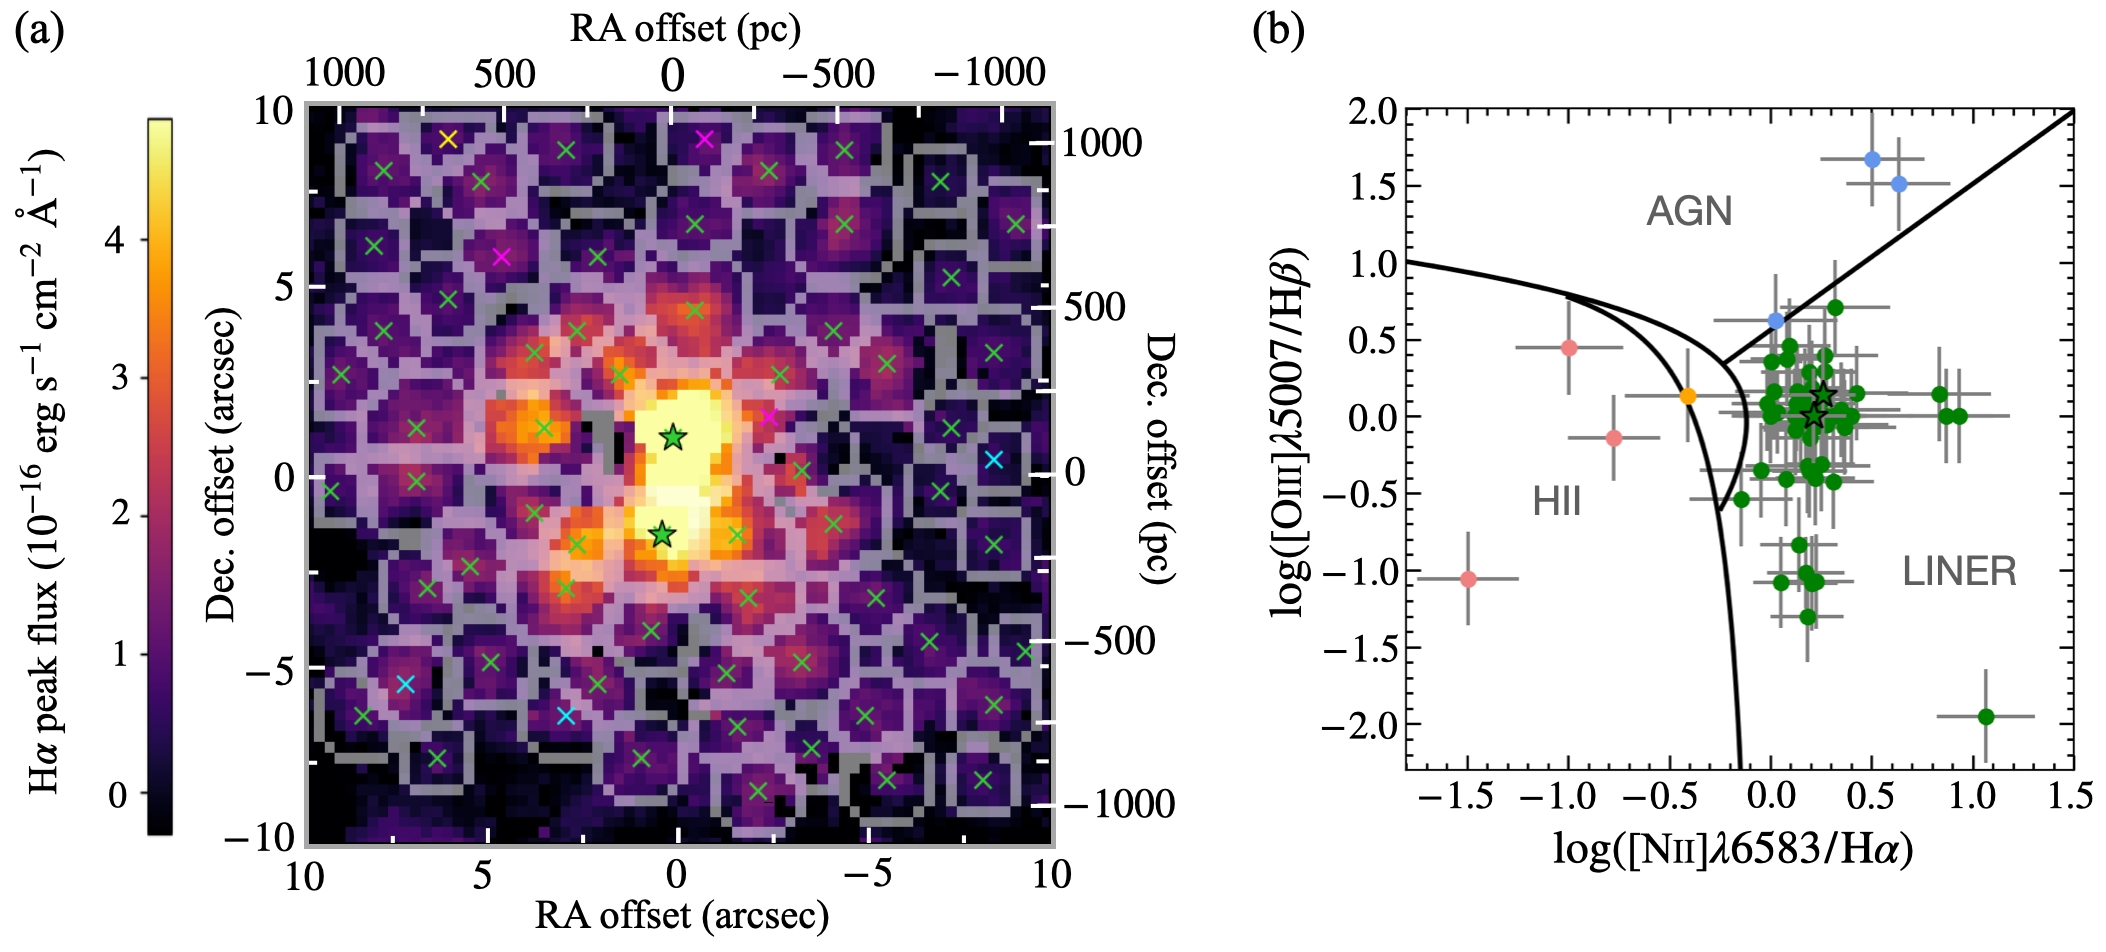
A ‘working zone’ around each selected local maximum is then defined by assigning to each pixel a dominant maximum (the neighbouring maximum with the highest ratio, where is the peak flux of the maximum and the distance of the maximum from the pixel). The zone sizes vary from to pc (mean radius from the maximum to the zone’s edge) depending on the maximum’s peak flux. These zones are then adopted as our final emission-line regions, shown in Figure 9 (a). They are also transposed to the SN3 and SN2 data cubes, to calculate the integrated SN3 and SN2 spectra of all the regions and measure their emission lines with ORCS.
We then attempt to distinguish different ionisation mechanisms by exploiting primarily emission-line ratios (so-called ‘BPT diagrams’; e.g. Baldwin et al. 1981), using the most up-to-date diagnostics from Law et al. (2021) shown in Figure 9 (b). The H emission local maxima shown in Figure 9 (a) are colour coded according to this diagnostic diagram. The emission of nearly all regions is characteristic of low-ionisation (nuclear) emission regions (LINERs). Although the central region of NGC 524 is very bright and has a compact radio source, we confirm from its emission spectrum (see Figure 10) that there is no significant AGN signature. The central spectrum is instead similar to that of the strong diffuse ionised-gas (DIG) component present away from the galaxy centre. Based on this, we infer that essentially all SFRs derived from H emission are upper limits.
The extinction of each region is calculated considering the Balmer decrement, based on the integrated flux ratio of H and H. Figure 9 (c) shows the extinction () calculated as a function of galactocentric distance. A few regions have negative , that can be explained by uncertainties of the flux calibration and/or the measurements, and/or the fact that the intrinsic H/H flux ratio can deviate from in diffuse ionised-gas regions. Nevertheless, all data points have within the uncertainties. For each negative region, we use the upper limit to correct for the extinction. The resulting extinction-corrected H surface brightness map is shown in Figure 9 (d).