Explainable Data-driven Modeling of Adsorption Energy in Heterogeneous Catalysis
Abstract
The increasing popularity of machine learning (ML) in catalysis has spurred interest in leveraging these techniques to enhance catalyst design. Despite the promise of machine learning approaches, they often function as black boxes, leaving a gap between physics-based studies and data-driven methodologies. Our study aims to bridge this gap by integrating ML techniques with eXplainable AI (XAI), specifically employing two techniques: post-hoc XAI analysis and Symbolic Regression, to unravel the correlation between adsorption energy and the properties of the adsorbate-catalyst system. Leveraging a large dataset such as the Open Catalyst Dataset (OC20), we employ a combination of shallow ML techniques and XAI methodologies. Our investigation involves utilizing multiple shallow machine learning techniques to predict adsorption energy followed by Post-hoc analysis for feature importance, inter-feature correlations, and the influence of various features values on prediction of adsorption energy. The Post-hoc analysis reveals that adsorbate properties exert a greater influence than catalyst properties in our dataset. The top five features with the most importance, based on higher Shapley values, are adsorbate electronegativity, the number of adsorbate atoms, catalyst electronegativity, effective coordination number, and the sum of atomic numbers of the adsorbate molecule. There is a positive correlation between catalyst and adsorbate electronegativity with the prediction of adsorption energy. Additionally, Symbolic Regression, which helps elucidate mathematical expressions describing the relationship between input features and adsorption energy, yields results consistent with SHAP analysis. It deduces a mathematical relationship indicating that the square of the catalyst electronegativity is directly proportional to the adsorption energy. These consistent correlations resemble those derived from physics-based equations in previous research. Our work establishes a robust framework that integrates ML techniques with XAI, leveraging large datasets like OC20 to enhance catalyst design through model explainability.
keywords:
American Chemical Society, LaTeXChemE] Department of Chemical Engineering, Carnegie Mellon University, 5000 Forbes Street, Pittsburgh, PA 15213, USA MechE] Department of Mechanical Engineering, Carnegie Mellon University, 5000 Forbes Street, Pittsburgh, PA 15213, USA \abbreviationsIR,NMR,UV
![[Uncaptioned image]](/html/2405.20397/assets/figure/TOC.png)
Keywords: Catalysis, Computational Catalysis, Adsorption Energy, Explainable AI, Symbolic Regression, High-throughput Screening
1 Introduction
Catalysis plays a crucial role in chemical reactions and finds wide applications in industries, driving over 90% of manufacturing processes1. These processes consume about 25% of industrial energy, with heterogeneous catalysis being particularly energy-intensive. 2. To address environmental concerns and promote sustainability, it is essential to enhance the efficiency of the reaction through optimal catalyst design, which aims for higher selectivity and activity.
In catalyst design and development, a critical focus lies on understanding adsorption energy due to its strong correlation with catalytic reactivity, governing the interaction between reactants and catalysts 3. The Brønsted-Evans-Polanyi (BEP) relations illustrate volcano-shaped relationships between catalytic activity and adsorption energies, highlighting it as a pivotal descriptor 4, 5, 6, 7. The BEP relation demonstrates a linear relationship between activation barrier, , and adsorption energy, , in heterogeneous catalysis, as depicted in Equation 1. This linear relationship implies that the catalyst’s reactivity can be primarily characterized by a descriptor, . Modeling adsorption energy provides insights into reactivity and aids in catalyst screening, thus understanding the factors affecting adsorption energy is essential to identify the optimal catalyst for a target reaction.
| (1) |
Density Functional Theory (DFT) is a well-established quantum chemistry-based method widely used to calculate the properties of atomic systems, including adsorption energy in catalysis. Despite its high accuracy, DFT requires substantial computational resources. Consequently, evaluating a large number of materials for catalyst design using expensive quantum chemistry-based approaches like DFT for high-throughput screening becomes infeasible. As a solution, researchers are turning to machine learning approaches, which offer the potential to accurately predict properties at a reduced computational cost. Notably, extensive databases such as the Open Catalyst 2020 (OC20) dataset 8 comprise over 1.2 million DFT relaxations of adsorbate-catalyst systems (approximately 250 million single-point calculations) across a substantially broader structure and chemistry space than previously realized. These datasets serve as the foundation for training and deploying machine learning models, aimed at predicting the energy and interatomic forces of the adsorbate-catalyst systems. The extensive availability of material databases like OC20 for adsorbate-catalyst systems has significantly accelerated the adoption of ML approaches in catalysis, particularly Graph Neural Networks (GNNs) 9, 10, 11, 12, 13, 14, 15.
Despite the rise of ML approaches in atomic modeling, their black-box nature obscures the underlying physical insights related to energy and force predictions. This lack of interpretability limits the further application of ML methods, as the contributing factors to predictions remain unclear. Additionally, since ML predictions inherently come with a certain level of uncertainty, it is more beneficial to gain insights about catalyst systems from ML modeling rather than solely relying on prediction values 16. To address this challenge, this paper introduces the use of eXplainable Artificial Intelligence (XAI), which uncovers the underlying correlations behind predictions and provides human-understandable explanations, thereby enhancing domain-specific knowledge17. To achieve explainability, we implement two strategies: firstly, training shallow machine learning models such as Adaboost Regression, XGBoost Regression, Support Vector Regression (SVR), Kernel Ridge Regression (KRR), and Least Absolute Shrinkage and Selection Operator (LASSO) Regression accompanied by post-hoc XAI analysis; secondly, applying Symbolic Regression to gain better understanding of relation between input features and adsorption energy. Both approaches use dataset sourced from the OC20 dataset. The former strategy highlights the importance and correlations of features, while the latter generates mathematical equations that directly expose the potential relationships between input features and target labels.
2 Results and Discussion
2.1 Framework
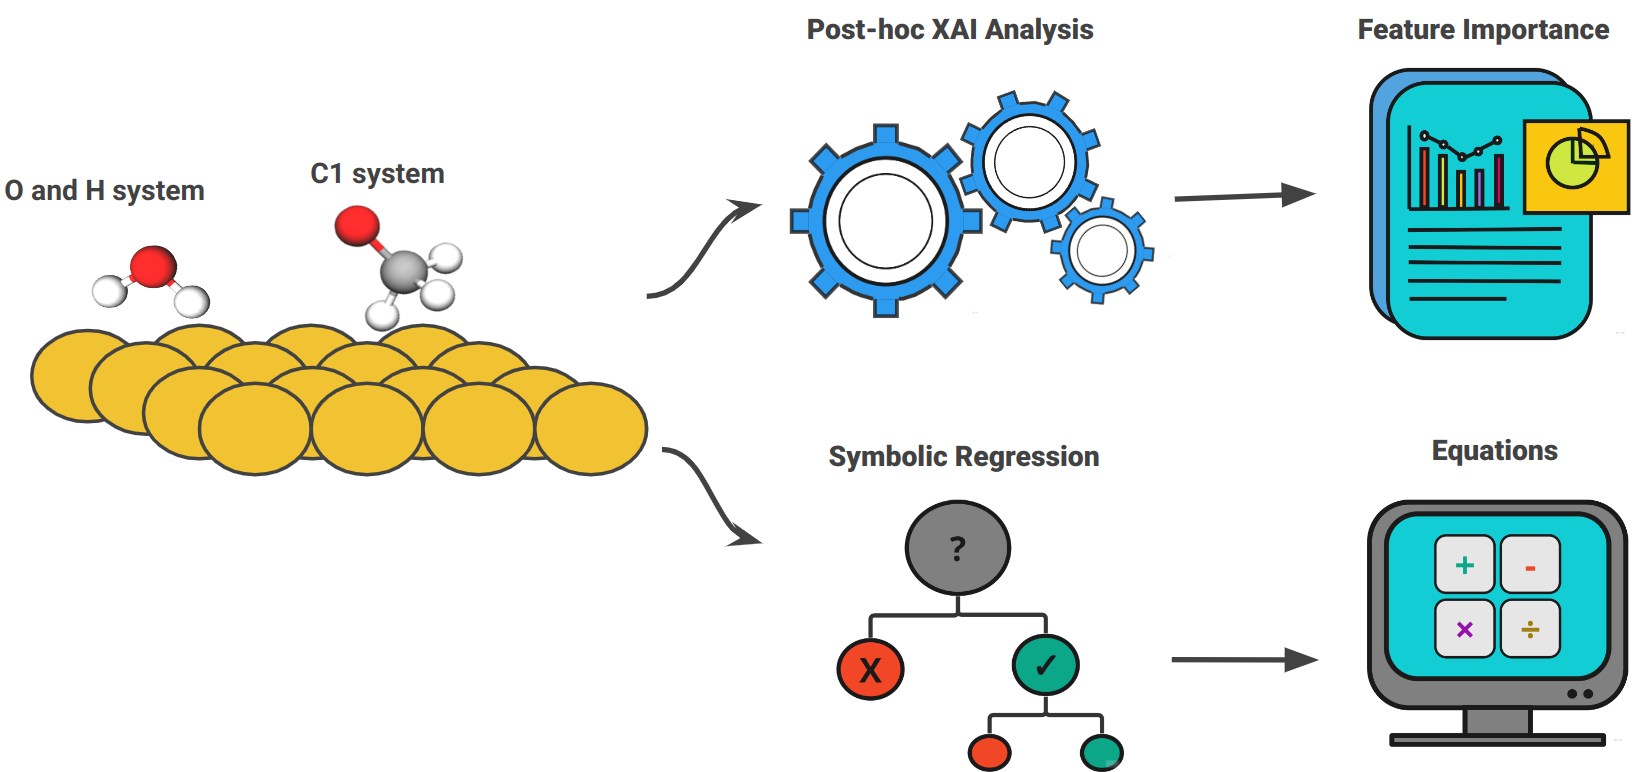
Our study leverages XAI to extract meaningful insights about the relationship between the characteristics of adsorbate-catalyst systems and the adsorption energy, which is the label value for ML models. We utilize XAI in two distinct ways as seen in Figure 1. Firstly, through shallow machine learning techniques alongside post-hoc XAI analysis. The post-hoc XAI analysis involves using the SHAP library 18. SHAP analysis provides the importance of individual features based on Shapley values. Secondly, we employ Symbolic Regression (SR) to derive mathematical equations to compute the adsorption energy based on the given input features. These equations are compared to equations obtained from traditional theory or experimental-based methods, highlighting their potential complementarity. The feature importance and correlation among features from SHAP analysis, along with the mathematical equations obtained from the Symbolic regression technique, provide better insights into the relation of adsorption energy with structural properties.
The adsorption energies and feature values like electronegativity, coordination number, and so forth, for both methods are extracted from the adsorbate-catalyst systems in the Open Catalyst 2020 (OC20) dataset. The details of the feature extraction are elaborated in the following section. Integrating ML techniques with XAI using large datasets like the OCP dataset lays the groundwork for effective catalyst design and opens promising avenues for future research.
2.2 Selection of Features
The features are carefully chosen from previous physics-based modeling research regarding adsorption energy computation. The features are categorized into two groups: adsorbate-specific and catalytic-specific features, as seen in Table 1. Each feature provides insights into electronic structure, bonding characteristics, and energetic properties of adsorption sites and catalysts. For instance, local electronegativity is determined as the geometric mean of the Pauling electronegativity of metal atoms within the first neighboring shell, offering insight into the local reactivity of catalyst surfaces19 as follows:
| (2) |
where is the electronegativity of atom j and N is the total number of atoms within the first neighboring shell including the adsorption site i. While, site type represented numerical classifications of different adsorption site configurations such as bridge sites, atop sites, hollow-HPC sites, etc.
| Category | Features | Notation | Reference | Description |
| Adsorbate | Adsorbate electronegativity | Ishioka et al.20 | Average electronegativity of all atoms in adsorbate molecule | |
| Number atoms in adsorbate | Amos et al.21 | Total number of atoms present in adsorbate molecule | ||
| Sum of adsorbate atomic numbers | Tran et al.22 | Sum of atomic numbers of all atoms in adsorbate molecule | ||
| Center atom coordination number | Calle-Vallejo et al.23 | Coordination number of the central atom in adsorbate molecule | ||
| Catalyst | Catalyst electronegativity | Ishioka et al.20 | Average electronegativity of the interacting surface atoms of catalyst | |
| Effective coordination number | Calle-Vallejo et al.23 | Average coordination number of the interacting surface atoms of catalyst | ||
| Local electronegativity | Li et al.19 | Geometric mean of the Pauling electronegativity of catalyst atoms within the first neighboring shell at the adsorption site | ||
| Site type | Roy et al. 24 | Type of site where the adsorbate interacts with catalyst surface | ||
| Density | Li et al.19 | Density of the overall catalyst structure | ||
| Band gap | Ma et al.25 | Band gap of catalyst structure | ||
| Space group | Jain et al.26 | Space group number of catalyst | ||
| Miller index | Chen et al.27 | Miller index of catalyst | ||
| Formation energy | Ha et al.28 | Formation energy of catalyst |
The features are primarily selected based on previous adsorption modeling studies, as substantiated by the references listed in Table 1, justifying their inclusion in ML-based adsorption energy modeling. Ishioka et al. demonstrated their machine learning models consisting of a Random Forest Classifier and Support Vector Classifier, utilized electronegativity, atomic number, and density as catalytic descriptors and could accurately predict ethylene/ethane selectivity (C2s) in the oxidative coupling of methane reaction 20. The cross-validation score reached a high value of 0.844 for both models, successfully predicting three catalysts with high C2s values, which were subsequently confirmed by experimental validation. Additionally, Roy et el. showed that their model can predict adsorption energies for various intermediates accurately, leading to the identification of seven active catalysts, including \ceCuCoNiZn-based tetrametallic, \ceCuNiZn-based trimetallic, and \ceCuCoZn-based trimetallic alloys. The model construction considered the impact of adsorption sites, encompassing tops, bridges, and hollows, along with their neighboring atoms 24. Calle-Vallejo et al. showcased how the utilization of coordination number, incorporating second-nearest neighbors, enabled the identification of three strategies for introducing cavity sites onto the platinum(111) surface. This enhancement proved crucial in improving its efficacy in the oxygen reduction reaction, vital for fuel cells 23.
Moreover, Ha et al. employed formation energy as a machine learning descriptor to facilitate the discovery of high-performance single-atom catalysts for electrochemical reactions such as the hydrogen evolution reaction and oxygen evolution/reduction reactions28. The values Area under the receiver operating characteristic (ROC) curve ranged from 0.79 to 0.91. Furthermore, Tran et al. illustrated how atomic number serves as a key descriptor in identifying 131 \ceCO2 reduction candidate surfaces across 54 alloys and 258 \ceH2 evolution surfaces across 102 alloys. The Root-Mean-Squared Error (RMSE), Mean Absolute Error (MAE), and median absolute deviation for predictions were 0.46, 0.29, and 0.17 eV, respectively 22. The incorporation of structural features, notably the number of atoms alongside elemental properties, contributed to the predictive accuracy in modeling band gaps, resulting in a model capable of predicting band gaps for 2254 light-harvesting materials with a RMSE of 0.23 eV and MAE of 0.14 eV 21. Overall, the careful selection of features, informed by both theoretical considerations and empirical evidence from the literature, provides a comprehensive framework for analyzing the complex interplay between catalyst structure, adsorption behavior, and catalytic activity.
2.3 Post-hoc XAI analysis
In our study, we employ SHAP analysis on shallow machine learning models to gain insights into feature importance, inter-feature correlations, and the influence of various features on predicting adsorption energy. The chosen machine learning models include Adaboost Regression with a base estimator as Random Forest Regressor, XGBoost Regression, Support Vector Regression (SVR), Kernel Ridge Regression (KRR), and Least Absolute Shrinkage and Selection Operator (LASSO) Regression. We chose the above ML models based on insights gleaned from comprehensive reviews and studies on machine learning applications for property prediction of materials to ensure the relevance of our analytical framework 29, 30.
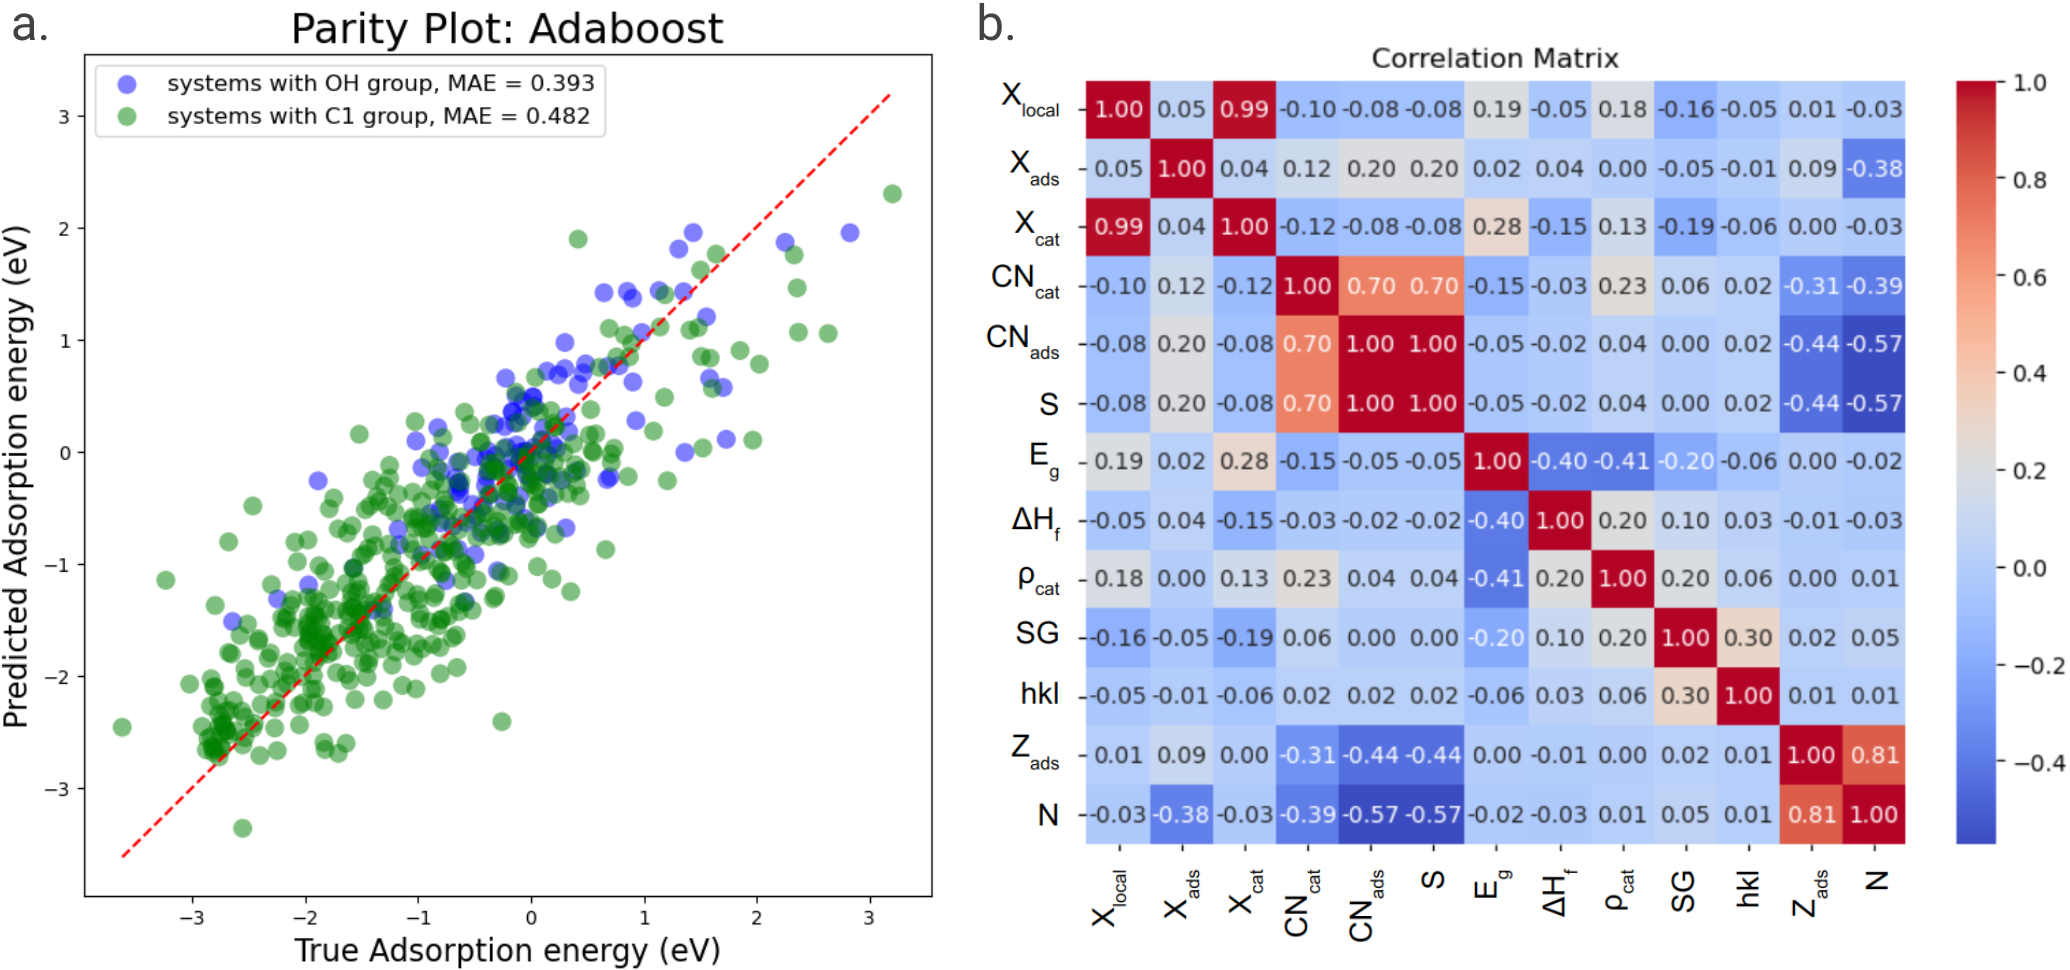
The dataset, comprising 2886 adsorbate-catalyst systems, is divided into an 80:20 ratio for training and testing purposes, with input features and the adsorption energy label provided to the machine learning models.Details about the dataset and data selection are elaborated in the Methods section. The performance outcomes of the models are presented in Table 2. The outcomes demonstrated by all models exhibit comparable performance with MAE values ranging from 0.446 to 0.617. Notably, Adaboost regression stands out as the best performer, demonstrating the lowest MAE value. Hence, it is used as the reference model for SHAP analysis during the post-hoc analysis.
| Model | MAE [eV] |
|---|---|
| Adaboost Regression | 0.446 ± 0.008 |
| XGBoost Regression | 0.461 ± 0.049 |
| Support Vector Regression | 0.477 ± 0.068 |
| Kernel Ridge Regression | 0.509 ± 0.089 |
| LASSO Regression | 0.617 ± 0.065 |
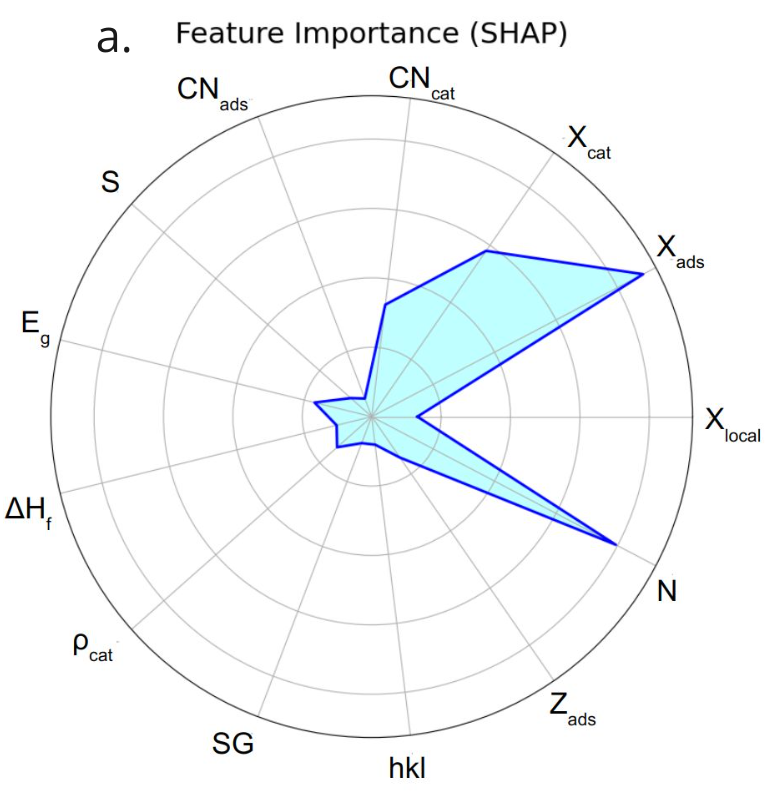
In the post-hoc analysis, the primary aspect of model explainability is carried out through SHAP analysis 31. The SHAP library has been widely used in various domains, including materials science, to interpret black box machine learning models 18. This technique computes Shapley values for all features, thereby elucidating each feature’s contribution to the prediction of adsorption energy by assessing the impact of each feature across different combinations of feature values. Further details on SHAP approach is provided in the Methods section. Visualizations such as the summary plot and radar chart, as depicted in Figure 3(a) and Figure 3(b), aid in determining feature importance, while the beeswarm plot in Figure 3(c), offers insights into individual feature value impacts on adsorption energy. Additionally, scatter plots are employed to reveal feature-feature correlations in Figure 4. Moreover, a correlation matrix is constructed in the process to further understand feature interactions, as shown in Figure 2(b).
From the radar chart and summary plot in Figure 3, we can deduce that the top 5 features with the most importance (higher Shapley values) are adsorbate electronegativity, number of adsorbate atoms, catalyst electronegativity, effective coordination number, and the sum of atomic numbers of adsorbate molecule, with Shapley values of 0.42, 0.39, 0.27, 0.15, and 0.08, respectively. Furthermore, it is evident that adsorbate properties exert a greater influence than catalyst properties. This observation aligns with findings from the language model-based predictive model32, which is specifically designed to predict the adsorption energies of adsorbate-catalyst systems. The attention score from the language model approach also shows that the model focuses more on adsorbate-related tokens. Likewise, our SHAP analysis demonstrates that the adsorption energy predictions rely more on the adsorbate-related features.

Previous studies have shown varying relationships between catalyst electronegativity and adsorption energy. Gao, Wang, et al. proposed an inverse relationship specifically for transition metal catalysts, where higher electronegativity leads to lower adsorption energy 33. Conversely, Trasatti’s research suggests a direct proportionality between metal catalyst electronegativity and adsorption energy 34.
Our analysis reveals a positive correlation between catalyst electronegativity and adsorption energy. This result is evident in the beeswarm plot analysis shown in Figure 3(c), where significant clustering of data points and feature values for catalyst electronegativity can be observed for positive Shapley values. While Gao and Wang found an inverse relationship in transition metals, our results suggest the opposite, aligning instead with Trasatti’s findings.
It is important to note that our dataset includes not only hydrogen but also oxygen and carbon-based adsorbates with metal catalysts, which may account for the differences observed in comparison to the work of Gao and Wang. This underscores the intricate nature of catalyst-adsorbate interactions, where various factors such as the composition of the dataset and the choice of adsorbates and catalysts play crucial roles in determining the observed outcomes. Additionally, a similar trend is observed for adsorbate electronegativity and local electronegativity, supporting our findings and emphasizing the complexity of catalyst-adsorbate interactions.
We note a denser clustering of data points with higher feature values corresponding to negative Shapley values for the number of adsorbate atoms in Figure 3(c). This trend suggests a diminished prediction of adsorption energy with an increased number of adsorbate atoms. This relationship may be attributed to the limited number of adsorbates used in the dataset, with a greater number of adsorbate atoms typically observed in the C1 category of adsorbates, which predominantly contributes to this relation.

The electronegativity of the catalyst bulk can effectively serve as a proxy for surface electronegativity in adsorption studies. This deduction is supported by Figure 4, which explores feature-feature correlations and reveals two notable findings. Firstly, Figure 4(a) demonstrates a positive correlation between mean catalyst electronegativity and local electronegativity. This relationship reflects the influence of catalyst atoms within the first neighboring shell at the adsorption site. It logically follows that the electronegativity of a subset of surface atoms contributes to the overall mean electronegativity of the catalyst lattice. Additionally, a similar correlation is observed in the correlation matrix depicted in Figure 2(b), where local electronegativity and catalyst electronegativity exhibit a high correlation coefficient. This suggests a strong association between surface and bulk electronegativity in our dataset. Such findings are crucial for practical applications since adsorption primarily occurs at the surface. Despite challenges in accurately characterizing surface properties in real-world scenarios, these results indicate that the electronegativity of the catalyst bulk can effectively represent surface electronegativity in adsorption studies, thus simplifying materials research efforts.
The increase in the number of adsorbate atoms correlates with a decrease in overall adsorbate electronegativity, as depicted in Figure 4(b). This trend is evident from the transition in color scheme from orange (indicating high adsorbate electronegativity) to purple (indicating lower adsorbate electronegativity). The decrease in electronegativity could be attributed to the formation of chemical bonds between the adsorbate atoms. As more adsorbate atoms come into proximity, bonding interactions occur, causing a redistribution of electron density within the adsorbate system and thereby lowering the overall electronegativity 35.
2.4 Correlation from Symbolic Regression
Symbolic regression is a machine learning-based regression method aimed at identifying an underlying mathematical expression that best describes the relationship between input features and output using genetic programming algorithms. In our study, we employed the PySR library, which is an open-source tool designed to find an interpretable symbolic expression that optimizes a specified objective 36.
Constraints are imposed during symbolic regression to mitigate overfitting. Binary operators are restricted to addition, multiplication, subtraction, and division. We adopt MAE as the loss function, aligning with our approach to evaluate the performance of shallow machine learning models used in SHAP analysis. Furthermore, we set the model to an optimized value of 5000 iterations to prevent overfitting and enable turbo mode, which utilizes the Loop Vectorization method to accelerate the search evaluation among a pool of equations.
Due to the diverse range of adsorbates and catalysts, establishing a universal trend between input features and adsorption energy can be challenging. To overcome this obstacle, We employed symbolic regression on a truncated dataset composed of adsorbate-catalyst systems containing hydrogen atoms as adsorbates and metal catalysts, mirroring the setup in Trasatti’s research 34. Using the equation proposed by Trasatti, we computed the MAE value to be 1.005 for our dataset.
We apply the PySR model, which consistently reveals a relationship resembling that found in Trasatti’s research: the square of the catalyst electronegativity is directly proportional to the adsorption energy. Even after multiple training iterations, this relationship persists. The relationship obtained indicates that the square of the catalyst electronegativity is directly proportional to the adsorption energy. Notably, the MAE values obtained from PySR are consistently lower than those from the reference equation, even at lower complexities, and decrease further as complexity increases. However, higher complexities introduce numerous additional terms to minimize the MAE value, thereby detracting from a clearer understanding of the inherent relationship between features and the output label. Table 3 displays the resulting PySR equations. It is noteworthy that we consistently obtained correlations akin to Trasatti’s research for smaller values of complexity, regardless of the attempts made. We obtain , where the coefficient k varies, but the relationship obtained remains consistent. This indicates the reliability and reproducibility of the observed correlation, offering valuable insights into the underlying physics governing adsorption phenomena.
| PySR Equations | MAE |
| Reference Equation | |
| 1.005 | |
3 Conclusion
Our study achieves explainability for ML models through post-hoc SHAP analysis and Symbolic Regression. This method highlights the importance and correlations of features. By merging ML techniques with XAI, we bridge the gap between data-driven methods and domain-specific knowledge, aiming to elucidate the intricate relationship between input structural features and adsorption energy. Key findings reveal that adsorbate properties exert a greater influence than catalyst properties, with a notable correlation between local electronegativity and catalyst electronegativity for our dataset. This correlation underscores the significant association between surface and bulk electronegativity, which is crucial for understanding surface phenomena in adsorption. Our findings suggest that the electronegativity of the catalyst bulk can serve as a proxy for surface electronegativity in practical applications. XAI techniques provide insights into the rationale behind ML model predictions by highlighting feature importance and the impact of feature values on adsorption energy values. This facilitates focused attention on relevant features for optimizing catalyst design. Overall, our study establishes a robust framework integrating ML techniques with XAI, leveraging extensive datasets like OC20 to enhance catalyst design through improved model explainability.
4 Methods
4.1 Dataset and Feature selection
The dataset utilized in this study is sourced from the Open Catalyst 2020 (OC20) dataset, which comprises 872,000 trajectories obtained from Density Functional Theory (DFT) calculation results, making it suitable for training machine learning (ML) models. From these trajectories, we extracted final frames to obtain relaxed structures of adsorbate-catalyst systems. The OC20 dataset encompasses catalyst systems featuring a diverse array of reactive elements, spanning nonmetals, alkali metals, alkaline earth metals, metalloids, transition metals, and post-transition metals. In contrast, the adsorbate systems consist of 82 molecules categorized into oxygen or hydrogen, C1 molecules, C2 molecules, and nitrogen-containing molecules.
For this study as seen in Table 4, we curated a dataset for post-hoc analysis by extracting a subset of the OC20 dataset, specifically focusing on systems containing oxygen (O), hydrogen (H), and C1 category adsorbates. This focus on small molecules minimizes the impact of interatomic interactions within the adsorbate molecules, simplifying comparisons with previous theory-based studies. Following this selection process, the dataset was narrowed down to a subset consisting of 2,886 systems. Additionally, a subset of 994 structures consisting hydrogen atom as adsorbate and metal catalysts was selected for Symbolic Regression analysis to derive mathematical equations representing the relationships between input features and adsorption energy.
| Dataset | Structures |
|---|---|
| OC20 Dataset | 460,328 |
| post-hoc XAI analysis | 2886 |
| Symbolic Regression | 994 |
To extract features from this structure data, ASE and Pymatgen packages are utilized, enabling the extraction of relevant information from the relaxed structures of each trajectory. The adsorption energy is calculated as the difference between potential energy and reference energy in the OC20 dataset. Ultimately, the structured data, comprising 13 input features and adsorption energy as the output label, is fed into the ML models.
4.2 SHAP approach
We use SHAP library to perform post-hoc XAI analysis. SHAP (SHapley Additive exPlanations) is a technique based on game theory that helps explain how machine learning models make decisions. It connects fair credit distribution with simple explanations by using classic Shapley values. Shapely values are calculated using the Shapley regression values, a concept from cooperative game theory. Shapley regression values are feature importances for linear models in the presence of multicollinearity. This method requires retraining the model on all feature subsets . Mathematically, the Shapley value for a feature is calculated as follows:
| (3) |
where is the total number of features, is a subset of features excluding feature , represents the input data with features in subset , and represents the input data with features in subset along with feature . is the model prediction using features in subset along with feature where as is the model prediction with feature withheld. The term represents the probability of including feature in a subset of size , which is adjusted by the number of permutations of subsets containing .
In essence, the Shapley value for a feature represents the average change in the model prediction when including that feature compared to all possible combinations of features, weighted by their probabilities. Positive Shapley values signify a positive correlation between features, indicating that as one feature increases, the other feature tends to increase as well. Conversely, negative Shapley values denote a negative correlation, implying that as one feature increases, the other tends to decrease. Our study visualizes Shapley values of all features in various charts such as summary plot, beeswarm plot and scatter plots for a comprehensive understanding of feature importances and correlations.
4.3 Symbolic Regression
We use PySR (Symbolic Regression using Python) open-source library to perform symbolic regression on the dataset 37. The core of PySR model’s algorithm involves iteratively evolving populations of mathematical expressions through tournament selection 38, mutation, crossover, simplification, and optimization 39, 40. These populations evolve independently, with occasional migration of individuals between them. The evolve-simplify-optimize loop refines the discovered equations by simplifying them to equivalent forms and optimizing constants. This iterative process continues until satisfactory equations representing the relationships between input features and output labels are discovered.
In this framework, the inputs consist of the dataset containing input features and corresponding output label i.e. adsorption energy, while the output of the PySR model is a set of mathematical equations that represent the relationships between the input features and output label. These equations serve as interpretable models that capture the underlying patterns and dependencies within the data.
The mathematical equations are produced through a process of evolutionary optimization, where populations of mathematical expressions are iteratively evolved and refined to best fit the dataset. This involves the generation of candidate expressions, their evaluation based on predefined fitness criteria (e.g., goodness of fit to the data), and the application of genetic operators (mutation, crossover) to create new expressions. Additionally, simplification techniques are employed to reduce the complexity of the expressions while preserving their accuracy, and optimization methods are applied to fine-tune the constants within the equations. Through this iterative process, the framework systematically explores the space of mathematical expressions to discover equations that effectively capture the relationships between the input features and output label.
References
- Thomas and Thomas 1997 Thomas, J.; Thomas, W. Heterogeneous catalysis. Kapitel 1997, 2, 67f
- ExxonMobil 2015 ExxonMobil Outlook for Energy: A View to 2040; 2015; pp 1–80
- Nørskov et al. 2002 Nørskov, J. K.; Bligaard, T.; Logadottir, A.; Bahn, S.; Hansen, L. B.; Bollinger, M.; Bengaard, H.; Hammer, B.; Sljivancanin, Z.; Mavrikakis, M.; others Universality in heterogeneous catalysis. Journal of catalysis 2002, 209, 275–278
- Bligaard and Nørskov 2008 Bligaard, T.; Nørskov, J. K. Chemical bonding at surfaces and interfaces; Elsevier, 2008; pp 255–321
- Cheng et al. 2008 Cheng, J.; Hu, P.; Ellis, P.; French, S.; Kelly, G.; Lok, C. M. Brønsted- Evans- Polanyi relation of multistep reactions and volcano curve in heterogeneous catalysis. The Journal of Physical Chemistry C 2008, 112, 1308–1311
- Bligaard et al. 2004 Bligaard, T.; Nørskov, J. K.; Dahl, S.; Matthiesen, J.; Christensen, C. H.; Sehested, J. The Brønsted–Evans–Polanyi relation and the volcano curve in heterogeneous catalysis. Journal of catalysis 2004, 224, 206–217
- Gerasev 2022 Gerasev, A. Relationship between the Brønsted Coefficients of the Steps of a Heterogeneous Catalytic Reaction. Kinetics and Catalysis 2022, 63, 645–652
- Chanussot et al. 2021 Chanussot, L.; Das, A.; Goyal, S.; Lavril, T.; Shuaibi, M.; Riviere, M.; Tran, K.; Heras-Domingo, J.; Ho, C.; Hu, W.; others Open catalyst 2020 (OC20) dataset and community challenges. Acs Catalysis 2021, 11, 6059–6072
- Ghanekar et al. 2022 Ghanekar, P. G.; Deshpande, S.; Greeley, J. Adsorbate chemical environment-based machine learning framework for heterogeneous catalysis. Nature Communications 2022, 13, 5788
- Liao and Smidt 2022 Liao, Y.-L.; Smidt, T. Equiformer: Equivariant graph attention transformer for 3d atomistic graphs. arXiv preprint arXiv:2206.11990 2022,
- Gasteiger et al. 2021 Gasteiger, J.; Becker, F.; Günnemann, S. Gemnet: Universal directional graph neural networks for molecules. Advances in Neural Information Processing Systems 2021, 34, 6790–6802
- Xie and Grossman 2018 Xie, T.; Grossman, J. C. Crystal graph convolutional neural networks for an accurate and interpretable prediction of material properties. Physical review letters 2018, 120, 145301
- Schütt et al. 2017 Schütt, K.; Kindermans, P.-J.; Sauceda Felix, H. E.; Chmiela, S.; Tkatchenko, A.; Müller, K.-R. Schnet: A continuous-filter convolutional neural network for modeling quantum interactions. Advances in neural information processing systems 2017, 30
- Gasteiger et al. 2020 Gasteiger, J.; Groß, J.; Günnemann, S. Directional message passing for molecular graphs. arXiv preprint arXiv:2003.03123 2020,
- Ock et al. 2024 Ock, J.; Magar, R.; Antony, A.; Farimani, A. B. Multimodal Language and Graph Learning of Adsorption Configuration in Catalysis. 2024; \urlhttps://arxiv.org/abs/2402.17177
- Ock et al. 2023 Ock, J.; Tian, T.; Kitchin, J.; Ulissi, Z. Beyond independent error assumptions in large GNN atomistic models. The Journal of Chemical Physics 2023, 158, 214702
- Esterhuizen et al. 2022 Esterhuizen, J. A.; Goldsmith, B. R.; Linic, S. Interpretable machine learning for knowledge generation in heterogeneous catalysis. Nature catalysis 2022, 5, 175–184
- Lundberg and Lee 2017 Lundberg, S. M.; Lee, S.-I. A unified approach to interpreting model predictions. Advances in neural information processing systems 2017, 30
- Li et al. 2017 Li, Z.; Ma, X.; Xin, H. Feature engineering of machine-learning chemisorption models for catalyst design. Catalysis today 2017, 280, 232–238
- Ishioka et al. 2022 Ishioka, S.; Fujiwara, A.; Nakanowatari, S.; Takahashi, L.; Taniike, T.; Takahashi, K. Designing catalyst descriptors for machine learning in oxidative coupling of methane. ACS Catalysis 2022, 12, 11541–11546
- Amos and Kobayashi 2019 Amos, R. D.; Kobayashi, R. Feature Engineering for Materials Chemistry—Does Size Matter? Journal of Chemical Information and Modeling 2019, 59, 1873–1881
- Tran and Ulissi 2018 Tran, K.; Ulissi, Z. W. Active learning across intermetallics to guide discovery of electrocatalysts for CO2 reduction and H2 evolution. Nature Catalysis 2018, 1, 696–703
- Calle-Vallejo et al. 2015 Calle-Vallejo, F.; Tymoczko, J.; Colic, V.; Vu, Q. H.; Pohl, M. D.; Morgenstern, K.; Loffreda, D.; Sautet, P.; Schuhmann, W.; Bandarenka, A. S. Finding optimal surface sites on heterogeneous catalysts by counting nearest neighbors. Science 2015, 350, 185–189
- Roy et al. 2021 Roy, D.; Mandal, S. C.; Pathak, B. Machine learning-driven high-throughput screening of alloy-based catalysts for selective CO2 hydrogenation to methanol. ACS Applied Materials & Interfaces 2021, 13, 56151–56163
- Ma and Liu 2020 Ma, S.; Liu, Z.-P. Machine learning for atomic simulation and activity prediction in heterogeneous catalysis: current status and future. ACS Catalysis 2020, 10, 13213–13226
- Jain and Bligaard 2018 Jain, A.; Bligaard, T. Atomic-position independent descriptor for machine learning of material properties. Physical Review B 2018, 98, 214112
- Chen et al. 2023 Chen, D.; Shang, C.; Liu, Z.-P. Machine-learning atomic simulation for heterogeneous catalysis. npj Computational Materials 2023, 9, 2
- Ha et al. 2021 Ha, M.; Kim, D. Y.; Umer, M.; Gladkikh, V.; Myung, C. W.; Kim, K. S. Tuning metal single atoms embedded in N x C y moieties toward high-performance electrocatalysis. Energy & Environmental Science 2021, 14, 3455–3468
- Butler et al. 2018 Butler, K. T.; Davies, D. W.; Cartwright, H.; Isayev, O.; Walsh, A. Machine learning for molecular and materials science. Nature 2018, 559, 547–555
- Chen et al. 2020 Chen, C.; Zuo, Y.; Ye, W.; Li, X.; Deng, Z.; Ong, S. P. A critical review of machine learning of energy materials. Advanced Energy Materials 2020, 10, 1903242
- Lundberg and Lee 2017 Lundberg, S. M.; Lee, S.-I. In Advances in Neural Information Processing Systems 30; Guyon, I., Luxburg, U. V., Bengio, S., Wallach, H., Fergus, R., Vishwanathan, S., Garnett, R., Eds.; Curran Associates, Inc., 2017; pp 4765–4774
- Ock et al. 2023 Ock, J.; Guntuboina, C.; Barati Farimani, A. Catalyst Energy Prediction with CatBERTa: Unveiling Feature Exploration Strategies through Large Language Models. ACS Catalysis 2023, 13, 16032–16044
- Gao et al. 2020 Gao, W.; Chen, Y.; Li, B.; Liu, S.-P.; Liu, X.; Jiang, Q. Determining the adsorption energies of small molecules with the intrinsic properties of adsorbates and substrates. Nature communications 2020, 11, 1196
- Trasatti 1972 Trasatti, S. Electronegativity, work function, and heat of adsorption of hydrogen on metals. Journal of the Chemical Society, Faraday Transactions 1: Physical Chemistry in Condensed Phases 1972, 68, 229–236
- Cioslowski and Stefanov 1993 Cioslowski, J.; Stefanov, B. B. Electron flow and electronegativity equalization in the process of bond formation. The Journal of chemical physics 1993, 99, 5151–5162
- Cranmer 2023 Cranmer, M. Interpretable machine learning for science with PySR and SymbolicRegression. jl. arXiv preprint arXiv:2305.01582 2023,
- 37 Cranmer, M. Interpretable Machine Learning for Science with PySR and SymbolicRegression. jl,” 2023. arXiv preprint arXiv:2305.01582
- Goldberg and Deb 1991 Goldberg, D. E.; Deb, K. Foundations of genetic algorithms; Elsevier, 1991; Vol. 1; pp 69–93
- Broyden 1970 Broyden, C. G. The convergence of a class of double-rank minimization algorithms 1. general considerations. IMA Journal of Applied Mathematics 1970, 6, 76–90
- Mogensen and Riseth 2018 Mogensen, P.; Riseth, A. Optim: A mathematical optimization package for Julia. Journal of Open Source Software 2018, 3