FUSU: A Multi-temporal-source Land Use Change Segmentation Dataset for Fine-grained Urban Semantic Understanding
Abstract
Fine urban change segmentation using multi-temporal remote sensing images is essential for understanding human-environment interactions. Despite advances in remote sensing data for urban monitoring, coarse-grained classification systems and the lack of continuous temporal observations hinder the application of deep learning to urban change analysis. To address this, we introduce FUSU, a multi-source, multi-temporal change segmentation dataset for fine-grained urban semantic understanding. FUSU features the most detailed land use classification system to date, with 17 classes and 30 billion pixels of annotations. It includes bi-temporal high-resolution satellite images with 20-50 cm ground sample distance and monthly optical and radar satellite time series, covering 847 km² across five urban areas in China. The fine-grained pixel-wise annotations and high spatial-temporal resolution data provide a robust foundation for deep learning models to understand urbanization and land use changes. To fully leverage FUSU, we propose a unified time-series architecture for both change detection and segmentation and benchmark FUSU on various methods for several tasks. Dataset and code will be available at: https://github.com/yuanshuai0914/FUSU.
1 Introduction
Urban areas, housing 57% of the world’s population on just 3% of global land, are dynamic hubs of human activity [1]. The scale and rapid pace of current urbanization, encompassing both internal dynamics and population growth, position urban areas as a crucial catalyst of global climate change and vice versa [2]. Therefore, proper observation and monitoring of urban changes are crucial for modeling human-nature interactions.
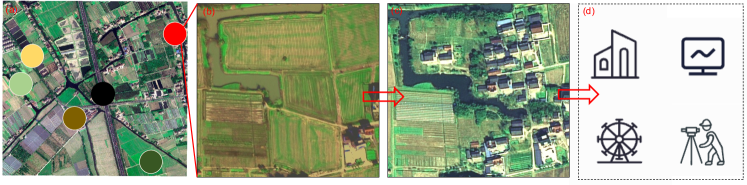
In the era of data-driven methods, satellite remote sensing provides abundant data for Earth observation and deep learning models. However, urban areas have unique features requiring stringent conditions for high-quality data. First, as Fig. 1(a) shows, each circle represents a semantic, and this concentrated semantic information is driven by human activities (land use) rather than natural characteristics (land cover) [3]. This necessitates high-resolution images and fine-grained land use annotations over land cover segmentation datasets. Second, as Fig. 1(b)(c) show, urban areas undergo rapid temporal changes, demanding high-frequency observations to capture these dynamics accurately [4]. Third, Fig. 1(d) highlights the diversity of human activities, including work, recreation, and economy, requiring multi-source data for effective monitoring.
Although numerous change segmentation datasets (e.g., SECOND [5], Hi-UCD [6], DynamicEarthNet [7]) have been introduced to advance urban monitoring, their coarse-grained land cover classification systems still limit the ability of fine urban semantic understanding. Besides, due to the difficulties of acquiring multi-temporal high-resolution images (e.g., cloud obscuration, accessibility), most change segmentation datasets only comprise bi-temporal images, which cannot match the pace of urban development, leading to challenges in timely planning and management. A high spatial-temporal resolution change segmentation dataset with a fine land use classification system is required.
In this paper, we introduce FUSU, a multi-temporal, multi-source change segmentation dataset designed for fine-grained urban semantic understanding. FUSU provides the finest pixel-wise change segmentation annotations to date, covering 17 land use classes and over 30 billion pixels. It includes bi-temporal high-resolution satellite images (20-50 cm resolution) and aligns optical and radar satellite data (Sentinel-2, Sentinel-1) with monthly revisits, enriching temporal and multi-sensor information. Spanning 847 across five major urban districts in northern and southern China, FUSU’s geographical diversity ensures domain shifts within the dataset. To leverage this spatial-spectral-temporal-resolution diversity, we propose FUSU-Net, a unified time-series architecture, as a baseline for change detection and segmentation tasks. FUSU and FUSU-Net aim to advance dataset and algorithm development for improved urban monitoring and understanding. Our contributions include:
-
•
We introduce FUSU, a multi-temporal-source change segmentation dataset with a fine land use classification system of 17 classes and over 30 billion annotation pixels.
-
•
We propose a unified time-series baseline architecture that conducts end-to-end change detection and segmentation tasks using multi-source observation data. We showcase how the constructed time-series data can be leveraged for better urban monitoring.
-
•
We benchmark FUSU on kinds of methods in several downstream tasks to provide a comprehensive insight.
2 Related Works
2.1 Urban Change Segmentation Data
Urban observation is a critical aspect of Earth observation, garnering significant attention in recent years. Various datasets have been developed to support specific tasks like change detection and segmentation (see Table 2). ISPRS Potsdam111https://www.isprs.org/education/benchmarks/UrbanSemLab/2d-sem-label-potsdam.aspx provides high-resolution images for urban parsing, but it covers small areas and has a limited scale. SpaceNet [8], EuroSAT [9], and GID [10] cover larger areas but suffer from incomplete land cover classification, lower resolution, and single snapshots. LEVIR-CD [11] and WHU [12] focus on bi-temporal building change detection, but lack comprehensive semantics. SECOND [5], Hi-UCD [6], and WUSU [13] introduce multi-class semantic change detection. However, WUSU and Hi-UCD cover limited regions, and SECOND’s coarse annotations and long intervals reduce continual observation capability. LoveDA [14], FLAIR [15], and DynamicEarthNet [7] are most similar to FUSU. LoveDA includes patches from various Chinese cities, FLAIR uses aerial and Sentinel-2 images for near-daily observations, and DynamicEarthNet provides daily observations and monthly dense annotations for 75 regions. Yet, these datasets offer either single-temporal or coarse-grained annotations with limited pixels.
In summary, existing datasets usually present a trade-off among resolution, coverage, snapshot time and annotation. On the contrary, FUSU aims for the finest urban semantic understanding, providing the fine-grained land use classification system (17 classes), large-scale annotation pixels (30 billion), high-resolution images (0.2-0.5 m), large coverage (847 ), temporal information (bi-temporal high-resolution images and monthly Sentinel data), and support multiple downstream remote sensing tasks.
| Dataset | Source | Images (patches) | Size | Area () | Resolution () | Class | Temporal (image) | Temporal (ann) | Ann pixel () | |
| Segmentation | Potsdam222https://www.isprs.org/education/benchmarks/UrbanSemLab/2d-sem-label-potsdam.aspx | Aerial | 38 | 6000 | 0.05 | 0.05 | 6 | 1 | 1 | 0.8 |
| SpanceNet[8] | Maxar | 60,000 | 650 | 5,500 | 0.3-1.24 | 2 | 1 | 1 | 1.3 | |
| EuroSAT[9] | Sentinel-2 | 27,000 | 64 | 11,059 | 10 | 10 | 1 | 1 | 0.1 | |
| GID[10] | Gaofen-2 | 150 | 6800-7200 | 50,000 | 1 | 5/15 | 1 | 1 | 7.3 | |
| LoveDA[14] | Google Earth | 5987 | 1024 | 536 | 0.3 | 6 | 1 | 1 | 6.3 | |
| FLAIR[15] | Aerial/Sentinel-2 | 77,762 | 512/40 | 817 | 0.2/10 | 18 | 4 days | 1 | 20.3 | |
| Change Detection | LEVIR-CD[11] | Google Earth | 637 | 1024 | 167 | 0.5 | 1 | 2 | 1 | 0.005 |
| WHU[12] | Aerial | 8,189 | 512 | 192 | 0.3 | 1 | 2 | 1 | 0.4 | |
| SECOND[5] | Satellite | 4,662 | 512 | 1200 | 0.5-1 | 6 | 2 | 2 | 0.9 | |
| Hi-UCD[6] | Aerial | 1,293 | 1024 | 30 | 0.1 | 9 | 3 | 3 | 2.7 | |
| WUSU[13] | Gaofen-2 | 2 | 5500-7025 | 80 | 1 | 11 | 3 | 3 | 1.5 | |
| DynamicEarthNet[7] | PlanetFusion | 54,750 | 1024 | 16,986 | 3 | 7 | daily | monthly | 1.9 | |
| FUSU | Google Earth/Sentinel-1/2 | 62,752 | 512/128 | 847 | 0.2-0.5/10 | 17 | monthly | 2 | 32.2 | |
2.2 Remote sensing tasks
Here is a refined and more concise version of the paragraph:
Change Detection identifies surface differences by processing images of the same area captured at different times [16]. It includes binary change detection [11, 12], which detects changes in a single class (changed or unchanged), and semantic change detection [5, 7], which provides detailed land semantics. Most datasets feature only bi-temporal observations due to the difficulty of obtaining high-resolution multi-temporal images, leading to long intervals that hinder timely monitoring. Furthermore, the lack of fine-grained multi-temporal annotations limits semantic change detection algorithm development.
These challenges highlight the need for richer temporal data and fine-grained land use classifications, as well as methods capable of handling multi-temporal information. Current datasets’ coarse-grained classifications do not accurately reflect urban conditions, and integrating multi-temporal data from other accessible sensors to enhance change detection has been underexplored. To address these issues, we propose FUSU, which includes bi-temporal fine-grained annotations and multi-temporal observations from high-resolution and Sentinel images. We also design a new unified architecture FUSU-Net to leverage time-series information for semantic change detection and segmentation.
Semantic segmentation has been widely applied in remote sensing for tasks such as land cover mapping [17], building/road extraction [18, 19], and cropland cover mapping [20]. Encoder-decoder architectures are well-suited to the diverse nature of remote sensing images [7]. Most studies focus on segmenting objects from static images [21, 14], while some have used time-series images to improve performance [20, 22]. Our FUSU-Net integrates time-series information into the bi-temporal segmentation task. We believe the unique time-series structure of FUSU will inspire the development of more advanced time-series segmentation algorithms in remote sensing.
3 FUSU Dataset
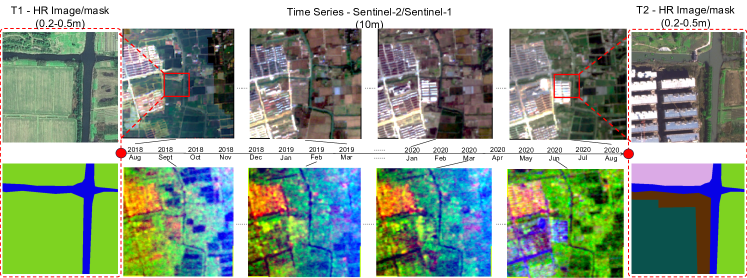
We introduce FUSU, a multi-temporal, multi-source change segmentation dataset for fine-grained urban semantic understanding. FUSU consists of 62,752 image patches, each containing 27 images from three sources with different resolutions and snapshot times, and includes two annotations as shown in Figure 2. FUSU has four key features:
Fine-grained. FUSU features the finest land use classification system in change segmentation datasets, with bi-temporal dense annotations. It includes 17 classes—artificial-constructed, agricultural, and natural—that detail urban functional zoning and enhance understanding of urban structural development.
Multi-temporal. FUSU offers time-series observations with monthly revisits. Along with bi-temporal high-resolution images and fine-grained annotations, it supports high-frequency urban monitoring, enabling methods to leverage long-range temporal context for better inferences.
Multi-source. FUSU combines data from three satellite sensors (Google Earth, Sentinel-2, Sentinel-1) with different temporal, resolution, and band compositions. Each image patch unifies spatial, temporal, and spectral contexts, providing richer information than single-source data.
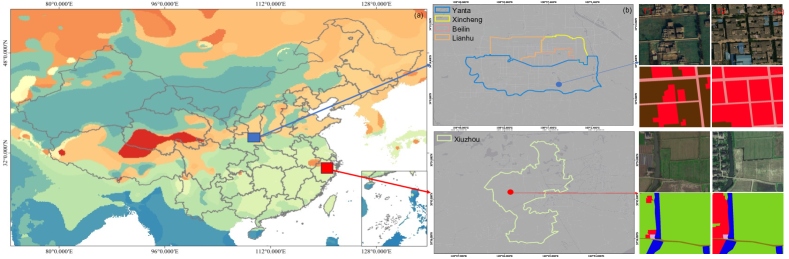
Domain shifts. FUSU covers five urban areas in northern and southern China, each with diverse geographical features and urban landscapes. Variability in climate types and class ratios across these regions contribute to representation gaps and pronounced domain shifts in the feature data.
3.1 Construction of FUSU
Acquisitions. FUSU uses three data sources with different resolutions, geographical details, and acquisition times. Google Earth images are pixels with a 0.3 m resolution and RGB bands. Sentinel-1 and Sentinel-2 images are sourced from Google Earth Engine (GEE). Sentinel-1 images are preprocessed by GEE (noise removal, radiometric calibration, orthorectification). Sentinel-2 images undergo cloud removal, atmospheric correction, radiometric calibration, and orthorectification, then are concatenated with Sentinel-1 data. Each Sentinel image is pixels with a 10 m resolution and 14 bands. Google Earth and Sentinel patches are not strictly aligned; Google Earth patches cover only the central area of corresponding Sentinel patches (Fig. 2). This approach preserves semantic detail and captures broader context, aiding spatial dynamics understanding. More details are in the Supplementary Materials.
Distribution. FUSU covers 847 across five urban districts in China: Xiuzhou in Jiaxing, and Yanta, Beilin, Xincheng, and Lianhu in Xi’an. The differing climates of Jiaxing and Xi’an are illustrated in Fig. 3(a). FUSU provides continuous monthly observations from August 2018 to August 2020. Google Earth images were captured in August 2018 and August 2020, while Sentinel-1 and Sentinel-2 images were collected monthly between these dates.
Annotations. Bi-temporal Google Earth images are manually annotated pixel-wise by two teams of geography experts. To ensure geographical continuity, the annotation is conducted on the full-scale images before image cropping. The annotation classification classes refer to the Chinese Land Use Classification Criteria (GB/T21010-2017) Level-1 classification system. Table 2 shows the classes. More details about the classification system definition can be found in Supplementary Materials.
| Color | Class | Label Value | Color | Class | Label Value | Color | Class | Label Value |
| Traffic land | 1 | Industrial land | 7 | Special land | 13 | |||
| Inland water | 2 | Park | 8 | Forest | 14 | |||
| Residential land | 3 | Greenbelt | 9 | Storage | 15 | |||
| Cropland | 4 | Public management | 10 | wetland | 16 | |||
| Agriculture construction | 5 | Commercial land | 11 | Grass | 17 | |||
| Blank | 6 | Public construction | 12 | Background | 0 |
3.2 Statistic
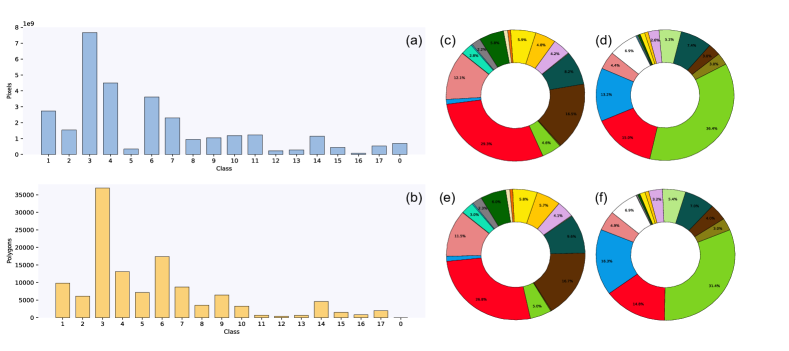
FUSU includes bi-temporal pixel-level annotations covering 17 land use classes. Fig. 4(a) and (b) illustrate the distribution of pixels and polygons for each class at a single time snapshot. Residential land dominates both in terms of polygons and pixels. Some classes, like agriculture construction land, exhibit asymmetrical distributions, indicating widespread but fragmented occurrences. The highly unbalanced numbers, common in remote sensing, show a ratio exceeding 90 between the most and least frequent types. Fig. 4(c)-(f) display the class ratios in Xi’an and Jiaxing at two time snapshots, revealing varying distributions between the cities. Jiaxing is characterized by significant cropland and residential areas, while Xi’an has more commercial land. Trends over time show declining residential land in Xi’an and cropland in Jiaxing, with increases in forest and inland water respectively. These class imbalances and city differences pose challenges for urban monitoring using FUSU.
4 FUSU-Net
To fully utilize FUSU, we propose a unified time-series baseline architecture named FUSU-Net that conducts end-to-end change detection and segmentation tasks. Fig. 5 shows the architecture.
4.1 Preliminary and Overview
Given T1 image , T2 image , the corresponding groundtruth labels , , and the time-series temporal images , we have two ultimate goals: build a segmentation function that generates segmentation map , and build a change detection function that find binary changes between two input images . These two goals mean we need to optimize the loss between predicted values and labels:
| (1) |
where is the optimized learned parameters generated by the optimized and , and represents the learned parameters, and is the binary change groundtruth label, which can be generated by , :
| (2) |
where is the pixel value. Assuming the additional temporal and spectral information in time-series images can guide the high-resolution segmentation and change detection, we further extract the high-level temporal and spectral information and use for supervision. Thus the optimization body can be divided into:
| (3) |
where is the loss of segmentation of T1 image, T2 image, and time-series images, respectively.
4.2 Overall architecture
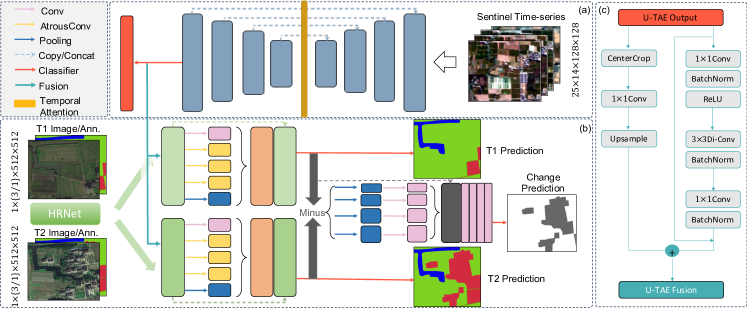
As Fig. 5 shows, the overall architecture of FUSU-Net includes two branches: (a) processes Sentinel time-series images and outputs time-series features; (b) processes bi-temporal high-resolution images and annotations and outputs both bi-temporal segmentation results and change detection results.
As Fig. 5(a) shows, to process the Sentinel time-series images, we use U-TAE [20] with temporal attention to effectively capture temporal information in feature maps at various resolutions. The input shape is , and the output shape is . Fig. 5(b) shows that we first use a HR-Net pre-trained on ImageNet as the backbone to extract bi-temporal features. Then we input each feature into separated ASPP [23] segmentation heads to get the segmentation results. We then conduct a minus operation between bi-temporal segmentation features, and after a Spatial Pyramid Pooling head [24], we can get the binary change detection result.
Note that Fig. 5 shows the fusion module. Time-series features fuse with bi-temporal features via two transformations: first, the time-series feature is centercropped to strictly geographically align with the bi-temporal features. Then after a convolution and upsampling layer, the centercropped feature has the same shape with bi-temporal features. Second, we reserve the large spatial information of the time-series feature and after a bottle-neck structure, we map it to the same shape of the bi-temporal features. An add operation is conducted for the feature fusion.
4.3 Loss Functions
As discussed in Sec. 4.1, we use 4 loss functions to train FUSU-Net: three segmentation loss , and a change loss . The segmentation loss functions are the multi-class cross-entropy loss. Specifically, for time-series supervision, we first centercrop the output for geographical alignment, then upsample it to the same size of groundtruth label . The change loss is the BCE loss to supervise the binary changes. To balance segmentation and change detection, we set the weight of change loss as 2, and the weights of segmentation losses as 1. More details about supervision and implementation can be found in Supplementary Materials.
5 Experiments
We utilize our dataset for semantic segmentation in Sec. 5.1 and change detection in Sec. 5.2 with various experiments on state-of-the-art baseline methods and FUSU-Net.
5.1 Semantic Segmentation
Land use segmentation is crucial for urban monitoring. We focus on single-temporal images and labels for this semantic segmentation task. We compare seven baseline segmentation methods: FCN [25], PSPNet [24], Fast-SCNN [26], Deeplab-v3 [23], HRNet [27], K-net [28], and U-TAE [20]. Evaluation is based on intersection over union (IoU) per class and averaged IoU (mIoU) across all 17 land use classes, following established protocols. Additionally, we investigate feature disparities between Jiaxing and Xi’an through two experiments: intra-dataset (whole, Xi’an, Jiaxing) and inter-dataset (training on one, testing on the other). Implementation details are provided in the Supplementary Materials.
| Method | IoU per class (%) | mIoU | ||||||||||||||||
| 1 | 2 | 3 | 4 | 5 | 6 | 7 | 8 | 9 | 10 | 11 | 12 | 13 | 14 | 15 | 16 | 17 | ||
| FCN [25] | 70.83 | 76.49 | 74.67 | 84.14 | 30.84 | 52.16 | 55.39 | 33.32 | 52.7 | 50.24 | 28.98 | 0.09 | 30.62 | 57.42 | 23.61 | 13.04 | 17.79 | 44.25 |
| PSPNet [24] | 65.37 | 79.15 | 71.44 | 82.354 | 23.5 | 49.97 | 52.82 | 40.44 | 44.9 | 44.5 | 31.39 | 30.08 | 24.04 | 48.69 | 41.64 | 24.5 | 32.58 | 46.32 |
| Fast-SCNN [26] | 54.42 | 72.28 | 66.25 | 78.97 | 2.8 | 42.4 | 47.84 | 35.33 | 30.24 | 30.24 | 31.94 | 12.03 | 0 | 0 | 44.66 | 31.75 | 23.39 | 35.56 |
| Deeplab-v3 [23] | 66.17 | 77.31 | 71.2 | 82.1 | 26.3 | 49.61 | 53.96 | 37.35 | 45.85 | 47.61 | 33.21 | 35.06 | 30.68 | 54.14 | 34.94 | 34.15 | 32.07 | 47.74 |
| HRNet [27] | 67.6 | 80.39 | 73.24 | 83.02 | 22.94 | 49.0 | 54.05 | 40.1 | 46.43 | 49.12 | 31.66 | 26.68 | 15.21 | 52.38 | 42.84 | 30.16 | 32.09 | 46.88 |
| K-net [28] | 59.97 | 72.68 | 66.87 | 79.46 | 18.45 | 44.19 | 48.07 | 32.05 | 35.07 | 35.64 | 19.9 | 18.44 | 18.69 | 49.61 | 29.2 | 23.88 | 22.51 | 39.69 |
| U-TAE [20] | 59.57 | 64.18 | 65.76 | 77.92 | 24.87 | 40.13 | 46.75 | 29.89 | 41.72 | 30.57 | 26.13 | 6.85 | 25.96 | 30.57 | 49.83 | 15.08 | 8.12 | 37.63 |
| FUSU-Net | 74.79 | 78.95 | 76.13 | 85.35 | 34.81 | 50.54 | 51.47 | 41.50 | 49.64 | 45.78 | 36.69 | 28.85 | 28.98 | 60.21 | 44.41 | 30.07 | 33.69 | 50.10 |
| Method | mIoU | ||||||||||
|
|
|
|
||||||||
| FCN | 50.21 | 45.53 | 9.07 | 9.36 | |||||||
| PSPNet | 46.52 | 43.35 | 8.55 | 9.72 | |||||||
| Fast SCNN | 32.97 | 32.76 | 7.83 | 8.51 | |||||||
| HRNet | 46.78 | 45.01 | 10.07 | 9.73 | |||||||
| Ket | 38.17 | 37.41 | 9.31 | 10.59 | |||||||
| U-TAE | 38.96 | 36.57 | 5.13 | 6.29 | |||||||
| FUSU-Net | 53.63 | 49.91 | 11.65 | 10.46 | |||||||
Overall results. Table 3 shows the segmentation results. We observe that FUSU-Net achieves the best results regarding mIoU. Specifically, FUSU-Net performs better than other methods not only on some comparatively simple classes (i.e., road, residential land) but also has continuous promising results on difficult classes where other methods have poor performance (i.e., commercial land, special land). Note that FUSU-Net is backboned by HRNet and the segmentation head is PSPNet with FCN, and the results directly show the benefits of adding features of time-series Sentinel images. When compared with U-TAE, we can see that high-resolution images can also improve performance by providing more clear observation details.
Cross-dataset results. Table 4 shows the segmentation results with different training and testing datasets. There is a dramatic drop in mIoU on cross-dataset training and testing compared with training and testing on the same datasets. More detailed results are shown in Supplementary Materials and we can see the performance in some classes has dramatic changes. We can tell the huge feature differences between Jiaxing and Xi’an from these results.
5.2 Change Detection
We then compare the performance of change detection baselines on FUSU. Here, we complete the binary change detection experiment and semantic change detection experiment. For binary change detection, we introduce 6 methods: DMINet [29], ICIFNet [30], ChangeFormer [31], A2Net [32], BIT [33], USSFC-Net [34]. We evaluate the results by IoU on changed pixels. For semantic change detection, we introduce 6 methods: BIT [33], ChangeFormer [31], ICIFNet [30], DMINet [29], SSCD-l [35], Bi-SRNet [35]. We evaluate the change detection results by IoU per class and mIoU over all 17 land use classes. Implementation details can be found in Supplementary Materials.
| IoU per class (%) | ||||||||||||||||||
| Method | 1 | 2 | 3 | 4 | 5 | 6 | 7 | 8 | 9 | 10 | 11 | 12 | 13 | 14 | 15 | 16 | 17 | mIoU |
| BIT [33] | - | - | - | - | - | - | - | - | - | - | - | - | - | - | - | - | - | 47.91 |
| ChangeFormer [31] | - | - | - | - | - | - | - | - | - | - | - | - | - | - | - | - | - | 59.64 |
| ICIFNet [30] | - | - | - | - | - | - | - | - | - | - | - | - | - | - | - | - | - | 64.74 |
| DMINet [29] | - | - | - | - | - | - | - | - | - | - | - | - | - | - | - | - | - | 72.59 |
| A2Net [32] | - | - | - | - | - | - | - | - | - | - | - | - | - | - | - | - | - | 69.22 |
| USSFC-Net [34] | - | - | - | - | - | - | - | - | - | - | - | - | - | - | - | - | - | 62.85 |
| FUSU-Net | - | - | - | - | - | - | - | - | - | - | - | - | - | - | - | - | - | 79.80 |
| BIT [33] | 35.54 | 48.90 | 46.89 | 42.27 | 4.01 | 46.70 | 59.92 | 23.6 | 35.41 | 25.82 | 17.88 | 0 | 3.95 | 54.23 | 22.62 | 12.20 | 46.15 | 30.95 |
| ChangeFormer [31] | 39.31 | 57.87 | 57.13 | 39.42 | 9.20 | 25.58 | 60.11 | 31.33 | 27.17 | 19.79 | 12.07 | 0.31 | 7.42 | 59.81 | 19.71 | 45.61 | 35.13 | 32.17 |
| ICIFNet [30] | 49.75 | 56.41 | 62.23 | 51.21 | 4.7 | 53.81 | 61.43 | 30.03 | 47.35 | 3.47 | 10.45 | 0 | 0 | 73.65 | 53.18 | 11.15 | 65.75 | 36.17 |
| DMINet [29] | 26.63 | 34.08 | 54.91 | 42.75 | 0 | 32.59 | 39.80 | 17.91 | 19.34 | 0 | 6.35 | 0 | 0 | 21.83 | 39.41 | 20.94 | 54.18 | 24.16 |
| SSCD-l [35] | 23.19 | 15.95 | 31.32 | 29.12 | 6.12 | 35.46 | 27.08 | 12.30 | 18.91 | 2.50 | 0 | 0 | 3.39 | 2.06 | 20.51 | 16.34 | 15.69 | 15.29 |
| Bi-SRNet [35] | 26.19 | 41.42 | 39.82 | 40.01 | 21.18 | 44.26 | 46.59 | 26.70 | 25.05 | 31.23 | 20.21 | 7.18 | 4.74 | 40.91 | 31.66 | 40.87 | 37.40 | 30.91 |
| FUSU-Net | 55.67 | 61.46 | 66.19 | 55.83 | 19.82 | 55.22 | 57.86 | 34.59 | 46.43 | 15.45 | 16.31 | 5.89 | 9.47 | 65.12 | 54.32 | 14.45 | 64.52 | 41.09 |
Overall results. Table 5 presents the results of binary and semantic change detection. In binary change detection, with only unchanged and changed pixels, class-specific IoU is not applicable. Our FUSU-Net outperforms other baselines by 7.21%-31.89% in IoU. In semantic change detection, challenging classes such as public management, public construction, and special land are observed across all methods, consistent with semantic segmentation results. Interestingly, Transformer-based architectures show no clear advantage over CNN-based architectures in this task on the FUSU dataset. Notably, FUSU-Net achieves better performance compared to other baseline methods than it does in the semantic segmentation task, which can be attributed to continuous observation and change information provided by time-series Sentinel images between two high-resolution image snapshots.
6 Discussion
Effectiveness of time-series. We evaluate to what extent time-series images enhance the performance. Table 6 shows the results. We choose the number of time-series images as the variable (i.e., all time-series images, partial time-series images, zero time-series images). We can see for the FUSU dataset, more time-series images contribute to better results. It is desirable to use all time-series images as additional temporal information.
| Time-series | 0 | 9 | 18 | 25 |
| mIoU (Seg) | 46.72 | 47.19 | 48.47 | 50.10 |
| IoU (BCD) | 65.51 | 69.35 | 74.39 | 79.80 |
| mIoU (SCD) | 26.64 | 34.14 | 36.55 | 41.09 |
More ablation experiments can be found in Supplementary Materials.
Limitations. FUSU dataset has two primary limitations. First, FUSU is limited in 5 urban districts. Even though the geographical diversity and included pixels are rich, it is desirable to include more urban areas around the world. We hope not only us but also the community could further share high-quality, fine-grained land use datasets and stimulate the development of urban monitoring. Second, land use change segmentation involves many understandings of human activities and production, rather than land cover which can directly correspond to pixel values. Therefore, relying solely on remote sensing imagery makes achieving high accuracy challenging. We hope to incorporate more multi-source data in the future, including but not limited to economic and population data, to develop a multimodal framework for a more comprehensive semantic understanding of urban areas.
Conclusion. We present FUSU, a multi-source, multi-temporal change segmentation dataset for fine-grained urban semantic understanding. Providing the fine-grained land use classification system (17 classes), large-scale annotation pixels (bi-temporal 30 billion), large coverage (847 ), temporal information (bi-temporal high-resolution images and monthly Sentinel data), FUSU supports the finest urban semantic understanding to date and becomes a unique and robust source for further general deep learning models in clear urban semantic understanding. We show how FUSU can contribute to urban land use segmentation and change detection by benchmarking several kinds of methods. We further propose FUSU-Net, to show a simple way to fully utilize the spatial-spectral-temporal-resolution diversity of FUSU. We believe FUSU and our benchmark will help the community to develop more powerful techniques to utilize multi-source, multi-temporal change segmentation data for clear urban semantic understanding.
References
- Seto et al. [2012a] Karen C Seto, Burak Güneralp, and Lucy R Hutyra. Global forecasts of urban expansion to 2030 and direct impacts on biodiversity and carbon pools. Proceedings of the National Academy of Sciences, 109(40):16083–16088, 2012a.
- Seto et al. [2012b] Karen C Seto, Anette Reenberg, Christopher G Boone, Michail Fragkias, Dagmar Haase, Tobias Langanke, Peter Marcotullio, Darla K Munroe, Branislav Olah, and David Simon. Urban land teleconnections and sustainability. Proceedings of the National Academy of Sciences, 109(20):7687–7692, 2012b.
- Pacifici et al. [2009] Fabio Pacifici, Marco Chini, and William J Emery. A neural network approach using multi-scale textural metrics from very high-resolution panchromatic imagery for urban land-use classification. Remote Sensing of Environment, 113(6):1276–1292, 2009.
- Perera et al. [2023] Amarasinghaghe Tharindu Dasun Perera, Kavan Javanroodi, Dasaraden Mauree, Vahid M Nik, Pietro Florio, Tianzhen Hong, and Deliang Chen. Challenges resulting from urban density and climate change for the eu energy transition. Nature Energy, pages 1–16, 2023.
- Yang et al. [2021] Kunping Yang, Gui-Song Xia, Zicheng Liu, Bo Du, Wen Yang, Marcello Pelillo, and Liangpei Zhang. Asymmetric siamese networks for semantic change detection in aerial images. IEEE Transactions on Geoscience and Remote Sensing, 60:1–18, 2021.
- Tian et al. [2020] Shiqi Tian, Ailong Ma, Zhuo Zheng, and Yanfei Zhong. Hi-ucd: A large-scale dataset for urban semantic change detection in remote sensing imagery. arXiv preprint arXiv:2011.03247, 2020.
- Toker et al. [2022] Aysim Toker, Lukas Kondmann, Mark Weber, Marvin Eisenberger, Andrés Camero, Jingliang Hu, Ariadna Pregel Hoderlein, Çağlar Şenaras, Timothy Davis, Daniel Cremers, et al. Dynamicearthnet: Daily multi-spectral satellite dataset for semantic change segmentation. In Proceedings of the IEEE/CVF Conference on Computer Vision and Pattern Recognition, pages 21158–21167, 2022.
- Van Etten et al. [2018] Adam Van Etten, Dave Lindenbaum, and Todd M Bacastow. Spacenet: A remote sensing dataset and challenge series. arXiv preprint arXiv:1807.01232, 2018.
- Helber et al. [2019] Patrick Helber, Benjamin Bischke, Andreas Dengel, and Damian Borth. Eurosat: A novel dataset and deep learning benchmark for land use and land cover classification. IEEE Journal of Selected Topics in Applied Earth Observations and Remote Sensing, 12(7):2217–2226, 2019.
- Tong et al. [2020] Xin-Yi Tong, Gui-Song Xia, Qikai Lu, Huanfeng Shen, Shengyang Li, Shucheng You, and Liangpei Zhang. Land-cover classification with high-resolution remote sensing images using transferable deep models. Remote Sensing of Environment, 237:111322, 2020.
- Chen and Shi [2020] Hao Chen and Zhenwei Shi. A spatial-temporal attention-based method and a new dataset for remote sensing image change detection. Remote Sensing, 12(10):1662, 2020.
- Ji et al. [2018] Shunping Ji, Shiqing Wei, and Meng Lu. Fully convolutional networks for multisource building extraction from an open aerial and satellite imagery data set. IEEE Transactions on geoscience and remote sensing, 57(1):574–586, 2018.
- Shi et al. [2023] Sunan Shi, Yanfei Zhong, Yinhe Liu, Jue Wang, Yuting Wan, Ji Zhao, Pengyuan Lv, Liangpei Zhang, and Deren Li. Multi-temporal urban semantic understanding based on gf-2 remote sensing imagery: from tri-temporal datasets to multi-task mapping. International Journal of Digital Earth, 16(1):3321–3347, 2023.
- Wang et al. [2021] Junjue Wang, Zhuo Zheng, Ailong Ma, Xiaoyan Lu, and Yanfei Zhong. Loveda: A remote sensing land-cover dataset for domain adaptive semantic segmentation. arXiv preprint arXiv:2110.08733, 2021.
- Garioud et al. [2024] Anatol Garioud, Nicolas Gonthier, Loic Landrieu, Apolline De Wit, Marion Valette, Marc Poupée, Sébastien Giordano, et al. Flair: a country-scale land cover semantic segmentation dataset from multi-source optical imagery. Advances in Neural Information Processing Systems, 36, 2024.
- Shi et al. [2020] Wenzhong Shi, Min Zhang, Rui Zhang, Shanxiong Chen, and Zhao Zhan. Change detection based on artificial intelligence: State-of-the-art and challenges. Remote Sensing, 12(10):1688, 2020.
- Dong et al. [2023] Runmin Dong, Lichao Mou, Mengxuan Chen, Weijia Li, Xin-Yi Tong, Shuai Yuan, Lixian Zhang, Juepeng Zheng, Xiaoxiang Zhu, and Haohuan Fu. Large-scale land cover mapping with fine-grained classes via class-aware semi-supervised semantic segmentation. In Proceedings of the IEEE/CVF International Conference on Computer Vision, pages 16783–16793, 2023.
- Yuan et al. [2020] Shuai Yuan, Runmin Dong, Juepeng Zheng, Wenzhao Wu, Lixian Zhang, Weijia Li, and Haohuan Fu. Long time-series analysis of urban development based on effective building extraction. In Geospatial Informatics X, volume 11398, pages 192–199. SPIE, 2020.
- Zhang et al. [2024] Lixian Zhang, Shuai Yuan, Runmin Dong, Juepeng Zheng, Bin Gan, Dengmao Fang, Yang Liu, and Haohuan Fu. Swcare: Switchable learning and connectivity-aware refinement method for multi-city and diverse-scenario road mapping using remote sensing images. International Journal of Applied Earth Observation and Geoinformation, 127:103665, 2024.
- Garnot and Landrieu [2021] Vivien Sainte Fare Garnot and Loic Landrieu. Panoptic segmentation of satellite image time series with convolutional temporal attention networks. In Proceedings of the IEEE/CVF International Conference on Computer Vision, pages 4872–4881, 2021.
- Robinson et al. [2019] Caleb Robinson, Le Hou, Kolya Malkin, Rachel Soobitsky, Jacob Czawlytko, Bistra Dilkina, and Nebojsa Jojic. Large scale high-resolution land cover mapping with multi-resolution data. In Proceedings of the IEEE/CVF Conference on Computer Vision and Pattern Recognition, pages 12726–12735, 2019.
- Tarasiou et al. [2023] Michail Tarasiou, Erik Chavez, and Stefanos Zafeiriou. Vits for sits: Vision transformers for satellite image time series. In Proceedings of the IEEE/CVF Conference on Computer Vision and Pattern Recognition, pages 10418–10428, 2023.
- Chen et al. [2017] Liang-Chieh Chen, George Papandreou, Florian Schroff, and Hartwig Adam. Rethinking atrous convolution for semantic image segmentation. arXiv preprint arXiv:1706.05587, 2017.
- Zhao et al. [2017] Hengshuang Zhao, Jianping Shi, Xiaojuan Qi, Xiaogang Wang, and Jiaya Jia. Pyramid scene parsing network. In Proceedings of the IEEE conference on computer vision and pattern recognition, pages 2881–2890, 2017.
- Long et al. [2015] Jonathan Long, Evan Shelhamer, and Trevor Darrell. Fully convolutional networks for semantic segmentation. In Proceedings of the IEEE conference on computer vision and pattern recognition, pages 3431–3440, 2015.
- Poudel et al. [2019] Rudra PK Poudel, Stephan Liwicki, and Roberto Cipolla. Fast-scnn: Fast semantic segmentation network. arXiv preprint arXiv:1902.04502, 2019.
- Wang et al. [2020] Jingdong Wang, Ke Sun, Tianheng Cheng, Borui Jiang, Chaorui Deng, Yang Zhao, Dong Liu, Yadong Mu, Mingkui Tan, Xinggang Wang, et al. Deep high-resolution representation learning for visual recognition. IEEE transactions on pattern analysis and machine intelligence, 43(10):3349–3364, 2020.
- Zhang et al. [2021] Wenwei Zhang, Jiangmiao Pang, Kai Chen, and Chen Change Loy. K-net: Towards unified image segmentation. Advances in Neural Information Processing Systems, 34:10326–10338, 2021.
- Feng et al. [2023] Yuchao Feng, Jiawei Jiang, Honghui Xu, and Jianwei Zheng. Change detection on remote sensing images using dual-branch multilevel intertemporal network. IEEE Transactions on Geoscience and Remote Sensing, 61:1–15, 2023.
- Feng et al. [2022] Yuchao Feng, Honghui Xu, Jiawei Jiang, Hao Liu, and Jianwei Zheng. Icif-net: Intra-scale cross-interaction and inter-scale feature fusion network for bitemporal remote sensing images change detection. IEEE Transactions on Geoscience and Remote Sensing, 60:1–13, 2022.
- Bandara and Patel [2022] Wele Gedara Chaminda Bandara and Vishal M Patel. A transformer-based siamese network for change detection. In IGARSS 2022-2022 IEEE International Geoscience and Remote Sensing Symposium, pages 207–210. IEEE, 2022.
- Li et al. [2023] Zhenglai Li, Chang Tang, Xinwang Liu, Wei Zhang, Jie Dou, Lizhe Wang, and Albert Y Zomaya. Lightweight remote sensing change detection with progressive feature aggregation and supervised attention. IEEE Transactions on Geoscience and Remote Sensing, 61:1–12, 2023.
- Chen et al. [2021] Hao Chen, Zipeng Qi, and Zhenwei Shi. Remote sensing image change detection with transformers. IEEE Transactions on Geoscience and Remote Sensing, 60:1–14, 2021.
- Lei et al. [2023] Tao Lei, Xinzhe Geng, Hailong Ning, Zhiyong Lv, Maoguo Gong, Yaochu Jin, and Asoke K Nandi. Ultralightweight spatial–spectral feature cooperation network for change detection in remote sensing images. IEEE Transactions on Geoscience and Remote Sensing, 61:1–14, 2023.
- Ding et al. [2022] Lei Ding, Haitao Guo, Sicong Liu, Lichao Mou, Jing Zhang, and Lorenzo Bruzzone. Bi-temporal semantic reasoning for the semantic change detection in hr remote sensing images. IEEE Transactions on Geoscience and Remote Sensing, 60:1–14, 2022.