Robust Nitrogen and Oxygen Abundances of Haro 3 from Optical and Infrared Emission
Abstract
Accurate chemical compositions of star-forming regions are a critical diagnostic tool to characterize the star formation history and gas flows which regulate galaxy formation. However, the abundance discrepancy factor (ADF) between measurements from the “direct” optical electron temperature () method and from the recombination lines (RL) represents dex systematic uncertainty in oxygen abundance. The degree of uncertainty for other elements is unknown. We conduct a comprehensive analysis of O++ and N+ ion abundances using optical and far-infrared spectra of a star-forming region within the nearby dwarf galaxy Haro 3, which exhibits a typical ADF. Assuming homogeneous conditions, the far-IR emission indicates an O abundance which is higher than the method and consistent with the RL value, as would be expected from temperature fluctuations, whereas the N abundance is too large to be explained by temperature fluctuations. Instead a component of highly obscured gas is likely required to explain the high far-IR to optical flux ratios. Accounting for this obscured component reduces both the IR-based metallicities and the inferred magnitude of temperature fluctuations, such that they cannot fully explain the ADF in Haro 3. Additionally, we find potential issues when predicting the RL fluxes from current atomic data. Our findings underscore the critical importance of resolving the cause of abundance discrepancies and understanding the biases between different metallicity methods. This work represents a promising methodology, and we identify further approaches to address the current dominant uncertainties.
1 Introduction
The abundance of heavy elements in the interstellar medium (ISM) with respect to hydrogen, i.e., metallicity, serves as a critical diagnostic tool for understanding the astrophysical processes which govern galaxy formation. Metallicity is particularly valuable as a probe of star formation history, gas accretion, feedback mechanisms, and galactic-scale outflows (e.g., Maiolino & Mannucci, 2019; Sanders et al., 2021; Davé et al., 2017; Torrey et al., 2019). Oxygen (O) and nitrogen (N) are among the elements most commonly used to assess gas-phase metallicities, and they are more powerful in combination due to their distinct nucleosynthetic origins and subsequent enrichment pathways. Oxygen in the ISM is produced mostly from the cataclysmic termination of massive stars in the form of core-collapse supernovae (CCSNe). In contrast, nitrogen’s enrichment is largely facilitated by stellar winds from intermediate-mass Asymptotic Giant Branch (AGB) stars (e.g., Nomoto et al., 2013), resulting in a temporally delayed contribution to the enrichment of the ISM relative to star-forming events. The total nitrogen yield also increases with overall metallicity due to secondary production from the CNO cycle. This dichotomy in enrichment processes renders the ratio of these elements an invaluable metric for tracing the integrated history of star formation and gas flows.
Substantial research has been dedicated to understanding the enrichment patterns of O and N metallicities (e.g., Alloin et al., 1979; Pilyugin et al., 2012; Berg et al., 2012; Izotov et al., 2012; James et al., 2015; Vincenzo et al., 2016; Steidel et al., 2016; Magrini et al., 2018; Annibali & Tosi, 2022; Sanders et al., 2023), revealing minimal evolution in the N/O ratio among low-metallicity galaxies while observing an elevated N/O ratio in high-metallicity galaxies. This trend aligns with the classical CCSNe and AGB enrichment scenarios. Nevertheless, recent findings have uncovered an unexpected increase in the N/O ratio within early galaxies during the epoch of reionization (Bunker et al., 2023; Isobe et al., 2023; Marques-Chaves et al., 2024), possibly linked to settings of supermassive star enrichment processes operating in dense clusters (D’Antona et al., 2023; Nagele & Umeda, 2023; Pascale et al., 2023; Belokurov & Kravtsov, 2023; Charbonnel et al., 2023; Senchyna et al., 2023; Cameron et al., 2023; Kobayashi & Ferrara, 2024; Nandal et al., 2024). Notably, the large N/O abundances found in early galaxies are based on rest-frame ultraviolet emission lines, as opposed to optical diagnostics used at lower redshifts (). Such diagnostics are powerful and complementary in probing a vast redshift range, but may introduce different systematic errors (e.g., Topping et al., 2024). This underscores the necessity to accurately determine the chemical abundance patterns in galaxies to better understand their chemical evolution throughout cosmic history.
A standard approach to measure the gas-phase metal content, often referred to as the “direct” method, relies on analyzing the collisionally excited emission lines (CEL). These are produced when ions such as O++ or N+ undergo radiative transitions from various energy levels, following excitation from collisions with electrons. The flux ratio of emission lines from different collisionally excited energy levels (e.g., [O III] 4363 / [O III] 5007) provides a measurement of the temperature , which in turn allows ion abundances to be determined from line luminosities. However, this -sensitivity presents a challenge when multiple ionizing sources contribute to temperature structures and fluctuations within the gas (Pilyugin et al., 2012). Treating the gas as a uniform phase across an entire galaxy – or even within an H II region – can bias the method toward regions of higher temperature, and thus, lower elemental abundance, leading to an underestimation of the true metallicity. This systematic bias is often invoked to explain the so-called abundance discrepancy factor (ADF), where -based oxygen metallicities are consistently lower than those determined through -insensitive recombination lines (RL; e.g., O II 4650 V1 multiplet, also emitted by O++ gas) by dex (Peimbert et al., 1993, 2005; Esteban et al., 2009, 2014). As one way to explain this dicrepancy, the amount of bias in the method is directly related to the magnitude of temperature fluctuations, which can be expressed as a dimensionless variance :
| (1) |
where and are the densities of specific ions and free electrons respectively, is the mean electron temperature, and is the integration volume. A key open question is whether temperature fluctuations in ionized nebulae are in fact sufficiently high to explain the ADF (e.g., Peimbert et al., 2017; Maiolino & Mannucci, 2019).
In a pilot study by Chen et al. (2023) (hereafter C23), the temperature fluctuation hypothesis was empirically tested within the nearby dwarf galaxy Mrk 71 using far-IR fine-structure emission lines. While these far-IR emission lines (e.g., [O III] 52, 88 ) are the product of collisional excitation, the low energy required for their excitation renders them effectively insensitive to . Therefore, a direct comparison between the far-IR-derived metallicity and the optical-CEL (OCEL) metallicity yields a direct gauge of temperature fluctuations without ambiguity caused by different emission mechanisms (Jones et al., 2020), i.e., the metallicity derived from far-IR lines is expected to be nearly identical to the RL method even if is large. Intriguingly, our findings revealed a value in Mrk 71 for O++ gas that is consistent with zero, and is in tension () with the ADF derived between the O++ RL and OCEL metallicities. This result highlights the power of combining optical and far-IR spectra to address key issues regarding the magnitude of temperature fluctuations , the origin of the ADF, and the absolute gas-phase abundances. Such methods are especially promising for application at high redshifts, where the relevant optical and far-IR lines are now being detected at thanks to the combination of JWST and the Atacama Large Millimeter Array (ALMA; Fujimoto et al. 2023; Jones et al. 2020). It is thus a pivotal time to harmonize metallicity measurements across both low and high-redshift galaxies.
Characterization of the temperature fluctuations within ionized nebulae can be significantly expanded by using the same methods to measure between different ion species. A recent study by Méndez-Delgado et al. (2023a) underscores the necessity by unveiling a correlation between and the differential temperature, . This suggests that temperature fluctuations might be intrinsically linked to the inherent temperature disparities amongst various gas phases.
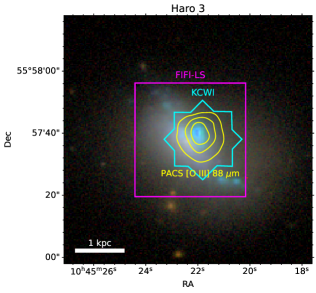
In this paper, we apply the optical+far-IR methodology from C23 to measure from both O++ as well as N+ for the first time. This study is made possible by the recent availability of comprehensive datasets from integral field unit (IFU) spectrographs spanning the optical and far-IR: the Far Infrared Field-Imaging Line Spectrometer on the Stratospheric Observatory for Infrared Astronomy (SOFIA/FIFI-LS; Fischer et al. 2018), the Photodetector Array Camera and Spectrometer on the Herschel Space Telescope (Herschel/PACS; Poglitsch et al. 2010), and the recent commissioning of the red channel (also known as the Keck Cosmic Reionization Mapper; KCRM) of the Keck Cosmic Web Imager on the W.M. Keck Observatory (Keck/KCWI; Morrissey et al. 2018). Here we focus on a star-forming region within the dwarf galaxy Haro 3 (also known as NGC 3353 or Mrk 35; RA=10:45:22.4; Dec=55:57:37; ). Based on the fiber spectrum centered on the host galaxy from the Sloan Digital Sky Survey data release 8 (SDSS DR8), the host galaxy has a stellar mass , star formation rate , and gas-phase metallicity (Kauffmann et al., 2003; Brinchmann et al., 2004; Tremonti et al., 2004), although we note that metallicities adopted from SDSS are systematically higher than from the method (e.g., Kewley & Ellison, 2008). In this work, we focus on the luminous H II region ( pc) northwest of Haro 3’s nucleus, often labeled as “Region A” (Steel et al., 1996). This region dominates the host galaxy’s total star formation and ionizing photon production (Johnson et al., 2004).
This paper is organized as follows. We describe the observational dataset in §2. Detailed methods leading to the temperature and metallicity measurements are presented in §3. In §4, we discuss our findings. The conclusions are summarized in §5.
2 Observations
The Keck/KCWI data of Haro 3 were collected on the nights of UT 2023-06-19 and 2023-11-11. Both nights were dark, clear, with photometric conditions. The observations involved two distinct observation strategies: firstly, a series of brief snapshots to prevent the saturation of strong emission lines, and secondly, deep exposures aimed at detecting faint emission features including auroral and oxygen recombination lines. All observations used the Medium slicer, with 07 slits and a field of view (FoV). For the snapshots, the BL and RL gratings were employed to obtain broad wavelength coverage. The BL grating was centered at 4500 Å (coverage 3580–5580 Å, ), with an exposure time of s; the RL grating was centered at 8000 Å (6465–9780 Å, ) with s. The deep exposures utilized the BM and RL gratings. The BM grating was centered at 4400 Å (3985–4865 Å, ) to resolve the O II RL multiplet with individual exposure times ranging between 200s, 600s, and 660s, and a total s; the RL grating was centered at 7250 Å (5715–9035 Å, ) to cover the faint [N II] auroral emission, with individual exposure times as a mixture of 200s, 300s, and 330s, achieving a total s as well. Between individual exposures, the FoV was rotated by to enable good spatial sampling.
We performed the KCWI data reduction process following the methodology described in C23, utilizing the upgraded Python version of the Data Reduction Pipeline (DRP)111https://github.com/Keck-DataReductionPipelines/KCWI_DRP, which now supports the red channel. As in C23, we altered the DRP, opting for linear resampling over cubic resampling to ensure flux conservation. Sky subtraction was performed by scaling and removing the b-spline sky model generated by the DRP from separately obtained exposures of adjacent blank sky, subsequent to the on-source exposures. Flux calibration was performed using observations of the A-type standard star BD+26 2606, taken immediately after the science exposure sequence. Data cubes from individual exposures were resampled to a uniform grid with a pixel size of prior to their combination using KcwiKit (Prusinski & Chen, 2024). The blue-channel data were averaged with weights according to exposure time. The red-channel detector exhibited a much higher incidence of cosmic rays (CR), which were not entirely eliminated by the DRP. To address this, we employed a sigma-clipping method with , centered around the median value, prior to the average combination of data cubes. From comparison of flux measurements across different grating configurations, we determined that the relative flux accuracy is within . Additionally, two pseudo-broad-band images were generated from the RL-7250 and RL-8000 cubes in the i band and compared with images from the SDSS data release 18 (Almeida et al., 2023). A discrepancy of was identified and subsequently corrected in the data cubes. Following this adjustment, we conservatively adopt a 3% absolute flux accuracy, which is included in the subsequent analyses.
The [O III] 88 and [N II] 122 emission lines were observed with the Photodetector Array Camera and Spectrometer (PACS; Poglitsch et al. 2010) aboard the Herschel Space Observatory, as part of the Herschel Dwarf Galaxy Survey (HDGS; Cormier et al. 2015). These reduced data (v14.2.0) were obtained from the Herschel Data Archive222https://archives.esac.esa.int/hsa/whsa/. The“chop-nod” mode was employed for these observations, with exposure times of 4068 s for [O III] 8 and 805 s for [N II] 22. Additionally, reduced data of [O III] 52 emission were acquired from the SOFIA Data Archive333https://irsa.ipac.caltech.edu/Missions/sofia.html, as reported by Peng et al. (2021). These observations utilized the Field-Imaging Far-Infrared Line Spectrometer (FIFI-LS; Fischer et al. 2018), with a total integration time of 1413 s. The flux-calibration uncertainties of PACS and FIFI-LS individually are , and the relative uncertainty between the two instruments is (Fadda et al., 2023).
3 Methods
3.1 Flux Measurements
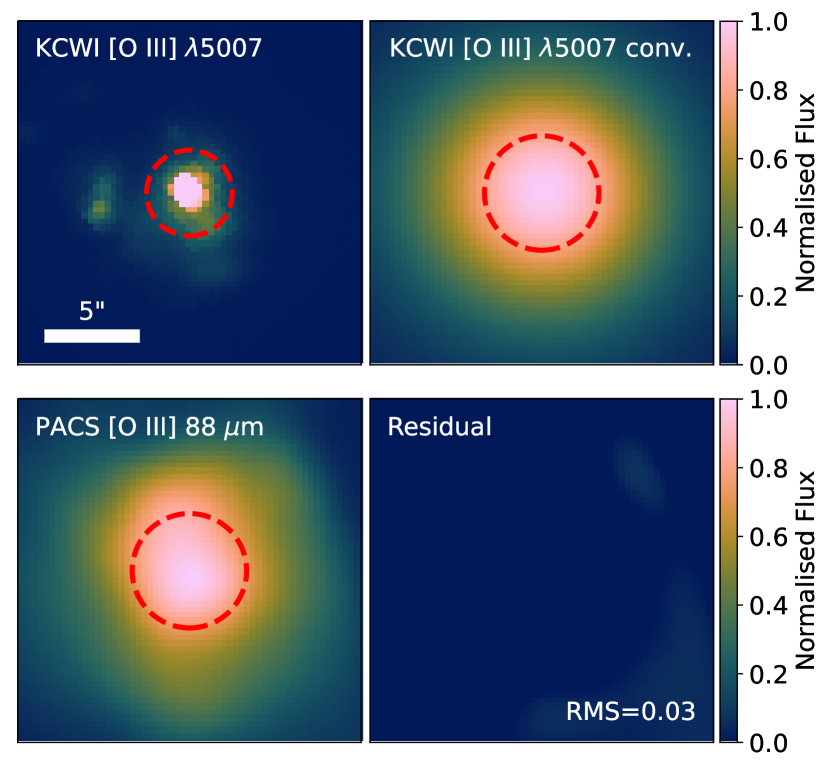
Accurate temperature and metallicity measurements are based on the ability to reliably compare line fluxes from optical and infrared data. This comparison requires matching the point spread function (PSF) and extraction aperture of the various IFU data sets. We matched the PSF of each instrument by convolving pseudo-narrowband (PNB) images of distinct [O III] or [N II] emission lines with Gaussian spatial profiles. Fig. 2 shows an example of PSF matching between KCWI [O III] and PACS [O III] . For the [O III] 5007 (KCWI) compared to far-IR images, the optimal full width at half maximum (FWHM) values for the Gaussian convolution kernels were determined from the best fit to be for [O III] 52 (FIFI-LS), for [O III] 88 (PACS), and for [N II] 122 (PACS). The residual root mean square (RMS) of the fit is of the peak intensity of the [O III] and [N II] PNB images. These FWHM values are consistent with expectations from the diffraction limit of the telescopes and wavelengths of the targeted features.
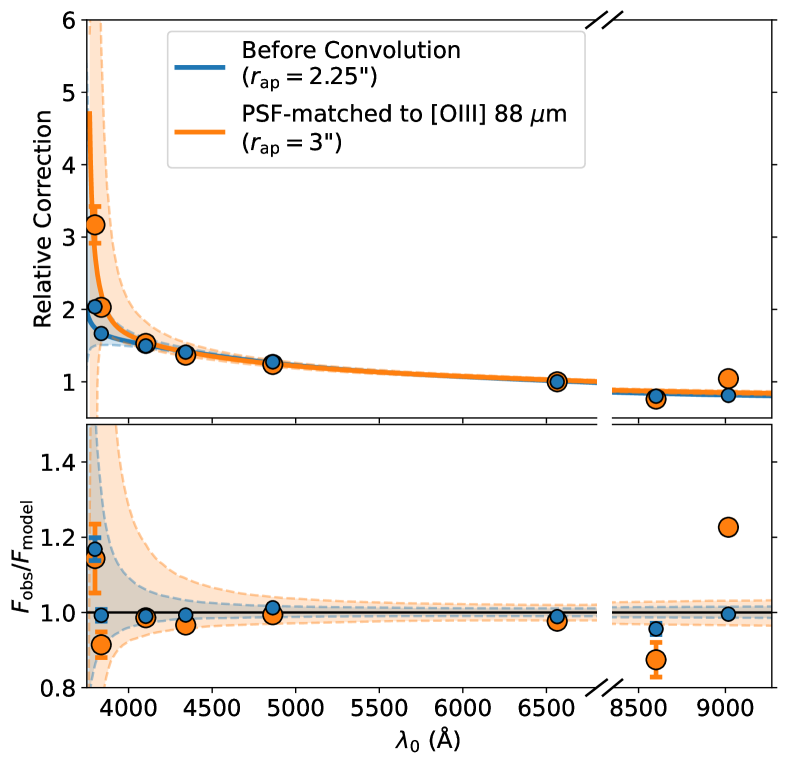
Given the substantial PSF differences between KCWI (with 1″ FWHM) and the far-IR instruments, coupled with the compact nature of Haro 3, the S/N ratio for faint emission lines in the KCWI data significantly deteriorates post-convolution. To ensure a reliable comparison while preserving an acceptable S/N, we extract 1-D spectra from both pre- and post-PSF-matched KCWI data cubes across various apertures. An aperture-correction factor is then derived by comparing the extinction-corrected fluxes (see §3.2) of strong emission lines (including [Ne III] , [O III] , , and H) between these spectra. The apertures, centered on the nebular emission peak, have pre-convolution radii of 225 and post-convolution radii of 3″ (Fig. 2, left). The aperture sizes were selected to optimize the S/N ratio and to minimize the inclusion of flux from other sources. The systematic uncertainty of this aperture correction is estimated to be , based on the standard deviation of the flux ratios.
(a) PSF Matching
(b) Attenuation Correction
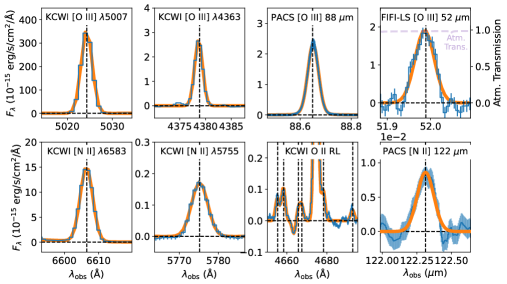
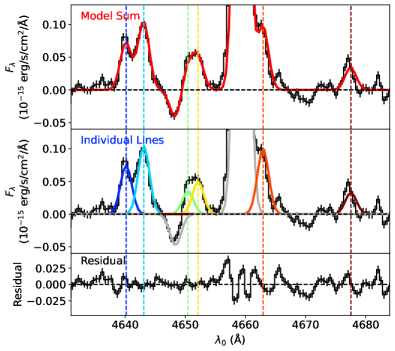
The spectral profiles of the optical emission lines are best described by a narrow Gaussian profile with an additional broad component contributing of the total flux. However, due to undersampling in detector space for SOFIA/FIFI-LS and Herschel/PACS, the far-IR line profiles are instead better described by Voigt profiles. For consistency, fluxes of all [O III] and [N II] optical and far-infrared CELs were measured by fitting Voigt profiles after extracting the 1D spectra, except for the weak features specifically described below. The choice of Voigt versus Gaussian profiles results in differences in flux for the optical lines. The [N II] 6548, 6583 doublet, located near H, is fit concurrently with the intensity ratio constrained to the theoretical value of 1:2.942 (Froese Fischer & Tachiev, 2004). The [N II] 5755, 122 lines, and the O II RL V1 multiplet lines are fitted using only Gaussian profiles due to their relative weakness. Additionally, individual lines within the RL multiplet are fitted simultaneously to account for blending. Fig. 1 shows the best fits to several representative lines. The 1- flux uncertainties are derived from the error spectra. However, data cube resampling and PSF convolution inevitably induce pixel covariance, affecting the accuracy of error estimation. To address this, we compare the standard deviation of a featureless section of the spectra with the calculated error spectra, and rescale the error spectra based on the factorial differences before propagating the flux errors. All measured fluxes related to this work, before and after aperture matching and attenuation correction, are presented along with their 1 uncertainties in Appendix A.
3.2 Attenuation Correction
In this study, dust attenuation correction, including contributions from the Milky Way444The Milky Way extinction in the direction of Haro 3 contributes only based on Schlafly & Finkbeiner (2011). and Haro 3, was performed using the Hydrogen Balmer and Paschen lines. Unlike the emission lines from O++ and N+, fluxes of the H I lines for attenuation correction are determined by integration over a wavelength range manually selected to accommodate stellar absorption features. This consideration is particularly crucial for the weaker Balmer lines, where stellar absorption has a significant impact. Reliable flux measurements are obtained from H to H10 (or H), as well as P10 and P14 lines. However, the H7 (H) and H8 (H) lines are excluded due to their blending with other spectral features. Other Balmer and Paschen lines are deemed unsuitable for reliable flux measurements, either being too weak or contaminated by telluric OH emission. The ability to measure H, P10, and P14 fluxes from the newly commissioned red-channel of KCWI significantly increases the accuracy of this attenuation correction. With Paschen line attuenuation being that of the Balmer lines, and the wavelength baseline increasing by , the attenuation correction uncertainty is reduced by compared to using Balmer lines alone.
The strength of dust attenuation, , is derived by modeling the observed fluxes of Balmer and Paschen lines. The model assumes that the intrinsic H line ratios are given by the case B recombination scenario with 8,500 K and an electron density . 555This assumption is informed by the and values derived from [O III] far-IR emission, as discussed in §3.3. Variations in and have a marginal impact on the results. For example, a scenario with K and alters the P13/H ratio by . The attenuation of H fluxes is calculated using an extinction curve from Cardelli et al. (1989) with a parameter .666Changing assumptions imposes a small change in the final metallicity measurements, mostly for the far-IR metallicities. Specifically, assuming (4.1) increases the far-IR O/H metallicity measurement by () dex, which does not affect our conclusions. The model also accounts for stellar absorption by assuming a fixed equivalent width for the Balmer lines (), while positing no absorption for the Paschen lines. This assumption is based on stellar population synthesis models. Specifically, for the Binary Population and Spectral Synthesis (BPASS) v2.3 (Stanway & Eldridge, 2018) model, the Paschen is of the Balmer ones in the age range of – years. In the observed spectra, the Paschen lines also have no broad absorption signatures that appear in the high-order Balmer lines. We find that both and vary significantly between the small unconvolved optical and the large PSF-convolved far-IR apertures. The change is consistent with the and maps derived from the same method using the unconvolved KCWI data. The maps indicate that the larger aperture includes more contribution from the surrounding host galaxy, with both higher dust attenuation and stronger effects of stars with Balmer absorption. Consequently, measurements were made separately both before and after aperture matching, with the aperture correction factor calculated based on the attenuation-corrected fluxes. The best-fit models and are presented in Fig. 2 and Table 1. Uncertainties in the measurements are included in the subsequent measurements.
3.3 Temperature, Density, and Metallicity
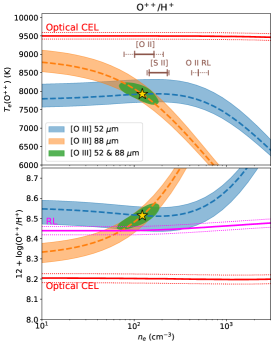
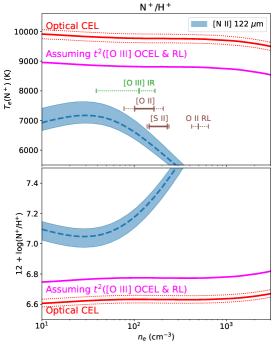
Electron temperatures for O++ and N+ [(O++) and (N+)], along with their metallicities (i.e., and abundance ratios), were determined using PyNeb (Luridiana et al., 2015). We adopt collisional strengths from Storey et al. (2014); Tayal (2011) and transition probabilities from Storey & Zeippen (2000); Froese Fischer & Tachiev (2004). Our approach is to measure (IR) from the extinction-corrected ratios of far-IR to optical nebular lines (namely [O III] 52 /5007, [O III] 88 /5007, and [N II] 122 /6583), and metallicities from the ratios of far-IR to H I Balmer lines (e.g., [O III] 52 /H). We compute (IR) and metallicities as a function of electron density . We also measure (IR) directly from the [O III] 52 /88 flux ratio. The 1 uncertainties are estimated using the Markov Chain Monte Carlo (MCMC) method, accounting for systematic uncertainties arising from flux calibration and extinction correction described earlier. The posterior distributions of , , and metallicities are illustrated in Fig. 3 with maximum-likelihood values reported in Table 1.
| = 225 | ||||
|---|---|---|---|---|
| Property | (before PSF matching) | (after PSF matching) | ||
| ([O III] (cm-3) | — | |||
| ([O II] (cm-3) | ||||
| (O II RL) (cm-3) | — | |||
| ([S II] (cm-3) | ||||
| ([Cl III] (cm-3) | ||||
| ([Ar IV] (cm-3) | ||||
| OCEL | RL | Far-IR | ||
| ([O III] (K) | aaAssuming ([O III] IR). | — | ||
| ([N II] (K) | aaAssuming ([O III] IR). | — | aaAssuming ([O III] IR). | |
| ([O II] (K) | — | — | ||
| aaAssuming ([O III] IR). | aaAssuming ([O III] IR). | |||
| bbAssuming , where is measured from [O II] 3726,3729, assuming ([N II] OCEL). | ||||
| aaAssuming ([O III] IR). | — | aaAssuming ([O III] IR). | ||
| ccAssuming , and (OCEL). | — | |||
| aaAssuming ([O III] IR). | — | |||
| bcbcfootnotemark: | — | |||
| RL vs. OCEL | IR vs. OCEL | |||
| ([O III] | ||||
| ([O III] (K) | ||||
| ([N II] | — | |||
| ([N II] (K) | — | |||
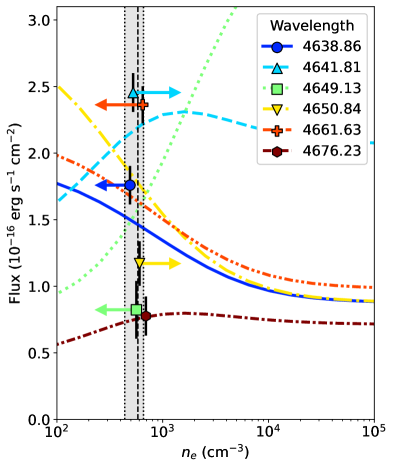
The and metallicity values derived from far-IR emission lines are notably influenced by (Fig. 3), due to the low critical density (– cm-3) of these lines. The [O III] 52 /88 ratio provides a self-consistent measurement of within the same aperture and from the same [O III] emitting gas. We adopt this ([O III] for all and metallicity calculations in this work. For reference, in Table 1 and Fig. 3, we also include values measured from the optical [O II] / and [S II] / ratios, as well as those derived from the relative intensities of the O II V1 multiplet. For both [O II] and [S II] , has been determined from apertures with and 3” before and after PSF-matching. The values measured from the smaller aperture are higher than those from the 3” aperture, aligning with a density gradient in the H II region as reported in previous studies (Binette et al., 2002; Phillips, 2007; García-Benito et al., 2010; Jin et al., 2023). The optical measurements of ([O II] and ([S II] are consistent (within ) with the far-IR ([O III] measurements. However, even after accounting for aperture differences, the derived from the O II recombination lines remains considerably higher than the other measurements.
The and metallicity are measured from OCELs and RLs in a manner similar to that used for the far-IR analysis. (OCEL) is calculated from the auroral-to-nebular flux ratios (i.e., [O III] 4363/5007 and [N II] 5755/6583). These temperatures are then used to derive CEL-based metallicities from the [O III] 5007/H and [N II] 6583/H ratios. We also use (O++) obtained from OCELs to calculate the O II RL emissivity. The total flux from the O II lines at 4638.9, 4641.8, 4649.1, 4650.8, 4661.6, and 4676.2 Å in the V1 multiplet is then used to calculate the RL-based O++ metallicity. We note that RL emissivity and hence metallicity exhibits a relatively weak dependence on . The and metallicities derived from OCELs and RLs have minimal sensitivity to electron density () in the low-density regime which applies here (Fig. 3).
In addition to ion abundances, we also calculate the total O/H, N/H, and N/O ratios. The O/H ratio is derived by summing the O+/H+ and O++/H+ ratios, assuming that all oxygen in the H II regions is singly or doubly ionized. This is expected to be accurate to within a few percent (Izotov et al., 2006; Berg et al., 2018). The O+/H+ metallicity is measured from the direct- method using the [O II] 3726,29, and the auroral [O II] 7318,20,30,31 fluxes. For N, we assume that the ratio of singly and doubly ionized N is the same as O, i.e., N+/N++ O+/O++(OCEL) . The N++/N+ ratio implied from this assumption is in agreement with the [N III] 57 /[N II] 122 ratio reported in Cormier et al. (2015). It is important to note that the total N and O metallicities presented in this study are intended only as reference values. Our conclusions regarding the ADF and temperature fluctuations, discussed in §4, do not depend on these results.
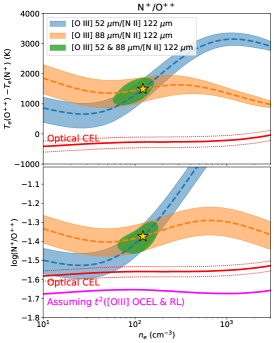
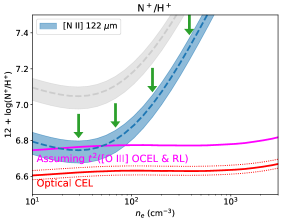
Fig. 3 summarizes the and ion abundance measurements as functions of . We find a typical abundance discrepancy in Haro 3, with the RL-based abundance of O++ higher than OCELs by dex. The far-IR [O III] lines suggest a lower and higher abundance than OCELs, and are consistent within 1 uncertainty of the RL metallicity. This is in contrast with C23, in which we instead found the O/H metallicity derived from the far-IR and OCEL methods to be consistent. Our results for Haro 3 can be explained by temperature fluctuations and suggests (Table 1). However, the far-IR [N II] emission does not support a simple temperature fluctuation scenario. A much higher and a much lower average temperature are required to reconcile the optical and far-IR CELs of [N II] . The [O III] and [N II] measurements differ by in alone, and in the 2D space of (see §4.1 and Fig. 4). The N+/O++ abundance ratio offers a more powerful test. The far-IR N+/O++ ratio is higher than that derived from OCELs. However, since the [N II] 6583 emission is less sensitive to than [O III] 5007, any temperature fluctuations should result in a “true” N+/O++ ratio that is lower than the value we report from the OCELs; the far-IR value is likewise expected to be lower. Instead, our far-IR N+/O++ ratio is higher than expected from the temperature fluctuation hypothesis (Fig. 3, lower right panel). Notably, while the IR-to-optical comparisons are subject to various sources of uncertainty (e.g., attenuation correction, electron density, flux calibration), the purely IR measurement of N+/O++ is relatively robust. In particular, there is no attenuation correction, minimal aperture matching correction, and minimal dependence thanks to the similar critical densities of [O III] 88 and [N II] 122 (Fig. 3). We thus consider the comparison of N+/O++ from IR-only and optical-only measurements as one of the most reliable tests.
4 Discussion
4.1 To or not to ?
A key objective of this study is to assess the degree to which temperature fluctuations can account for the ADF, which is ubiquitously observed between OCEL and RL. We find agreement in O++/H+ abundance between the RL and far-IR measurements, which appears to support the hypothesis that the ADF is caused by temperature fluctuations. However, the N+/H+ and N+/O++ ratios derived from far-IR and OCEL observations do not support this simple scenario (Fig. 3).
With the goal to understand whether temperature fluctuations alone can explain the disparity, we convert the differences in metallicity measurements between RL vs. OCEL and far-IR vs. OCEL into pairs of based on Eq. 1. Traditionally, such calculations have been performed analytically, under the assumption that temperature fluctuations are relatively minor compared to (see Peimbert et al. 2017). However, this assumption proves inadequate for reconciling the [N II] far-IR and OCEL measurements. Consequently, we performed a numerical integration of Eq. 1 and estimated uncertainties in the parameters using MCMC.
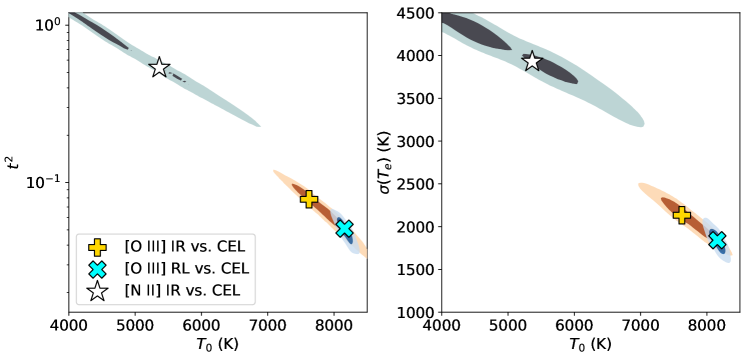
In Fig. 4 and Table 1, we present the posterior distributions of (, ) calculated from comparisons of [O III] RL vs. OCEL, [O III] far-IR vs. OCEL, and [N II] far-IR vs. OCEL. As expected from the the [O III] RL and far-IR metallicity measurements, the values derived from [O III] analyses are in mutual agreement. The value obtained from [O III] RL vs. optical CEL aligns with the typical range of (–0.2) reported in similar H II regions (Peimbert et al., 2005; Esteban et al., 2009, 2014). Additionally, our findings are consistent with typical H II regions in [, ([O III] ([N II] , ] space, which has been presented as evidence for temperature fluctuations (Méndez-Delgado et al., 2023a). The value derived from far-IR vs. OCEL is consistent within of the RL vs. OCEL value.
However, the [N II] far-IR vs. OCEL comparison presents a more complex picture. The (, ) values differ by from the [O III] values, with an anomalously large (Table 1). Some degree of difference is expected since N+ and O++ originate from fundamentally different regions within the H II regions, consistent with their distinct ionization energies (O++: 35.12 eV; N+: 14.53 eV) and corroborated by spatially resolved photoionization models (e.g., Sankrit & Hester, 2000; Arthur et al., 2011; Yang et al., 2023; Jin et al., 2023). However, the from [N II] far-IR vs. OCEL corresponds to a temperature standard deviation , or approximately 65–85% of . Stasińska (2000) noted that traditional photoionization models struggle to account for the degree of temperature fluctuations indicated by the ADF, suggesting that additional factors like cosmic rays (Giammanco & Beckman, 2005) may be needed to explain fluctuations on the order of even –2000 K. Given the existing difficulties in explaining temperature fluctuations in the theoretical framework, the extent of temperature fluctuations implied by our measurements of [N II] in Haro 3 imposes a substantial challenge to temperature fluctuations alone as an explanation of the ADF.
4.2 Non-thermal effects
Another hypothesis proposed to explain the ADF involves the deviation from thermal equilibrium of electrons, leading to a distribution of electron energies that diverges from the classical Maxwell-Boltzmann framework. Nicholls et al. (2012, 2013); Dopita et al. (2013) investigated the concept of a -distribution, a generalized Lorentzian model characterized by an extended high-energy tail, as a potential mechanism underlying the ADF observed in H II regions and planetary nebulae. The -distribution has been documented within the solar system, primarily attributed to the influx of high-energy plasma from the solar wind. This mechanism suggests that a higher proportion of high-energy electrons could enhance the population of ions in excited states, leading to an overestimation of when derived from the auroral to nebular line ratios through the “direct-” method.
We can test whether this offers a satisfactory explanation thanks to the difference in -sensitivity of the [O III] 4363/5007 and [N II] 5755/6583 ratios, which likewise respond differently to the -distribution. Specifically, to explain the ADF, the ([O III] of Haro 3 requires a less pronouced -distribution ()777The parameter is defined such that a lower value of has a more pronouced high-energy tail, while is equivalent to the Maxwell-Boltzmann distribution., while ([N II] suggests a significant modulation from the high-energy tail (). Since N+ and O++ ions are not strictly co-spatial, it is, again, reasonable to expect different -distributions derived from the N+ and O++ gas. However, the implication that N+ requires more high-energy injection (based on its lower associated value) is contradictory to the naive picture that gas closer to the ionizing energy source is more highly ionized. Therefore, we conclude that a non-thermal -distribution of electron energies is unlikely to be the cause of the ADF.
4.3 Density fluctuations
In addition to temperature fluctuations, Méndez-Delgado et al. (2023b) and Rickards Vaught et al. (2023) have recently discussed the effects of density () fluctuations in H II regions. In the presence of fluctuations, the measured values are biased towards the critical densities for collisional de-excitation of the diagnostics. Specifically, values derived from [O II] and [S II] nebular emission are reported to be approximately 300 cm-3 lower than those obtained from auroral or UV lines (also see Mingozzi et al. 2022). However, auroral line-based diagnostics (e.g., the ratio of [O II] to ; Méndez-Delgado et al. 2023b) are notably sensitive to . Given the broad range of ([N II] deduced from our OCEL and far-IR analyses, these auroral-line-based diagnostics offer limited constraints. We also examined constraints on using optical diagnostics with higher critical densities, but these primarily yielded upper limits. Specifically, measurements of [Cl III] and [Ar IV] give upper limits () of and , respectively, consistent with other determinations. Therefore, these indicators cannot confirm or quantify the strength of fluctuations in Haro 3.
Within the framework of density fluctuations, the observed underestimation of by aligns with estimates derived from O II RLs, as reported in Table 1. However, we find that the recombination coefficients for O II from Storey et al. (2017) cannot fit the observed fluxes of individual lines well (Appendix A). The (O II value provided in Table 1 reflects the most likely solution from MCMC based on current atomic data, yet this best-fit scenario (Fig. 5) overestimates the fluxes of O II 4649.13 and 4650.84 by (Fig. 6). This finding contrasts with the studies by C23 on Mrk 71 and Storey et al. (2017) on various nearby H II regions, where adjusting yielded reasonable fits to the O II RL line ratios. As shown in Fig. 5, a few O II RL lines are blended with other spectral features, potentially increasing their systematic uncertainties. As a sanity check, we reconducted the same analysis with only a subset of the O II emission of 4638.86, 4641.81, and 4676.23 which are relatively robust. This subset suggests an and increases the ADF between [O III] OCEL and RL by dex. While the O/H metallicity from this subset is closer to the far-IR metallicity, the new is still inconsistent with other measurements. In another attempt to reconcile this discrepancy, we developed models incorporating both and fluctuations to simulate the O II RL flux ratios. Nonetheless, these models generally favored minimal fluctuations and were unable to achieve a more accurate fit. Such findings highlight potential challenges in utilizing O II RL fluxes for metallicity measurements in conditions where the O II fluxes are not measured individually. While probing the accuracy of atomic data and the emission mechanisms of O II RLs falls outside the scope of this investigation, it represents an important avenue for future research.
The observed differences in across two extraction apertures for Haro 3, as documented in Table 1, indicate the presence of a moderate gradient (, or dex in ). If we consider log-normal density distributions, such a standard deviation of dex can lead to an overestimation of by K and an underestimation of the O++/H+ ratio by dex for the far-IR lines. This effect is negligible compared to the ADF, and is in the opposite direction of the observed discrepancy between far-IR and optical measurements. Similarly, the accuracy of our metallicity measurements could also be affected by contributions from the diffused ionized gas (DIG) of the host galaxies. However, the H II region dominates the host galaxy in nebular and ionizing radiation. By comparing the H fluxes in the extraction aperture and a region on the opposite side of the host galaxy, the contribution of DIG is estimated to be of the line fluxes.
4.4 A complex gaseous environment
In our analysis, we have established that neither nor fluctuations alone can adequately account for the observed discrepancies in the optical and far-IR flux ratios of [O III] and [N II] . Notably, the consistent disparities observed in the O++/H+ and N+/H+ metallicities, as measured by the OCEL and far-IR methods, suggest that optical photons are fractionally underrepresented. This scenario is consistent with the phenomenon that a portion of the gas is obscured by dust. Although we corrected for dust extinction using the Balmer and Paschen lines, these corrections are biased toward regions of lower dust extinction and thus underestimate the correction factor. Therefore, in regions heavily enshrouded by dust, where even Paschen photons may be absorbed, accurately compensating for their obscured contribution proves to be a formidable challenge.
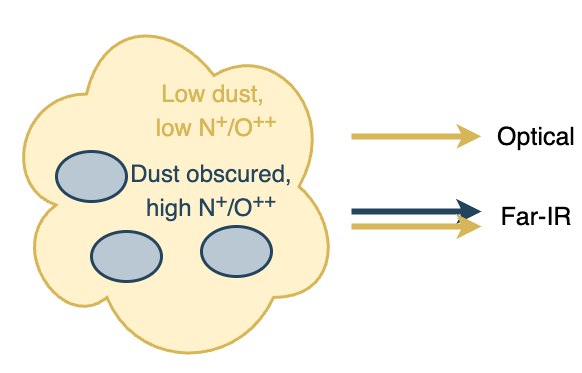
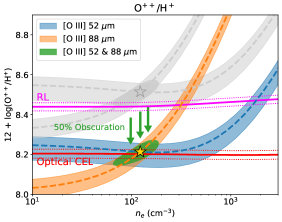
Assuming that the chemical composition of obscured gas mirrors the gas observed in optical and near-IR, i.e., the far-IR metallicity estimations are inflated due to unaccounted H Balmer and Paschen fluxes, the discrepancies between OCEL and far-IR measurements imply that of photons are not accounted for in the extinction-corrected optical measurements (Fig. 7). However, this estimate of the missing-photon fraction is likely exaggerated. The elevated N+/O++ ratio identified from far-IR emission relative to the OCEL emission points to a higher abundance, resulting from higher N/O, and/or lower ionization in the obscured gas. This picture can naturally explain the large discrepancy in the N+/H+ ratio between the far-IR and the OCEL method without invoking an unrealistic degree of temperature fluctuations, and is also consistent with the results from Mrk 71 reported by C23, where we found no significant difference between the far-IR and OCEL O++/H+ ratio. The major difference between Mrk 71 and Haro 3 is that Haro 3 exhibits substantially () higher dust attenuation, while Mrk 71 has significantly less dust () with much lower metallicity ( from far-IR), and hence is less likely to contain a large fraction of dust-obscured gas.
This inference regarding dust-obscured gas is further supported by the significant range in dust content estimations reported across various studies. Notably, Johnson et al. (2004) and Hunt et al. (2006) have documented that visual extinction () values can vary extensively, ranging from 0.5 to 8, depending on the method of measurement and the spectral region analyzed. Furthermore, Hunt et al. (2006) employed photoionization modeling of mid-infrared (mid-IR) emission lines and found evidence supporting the concurrent presence of a low-dust optical emitting component alongside a dust-obscured component that is optically invisible. This broad range of inferred dust content highlights the profound influence that obscured gas can exert on our understanding of the chemical composition of H II regions.
Models incorporating two distinct phases of gas with distinct temperatures have also been posited as an alternative explanation for the ADF compared to models based on a continuous temperature distribution (e.g., Liu et al., 2000; Stasińska, 2002; Tsamis et al., 2003). In these models, Zhang et al. (2007) have noted that the inclusion of even a minor fraction () of low-temperature gas ( K) could replicate the observed -dex ADF. Meanwhile, it is plausible to consider that these cooler, denser clumps are in pressure equilibrium with their surroundings and possess a higher dust content, as Stasińska et al. (2007) proposed that these dense clumps could be notably metal-rich, adding another layer of complexity to the understanding of H II regions. To disentangle the effects of temperature, density, and dust on the observed ADF and to accurately gauge gas-phase abundances, a promising approach involves the utilization of fine-structure emission lines in the mid-IR. These lines are relatively unaffected by fluctuations in either or , offering a more reliable method for metallicity measurements. Additionally, leveraging mid-IR H Humphreys emission lines circumvents the complications of dust attenuation. Our group is actively exploring this avenue in future work.
5 Summary
In this study, we conducted a detailed examination of and metallicity from O++ and N+ ions using optical and far-IR spectra of Haro 3, a nearby H II region. The analysis incorporated data from Herschel/PACS, SOFIA/FIFI-LS, and the recently commissioned red channel of Keck/KCWI. The combined capabilities of these three IFU instruments, covering optical and far-IR spectra, enabled precise aperture matching and robust comparisons of absolute fluxes. Our approach has yielded the first abundance discrepancy factor (ADF) measurements for both O++ and N+ in a single astronomical object. The principal findings of this research include:
-
•
To explain the ADF measured from the [N II] far-IR vs. OCEL method, temperature fluctuations would have to be unphysically large. The similar N+/O++ ratios observed between the far-IR and OCEL lines indicate that dust obscuration is the main cause of the disparity. This is supported by previous work indicating the presence of infrared emission from heavily obscured regions.
-
•
Assuming identical properties for both obscured and unobscured gas, the estimated fraction of obscured gas is . Nonetheless, the actual proportion of obscured gas could be lower, as suggested by the elevated N+/O++ ratios measured in far-IR lines, which imply that the obscured gas may have higher N/O abundance and/or lower ionization levels.
-
•
The [O III] far-IR vs. OCEL and RL vs. OCEL methods yield consistent measurements that align with typical values inferred from RL abundances in H II regions. However, the presence of heavily dust-obscured gas would imply a smaller value, and that temperature fluctuations alone do not fully account for the observed ADF.
-
•
Non-thermal effects, i.e., a distribution, fail to reconcile the differences between far-IR and OCEL emissions. This model would require a disproportionate injection of high-energy plasma for N+ compared to O++, which contradicts their respective ionization levels.
-
•
Spatial variations of are present in Haro 3. However, the amount of fluctuations is insufficient to significantly modulate the metallicity measurements.
-
•
The relative ratios in the O II V1 RL multiplet are mutually inconsistent, and suggest a higher compared to other density measurements. These inconsistencies necessitate a reevaluation of the RL emission mechanism and/or the atomic data for O II . However, the extent of this discrepancy in does not significantly impact the conclusions.
Our findings underscore the importance of resolving the origin of the ADF and establishing an accurate metallicity scale. The far-IR fine-structure emission used in this study presents a powerful tool for evaluating the impact of temperature fluctuations in H II regions, and for cross-validating the results with multiple ions. The combination of far-IR and optical spectra, as utilized here, is especially relevant in light of the strong and auroral line measurements obtained at high redshifts with ALMA and JWST, now reaching . Furthermore, recent ALMA observations have found spatial offsets for the dust continuum and far-IR line emission relative to the UV stellar continuum at , suggesting a complex dust geometry (e.g., Hodge et al., 2012; Laporte et al., 2017; Matthee et al., 2019; Fujimoto et al., 2022; Killi et al., 2024). Our analysis of Haro 3 exemplifies the potential of such measurements to understand the biases inherent in different metallicity measurement techniques, highlighting both their potential and the associated challenges.
However, this study of Haro 3, along with Mrk 71 in C23, covers only a limited portion of the parameter space of H II regions. These cases underline the necessity for a broader investigation to understand the implications for all H II regions across cosmic history. A comprehensive dataset of H II regions, characterized by similarly detailed metallicity measurements under a variety of physical conditions, will be essential to this endeavor. Furthermore, spatially resolved measurements in both optical and IR spectra, including mid-IR observations via JWST, provide crucial opportunities to analyze and address the heterogeneity within H II regions. Notably, mid-IR features such as the H Humphrey lines and the [S III] and [Ne III] lines are relatively unaffected by variations in temperature, density, and dust content, offering more reliable diagnostic capabilities. Leveraging archival far-IR data combined with JWST mid-IR spectroscopy of nearby H II regions offers tremendous potential to unravel the underlying causes of the ADF and to refine our understanding of the true metallicity scale, as well as the complex properties of gaseous nebulae. Our team is committed to driving these investigations forward in future studies.
Appendix A Line Fluxes
Here, we provide a summary (Table 2) of the line flux measurements. The fluxes are measured from 1D spectra extracted from Keck/KCWI, SOFIA/FIFI-LS, and Herschel/PACS from two apertures: 1) for the KCWI PSF, 2) after the PSF is matched to the SOFIA/FIFI-LS [O III] 52 data cube, and 3) the aperture-matched and attenuation-corrected line instensities. The errors quoted in this table are from pure Poisson noise from observations, and do not include systematic uncertainties from flux calibration and attenuation correction. For details on how 1D spectra are extracted and fluxes are measured, see §3.1.
| Line | aaRest-frame air wavelengths. | = 225) | bbDust-corrected aperture-matched intensity. | |
|---|---|---|---|---|
| () | () | |||
| [O II] | 3726.03 | |||
| [O II] | 3728.82 | |||
| H | 3797.90 | |||
| H | 3835.39 | |||
| H | 3889.05 | |||
| H | 4340.47 | |||
| [O III] | 4363.21 | |||
| O II | 4638.86 | — | ||
| O II | 4641.81 | — | ||
| O II | 4649.13 | — | ||
| O II | 4650.84 | — | ||
| O II | 4661.63 | — | ||
| O II | 4676.23 | — | ||
| [Ar IV] | 4711.37 | |||
| [Ar IV] | 4740.16 | |||
| H | 4861.33 | |||
| [O III] | 4958.91 | |||
| [O III] | 5006.84 | |||
| [Cl III] | 5517.71 | |||
| [Cl III] | 5537.88 | |||
| [N II] | 5754.64 | |||
| [N II] ccMeasured simultaenously with fixed [N II] 6583/6548 ratio of 2.942. | 6548.03 | |||
| H | 6562.82 | |||
| [N II] ccMeasured simultaenously with fixed [N II] 6583/6548 ratio of 2.942. | 6583.41 | |||
| [S II] | 6716.47 | |||
| [S II] | 6730.85 | |||
| [O II] | auroralddTotal flux of the [O II] 7318.39, 7319.99, 7329.66, and 7330.73 auroral emission lines. | |||
| P14 | 8598.39 | |||
| P10 | 9014.91 | |||
| [O III] | 51.8145 | — | ||
| [O III] | 88.3564 | — | ||
| [N II] | 121.769 | — | ||
References
- Alloin et al. (1979) Alloin, D., Collin-Souffrin, S., Joly, M., & Vigroux, L. 1979, A&A, 78, 200
- Almeida et al. (2023) Almeida, A., Anderson, S. F., Argudo-Fernández, M., et al. 2023, ApJS, 267, 44, doi: 10.3847/1538-4365/acda98
- Annibali & Tosi (2022) Annibali, F., & Tosi, M. 2022, Nature Astronomy, 6, 48, doi: 10.1038/s41550-021-01575-x
- Arthur et al. (2011) Arthur, S. J., Henney, W. J., Mellema, G., de Colle, F., & Vázquez-Semadeni, E. 2011, MNRAS, 414, 1747, doi: 10.1111/j.1365-2966.2011.18507.x
- Astropy Collaboration et al. (2013) Astropy Collaboration, Robitaille, T. P., Tollerud, E. J., et al. 2013, A&A, 558, A33, doi: 10.1051/0004-6361/201322068
- Astropy Collaboration et al. (2018) Astropy Collaboration, Price-Whelan, A. M., Sipőcz, B. M., et al. 2018, AJ, 156, 123, doi: 10.3847/1538-3881/aabc4f
- Astropy Collaboration et al. (2022) Astropy Collaboration, Price-Whelan, A. M., Lim, P. L., et al. 2022, ApJ, 935, 167, doi: 10.3847/1538-4357/ac7c74
- Belokurov & Kravtsov (2023) Belokurov, V., & Kravtsov, A. 2023, MNRAS, 525, 4456, doi: 10.1093/mnras/stad2241
- Berg et al. (2018) Berg, D. A., Erb, D. K., Auger, M. W., Pettini, M., & Brammer, G. B. 2018, ApJ, 859, 164, doi: 10.3847/1538-4357/aab7fa
- Berg et al. (2012) Berg, D. A., Skillman, E. D., Marble, A. R., et al. 2012, ApJ, 754, 98, doi: 10.1088/0004-637X/754/2/98
- Binette et al. (2002) Binette, L., González-Gómez, D. I., & Mayya, Y. D. 2002, Rev. Mexicana Astron. Astrofis., 38, 279, doi: 10.48550/arXiv.astro-ph/0210646
- Brinchmann et al. (2004) Brinchmann, J., Charlot, S., White, S. D. M., et al. 2004, MNRAS, 351, 1151, doi: 10.1111/j.1365-2966.2004.07881.x
- Bunker et al. (2023) Bunker, A. J., Saxena, A., Cameron, A. J., et al. 2023, A&A, 677, A88, doi: 10.1051/0004-6361/202346159
- Cameron et al. (2023) Cameron, A. J., Katz, H., Rey, M. P., & Saxena, A. 2023, MNRAS, 523, 3516, doi: 10.1093/mnras/stad1579
- Cardelli et al. (1989) Cardelli, J. A., Clayton, G. C., & Mathis, J. S. 1989, ApJ, 345, 245, doi: 10.1086/167900
- Charbonnel et al. (2023) Charbonnel, C., Schaerer, D., Prantzos, N., et al. 2023, A&A, 673, L7, doi: 10.1051/0004-6361/202346410
- Chen et al. (2023) Chen, Y., Jones, T., Sanders, R., et al. 2023, Nature Astronomy, 7, 771, doi: 10.1038/s41550-023-01953-7
- Cormier et al. (2015) Cormier, D., Madden, S. C., Lebouteiller, V., et al. 2015, A&A, 578, A53, doi: 10.1051/0004-6361/201425207
- Crameri (2018) Crameri, F. 2018, Scientific colour maps, 4.0.0, Zenodo, doi: 10.5281/zenodo.2649252
- D’Antona et al. (2023) D’Antona, F., Vesperini, E., Calura, F., et al. 2023, A&A, 680, L19, doi: 10.1051/0004-6361/202348240
- Davé et al. (2017) Davé, R., Rafieferantsoa, M. H., Thompson, R. J., & Hopkins, P. F. 2017, MNRAS, 467, 115, doi: 10.1093/mnras/stx108
- Dopita et al. (2013) Dopita, M. A., Sutherland, R. S., Nicholls, D. C., Kewley, L. J., & Vogt, F. P. A. 2013, ApJS, 208, 10, doi: 10.1088/0067-0049/208/1/10
- Esteban et al. (2009) Esteban, C., Bresolin, F., Peimbert, M., et al. 2009, ApJ, 700, 654, doi: 10.1088/0004-637X/700/1/654
- Esteban et al. (2014) Esteban, C., García-Rojas, J., Carigi, L., et al. 2014, MNRAS, 443, 624, doi: 10.1093/mnras/stu1177
- Fadda et al. (2023) Fadda, D., Colditz, S., Fischer, C., et al. 2023, AJ, 166, 237, doi: 10.3847/1538-3881/acffb4
- Fischer et al. (2018) Fischer, C., Beckmann, S., Bryant, A., et al. 2018, Journal of Astronomical Instrumentation, 7, 1840003, doi: 10.1142/S2251171718400032
- Foreman-Mackey et al. (2013) Foreman-Mackey, D., Hogg, D. W., Lang, D., & Goodman, J. 2013, PASP, 125, 306, doi: 10.1086/670067
- Froese Fischer & Tachiev (2004) Froese Fischer, C., & Tachiev, G. 2004, Atomic Data and Nuclear Data Tables, 87, 1, doi: 10.1016/j.adt.2004.02.001
- Fujimoto et al. (2022) Fujimoto, S., Brammer, G. B., Watson, D., et al. 2022, Nature, 604, 261, doi: 10.1038/s41586-022-04454-1
- Fujimoto et al. (2023) Fujimoto, S., Finkelstein, S. L., Burgarella, D., et al. 2023, ApJ, 955, 130, doi: 10.3847/1538-4357/aceb67
- García-Benito et al. (2010) García-Benito, R., Díaz, A., Hägele, G. F., et al. 2010, MNRAS, 408, 2234, doi: 10.1111/j.1365-2966.2010.17269.x
- Giammanco & Beckman (2005) Giammanco, C., & Beckman, J. E. 2005, A&A, 437, L11, doi: 10.1051/0004-6361:200500129
- Hodge et al. (2012) Hodge, J. A., Carilli, C. L., Walter, F., et al. 2012, ApJ, 760, 11, doi: 10.1088/0004-637X/760/1/11
- Hunt et al. (2006) Hunt, L. K., Thuan, T. X., Sauvage, M., & Izotov, Y. I. 2006, ApJ, 653, 222, doi: 10.1086/508867
- Isobe et al. (2023) Isobe, Y., Ouchi, M., Tominaga, N., et al. 2023, ApJ, 959, 100, doi: 10.3847/1538-4357/ad09be
- Izotov et al. (2006) Izotov, Y. I., Stasińska, G., Meynet, G., Guseva, N. G., & Thuan, T. X. 2006, A&A, 448, 955, doi: 10.1051/0004-6361:20053763
- Izotov et al. (2012) Izotov, Y. I., Thuan, T. X., & Guseva, N. G. 2012, A&A, 546, A122, doi: 10.1051/0004-6361/201219733
- James et al. (2015) James, B. L., Koposov, S., Stark, D. P., et al. 2015, MNRAS, 448, 2687, doi: 10.1093/mnras/stv175
- Jin et al. (2023) Jin, Y., Sutherland, R., Kewley, L. J., & Nicholls, D. C. 2023, ApJ, 958, 179, doi: 10.3847/1538-4357/acffb5
- Johnson et al. (2004) Johnson, K. E., Indebetouw, R., Watson, C., & Kobulnicky, H. A. 2004, AJ, 128, 610, doi: 10.1086/422017
- Jones et al. (2020) Jones, T., Sanders, R., Roberts-Borsani, G., et al. 2020, ApJ, 903, 150, doi: 10.3847/1538-4357/abb943
- Kauffmann et al. (2003) Kauffmann, G., Heckman, T. M., White, S. D. M., et al. 2003, MNRAS, 341, 33, doi: 10.1046/j.1365-8711.2003.06291.x
- Kewley & Ellison (2008) Kewley, L. J., & Ellison, S. L. 2008, ApJ, 681, 1183, doi: 10.1086/587500
- Killi et al. (2024) Killi, M., Ginolfi, M., Popping, G., et al. 2024, arXiv e-prints, arXiv:2402.07982, doi: 10.48550/arXiv.2402.07982
- Kobayashi & Ferrara (2024) Kobayashi, C., & Ferrara, A. 2024, ApJ, 962, L6, doi: 10.3847/2041-8213/ad1de1
- Laporte et al. (2017) Laporte, N., Ellis, R. S., Boone, F., et al. 2017, ApJ, 837, L21, doi: 10.3847/2041-8213/aa62aa
- Liu et al. (2000) Liu, X. W., Storey, P. J., Barlow, M. J., et al. 2000, MNRAS, 312, 585, doi: 10.1046/j.1365-8711.2000.03167.x
- Luridiana et al. (2015) Luridiana, V., Morisset, C., & Shaw, R. A. 2015, A&A, 573, A42, doi: 10.1051/0004-6361/201323152
- Magrini et al. (2018) Magrini, L., Vincenzo, F., Randich, S., et al. 2018, A&A, 618, A102, doi: 10.1051/0004-6361/201833224
- Maiolino & Mannucci (2019) Maiolino, R., & Mannucci, F. 2019, A&A Rev., 27, 3, doi: 10.1007/s00159-018-0112-2
- Marques-Chaves et al. (2024) Marques-Chaves, R., Schaerer, D., Kuruvanthodi, A., et al. 2024, A&A, 681, A30, doi: 10.1051/0004-6361/202347411
- Matthee et al. (2019) Matthee, J., Sobral, D., Boogaard, L. A., et al. 2019, ApJ, 881, 124, doi: 10.3847/1538-4357/ab2f81
- Méndez-Delgado et al. (2023a) Méndez-Delgado, J. E., Esteban, C., García-Rojas, J., Kreckel, K., & Peimbert, M. 2023a, Nature, 618, 249, doi: 10.1038/s41586-023-05956-2
- Méndez-Delgado et al. (2023b) Méndez-Delgado, J. E., Esteban, C., García-Rojas, J., et al. 2023b, MNRAS, 523, 2952, doi: 10.1093/mnras/stad1569
- Mingozzi et al. (2022) Mingozzi, M., James, B. L., Arellano-Córdova, K. Z., et al. 2022, ApJ, 939, 110, doi: 10.3847/1538-4357/ac952c
- Morrissey et al. (2018) Morrissey, P., Matuszewski, M., Martin, D. C., et al. 2018, ApJ, 864, 93, doi: 10.3847/1538-4357/aad597
- Nagele & Umeda (2023) Nagele, C., & Umeda, H. 2023, ApJ, 949, L16, doi: 10.3847/2041-8213/acd550
- Nandal et al. (2024) Nandal, D., Regan, J. A., Woods, T. E., et al. 2024, arXiv e-prints, arXiv:2402.03428, doi: 10.48550/arXiv.2402.03428
- Nicholls et al. (2012) Nicholls, D. C., Dopita, M. A., & Sutherland, R. S. 2012, ApJ, 752, 148, doi: 10.1088/0004-637X/752/2/148
- Nicholls et al. (2013) Nicholls, D. C., Dopita, M. A., Sutherland, R. S., Kewley, L. J., & Palay, E. 2013, ApJS, 207, 21, doi: 10.1088/0067-0049/207/2/21
- Nomoto et al. (2013) Nomoto, K., Kobayashi, C., & Tominaga, N. 2013, ARA&A, 51, 457, doi: 10.1146/annurev-astro-082812-140956
- O’Sullivan & Chen (2020) O’Sullivan, D., & Chen, Y. 2020, arXiv e-prints, arXiv:2011.05444, doi: 10.48550/arXiv.2011.05444
- Pascale et al. (2023) Pascale, M., Dai, L., McKee, C. F., & Tsang, B. T. H. 2023, ApJ, 957, 77, doi: 10.3847/1538-4357/acf75c
- Peimbert et al. (2005) Peimbert, A., Peimbert, M., & Ruiz, M. T. 2005, ApJ, 634, 1056, doi: 10.1086/444557
- Peimbert et al. (2017) Peimbert, M., Peimbert, A., & Delgado-Inglada, G. 2017, PASP, 129, 082001, doi: 10.1088/1538-3873/aa72c3
- Peimbert et al. (1993) Peimbert, M., Storey, P. J., & Torres-Peimbert, S. 1993, ApJ, 414, 626, doi: 10.1086/173108
- Peng et al. (2021) Peng, B., Lamarche, C., Stacey, G. J., et al. 2021, ApJ, 908, 166, doi: 10.3847/1538-4357/abd4e2
- Phillips (2007) Phillips, J. P. 2007, MNRAS, 380, 369, doi: 10.1111/j.1365-2966.2007.12078.x
- Pilyugin et al. (2012) Pilyugin, L. S., Grebel, E. K., & Mattsson, L. 2012, MNRAS, 424, 2316, doi: 10.1111/j.1365-2966.2012.21398.x
- Poglitsch et al. (2010) Poglitsch, A., Waelkens, C., Geis, N., et al. 2010, A&A, 518, L2, doi: 10.1051/0004-6361/201014535
- Prusinski & Chen (2024) Prusinski, N. Z., & Chen, Y. 2024, KCWIKit: KCWI Post-Processing and Improvements, Astrophysics Source Code Library, record ascl:2404.003
- Rickards Vaught et al. (2023) Rickards Vaught, R. J., Sandstrom, K. M., Belfiore, F., et al. 2023, arXiv e-prints, arXiv:2309.17440, doi: 10.48550/arXiv.2309.17440
- Sanders et al. (2021) Sanders, R. L., Shapley, A. E., Jones, T., et al. 2021, ApJ, 914, 19, doi: 10.3847/1538-4357/abf4c1
- Sanders et al. (2023) Sanders, R. L., Shapley, A. E., Clarke, L., et al. 2023, ApJ, 943, 75, doi: 10.3847/1538-4357/aca9cc
- Sankrit & Hester (2000) Sankrit, R., & Hester, J. J. 2000, ApJ, 535, 847, doi: 10.1086/308872
- Schlafly & Finkbeiner (2011) Schlafly, E. F., & Finkbeiner, D. P. 2011, ApJ, 737, 103, doi: 10.1088/0004-637X/737/2/103
- Senchyna et al. (2023) Senchyna, P., Plat, A., Stark, D. P., & Rudie, G. C. 2023, arXiv e-prints, arXiv:2303.04179, doi: 10.48550/arXiv.2303.04179
- Stanway & Eldridge (2018) Stanway, E. R., & Eldridge, J. J. 2018, MNRAS, 479, 75, doi: 10.1093/mnras/sty1353
- Stasińska (2000) Stasińska, G. 2000, New A Rev., 44, 275, doi: 10.1016/S1387-6473(00)00060-9
- Stasińska (2002) Stasińska, G. 2002, in Revista Mexicana de Astronomia y Astrofisica Conference Series, Vol. 12, Revista Mexicana de Astronomia y Astrofisica Conference Series, ed. W. J. Henney, J. Franco, & M. Martos, 62–69, doi: 10.48550/arXiv.astro-ph/0102403
- Stasińska et al. (2007) Stasińska, G., Tenorio-Tagle, G., Rodríguez, M., & Henney, W. J. 2007, A&A, 471, 193, doi: 10.1051/0004-6361:20065675
- Steel et al. (1996) Steel, S. J., Smith, N., Metcalfe, L., Rabbette, M., & McBreen, B. 1996, A&A, 311, 721
- Steidel et al. (2016) Steidel, C. C., Strom, A. L., Pettini, M., et al. 2016, ApJ, 826, 159, doi: 10.3847/0004-637X/826/2/159
- Storey et al. (2014) Storey, P. J., Sochi, T., & Badnell, N. R. 2014, MNRAS, 441, 3028, doi: 10.1093/mnras/stu777
- Storey et al. (2017) Storey, P. J., Sochi, T., & Bastin, R. 2017, MNRAS, 470, 379, doi: 10.1093/mnras/stx1189
- Storey & Zeippen (2000) Storey, P. J., & Zeippen, C. J. 2000, MNRAS, 312, 813, doi: 10.1046/j.1365-8711.2000.03184.x
- Tayal (2011) Tayal, S. S. 2011, ApJS, 195, 12, doi: 10.1088/0067-0049/195/2/12
- Topping et al. (2024) Topping, M. W., Stark, D. P., Senchyna, P., et al. 2024, MNRAS, 529, 3301, doi: 10.1093/mnras/stae682
- Torrey et al. (2019) Torrey, P., Vogelsberger, M., Marinacci, F., et al. 2019, MNRAS, 484, 5587, doi: 10.1093/mnras/stz243
- Tremonti et al. (2004) Tremonti, C. A., Heckman, T. M., Kauffmann, G., et al. 2004, ApJ, 613, 898, doi: 10.1086/423264
- Tsamis et al. (2003) Tsamis, Y. G., Barlow, M. J., Liu, X. W., Danziger, I. J., & Storey, P. J. 2003, MNRAS, 338, 687, doi: 10.1046/j.1365-8711.2003.06081.x
- Vincenzo et al. (2016) Vincenzo, F., Belfiore, F., Maiolino, R., Matteucci, F., & Ventura, P. 2016, MNRAS, 458, 3466, doi: 10.1093/mnras/stw532
- Yang et al. (2023) Yang, S., Lidz, A., Smith, A., Benson, A., & Li, H. 2023, MNRAS, 525, 5989, doi: 10.1093/mnras/stad2571
- Zhang et al. (2007) Zhang, Y., Ercolano, B., & Liu, X. W. 2007, A&A, 464, 631, doi: 10.1051/0004-6361:20066564