black
A new parametrization of Hubble parameter and Hubble tension
Abstract
We present a new Hubble parameterization method and employ observational data from Hubble, Pantheon, and Baryon Acoustic Oscillations to constrain model parameters. The proposed method is thoroughly validated against these datasets, demonstrating a robust fit to the observational Hubble, Pantheon, and BAO data. The obtained best-fit values are , , and , consistent with the Planck 2018 results, highlighting the existence of Hubble tension.
I Introduction
Hubble constant () is a fundamental parameter that can quantify the rate of cosmic expansion. It is frequently employed to elucidate the motion of celestial bodies, such as galaxies, relative to the observer’s position. In recent decades, measurements of the Hubble constant have garnered attention within the scientific community due to notable discrepancies among results obtained from diverse measurement methodologies and data sources [1]. Early measurements of the Hubble constant often entailed observations of primordial cosmic signals, such as the cosmic microwave background radiation (CMB). For instance, using the CDM standard cosmological model, a Hubble constant of was derived [2]. Integrated Baryon Acoustic Oscillations (BAO) measurements with cosmic microwave background (CMB) data from WMAP resulted in [3]. Early Hubble constant measurements consistently indicate values lower than 70 [4, 5]. The age of an old quasar APM 08279+5255 at also tends to support a lower Hubble constant [6]
Later Hubble constant measurements primarily rely on astrophysical observations such as supernovae and galaxies. A result of was derived based on the Cepheid-SN (Cepheid-supernova) sample [7]. According to [8], they employed a joint analysis of six strongly lensed gravitational lensing events with measured time delays, providing a Hubble constant estimate of . The detection of gravitational wave events from neutron star mergers by LIGO and Virgo yielded an estimate of in 2017. Using the Hubble Space Telescope, the Hubble constant was directly measured as through the distance ladder method, providing calibration for the magnitude-redshift relation for 253 Type Ia supernovae [9]. It is evident that numerous late-time measurements favor with a minority reporting a value of .
Observations of the early universe, including CMB data, typically yield lower values for the Hubble constant (). Conversely, measurements of celestial bodies at closer distances, such as supernovae and other large-scale cosmic structures, result in higher values for . The inconsistency between the results obtained from these two methods has captured the attention of researchers. This disparity is referred to as the Hubble tension [4, 10, 11], and the statistical significance of these differences surpasses the range of measurement errors, prompting significant discussion and research. The existence of Hubble tension suggests the possibility of unknown physical processes or issues in observational systems concerning the evolution and nature of the universe [4, 12, 13, 14, 15]. Efforts to address this issue include improvements in data analysis, reduction of systematic errors, the adoption of new observational methods, and a re-examination of cosmological models.
In addressing the Hubble tension, Lin et al. [16] proposed a potential resolution in the Early Dark Sector (EDS), where dark matter mass depends on the Early Dark Energy (EDE) scalar field. They explored a Plank-suppressed EDE coupled with dark matter, finding that this Triggered Early Dark Sector (tEDS) model naturally resolves the coincidence problem of EDE on the background level. Fitting the current cosmological data, including local distance gradients and low-redshift amplitudes of fluctuations, they obtained a Hubble constant of . In the presence of non-standard cosmology, a reconciliation between CMB and local measurements has yielded [17]. According to [18], they explored a novel dark fluid model known as the Exponential Acoustic Dark Energy (eADE) model to alleviate the tension in the Hubble telescope. Comparisons with the standard model resulted in . Some dynamical dark energy models, see for example [19, 20, 21, 22, 23, 24, 25, 26, 27, 28, 29, 30, 31, 32, 33, 34], could also reduce the Hubble tension.
In this paper, we proposed a novel Hubble parameterization method and constrained the model parameters using observations from Hubble parameter (Hubble for short later), Pantheon, and BAO data. The results indicate that the Hubble tension may also exist between the Hubble+Pantheon+BAO data and the measurements from local Cepheid–type Ia supernova distance ladder.
The script is structured as follows: In Sec. II, we have proposed a new parameterisation method for Hubble parameters. In Sec. III, utilizing the Markov Chain Monte Carlo (MCMC) method, we constrains the cosmological model parameters, namely , , and , using the Hubble dataset, the Hubble+Pantheon dataset, and the Hubble+Pantheon+BAO dataset. Sec IV presents the result and Sec V is the conclusion of the study.
II A new parametrization of Hubble parameter
According to the Planck 2018 results, the spacetime is spatially flat: [2], so here we consider a flat Friedmann-Robertson-Walker-Lemaître (FRWL) spacetime
| (1) |
where is the scale factor. We use the unit here. The Friedmann equations take the form
| (2) |
where is the matter density at present time and represents contributions from dark energy and can be expressed as
| (3) |
where is the equation of state (EoS) of dark energy. For CDM model, and . For a constant EoS , we have and
| (4) |
There are usually two way to parameterize dark energy: one way is to parameterize the EoS (such as the widely used CPL parameterization model [35, 36]), the other is to directly parameterize the Hubble parameter. Here we adopt the latter approach. Since the Hubble tension mainly rises from Planck 2018 (based on CDM model) and Cepheid calibrated supernovae Ia measurements [37], we consider a parameterization slightly different from CDM. Furthermore, since the degeneracy between parameters could affect the fitting results, we consider the model with as few parameters as possible. The Hubble parameter we suggest takes the following form
| (5) |
where is a constant. This parameterization model is simperer than Eq. (4), though they are equivalent via .
In the next section of our investigation, we employed multiple observational data, including Hubble parameter data, Pantheon samples, and BAO data. We utilized the MCMC method to constrain the model parameters , , and .
III Observational data and methodology
In the previous section, we discussed a novel Hubble parameterization method, and now we aim to validate whether the approximate values of the model parameters can effectively describe the current universe based on observational data. We primarily employed three datasets, namely the Hubble dataset with 62 data points, the Pantheon dataset with 1701 data points, and a set of six Baryon BAO datasets. For numerical analysis and parameter constraints using the mentioned datasets, we utilized the emcee code [38]. Additionally, to understand the outcomes of the MCMC study, we employed 64 walkers and 2000 steps across all datasets. And the final results will be discussed in the form of 2D contour plots with 1- and 2- errors.
III.1 Observational Hubble data
Utilizing Hubble observational data to constrain cosmological models is a significant methodology. This approach involves measuring the historical expansion of the universe to derive constraints on cosmological parameters. The Hubble parameter, denoted as , characterizes the rate of cosmic expansion and serves as a fundamental cosmological quantity. Its dependence on redshift () provides essential insights into the cosmic evolution [39, 40].
| (6) |
In this part, is obtained through spectroscopic surveys, making a measurement of a means to derive the model-independent value of the Hubble parameter. The data set we use consists of 34 measurements obtained by calculating the differential ages of galaxies, which is called cosmic chronometer [41, 42, 43, 44, 45, 42, 46], and 28 measurements inferred from the BAO peak in the galaxy power spectrum [47, 48, 49, 50, 51, 52, 53, 54, 55, 56, 57, 58, 59], as collected in [60]. As the data provided by the DA method is independent of cosmological models, it can be employed to explore alternative cosmological models. The range of these data points is 0 1.965. Furthermore, we have adopted an intermediate value of km/s/Mpc for our analysis [61]. To determine the mean values of the model parameters , and (using maximum likelihood analysis), we employed the chi-square function as follows [62]:
| (7) |
The theoretical value of the Hubble parameter is denoted as , the observed value as , and represents the standard error of the observed values at redshift .
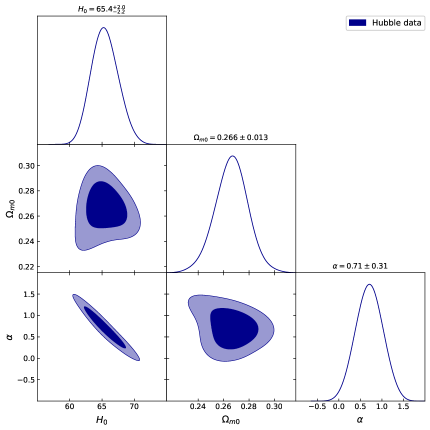
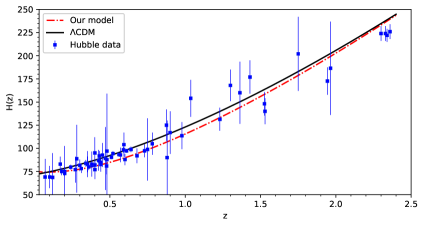
As shown in Figure 1, we obtained the best-fitting values for the model parameters , , and , along with 1- and 2- confidence level contours. The best-fitting values are = , = and = at 1- and confidence level. Additionally, in Figure 2, we present error bar plots for the aforementioned Hubble data, compared with the CDM model ( km/s/Mpc and ) [2]. The model proposed here effectively captures the observed Hubble dataset.
III.2 Observational Pantheon data
SNe Ia commonly known as standard candles, serve as powerful distance probes for studying the cosmological dynamics of the universe. Over the past two decades, the sample size of SNe Ia datasets has steadily increased. We employed the largest supernova Ia sample to date, Pantheon+, which amalgamates data from various surveys such as the Sloan Digital Sky Survey (SDSS), the SNe Legacy Survey (SNLS), the Hubble Space Telescope (HST) survey, and others, comprising 1701 confirmed supernovae from 18 different surveys [63, 7]. The Pantheon+ dataset spans a redshift range of z (0.0012, 2.2614), with a notable increase in the number of SNe at low redshifts. We need to fit the model parameters by comparing the theoretical distance modulus values with the observed values. Each distance modulus can be computed using the following formula:
| (8) |
The luminosity distance is
| (9) |
The chi-square function about the Pantheon data is
| (10) |
In this expression, represents the covariance matrix, as introduced by Suzuki [64]. Additionally, is defined as the disparity between the observed distance modulus value, derived from cosmic data, and its theoretical counterpart generated from the model using the parameter space , and .
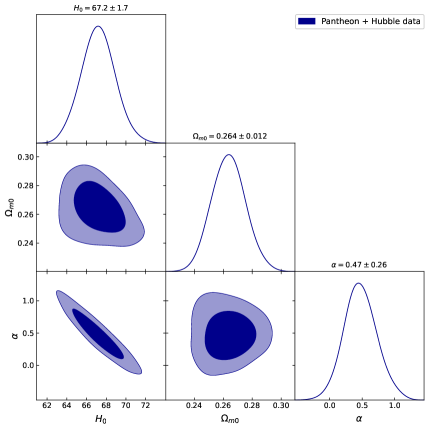
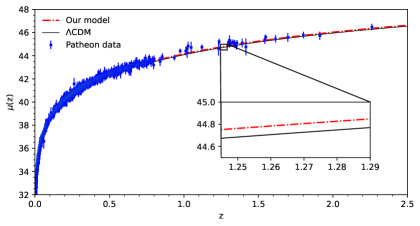
Taking as the minimum constraint for the model parameters , , and , we obtained the best-fit values for these parameters using the Hubble parameter and Pantheon data, as shown in Figure 3 with 1- and 2- confidence level contours. The best-fit values are = , = and = at 1- confidence level. Additionally, in Figure 4, we present the error bar plot for the aforementioned supernova data, comparing our model with the CDM model ( km/s/Mpc and ) [2]. The model proposed here demonstrates a good fit to the Hubble+Pantheon dataset.
III.3 Observational Baryon Acoustic Oscillations data
BAO arises from acoustic density waves in the early universe’s primordial plasma, causing fluctuations in the observable baryonic matter density in the cosmos.
Detecting BAO involves large-scale surveys and redshift measurements to gather information about the large-scale structure of the universe. BAO detectors offer highly precise measurements of large-scale structures, largely unaffected by uncertainties in the nonlinear evolution of the matter density field and other systematic errors. They are considered a standard ruler for measuring the cosmological background evolution [65]. To improve statistical significance, broaden the redshift range, and gain more comprehensive cosmological insights, we utilize the combined data from six different BAO measurements at various redshifts [66, 67, 68].
The information taken from the BAO peaks in the matter power spectrum can be used to determine the Hubble parameter and the angular diameter distance which takes the form
| (11) |
The combination of the angular diameter distance and the Hubble parameter, , is given by [69]
| (12) |
The chi-square function about BAO is given by the following expression
| (13) |
where
The inverse covariance matrix is represented in [68]. The six BAO datasets are provided in Table 1. At , photon decoupling occurred, allowing the CMB to propagate through the universe, eventually becoming the observed cosmic microwave background radiation today. This redshift value is derived through detailed observations and analysis of the CMB [70].
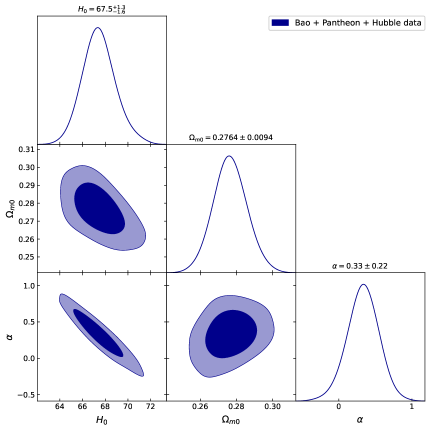
By minimizing + to constrain the model parameters , , and , we determined the best-fit values using the Hubble+Pantheon+BAO dataset, as illustrated in Figure 5. The resulting values are , , and , at 1- confidence level. Table 2 presents the best-fit values and their corresponding uncertainties obtained from three independent simulations of the model using different datasets. We observed that with an increasing volume of data, the effectiveness of our model fitting in constraining parameters improves progressively.
| Data | |||
|---|---|---|---|
| Prior | |||
| Hubble | |||
| Hubble+Pantheon | |||
| Hubble+Pantheon+BAO |
IV Results
In this section, We discussed the results in Sec III. We leveraged multiple observational datasets, including Hubble, Hubble+Pantheon samples and Hubble+Pantheon+BAO data [71]. Employing the MCMC method, we finally constrained the model parameters , , and .
Firstly, the Hubble dataset, consisting of 62 data points, is utilized to quantify the historical expansion of the universe. In Figure 1, the best-fitting values for the model parameters are determined as , , and . It can be observed that the fitting parameters have relatively large uncertainties, and a significant contributing factor is the limited amount of data. In Figure 2, we can find that our model is relatively close to the CDM model, and it fits well with the observational data. Next, in order to reduce the uncertainties in the parameters, we have incorporated 1701 observational data points from the Pantheon dataset [61]. Figure 3 presents the fitting results: , = and =. It is observed that the error in has decreased. In Figure 4, our model is seen to fit well with the observational data from Pantheon and is close to the CDM model. Next, we included an additional 6 BAO data points and obtained the fitting results: , , and . In Table 2, we can find with the increase in the observational data size, the constraints on the parameters , , and become progressively more accurate. To validate the model’s efficacy, we compared error bar plots for Hubble and Pantheon datasets with the CDM model. Consistently, the model fits the observed dataset very well.
V Conclusions
In conclusion, we proposed a novel Hubble parameterization method and constrained the model parameters using observations from Hubble, Pantheon, and BAO. This model is validated with Hubble, Pantheon, and BAO data, providing best-fit values for , , and , consistent well with the Planck 2018 data ( Km/s/Mpc [2]), but deviating from Cepheid-supernova observation ( [7]) by more than 4 . The Hubble tension was mainly triggered with the higher Hubble constant ( [7]) estimated from the local Cepheid–type Ia supernova distance ladder being at odds with the lower value extrapolated from CMB data, assuming the standard CDM cosmological model ( [2]). However, our analyses indicate that the Hubble tension may also exist between the Hubble+Pantheon+BAO data and the measurements from local Cepheid–type Ia supernova distance ladder if taking the parametrization (5). These results may contribute to our understanding of the current universe and its cosmodynamics.
Future research directions may encompass the expansion of datasets, exploration of additional cosmological models, and investigation into the impact of observational technologies on parameter constraints. The continuous advancement in observational methods is anticipated to refine our understanding of the universe’s evolution.
Acknowledgments
This study is supported in part by National Natural Science Foundation of China (Grant No. 12333008) and Hebei Provincial Natural Science Foundation of China (Grant No. A2021201034).
References
- da Costa et al. [2023] S. S. da Costa, D. R. da Silva, Álvaro S de Jesus, N. Pinto-Neto, and F. S. Queiroz, The h0 trouble: Confronting non-thermal dark matter and phantom cosmology with the cmb, bao, and type ia supernovae data (2023), eprint 2311.07420.
- Aghanim et al. [2020] N. Aghanim et al. (Planck), Astron. Astrophys. 641, A6 (2020), [Erratum: Astron.Astrophys. 652, C4 (2021)], eprint 1807.06209.
- Zhang and Huang [2019] X. Zhang and Q.-G. Huang, Commun. Theor. Phys. 71, 826 (2019), eprint 1812.01877.
- Di Valentino et al. [2021a] E. Di Valentino, O. Mena, S. Pan, L. Visinelli, W. Yang, A. Melchiorri, D. F. Mota, A. G. Riess, and J. Silk, Classical and Quantum Gravity 38, 153001 (2021a), ISSN 1361-6382, URL http://dx.doi.org/10.1088/1361-6382/ac086d.
- Anchordoqui et al. [2021] L. A. Anchordoqui, E. Di Valentino, S. Pan, and W. Yang, Journal of High Energy Astrophysics 32, 28–64 (2021), ISSN 2214-4048, URL http://dx.doi.org/10.1016/j.jheap.2021.08.001.
- Yang and Zhang [2010] R.-J. Yang and S. N. Zhang, Mon. Not. Roy. Astron. Soc. 407, 1835 (2010), eprint 0905.2683.
- Riess et al. [2022] A. G. Riess, W. Yuan, and L. M. Macri, The Astrophysical Journal Letters 934, L7 (2022), ISSN 2041-8213, URL http://dx.doi.org/10.3847/2041-8213/ac5c5b.
- Wong et al. [2019] K. C. Wong, S. H. Suyu, and G. C.-F. Chen, Monthly Notices of the Royal Astronomical Society 498, 1420–1439 (2019), ISSN 1365-2966, URL http://dx.doi.org/10.1093/mnras/stz3094.
- Riess et al. [2011] A. G. Riess, L. Macri, S. Casertano, H. Lampeitl, H. C. Ferguson, A. V. Filippenko, S. W. Jha, W. Li, and R. Chornock, The Astrophysical Journal 730, 119 (2011), ISSN 1538-4357, URL http://dx.doi.org/10.1088/0004-637X/730/2/119.
- Di Valentino et al. [2021b] E. Di Valentino et al., Astropart. Phys. 131, 102605 (2021b), eprint 2008.11284.
- Wang et al. [2023] B. Wang, M. López-Corredoira, and J.-J. Wei (2023), eprint 2311.18443.
- Verde et al. [2019a] L. Verde, T. Treu, and A. G. Riess, Nature Astronomy 3, 891–895 (2019a), ISSN 2397-3366, URL http://dx.doi.org/10.1038/s41550-019-0902-0.
- Di Valentino et al. [2019] E. Di Valentino, A. Melchiorri, and J. Silk, Nature Astronomy 4, 196–203 (2019), ISSN 2397-3366, URL http://dx.doi.org/10.1038/s41550-019-0906-9.
- Freedman [2017] W. L. Freedman, Nature Astronomy 1, 0121 (2017).
- Riess [2019] A. G. Riess, Nature Reviews Physics 2, 10–12 (2019), ISSN 2522-5820, URL http://dx.doi.org/10.1038/s42254-019-0137-0.
- Lin et al. [2023] M.-X. Lin, E. McDonough, J. C. Hill, and W. Hu, Physical Review D 107 (2023), ISSN 2470-0029, URL http://dx.doi.org/10.1103/PhysRevD.107.103523.
- Alcaniz et al. [2022a] J. S. Alcaniz, J. P. Neto, F. S. Queiroz, D. R. da Silva, and R. Silva, Scientific Reports 12, 20113 (2022a), eprint 2211.14345.
- Yin [2022] L. Yin, The European Physical Journal C 82 (2022), ISSN 1434-6052, URL http://dx.doi.org/10.1140/epjc/s10052-022-10020-w.
- Poulin et al. [2019] V. Poulin, T. L. Smith, T. Karwal, and M. Kamionkowski, Phys. Rev. Lett. 122, 221301 (2019), eprint 1811.04083.
- Sakstein and Trodden [2020] J. Sakstein and M. Trodden, Phys. Rev. Lett. 124, 161301 (2020), eprint 1911.11760.
- Karwal et al. [2022] T. Karwal, M. Raveri, B. Jain, J. Khoury, and M. Trodden, Phys. Rev. D 105, 063535 (2022), eprint 2106.13290.
- McDonough et al. [2022] E. McDonough, M.-X. Lin, J. C. Hill, W. Hu, and S. Zhou, Phys. Rev. D 106, 043525 (2022), eprint 2112.09128.
- Tutusaus et al. [2023] I. Tutusaus, M. Kunz, and L. Favre (2023), eprint 2311.16862.
- Dahmani et al. [2023] S. Dahmani, A. Bouali, I. E. Bojaddaini, A. Errahmani, and T. Ouali (2023), eprint 2301.04200.
- Alonso-López et al. [2023] D. Alonso-López, J. de Cruz Pérez, and A. L. Maroto (2023), eprint 2311.16836.
- Montani et al. [2023] G. Montani, N. Carlevaro, and M. G. Dainotti (2023), eprint 2311.04822.
- Torres-Arzayus et al. [2023] S. Torres-Arzayus, C. Delgado-Correal, M.-A. Higuera-G., and S. Rueda-Blanco (2023), eprint 2311.05510.
- Li and Shafieloo [2019] X. Li and A. Shafieloo, Astrophys. J. Lett. 883, L3 (2019), eprint 1906.08275.
- Pan et al. [2019] S. Pan, W. Yang, E. Di Valentino, E. N. Saridakis, and S. Chakraborty, Phys. Rev. D 100, 103520 (2019), eprint 1907.07540.
- Panpanich et al. [2021] S. Panpanich, P. Burikham, S. Ponglertsakul, and L. Tannukij, Chin. Phys. C 45, 015108 (2021), eprint 1908.03324.
- De Felice et al. [2020] A. De Felice, C.-Q. Geng, M. C. Pookkillath, and L. Yin, JCAP 08, 038 (2020), eprint 2002.06782.
- Alestas et al. [2020] G. Alestas, L. Kazantzidis, and L. Perivolaropoulos, Phys. Rev. D 101, 123516 (2020), eprint 2004.08363.
- Alestas et al. [2022] G. Alestas, D. Camarena, E. Di Valentino, L. Kazantzidis, V. Marra, S. Nesseris, and L. Perivolaropoulos, Phys. Rev. D 105, 063538 (2022), eprint 2110.04336.
- Castillo-Santos et al. [2023] M. N. Castillo-Santos, A. Hernández-Almada, M. A. García-Aspeitia, and J. Magaña, Phys. Dark Univ. 40, 101225 (2023), eprint 2212.01974.
- Chevallier and Polarski [2001] M. Chevallier and D. Polarski, Int. J. Mod. Phys. D 10, 213 (2001), eprint gr-qc/0009008.
- Linder [2003] E. V. Linder, Phys. Rev. D 68, 083503 (2003), eprint astro-ph/0212301.
- Verde et al. [2019b] L. Verde, T. Treu, and A. G. Riess, Nature Astron. 3, 891 (2019b), eprint 1907.10625.
- Goodman and Weare [2010] J. Goodman and J. Weare, Communications in Applied Mathematics and Computational Science 5, 65 (2010).
- Salehi and Hatami [2022] A. Salehi and H. Hatami, European Physical Journal C 82, 1165 (2022).
- Santos et al. [2016] M. V. d. Santos, R. Reis, and I. Waga, Journal of Cosmology and Astroparticle Physics 2016, 066–066 (2016), ISSN 1475-7516, URL http://dx.doi.org/10.1088/1475-7516/2016/02/066.
- Zhang et al. [2014] C. Zhang, H. Zhang, S. Yuan, T.-J. Zhang, and Y.-C. Sun, Res. Astron. Astrophys. 14, 1221 (2014), eprint 1207.4541.
- Stern et al. [2010] D. Stern, R. Jimenez, L. Verde, M. Kamionkowski, and S. Stanford, JCAP 02, 008 (2010), eprint 0907.3149.
- Moresco et al. [2012] M. Moresco et al., JCAP 08, 006 (2012), eprint 1201.3609.
- Moresco et al. [2016] M. Moresco, L. Pozzetti, A. Cimatti, R. Jimenez, C. Maraston, L. Verde, D. Thomas, A. Citro, R. Tojeiro, and D. Wilkinson, JCAP 05, 014 (2016), eprint 1601.01701.
- Ratsimbazafy et al. [2017] A. Ratsimbazafy, S. Loubser, S. Crawford, C. Cress, B. Bassett, R. Nichol, and P. Väisänen, Mon. Not. Roy. Astron. Soc. 467, 3239 (2017), eprint 1702.00418.
- Moresco [2015] M. Moresco, Mon. Not. Roy. Astron. Soc. 450, L16 (2015), eprint 1503.01116.
- Gaztanaga et al. [2009] E. Gaztanaga, A. Cabre, and L. Hui, Mon. Not. Roy. Astron. Soc. 399, 1663 (2009), eprint 0807.3551.
- Chuang and Wang [2013] C.-H. Chuang and Y. Wang, Mon. Not. Roy. Astron. Soc. 435, 255 (2013), eprint 1209.0210.
- Blake et al. [2012] C. Blake et al., Mon. Not. Roy. Astron. Soc. 425, 405 (2012), eprint 1204.3674.
- Busca et al. [2013] N. G. Busca et al., Astron. Astrophys. 552, A96 (2013), eprint 1211.2616.
- Oka et al. [2014] A. Oka, S. Saito, T. Nishimichi, A. Taruya, and K. Yamamoto, Mon. Not. Roy. Astron. Soc. 439, 2515 (2014), eprint 1310.2820.
- Font-Ribera et al. [2014] A. Font-Ribera et al. (BOSS), JCAP 05, 027 (2014), eprint 1311.1767.
- Anderson et al. [2014] L. Anderson et al., Mon. Not. Roy. Astron. Soc. 439, 83 (2014), eprint 1303.4666.
- Delubac et al. [2015] T. Delubac et al. (BOSS), Astron. Astrophys. 574, A59 (2015), eprint 1404.1801.
- Wang et al. [2017] Y. Wang et al. (BOSS), Mon. Not. Roy. Astron. Soc. 469, 3762 (2017), eprint 1607.03154.
- Alam et al. [2017a] S. Alam et al. (BOSS), Mon. Not. Roy. Astron. Soc. 470, 2617 (2017a), eprint 1607.03155.
- Bautista et al. [2017] J. E. Bautista et al., Astron. Astrophys. 603, A12 (2017), eprint 1702.00176.
- Zhao et al. [2019] G.-B. Zhao et al., Mon. Not. Roy. Astron. Soc. 482, 3497 (2019), eprint 1801.03043.
- Borghi et al. [2022] N. Borghi, M. Moresco, and A. Cimatti, Astrophys. J. Lett. 928, L4 (2022), eprint 2110.04304.
- Yang [2024] R.-J. Yang, New Astron. 108, 102180 (2024).
- Perivolaropoulos and Skara [2022] L. Perivolaropoulos and F. Skara, The Astrophysical Journal 95, 101659 (2022), eprint 2105.05208.
- Giostri et al. [2012] R. Giostri, M. Vargas dos Santos, I. Waga, R. R. R. Reis, M. O. Calvão, and B. L. Lago, Journal of Cosmology and Astroparticle Physics 2012, 027 (2012), eprint 1203.3213.
- Brout et al. [2022] D. Brout, D. Scolnic, and B. Popovic, The Astrophysical Journal 938, 110 (2022), ISSN 1538-4357, URL http://dx.doi.org/10.3847/1538-4357/ac8e04.
- Suzuki et al. [2012] N. Suzuki, D. Rubin, and C. Lidman, The Astrophysical Journal 746, 85 (2012), ISSN 1538-4357, URL http://dx.doi.org/10.1088/0004-637X/746/1/85.
- Scolnic et al. [2018] D. M. Scolnic, D. O. Jones, and A. Rest, The Astrophysical Journal 859, 101 (2018), eprint 1710.00845.
- Beutler et al. [2011] F. Beutler, C. Blake, M. Colless, D. H. Jones, L. Staveley-Smith, L. Campbell, Q. Parker, W. Saunders, and F. Watson, Monthly Notices of the Royal Astronomical Society 416, 3017–3032 (2011), ISSN 0035-8711, URL http://dx.doi.org/10.1111/j.1365-2966.2011.19250.x.
- Alam et al. [2017b] S. Alam, M. Ata, and S. Bailey, Monthly Notices of the Royal Astronomical Society 470, 2617–2652 (2017b), ISSN 1365-2966, URL http://dx.doi.org/10.1093/mnras/stx721.
- Myrzakulov et al. [2023] N. Myrzakulov, M. Koussour, and D. J. Gogoi, The European Physical Journal C 83 (2023), ISSN 1434-6052, URL http://dx.doi.org/10.1140/epjc/s10052-023-11794-3.
- Eisenstein et al. [2005] D. J. Eisenstein et al. (SDSS), Astrophys. J. 633, 560 (2005), eprint astro-ph/0501171.
- Alcaniz et al. [2022b] J. S. Alcaniz, J. P. Neto, F. S. Queiroz, D. R. da Silva, and R. Silva, Scientific Reports 12, 20113 (2022b), eprint 2211.14345.
- Giostri et al. [2012] R. Giostri, M. V. d. Santos, I. Waga, R. Reis, M. Calvão, and B. L. Lago, Journal of Cosmology and Astroparticle Physics 2012, 027–027 (2012), ISSN 1475-7516, URL http://dx.doi.org/10.1088/1475-7516/2012/03/027.