Recurrent and Convolutional Neural Networks in Classification of EEG Signal for Guided Imagery and Mental Workload Detection
Abstract
The Guided Imagery technique is reported to be used by therapists all over the world in order to increase the comfort of patients suffering from a variety of disorders from mental to oncology ones and proved to be successful in numerous of ways. Possible support for the therapists can be estimation of the time at which subject goes into deep relaxation. This paper presents the results of the investigations of a cohort of 26 students exposed to Guided Imagery relaxation technique and mental task workloads conducted with the use of dense array electroencephalographic amplifier. The research reported herein aimed at verification whether it is possible to detect differences between those two states and to classify them using deep learning methods and recurrent neural networks such as EEGNet, Long Short-Term Memory-based classifier, 1D Convolutional Neural Network and hybrid model of 1D Convolutional Neural Network and Long Short-Term Memory. The data processing pipeline was presented from the data acquisition, through the initial data cleaning, preprocessing and postprocessing. The classification was based on two datasets: one of them using 26 so-called cognitive electrodes and the other one using signal collected from 256 channels. So far there have not been such comparisons in the application being discussed. The classification results are presented by the validation metrics such as: accuracy, recall, precision, F1-score and loss for each case. It turned out that it is not necessary to collect signals from all electrodes as classification of the cognitive ones gives the results similar to those obtained for the full signal and extending input to 256 channels does not add much value. In Disscussion there were proposed an optimal classifier as well as some suggestions concerning the prospective development of the project.
Keywords guided imagery mental workload EEG CNN LSTM
1 Introduction
Relaxation methods proved to be helpful for the patients with some illnesses and mental disorders. Oncological patients were reported to respond better to treatment when they used relaxation techniquesEremin et al. (2009). Therefore, it is beneficial to develop relaxation techniques in order to improve the quality of life. Moreover Guided Imagery can be used as relaxation technique. It is largely applied and proved to be effective in reducing test anxiety and dealing with stress of different originsUrech et al. (2010); Stephens (1992); Nguyen and Brymer (2018). Electroencephalography (EEG) can be a good method to find out if patients are in the state of relaxation or not. Scalp EEG is a non-invasive method of measuring bio-electrical activity of the human brain. Moreover, it is less expensive and less stressful for patients than other brain activity measuring devices, such as PET or MRIMurphy and Brunberg (1997); Sanei and Chambers (2021). On the other hand, manual multichannel EEG signal analysis can be a difficult and time-consuming process. Machine learning and deep learning tools are commonly used to classify various types of data, starting with the imagesKrizhevsky et al. (2017) to the different kinds of signalsNasrullah and Zhao (2019); Cheng et al. (2021). The aim of this study is to propose an EEG signal classifier based on the 1D Convolutional Neural Networks (CNNs) by using raw signal with only basic filtering done as an input data.
For different types of EEG signals, classical machine learning (ML) methods, such as Support Vector Machines (SVM), were used Bayram et al. (2013). In classification of relaxation and concentration states based on the electroencephalographic signal SVMs can achieve around 80% of accuracy (ACC)You (2021).
State-of-the-art classification methods applied for the EEG signal already used Convolutional Neural Networks (CNNs) with success Oh et al. (2019). Furthermore, the above mentioned classical ML methods are increasingly being replaced by deep learning approaches. Convolutional Neural Networks are applicable in the EEG signal analysis, for instance, in motor imagery processing Xu et al. (2019), epileptic seizure detection Zhou et al. (2018), emotion recognition Zhang et al. (2020), and research topics devoted to Brain-Computer Interfaces based on EEG feature extraction using CNNs Chen et al. (2023), among others, even for identity authentication Zhang et al. (2022).
The most common approach is to classify signals by feeding the classifier with the frequency bands data. The EEG signal is commonly partitioned into discrete frequency ranges, encompassing delta waves below 4 Hz, theta waves ranging from 4 to 7 Hz, alpha waves spanning 8 to 12 Hz, beta waves between 13 and 30 Hz, and gamma waves surpassing 30 Hz. It was proved that using specific selected bands of EEG signal, SVM classificator can be doneYou (2021); Li and Feng (2019). Calculation of power across specific frequency bands is needed. Therefore it would be beneficial to skip manual feature extraction and use CNN-based feature extraction from the raw signal. Some researchers used this approach successfully for emotions recognitionChen et al. (2019); Yanagimoto and Sugimoto (2016). The experiments described by Baydemir et al. showed that it is possible to classify EEG signal of low and high cognitive load using 1D-CNN with a great accuracyBaydemir et al. (2022). Classification of fNIRS-EEG mental workload signal using CNN was made, showing a good accuracy of 89%Saadati et al. (2020). However there are only few papers including 1D Convolutional Neural Networks used specifically in the binary classification of relaxation and mental workload using the raw EEG signal which still needs to be investigated.
In our previous research, the classical classification method was used for Guided Imagery and Mental Task groups Zemla et al. (2023). Generalized Linear Model (GLM) used in that research achieved 81% accuracy using a very specific time segment, 779-839 seconds, extracted from the complete recording. In order to achieve this level of accuracy, this required feeding the classifier with five EEG bands (alpha, beta, delta, theta, and gamma), extracted from the raw signal of the 60 seconds duration. However, on the full-length recording, the accuracy of 90.77% was achieved.
The objective of this study is to compare four approaches to classification of EEG signals of two mental states: Guided Imagery relaxation technique and Mental Workload tasks. For this research 1D Convolutional Neural Network (1D-CNN), Long-Short Time Memory (LSTM), 1D-CNN-LSTM hybrid model and 2D-CNN (EEGNet) will be taken into consideration. Signals were filtered and split into 1-second segments. Bad channels were marked automatically and interpolated. That way all 256 channels could have been used for training. No further preprocessing or artifact removal was done. No features were extracted from that signal manually.
2 Materials and methods
The signal for this study was obtained from a cohort of 26 males, aged 19-24 years. They were all right-handed and short-haired. Being right- or left-handed could influence the results due to brain lateralization. Described experiments were reviewed and approved by the Maria Curie- Skłodowska University Bioethical Commission. The experiments were conducted according to the best experimental practices and guidelines. They were also done under the supervision of qualified psychologists. All participants agreed to the EEG signal recording and were informed about the purpose of the experiment. They all signed written consent before taking part in it.
2.1 Inclusion and exclusion criteria
The criteria for selecting participants in this study involve being a healthy, right-handed male, aged 19 to 24, with short hair and fluency in Polish. They should have no history of chronic diseases, no current use of prescribed or recreational drugs, and should be able to attend study appointments without specific technological requirements. Additionally, participants were required to abstain from alcohol and medication for at least 72 hours before the experiment.
On the other hand, exclusion criteria encompassed individuals younger than 19 or older than 24, left-handed individuals, those with long hair, limited proficiency in Polish, serious or chronic illnesses, current use of medications or drugs, recent medical treatments, or inability to attend study appointments. Participants failing to meet the inclusion criteria or declaring serious diseases, including mental disorders, were automatically excluded. Prior to participation, participants were informed about the EEG research and technology and consented to take part in the study.
There were several reasons for recruiting participants aged 19-24 and only males. Firstly, the majority of individuals in this age range are students, particularly those pursuing first and second degrees. Secondly, in the Institute of Computer Science, there is a predominant male student population, making it challenging to form both target and control groups including women. However, the most significant reason was the documented changes in women’s EEG cortical activity throughout the menstrual cycle, as published by Solis-Ortiz et al. (1994); Krug et al. (1999). These changes introduce additional variables into the model. Variations are observed in both alpha and beta bands Bazanova et al. (2014); Souza et al. (2022), which could be crucial for signal classification related to the individual’s state of mind.
Moreover, it was noted that a substantial majority of female computer science students had lengthy hair. It is noteworthy that the research has also highlighted differences in electroencephalogram patterns between males and females Wada et al. (1994); Cantillo-Negrete et al. (2017), and the objective was to achieve a relatively balanced representation from the participant pool.
They all signed a written consent. Half of the group listened to the Guided Imagery relaxation recording prepared by the psychologist. The other half were asked to recall specific kinds of information: the names of Polish administrative units (voivodships), the names of the Zodiac signs, the names of US states, etc. (Mental Task group or MT group). Tasks were given by the same psychologist on the recording. After each task there was a period of silence when participants were thinking about the answer. The GI group was supposed to relax during the experiment, while the MT group was supposed to be put under mental workload. At the beginning of the experiment the MT group was told that after its completion they would be asked to write down all the information they will have recalled. The Guided Imagery and the Mental Task recordings were of the same length of 20 min. The participants were asked to close their eyes and each trial was conducted in the lying position with lights turned off to decrease the effects of muscle artifacts, power line noise and distractions on the EEG signal.
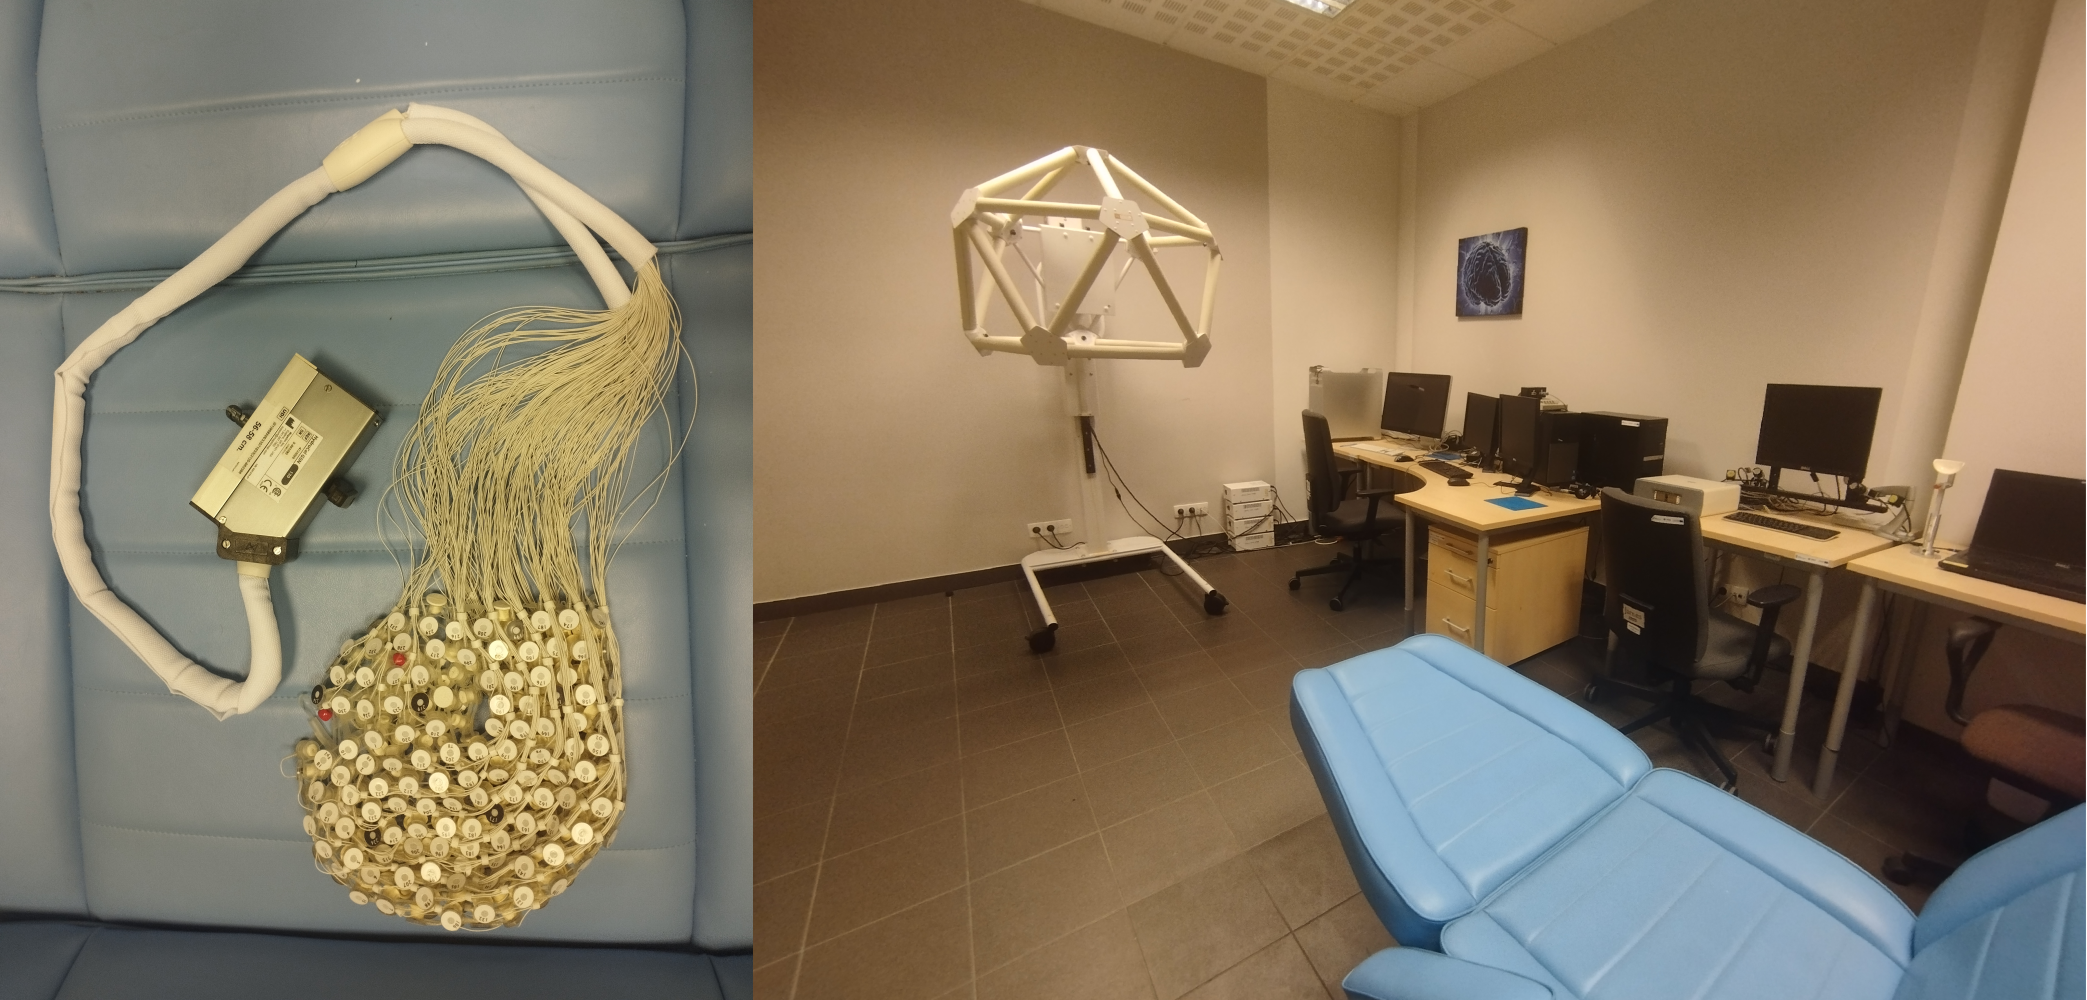
The experiments were conducted in the EEG Laboratory of the Department of Neuroinformatics and Biomedical Engineering of Maria Curie-Skłodowska University (UMCS) in Lublin, Poland (Figure 1). All trial signals were recorded at the sampling frequency of 250 Hz with the use of a 256-channel dense array EGI GSN 130 series cap (Figure 1). For signal acquisition, the EGI Net Station 4.5.4 software was used.
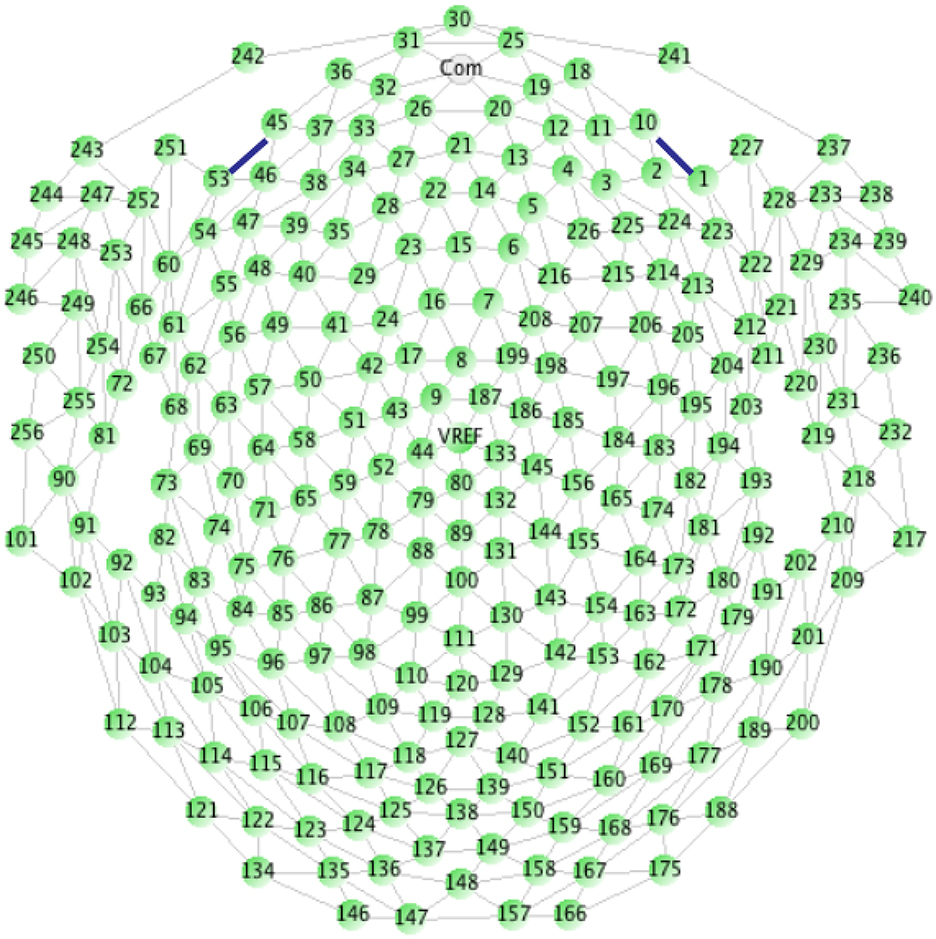
Our dense array amplifier recorded the signal from all 256 electrodes. However, we expected to find differences on the so-called cognitive electrodes based on the previous experience in the cognitive processing EEG signal analysis Wojcik et al. (2023); Kawiak et al. (2020a); Kwasniewicz et al. (2021); Schneider et al. (2022). These electrodes are described in the EGI 256-channel cap specification Geodesics (2003, 2009, 2011) as the best for cognitive ERP observations, covering the scalp regularly, and numbered as follows: E98, E99, E100, E101, E108, E109, E110, E116, E117, E118, E119, E124, E125, E126, E127, E128, E129, E137, E138, E139, E140, E141, E149, E150, E151, and E152 (see Fig.2).
2.2 Signal preprocessing and data sets preparation
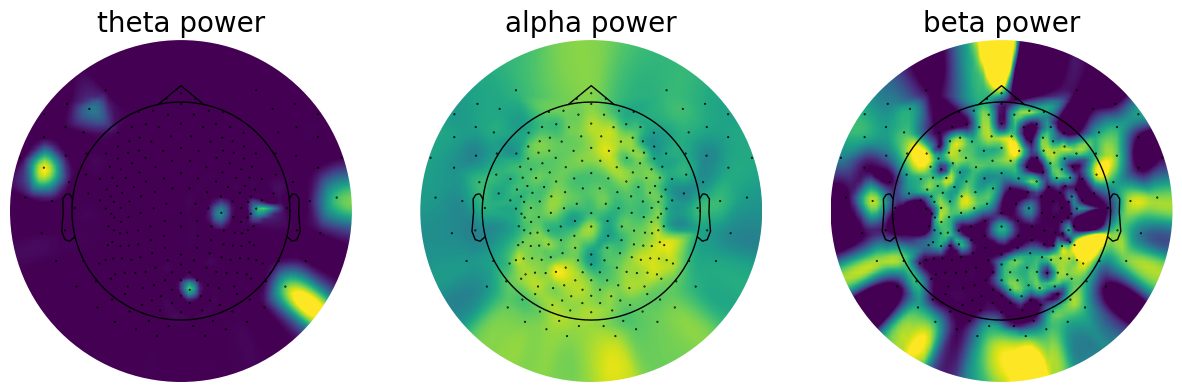
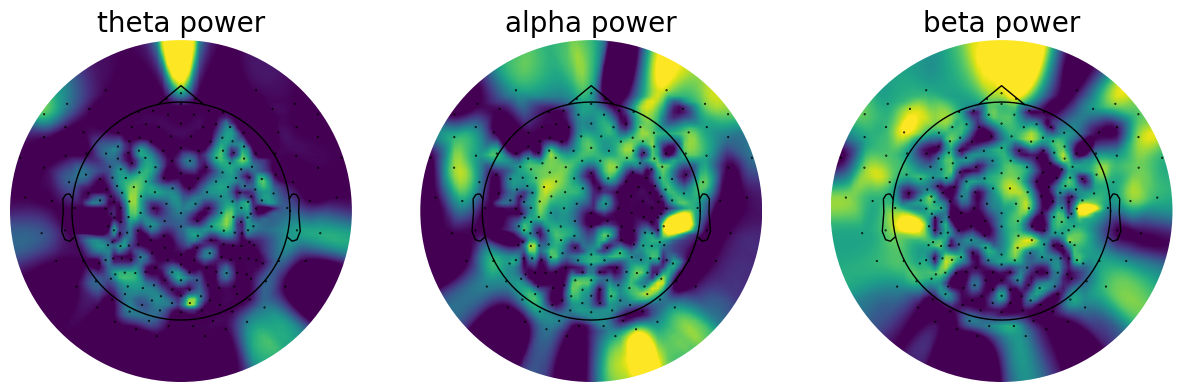
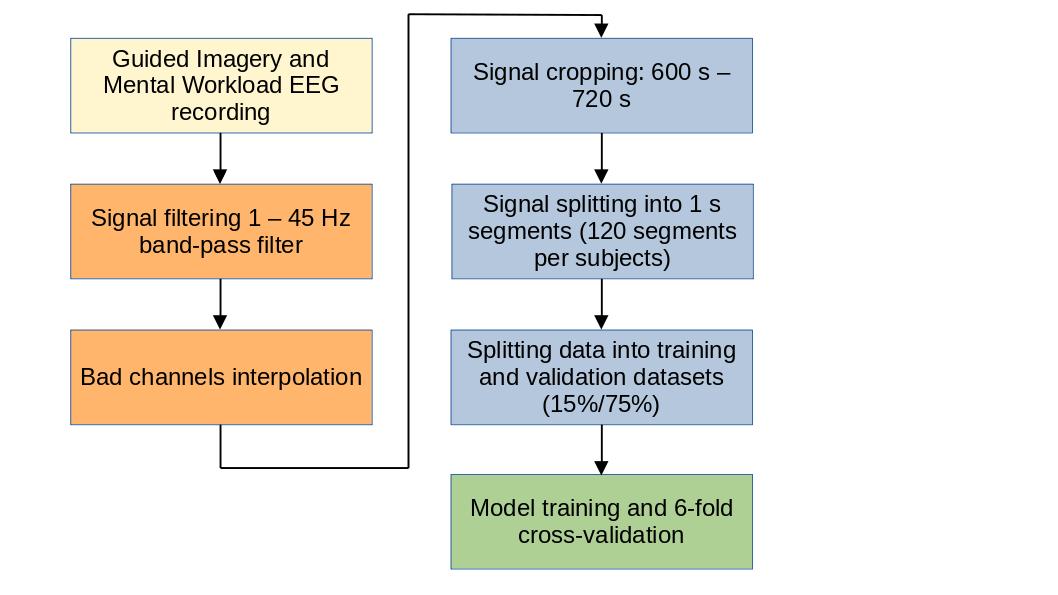
The recorded EEG signals were pre-processed using mne Python toolkit 1.3.0 Gramfort et al. (2013). Noisy channels were removed from the signal and interpolated to maintain the same size of data in each sample. For automatic bad channel rejection the RANSAC algorithm implemented in pyprep toolkit Appelhoff et al. (2023) was used. This toolkit is based on the PREP pipeline designed for EEG signal preprocessing in MATLABBigdely-Shamlo et al. (2015). The signal from each trial was filtered with a band pass filter of 1-45 Hz. Each signal was cropped from 10 to 12 minutes of the recording, which gives 120 seconds per subject. The time segment was chosen based on the previous experience with GI relaxation method. It was proved that the period between 10 and 14 min. of recording has the greatest significance for distinguishing the relaxation and mental workload state Zemla et al. (2023). Each cropped signal was split into 1-second segments. This gives a total amount of 3,120 recording samples (1,560 samples of Guided Imagery group and 1,560 samples of Mental Task group). Figure 5 shows the data preparation steps. The sample 1-s segments for both GI and MT states were shown in terms of different power densities for each of frequency bands in Figures 3 (for GI) and 4 (for MT).
Two sets of electrodes were selected for the experiments. The first one included a full set of 256 channels of EEG signal. The second one contained a subset of 26 electrodes from the central-parietal region to reduce the amount of data subjected to training. Based on the previous research in analyzing cognitive processing of EEG signals Kawiak et al. (2020b); Kwaśniewicz et al. (2020); Schneider et al. (2022), variations were expected to be observed specifically on the above mentioned 26 cognitive electrodes. Those electrodes, specified as optimal for observing cognitive phenomena according to the EGI 256-channel cap specifications EGI (2006), are positioned in the central-ocipital region and numbered: E98, E99, E100, E101, E108, E109, E110, E116, E117, E118, E119, E124, E125, E126, E127, E128, E129, E137, E138, E139, E140, E141, E149, E150, E151, and E152. The topographical map showing the placement of these electrodes on the scalp can be found in the EGI documentation EGI (2006) and in Wojcik et al. (2023), Fig. 1. It was also showed that they cover the region of the greatest significance for the alpha band-based research, as this band is correlated with the relaxation stateSanei and Chambers (2021). Finally, the both datasets consisted of 3,120 signal samples. Each sample included 256 EEG channels in the data set 1 (FULL-256) or 26 EEG channels in the data set 2 (COGN-26), and 250 timesteps per second. No further pre-processing or feature extraction was done.
The data set was split into 2,640 samples in the training data set and 480 samples in the testing data set. 6-fold cross-validation was used to confirm performance of the model. The StratifiedGroupKfold method from scikit- learnPedregosa et al. (2011) was used to prevent the data from one subject to be put in training and validation data sets at the same time. On the other hand, StratifiedGroupKFold keeps the data set with a balanced number of samples for each group. The data set was shuffled to prevent the model from learning data from only one subject in one batch. Folds were saved for benchmarking purposes.
2.3 EEGNet
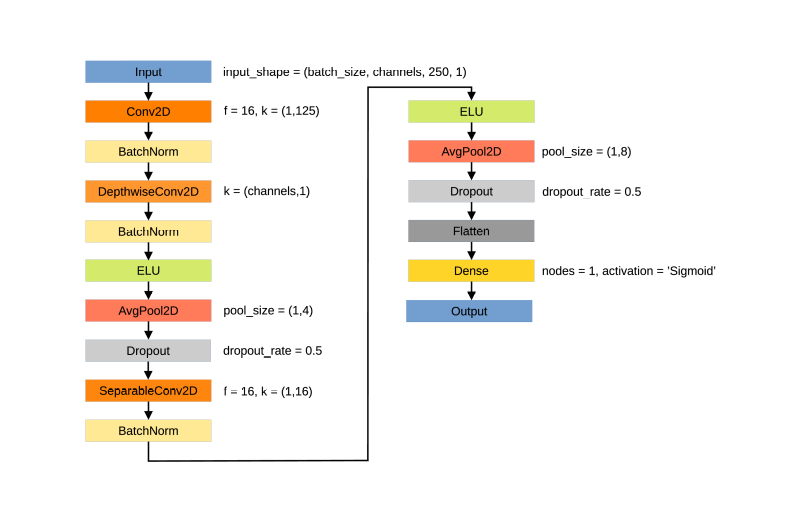
The first method of classification of EEG signal in this research was 2D-CNN architecture called EEGNet proposed by Lawhern et al.Lawhern et al. (2018). Implementation of this network was done using tensorflow and keras. All architecture remained as presented in the original research. The parameters were adjusted as suggested by the EEGNet authors. All parameters are described in table Table 1 and are given in Figure 6.
The learning rate was set to 0.001, the optimizer was Adam and the loss function was binary cross-entropy. Loss function selection resulted in changing the activation function from original Softmax to Sigmoid.
EEGNet performance in terms of validation accuracy and validation loss was selected as reference for all other methods of binary classification described in this research. Using COGN-26 data set, the model had 2,153 parameters. After training on FULL-256 data set the model had 6,753 parameters.
| Parameter | Description | Value |
|---|---|---|
| F1 | Number of temporal filters | 8 |
| F2 | Number of pointwise filters | 16 |
| k | Kernel length | 125 |
| D | Number of spatial filters for each temporal convolution | 2 (original value) |
| - | Activation function in output layer | Sigmoid |
2.4 LSTM
Long short-term memory (LSTM) is a type of Recurrent Neural Network cell introduced as a solution for learning features from long time sequences including noisy dataHochreiter and Schmidhuber (1997).
The simple LSTM-based network was tested as a second reference method. It was proved that Bidirectional LSTM-based (BiLSTM) model can be a good method of EEG classification tasks like emotion classificationYang et al. (2020) or seizure classificationHu et al. (2020).
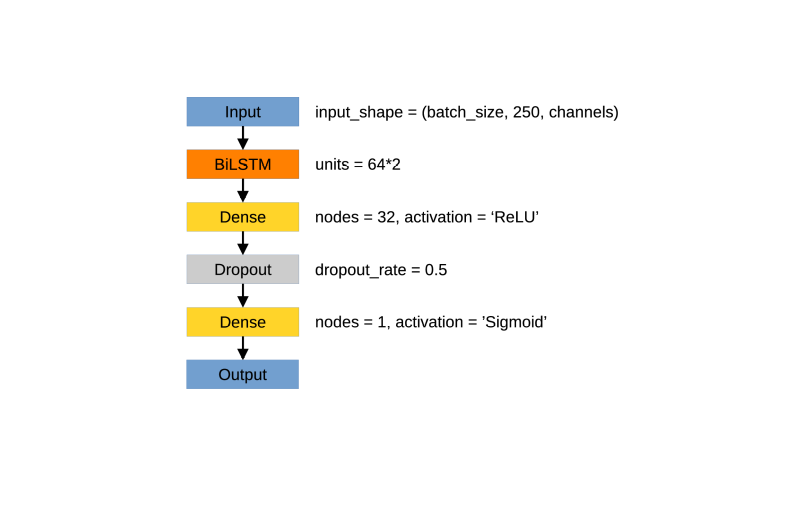
The architecture presented here contained one BiLSTM layer having 64 units(cells) for each backward and forward direction. The number of units were selected according to Yang et al. (2020). As the input signals included 250 samples each, we decided to take 1/4th of the sampling rate as a unit number. The closest power of 2 was 64. In the backward and forward directions, this means that our model included of 128 units in BiLSTM configuration. Two fully-connented (called also dense) layers, of 32 and 1 node, followed BiLSTM layer. Between those layers, dropout layer was set as the regularization method. Dropout rate was set to 0.5. Activation function in output Fully Connected layer was Sigmoid. The selection of power of two as the unit number in the LSTM layer was supported by connecting CNNs and LSTM in the next step. The selection of 32 nodes in the first Fully Connected layer was supported by trials with different sizes of 16, 32, 64 and 128. That number in that BiLSTM configuration gave the best results.
The learning rate was set to 0.001, the optimizer was Adam and the loss function was binary cross-entropy.
Using the COGN-26 data set, the model had 50,753 parameters. After training using the FULL-256 data set, the model had 168,513 parameters. Detailed architecture is given in Fig. 7.
2.5 1D-CNN
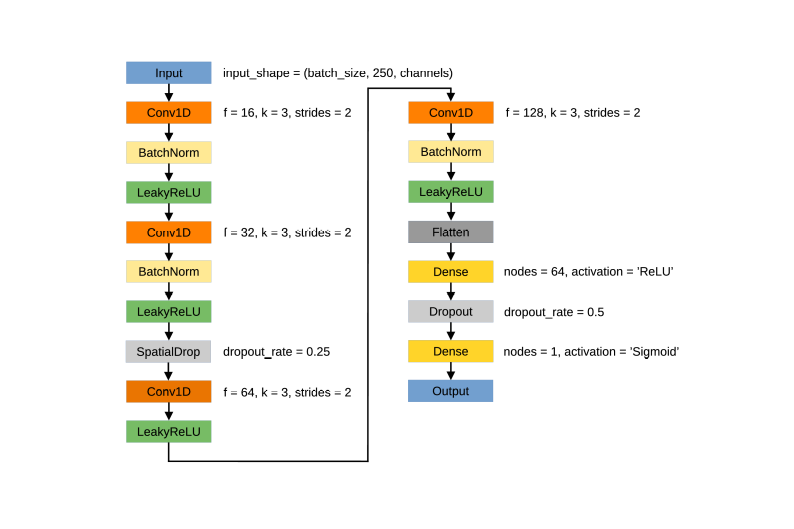
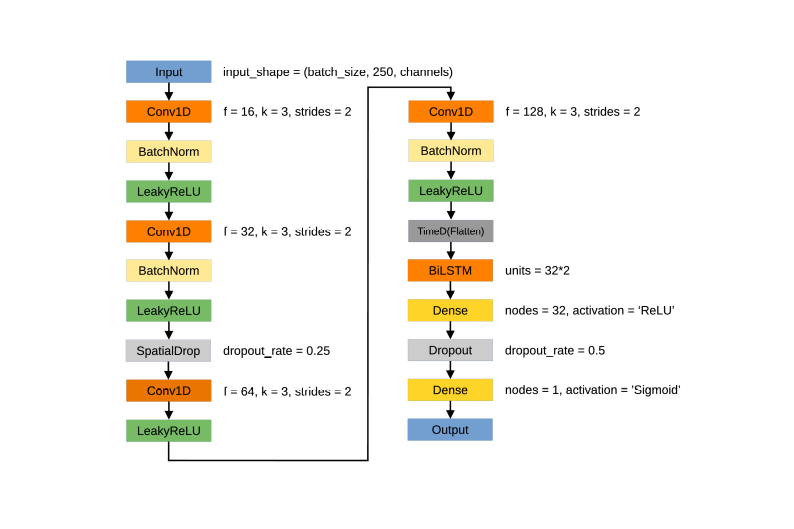
The proposed CNN model included of 4 convolutional layers. The layer is the main element of Convolutional Neural Network. It contains a set of filters which adjust their parameters during the model training phase. The LeakyReLU activation layer was used after each convolutional layer to provide non-linearitySchmidhuber (2015). Moreover, the Batch Normalization layer was used in each block of convolution containing a convolution layer and an activation layer. The purpose of Batch Normalization is to normalize data in batch to enhance learning speed and performance. Batch Normalization was neglected in the third block of convolution because Spatial Dropout (called SpatialDrop in Fig. 8) with the dropout rate of 0.25 was used before. Spatial Dropout is a method of regularization that drops randomly features learned by convolution layer during training to reduce overfittingSanghun and Chulhee (2020). Instead of using pooling layers, strided convolution was applied. It can provide simpler architecture with better accuracy in some applicationsSpringenberg et al. (2014). In the case of proposed CNN model it was the best choice in terms of achieved accuracy. The Flatten layer was set in front of two Fully Connected layers, which are responsible for binary classification of features extracted by convolutional layers. The dropout layer was used between Fully Connected layers as regularization method. It deactivates randomly weights of certain parameters during the training process to reduce overfittingSrivastava et al. (2014). The dropout rate was set to 0.5.
For the 1D-CNN model the loss function and optimizer remain the same as for the EEGNet and LSTM-based model. The learning rate was reduced to 0.00001 from the default value of 0.001.
The numbers of parameters in the model for COGN-26 and FULL-256 data sets were: 165,649 and 176,689 respectively. Figure 8 shows the model architecture in detail.
2.6 1D-CNN-LSTM
It was proved that 1D-CNN-LSTM can be applied to the EEG signals successfully. It was reported that this kind of approach can be beneficial for epileptic seizures classification Xu et al. (2020) and motor imagery classification Li et al. (2022).
A decision was made to connect 1D-CNN network model with the LSTM one described in the previous sections. In order to pass the Flatten output as input to the BiLSTM layer, and mantain the same model weights for all output data, the Time Distributed layer was used (referenced in Figure 9 as TimeD. Moreover as data are processed in CNN layers and the input size for LSTM part is already reduced, we decided to reduce number of nodes in first Fully Connected layer from 64 to 32. This resulted in model architecture shown on Figure 9.
The numbers of parameters in the model for the COGN-26 and FULL-256 data sets were: 77,777 and 88,817 respectively. The learning rate, optimizer and loss function were set as for 1D-CNN model.
2.7 Evaluation metrics
Validation accuracy was selected as the main performance metric due to the fact that the balanced data sets were used for the binary classification. Validation loss was also monitored during the model designing phase. F1-score, precision and recall averaged over 6 folds are also reported for all tested models. Mentioned metrics are defined as followsHossin and Sulaiman (2015):
| (1) |
Here TP is defined as True Positives, TN - True Negatives, FP - False Positives and FN - False Negatives.
| (2) |
Precision quantifies the accurate prediction of positive labels within the total predicted labels belonging to the positive class.
| (3) |
Recall is a measure of the number of positive labels that are correctly classified.
| (4) |
F1 is defined as the harmonic mean between the recall and precision values.
Results
All architectures were tested using keras and tensorflow 2.15 packages with Python 3.11. The hardware used for testing was an Intel i7-based machine with 64GB of DDR5 RAM. The machine was also equipped with the Nvidia GeForce RTX 4070-based graphics card with 12GB of RAM. The operating system was Ubuntu 23.10. None of the setup elements were overclocked.
EEGNet was chosen as a reference because of the well documented architecture. The 6-fold cross validation procedure was perofmed using the model. The results for each fold and validation metrics such as: accuracy, loss, F1-score, precision and recall as well as their average values with standard deviations are presented in Tables 2 and 3 - for the FULL-256 and COGN-26 data sets. On the average after the 6-fold cross-validation EEGNet obtained 0.7615 and 0.7646 accuracy respectively. In terms of precision as well as recall and F1-score with all average metrics exceeding 0.75 on both data sets model can be considered as a good reference point.
| Fold | ACC | Loss | F1-score | Precision | Recall |
|---|---|---|---|---|---|
| 1 | 0.7917 | 0.4186 | 0.8016 | 0.7652 | 0.8417 |
| 2 | 0.7958 | 0.562 | 0.8293 | 0.7126 | 0.9917 |
| 3 | 0.7563 | 0.6193 | 0.7053 | 0.8917 | 0.5833 |
| 4 | 0.6458 | 0.9923 | 0.7195 | 0.5956 | 0.9083 |
| 5 | 0.8375 | 0.3612 | 0.8465 | 0.8022 | 0.8958 |
| 6 | 0.7417 | 0.655 | 0.6575 | 0.9754 | 0.4958 |
| Avg | 0.7615 | 0.6014 | 0.7600 | 0.7905 | 0.7861 |
| Std. | 0.0658 | 0.2230 | 0.0764 | 0.1336 | 0.1989 |
| Fold | ACC | Loss | F1 | Precision | Recall |
|---|---|---|---|---|---|
| 1 | 0.5312 | 0.6879 | 0.5455 | 0.5294 | 0.5625 |
| 2 | 0.7729 | 0.8835 | 0.8149 | 0.6877 | 1.0000 |
| 3 | 0.6812 | 0.7774 | 0.5321 | 1.0000 | 0.3625 |
| 4 | 0.9042 | 0.2666 | 0.8996 | 0.9450 | 0.8583 |
| 5 | 0.7917 | 0.3944 | 0.8270 | 0.7071 | 0.9958 |
| 6 | 0.9063 | 0.2442 | 0.9036 | 0.9295 | 0.8792 |
| Avg | 0.7646 | 0.5423 | 0.7538 | 0.7998 | 0.7764 |
| Std. | 0.1427 | 0.2755 | 0.1705 | 0.1856 | 0.2579 |
The LSTM model with only one LSTM layer followed by dropout was chosen as second reference point. The results 6-fold cross-validation and validation metrics such as: accuracy, loss, F1-score, precision and recall as well as their average values with standard deviations are presented in Tables 4 and 5. On the FULL-256 data set precision, recall and F1-score achieved the averaged over folds values above 0.72. The averaged ACC for this case was 0.7250 on the full set of channels. The model performed worse than EEGNet in terms of all described metrics. On the data set containing only 26 electrodes it performed the worst of all compared models with the cross-validated accuracy of 0.6833. It achievied also the worst cross-validated accuracy for both data sets.
| Fold | ACC | Loss | F1 | Precision | Recall |
|---|---|---|---|---|---|
| 1 | 0.6417 | 1.3984 | 0.7346 | 0.5833 | 0.9917 |
| 2 | 0.7479 | 0.7055 | 0.7881 | 0.6798 | 0.9375 |
| 3 | 0.7771 | 0.7453 | 0.8022 | 0.7209 | 0.9042 |
| 4 | 0.5417 | 2.434 | 0.5000 | 0.5500 | 0.4583 |
| 5 | 0.8854 | 0.3187 | 0.896 | 0.8200 | 0.9875 |
| 6 | 0.7563 | 0.6777 | 0.6777 | 1.0000 | 0.5125 |
| Avg | 0.725 | 1.0466 | 0.7331 | 0.7257 | 0.7986 |
| Std. | 0.1187 | 0.7644 | 0.1355 | 0.1658 | 0.2454 |
| Fold | ACC | Loss | F1 | Precision | Recall |
|---|---|---|---|---|---|
| 1 | 0.6542 | 3.0136 | 0.7422 | 0.5916 | 0.9958 |
| 2 | 0.75 | 4.276 | 0.8 | 0.6667 | 1.0000 |
| 3 | 0.5729 | 5.629 | 0.5393 | 0.5854 | 0.500 |
| 4 | 0.5437 | 5.277 | 0.6803 | 0.5236 | 0.9708 |
| 5 | 0.8125 | 0.8726 | 0.8421 | 0.7273 | 1.0000 |
| 6 | 0.7667 | 2.267 | 0.6957 | 1.0000 | 0.5333 |
| Avg | 0.6833 | 3.5559 | 0.7166 | 0.6824 | 0.8333 |
| Std. | 0.1101 | 1.8403 | 0.1063 | 0.1709 | 0.2458 |
The 6-fold cross validation procedure was applied for the 1D-CNN model. The results for each fold and validation metrics such as: accuracy, loss, F1-score, precision and recall as well as their average values with standard deviations are presented in Tables 6 and 7. The averaged over folds accuracy for this model using the FULL-256 data set was 0.7682 which can be considered as a result comparable to that of the EEGNet model. On cognitive electrodes subset it achieved 0.8094 accuracy which outperforms all described architectures for this case. Also in terms of F1-score, precision and recall this model performs the best in the research for the COGN-26 data set.
| Fold | ACC | Loss | F1 | Precision | Recall |
|---|---|---|---|---|---|
| 1 | 0.8758 | 0.3077 | 0.8745 | 0.8782 | 0.8708 |
| 2 | 0.7917 | 0.5703 | 0.8227 | 0.7160 | 0.9667 |
| 3 | 0.8375 | 0.4113 | 0.8169 | 0.9355 | 0.7250 |
| 4 | 0.6042 | 1.6410 | 0.6494 | 0.5828 | 0.7333 |
| 5 | 0.7625 | 0.5687 | 0.8034 | 0.6853 | 0.9708 |
| 6 | 0.7375 | 0.5966 | 0.6519 | 0.9672 | 0.4917 |
| Avg | 0.7682 | 0.6826 | 0.7698 | 0.7942 | 0.7931 |
| Std. | 0.0947 | 0.4828 | 0.0954 | 0.1547 | 0.1827 |
| Fold | ACC | Loss | F1 | Precision | Recall |
|---|---|---|---|---|---|
| 1 | 0.8833 | 0.2768 | 0.8848 | 0.8740 | 0.8958 |
| 2 | 0.7583 | 0.9046 | 0.8041 | 0.6761 | 0.9917 |
| 3 | 0.6854 | 0.7771 | 0.5519 | 0.9588 | 0.3875 |
| 4 | 0.9312 | 0.2232 | 0.9281 | 0.9726 | 0.8875 |
| 5 | 0.8188 | 0.4445 | 0.7981 | 0.9005 | 0.7167 |
| 6 | 0.7792 | 0.5075 | 0.7166 | 1.0000 | 0.5583 |
| Avg | 0.8094 | 0.5223 | 0.7806 | 0.8970 | 0.7396 |
| Std. | 0.0886 | 0.271 | 0.1341 | 0.1179 | 0.2312 |
The 6-fold cross validation procedure was applied for the hybrid 1D-CNN-LSTM model. The results for each fold and mentioned earlier validation metrics such as: accuracy, loss, F1-score, precision and recall as well as their average values with standard deviations are presented in Tables 8 and 9. The averaged over folds validation accuracy for this model trained using the FULL-256 data set was 0.7726. This was the best accuracy result for the full set of channels of all approaches discussed in this paper. On the cognitive electrodes subset it achieved 0.7556 accuracy which outperforms only the plain LSTM model in this case. For the COGN-26 data set the results are worse than those of 1D-CNN and comparable with EEGNet.
| Fold | ACC | Loss | F1 | Precision | Recall |
|---|---|---|---|---|---|
| 1 | 0.7292 | 0.6919 | 0.7789 | 0.658 | 0.9542 |
| 2 | 0.7500 | 1.069 | 0.7993 | 0.6676 | 0.9958 |
| 3 | 0.8583 | 0.3907 | 0.8373 | 0.9831 | 0.7292 |
| 4 | 0.7167 | 0.9444 | 0.7247 | 0.7047 | 0.7458 |
| 5 | 0.8875 | 0.2449 | 0.8945 | 0.8419 | 0.9541 |
| 6 | 0.6938 | 1.214 | 0.5638 | 0.9794 | 0.3958 |
| Avg | 0.7726 | 0.7591 | 0.7664 | 0.8058 | 0.7958 |
| Std. | 0.0803 | 0.3852 | 0.1144 | 0.1510 | 0.2268 |
| Fold | ACC | Loss | F1 | Precision | Recall |
|---|---|---|---|---|---|
| 1 | 0.7688 | 0.5999 | 0.7861 | 0.7312 | 0.9758 |
| 2 | 0.7542 | 1.3300 | 0.8027 | 0.6704 | 1.0000 |
| 3 | 0.7250 | 1.2670 | 0.6207 | 1.0000 | 0.4500 |
| 4 | 0.7771 | 0.5214 | 0.8165 | 0.6939 | 0.9917 |
| 5 | 0.7271 | 0.566 | 0.7207 | 0.7380 | 0.7042 |
| 6 | 0.7813 | 0.7457 | 0.7200 | 1.0000 | 0.5625 |
| Avg | 0.7556 | 0.8383 | 0.7445 | 0.8056 | 0.7807 |
| Std. | 0.0247 | 0.3648 | 0.0732 | 0.1526 | 0.2423 |
The averaged 6-fold cross-validated metrics for all models are reported in Tab. 10 for the FULL-256 data set and in Tab. 11 for the COGN-26 data set. It can be seen that the worst model for classification from the full set of electrodes is the one-layer LSTM-based model. The other models obtained comparable results in terms of accuracy, while the best one was the 1D-CNN-LSTM hybrid model. On the other hand for the signal collected from subset of cognitive electrodes in terms of validation metrics of accuracy, loss, F1-score and precision the 1D-CNN-based model outperformed all other approaches with the accuracy of 0.8094, the F1-score value of 0.7806 and the precision close to 0.8970.
| Model | ACC | Loss | F1 | Precision | Recall |
|---|---|---|---|---|---|
| EEGNet | 0.7615 | 0.6014 | 0.75995 | 0.79045 | 0.7861 |
| LSTM | 0.7250 | 1.0466 | 0.7331 | 0.7257 | 0.7986 |
| 1D-CNN | 0.7682 | 0.6826 | 0.7698 | 0.7942 | 0.7931 |
| 1D-CNN-LSTM | 0.7726 | 0.7592 | 0.7664 | 0.8058 | 0.7958 |
| Model | ACC | Loss | F1 | Precision | Recall |
|---|---|---|---|---|---|
| EEGNet | 0.7646 | 0.5423 | 0.7538 | 0.7998 | 0.7764 |
| LSTM | 0.6833 | 3.5559 | 0.7166 | 0.6824 | 0.8333 |
| 1D-CNN | 0.8094 | 0.5223 | 0.7806 | 0.8970 | 0.7396 |
| 1D-CNN-LSTM | 0.7556 | 0.8383 | 0.7445 | 0.8056 | 0.7807 |
Discussion
There are known approaches of using convolutional neural networks in biometrics Prakash et al. (2022) and other cybernetical tasks Daoui et al. (2023), more and more of them in the EEG signal classification Prakash et al. (2022). More and more often deep learning methods are applied in the biomedical engineering systems to help patients with numerous of disorders like sleep apneua Kandukuri et al. (2023)
The aim of this paper was to compare the effectiveness of four different architectures in the EEG signal classification originating from a psychological experiment involving Guided Imagery. There were used the EEGNet, LSTM, 1D-CNN and 1D-CNN-LSTM approaches in the case of dense array amplifier setup using 256 electrodes and the so-called cognitive setup using 26 electrodes.
Training all of these models is relatively fast, does not require extensive resources, and as a result can be incorporated into less demanding computational environments after training using different data. What is also beneficial is that in spite of the fact that the EEG signal can vary in time and between subjects, it is possible to train the model with great accuracy using smaller segments of 1 second instead of 1 minute or even the full-length signal. Benefit of this work is also that all the models make use of all 256 EEG channels to learn features and its simplified version of 26 cognitive channels.
Indeed, the results obtained in this study show that the manual feature extraction (EEG bands, wavelets etc.) can be neglected while using the CNN-based, LSTMs and hybrid models architectures.
Simple filtration and interpolation of the signal seem to be sufficient. The binary signal classifiers described above perform well on raw data, resulting in the level of accuracy comparable to that of state-of-the art methods and to our previous paper on Generalized Linear Model in EEG signal classification Zemla et al. (2023).
In case of the full signal collection recorded from 256 electrodes the 1D-CNN-LSTM performs best in terms of accuracy and precision. Almost as good as the one above is 1D-CNN, especially that it has better loss and F1-score values. One layer LSTM accuracy is the worst in this experiment, however still higher than 0.70 with the best recall of 0.79. The reference model EEGNet has the accuracy of 0.76 (compared to the best discussed here 0.77) and generally lower characteristics in the case of remaining three metrics. The collection and comparison of all results of the discussed classifiers are presented in Tab. 10.
In the case of the signal collected from 26 cognitive electrodes evidently the best one is the proposed 1D-CNN model achieving 80% accuracy with the best loss, F1 and precision characteristics. The one-layer LSTM has much lower accuracy (68%) but its recall is the highest reaching 0.83. The accuracy of the EEGNet reached 0.76 and 1D-CNN-LSTM 0.75 which were lower by 5% compared with the best one 1D-CNN. The other parameters like F1 and precision are of the same order of value, relatively similar but none is as good as that for 1D-CNN-LSTM. The collection and comparison of all results of the discussed classifiers are presented in Tab. 11.
Better performance on 26 electrodes (accuracy of 81% for 1D-CNN vs 77% for 1D-CNN-LTSM) can be the result of putting more influential data for feature extraction and automatically selecting those of greater significance for the task than the manually selected subset of 256 electrodes or in special case all of them.
Thus it was proved that from the computational point of view it is even more beneficial to collect fewer data for such tasks and expanding the cap to 256 electrodes does not always add a significant value.
There is still place for improving those models by training them with more data from more subjects. There is also need to test if best models work well for the data gathered from female subjects. Also finding new architecture for this task can be a way to reducing number of parameters of the model. It needs to be investigated how other electrodes subsets, like 10-20 international systemChatrian et al. (1985) can affect performance of classification using the described architecture.
Another aspect of improvements that can be applied is the parameter tuning for the models. In our opinion, based on the previous experience Wojcik et al. (2023) this could increase the accuracy of the models by 3%-5%.
Then, there can be designed more complex hybrid architectures, involving other methods of EEG signal analysis Kawala-Janik et al. (2014); Kahankova et al. (2017) or eg. the fuzzy logic approach Mikołajewska et al. (2017); Prokopowicz et al. (2017)
The research presented here can shed new light on the engineering of new brain-computer interfaces with application for psycho-therapists and neuro-therapists using the relaxation techniques and Guided Imagery method.
Acknowledgements
The authors would like to thank Ewa Lewandowska and Marek Rudziński of VRMed for fruitful discussions, inspiration and possibility of working together on new ideas.
Author contributions statement
F.P.: Principal Investigator of the project, research project conceptualization at applied neuroinformatics dimension, concept of convolutional neural networks application, data processing, data analysis, manuscript preparation, models design and implementation, EEG recordings; G.M.W.: Key Investigator of the research, research idea and methodological support, manuscript preparation; K.W.: EEG recordings, work in the laboratory; A.K.: statistical consultation; G.S.: research project conceptualization at psychological dimension; K.Z.: research project conceptualization at psychological dimension and implementing Guided Imagery relaxation technique.
Data availability statement
The raw data supporting the conclusions of this manuscript will be made available by the authors, without undue reservation, to any qualified researcher. To obtain the data please contact Filip Postepski using e-mail address: filip.postepski@mail.umcs.pl.
Additional information
Funding: This study was financed by Maria Curie-Sklodowska University as beneficiary of "UMCS Mini-Grants" programme in the academic year 2022/23.
Conflict of interest: No conflicts of interest are declared.
Ethics approval and consent to participate: The studies involving human participants were reviewed and approved by the Maria Curie-
Skłodowska University Bioethical Commission. The participants provided their written informed consent to participate in this study.
References
- Eremin et al. [2009] Oleg Eremin, Mary B. Walker, Edna Simpson, Steven D. Heys, Antoine K. Ah-See, Andrew W. Hutcheon, Keith N. Ogston, Tarun K. Sarkar, Ashok Segar, and Leslie G. Walker. Immuno-modulatory effects of relaxation training and guided imagery in women with locally advanced breast cancer undergoing multimodality therapy: A randomised controlled trial. The Breast, 18(1):17–25, February 2009. ISSN 09609776. doi:10.1016/j.breast.2008.09.002. URL https://linkinghub.elsevier.com/retrieve/pii/S0960977608001859.
- Urech et al. [2010] C. Urech, N. S. Fink, I. Hoesli, F. H. Wilhelm, J. Bitzer, and J. Alder. Effects of relaxation on psychobiological wellbeing during pregnancy: A randomized controlled trial. Psychoneuroendocrinology, 35(9):1348–1355, 2010. ISSN 0306-4530. doi:https://doi.org/10.1016/j.psyneuen.2010.03.008. URL https://www.sciencedirect.com/science/article/pii/S0306453010000867.
- Stephens [1992] R. L. Stephens. Imagery: a treatment for nursing student anxiety, 1992.
- Nguyen and Brymer [2018] J. Nguyen and E. Brymer. Nature-based guided imagery as an intervention for state anxiety. Frontiers in Psychology, 9:1858, 2018.
- Murphy and Brunberg [1997] K. J. Murphy and J. A. Brunberg. Adult claustrophobia, anxiety and sedation in mri. Magnetic Resonance Imaging, 15(1):51–54, 1997. ISSN 0730-725X. doi:https://doi.org/10.1016/S0730-725X(96)00351-7. URL https://www.sciencedirect.com/science/article/pii/S0730725X96003517.
- Sanei and Chambers [2021] S. Sanei and J. A. Chambers. Introduction to Electroencephalography, chapter 1, pages 1–14. John Wiley & Sons, Ltd, 2021. ISBN 9781119386957. doi:https://doi.org/10.1002/9781119386957.ch1. URL https://onlinelibrary.wiley.com/doi/abs/10.1002/9781119386957.ch1.
- Krizhevsky et al. [2017] A. Krizhevsky, I. Sutskever, and G. E. Hinton. Imagenet classification with deep convolutional neural networks. Commun. ACM, 60(6):84–90, may 2017. ISSN 0001-0782. doi:10.1145/3065386. URL https://doi.org/10.1145/3065386.
- Nasrullah and Zhao [2019] Zain Nasrullah and Yue Zhao. Music artist classification with convolutional recurrent neural networks. In 2019 International Joint Conference on Neural Networks (IJCNN), pages 1–8, 2019. doi:10.1109/IJCNN.2019.8851988.
- Cheng et al. [2021] Jinyong Cheng, Qingxu Zou, and Yunxiang Zhao. Ecg signal classification based on deep cnn and bilstm. BMC medical informatics and decision making, 21:1–12, 2021.
- Bayram et al. [2013] K. S. Bayram, M. A. Kızrak, and B. Bolat. Classification of eeg signals by using support vector machines. In 2013 IEEE INISTA, pages 1–3, 2013. doi:10.1109/INISTA.2013.6577636.
- You [2021] S. D. You. Classification of relaxation and concentration mental states with eeg. Information, 12(5), 2021. ISSN 2078-2489. doi:10.3390/info12050187. URL https://www.mdpi.com/2078-2489/12/5/187.
- Oh et al. [2019] Shu Lih Oh, Jahmunah Vicnesh, E. J. Ciaccio, Rajamanickam Yuvaraj, and U Rajendra Acharya. Deep convolutional neural network model for automated diagnosis of schizophrenia using eeg signals. Applied Sciences, 9(14), 2019. ISSN 2076-3417. doi:10.3390/app9142870. URL https://www.mdpi.com/2076-3417/9/14/2870.
- Xu et al. [2019] Gaowei Xu, Xiaoang Shen, Sirui Chen, Yongshuo Zong, Canyang Zhang, Hongyang Yue, Min Liu, Fei Chen, and Wenliang Che. A deep transfer convolutional neural network framework for eeg signal classification. IEEE Access, 7:112767–112776, 2019.
- Zhou et al. [2018] Mengni Zhou, Cheng Tian, Rui Cao, Bin Wang, Yan Niu, Ting Hu, Hao Guo, and Jie Xiang. Epileptic seizure detection based on eeg signals and cnn. Frontiers in neuroinformatics, 12:95, 2018.
- Zhang et al. [2020] Yaqing Zhang, Jinling Chen, Jen Hong Tan, Yuxuan Chen, Yunyi Chen, Dihan Li, Lei Yang, Jian Su, Xin Huang, and Wenliang Che. An investigation of deep learning models for eeg-based emotion recognition. Frontiers in Neuroscience, 14:622759, 2020.
- Chen et al. [2023] Duo Chen, Ke Liu, Jiayang Guo, Luzheng Bi, and Jing Xiang. Brain-computer interface and its applications. Frontiers in Neurorobotics, 17:1140508, 2023.
- Zhang et al. [2022] Rongkai Zhang, Ying Zeng, Li Tong, Jun Shu, Runnan Lu, Zhongrui Li, Kai Yang, and Bin Yan. Eeg identity authentication in multi-domain features: A multi-scale 3d-cnn approach. Frontiers in Neurorobotics, 16:901765, 2022.
- Li and Feng [2019] S. Li and H. Feng. Eeg signal classification method based on feature priority analysis and cnn. In 2019 International Conference on Communications, Information System and Computer Engineering (CISCE), pages 403–406, 2019. doi:10.1109/CISCE.2019.00095.
- Chen et al. [2019] J. X. Chen, P. W. Zhang, Z. J. Mao, Y. F. Huang, D. M. Jiang, and Y. N. Zhang. Accurate eeg-based emotion recognition on combined features using deep convolutional neural networks. IEEE Access, 7:44317–44328, 2019. doi:10.1109/ACCESS.2019.2908285.
- Yanagimoto and Sugimoto [2016] M. Yanagimoto and C. Sugimoto. Recognition of persisting emotional valence from eeg using convolutional neural networks. In 2016 IEEE 9th International Workshop on Computational Intelligence and Applications (IWCIA), pages 27–32, 2016. doi:10.1109/IWCIA.2016.7805744.
- Baydemir et al. [2022] R. Baydemir, F. Latifoğlu, and F. Orhanbulucu. Classification mental workload levels from eeg signals with 1d convolutional neural network. The European Journal of Research and Development, 2(4):13–23, 2022.
- Saadati et al. [2020] M. Saadati, J. Nelson, and H. Ayaz. Convolutional Neural Network for Hybrid fNIRS-EEG Mental Workload Classification, pages 221–232. Springer, 01 2020. ISBN 978-3-030-20472-3. doi:10.1007/978-3-030-20473-0_22.
- Zemla et al. [2023] K. Zemla, G. M. Wojcik, F. Postepski, K. Wróbel, A. Kawiak, and G. Sedek. Modeling of brain cortical activity during relaxation and mental workload tasks based on eeg signal collection. Applied Sciences, 13(7), 2023. ISSN 2076-3417. doi:10.3390/app13074472. URL https://www.mdpi.com/2076-3417/13/7/4472.
- Solis-Ortiz et al. [1994] S Solis-Ortiz, J Ramos, C Arce, MA Guevara, and M Corsi-Cabrera. Eeg oscillations during menstrual cycle. International journal of neuroscience, 76(3-4):279–292, 1994.
- Krug et al. [1999] R Krug, M Mölle, HL Fehm, and J Born. Variations across the menstrual cycle in eeg activity during thinking and mental relaxation. Journal of Psychophysiology, 13(3):163, 1999.
- Bazanova et al. [2014] OM Bazanova, AV Kondratenko, OI Kuzminova, KB Muravlyova, and SE Petrova. Eeg alpha indices depending on the menstrual cycle phase and salivary progesterone level. Human Physiology, 40:140–148, 2014.
- Souza et al. [2022] Rafaela Faustino Lacerda de Souza, Thatiane Maria Almeida Silveira Mendes, Luana Adalice Borges de Araujo Lima, Daniel Soares Brandão, Diego Andrés Laplagne, and Maria Bernardete Cordeiro de Sousa. Effect of the menstrual cycle on electroencephalogram alpha and beta bands during motor imagery and action observation. Frontiers in Human Neuroscience, 16:878887, 2022.
- Wada et al. [1994] Yuji Wada, Yuko Takizawa, Jiang Zheng-Yan, and Nariyoshi Yamaguchi. Gender differences in quantitative eeg at rest and during photic stimulation in normal young adults. Clinical Electroencephalography, 25(2):81–85, 1994.
- Cantillo-Negrete et al. [2017] Jessica Cantillo-Negrete, Rubén Isaac Carino-Escobar, Paul Carrillo-Mora, Teodoro Bernardo Flores-Rodríguez, David Elias-Vinas, and Josefina Gutierrez-Martinez. Gender differences in quantitative electroencephalogram during a simple hand movement task in young adults. Revista de Investigación Clinica, 68(5):245–255, 2017.
- Wojcik et al. [2023] Grzegorz M Wojcik, Oren Shriki, Lukasz Kwasniewicz, Andrzej Kawiak, Yarden Ben-Horin, Sagi Furman, Krzysztof Wróbel, Bernadetta Bartosik, and Ewelina Panas. Investigating brain cortical activity in patients with post-covid-19 brain fog. Frontiers in Neuroscience, 17:1019778, 2023.
- Kawiak et al. [2020a] Andrzej Kawiak, Grzegorz M Wojcik, Piotr Schneider, Lukasz Kwasniewicz, and Adam Wierzbicki. Whom to believe? understanding and modeling brain activity in source credibility evaluation. Frontiers in neuroinformatics, 14:607853, 2020a.
- Kwasniewicz et al. [2021] Lukasz Kwasniewicz, Grzegorz M Wojcik, Piotr Schneider, Andrzej Kawiak, and Adam Wierzbicki. What to believe? impact of knowledge and message length on neural activity in message credibility evaluation. Frontiers in Human Neuroscience, 15:659243, 2021.
- Schneider et al. [2022] P. Schneider, G. M. Wójcik, A. Kawiak, L. Kwasniewicz, and A. Wierzbicki. Modeling and comparing brain processes in message and earned source credibility evaluation. Frontiers in Human Neuroscience, 16, 2022.
- Geodesics [2003] IE Geodesics. Net station waveform tools technical manual. s-man-200-wtfr-001 (tech. rep.), 2003.
- Geodesics [2009] I Electrical Geodesics. Geodesic photogrammetry system technical manual, 2009.
- Geodesics [2011] I Electrical Geodesics. Geosource 2.0 technical manual, 2011.
- Gramfort et al. [2013] A. Gramfort, M. Luessi, E. Larson, D. Engemann, D. Strohmeier, C. Brodbeck, R. Goj, M. Jas, T. Brooks, L. Parkkonen, and M. Hämäläinen. Meg and eeg data analysis with mne-python. Frontiers in Neuroscience, 7, 2013. ISSN 1662-453X. doi:10.3389/fnins.2013.00267. URL https://www.frontiersin.org/articles/10.3389/fnins.2013.00267.
- Appelhoff et al. [2023] Stefan Appelhoff, Austin J. Hurst, Aamna Lawrence, Adam Li, Yorguin José Mantilla Ramos, Christian O’Reilly, Liang Xiang, Jonte Dancker, Mathieu Scheltienne, and Ole Bialas. PyPREP: A Python implementation of the preprocessing pipeline (PREP) for EEG data., October 2023. URL https://doi.org/10.5281/zenodo.10047462.
- Bigdely-Shamlo et al. [2015] Nima Bigdely-Shamlo, Tim Mullen, Christian Kothe, Kyung-Min Su, and Kay A. Robbins. The prep pipeline: standardized preprocessing for large-scale eeg analysis. Frontiers in Neuroinformatics, 9, 2015. ISSN 1662-5196. doi:10.3389/fninf.2015.00016. URL https://www.frontiersin.org/articles/10.3389/fninf.2015.00016.
- Kawiak et al. [2020b] A. Kawiak, G. M. Wójcik, L. Kwasniewicz, P. Schneider, and A. Wierzbicki. Look who’s talking: Modeling decision making based on source credibility. In International Conference on Computational Science, pages 327–341. Springer, 2020b.
- Kwaśniewicz et al. [2020] Ł. Kwaśniewicz, G. M Wójcik, A. Kawiak, P. Schneider, and A. Wierzbicki. How you say or what you say? neural activity in message credibility evaluation. In International Conference on Computational Science, pages 312–326. Springer, 2020.
- EGI [2006] EGI. Net Station Waveforms Tools Technical manual. Electrical Geodesics, Inc., 2006.
- Pedregosa et al. [2011] F. Pedregosa, G. Varoquaux, A. Gramfort, V. Michel, B. Thirion, O. Grisel, M. Blondel, P. Prettenhofer, R. Weiss, V. Dubourg, J. Vanderplas, A. Passos, D. Cournapeau, M. Brucher, M. Perrot, and E. Duchesnay. Scikit-learn: Machine learning in Python. Journal of Machine Learning Research, 12:2825–2830, 2011.
- Lawhern et al. [2018] Vernon J Lawhern, Amelia J Solon, Nicholas R Waytowich, Stephen M Gordon, Chou P Hung, and Brent J Lance. Eegnet: a compact convolutional neural network for eeg-based brain–computer interfaces. Journal of Neural Engineering, 15(5):056013, July 2018. ISSN 1741-2552. doi:10.1088/1741-2552/aace8c. URL http://dx.doi.org/10.1088/1741-2552/aace8c.
- Hochreiter and Schmidhuber [1997] Sepp Hochreiter and Jürgen Schmidhuber. Long short-term memory. Neural computation, 9(8):1735–1780, 1997.
- Yang et al. [2020] Jinru Yang, Xiaofan Huang, Hongkai Wu, and Xingtong Yang. Eeg-based emotion classification based on bidirectional long short-term memory network. Procedia Computer Science, 174:491–504, 2020. ISSN 1877-0509. doi:https://doi.org/10.1016/j.procs.2020.06.117. URL https://www.sciencedirect.com/science/article/pii/S1877050920316379. 2019 International Conference on Identification, Information and Knowledge in the Internet of Things.
- Hu et al. [2020] Xinmei Hu, Shasha Yuan, Fangzhou Xu, Yan Leng, Kejiang Yuan, and Qi Yuan. Scalp EEG classification using deep Bi-LSTM network for seizure detection. Computers in Biology and Medicine, 124:103919, September 2020. ISSN 1879-0534. doi:10.1016/j.compbiomed.2020.103919.
- Schmidhuber [2015] J. Schmidhuber. Deep learning in neural networks: An overview. Neural networks, 61:85–117, 2015.
- Sanghun and Chulhee [2020] L. Sanghun and L. Chulhee. Revisiting spatial dropout for regularizing convolutional neural networks. Multimedia Tools and Applications, 79:1–13, 12 2020. doi:10.1007/s11042-020-09054-7.
- Springenberg et al. [2014] J. T. Springenberg, A. Dosovitskiy, T. Brox, and M. Riedmiller. Striving for simplicity: The all convolutional net. arXiv preprint arXiv:1412.6806, 2014.
- Srivastava et al. [2014] N. Srivastava, G. Hinton, A. Krizhevsky, I. Sutskever, and R. Salakhutdinov. Dropout: A simple way to prevent neural networks from overfitting. J. Mach. Learn. Res., 15(1):1929–1958, jan 2014. ISSN 1532-4435.
- Xu et al. [2020] Gaowei Xu, Tianhe Ren, Yu Chen, and Wenliang Che. A one-dimensional cnn-lstm model for epileptic seizure recognition using eeg signal analysis. Frontiers in Neuroscience, 14, 2020. ISSN 1662-453X. doi:10.3389/fnins.2020.578126. URL https://www.frontiersin.org/journals/neuroscience/articles/10.3389/fnins.2020.578126.
- Li et al. [2022] Hongli Li, Man Ding, Ronghua Zhang, and Chunbo Xiu. Motor imagery eeg classification algorithm based on cnn-lstm feature fusion network. Biomedical Signal Processing and Control, 72:103342, 2022. ISSN 1746-8094. doi:https://doi.org/10.1016/j.bspc.2021.103342. URL https://www.sciencedirect.com/science/article/pii/S1746809421009393.
- Hossin and Sulaiman [2015] M. Hossin and M.N. Sulaiman. A review on evaluation metrics for data classification evaluations. International Journal of Data Mining & Knowledge Management Process, 5:01–11, 2015. URL https://api.semanticscholar.org/CorpusID:61877559.
- Prakash et al. [2022] Allam Jaya Prakash, Kiran Kumar Patro, Mohamed Hammad, Ryszard Tadeusiewicz, and Paweł Pławiak. Baed: A secured biometric authentication system using ecg signal based on deep learning techniques. Biocybernetics and Biomedical Engineering, 42(4):1081–1093, 2022.
- Daoui et al. [2023] Achraf Daoui, Mohamed Yamni, Torki Altameem, Musheer Ahmad, Mohamed Hammad, Paweł Pławiak, Ryszard Tadeusiewicz, and Ahmed A. Abd El-Latif. Aucfsr: Authentication and color face self-recovery using novel 2d hyperchaotic system and deep learning models. Sensors, 23(21):8957, 2023.
- Kandukuri et al. [2023] Usha Rani Kandukuri, Allam Jaya Prakash, Kiran Kumar Patro, Bala Chakravarthy Neelapu, Ryszard Tadeusiewicz, and Paweł Pławiak. Constant q–transform–based deep learning architecture for detection of obstructive sleep apnea. International Journal of Applied Mathematics and Computer Science, 33(3):493–506, 2023.
- Chatrian et al. [1985] G. E. Chatrian, E. Lettich, and P. L. Nelson. Ten percent electrode system for topographic studies of spontaneous and evoked eeg activities. American Journal of EEG technology, 25(2):83–92, 1985.
- Kawala-Janik et al. [2014] Aleksandra Kawala-Janik, Michal Podpora, Jerzy Baranowski, Waldemar Bauer, and Mariusz Pelc. Innovative approach in analysis of eeg and emg signals—comparision of the two novel methods. In 2014 19th International Conference on Methods and Models in Automation and Robotics (MMAR), pages 804–807. IEEE, 2014.
- Kahankova et al. [2017] Radana Kahankova, Rene Jaros, Radek Martinek, Janusz Jezewski, He Wen, Michal Jezewski, and Aleksandra Kawala-Janik. Non-adaptive methods of fetal ecg signal processing. Advances in Electrical and Electronic Engineering, 15(3):476–490, 2017.
- Mikołajewska et al. [2017] Emilia Mikołajewska, Piotr Prokopowicz, and Dariusz Mikolajewski. Computational gait analysis using fuzzy logic for everyday clinical purposes–preliminary findings. Bio-Algorithms and Med-Systems, 13(1):37–42, 2017.
- Prokopowicz et al. [2017] Piotr Prokopowicz, Dariusz Mikołajewski, Emilia Mikołajewska, and Piotr Kotlarz. Fuzzy system as an assessment tool for analysis of the health-related quality of life for the people after stroke. In Artificial Intelligence and Soft Computing: 16th International Conference, ICAISC 2017, Zakopane, Poland, June 11-15, 2017, Proceedings, Part I 16, pages 710–721. Springer, 2017.