1]\orgnameUniversity of Maryland, \orgaddress \cityCollege Park, \stateMaryland, \countryUSA
Auditing the Fairness of COVID-19 Forecast Hub’s Case Prediction Models
Abstract
The COVID-19 Forecast Hub, a repository of COVID-19 forecasts from over 50 independent research groups, is used by the Centers for Disease Control and Prevention (CDC) for their official COVID-19 communications. As such, the Forecast Hub is a critical centralized resource to promote transparent decision making. Nevertheless, by focusing exclusively on prediction accuracy, the Forecast Hub fails to evaluate whether the proposed models have similar performance across social determinants that have been known to play a role in the COVID-19 pandemic including race, ethnicity and urbanization level. In this paper, we carry out a comprehensive fairness analysis of the Forecast Hub model predictions and we show statistically significant diverse predictive performance across social determinants, with minority racial and ethnic groups as well as less urbanized areas often associated with higher prediction errors. We hope this work will encourage COVID-19 modelers and the CDC to report fairness metrics together with accuracy, and to reflect on the potential harms of the models on specific social groups and contexts.
keywords:
Audit, Bias, Group Fairness, Covid-19 prediction models, Error Parity, Statistical Analysis1 Introduction
The COVID-19 Forecast Hub was founded in 2020 and serves as a “central repository of COVID-19 forecasts from over 50 independent research groups” [1]. Participant research groups submit county, state and national US COVID-19 forecasts with a standardized format; and the Forecast Hub provides an interactive visualization tool to help decision makers and the general public analyze weekly predictions for COVID-19 hospitalizations, cases and deaths. The standardized predictions collected from all research groups, as well as the predictions for an ensemble model that brings all individual predictions together, are also shared with the Centers for Disease Control and Prevention (CDC) who uses these results for their official COVID-19 communications [2].
The COVID-19 Forecast Hub has been, and continues to be, a critical centralized resource to promote transparent decision making. Nevertheless, by focusing exclusively on prediction accuracy at different spatial granularities (e.g., county or state), the Forecast Hub fails to evaluate whether the proposed models are fair i.e., share similar prediction performance across social determinants that have been known to play a role in COVID-19 including race, ethnicity and rurality [3, 4]. Diverse prediction performance across social determinants - for example, higher prediction errors for a given minority race or ethnicity - could negatively impact resource allocation and intervention decisions e.g., hospital beds or stay-at-home orders, given that the CDC appears to be using the Forecast Hub predictions for official communications that subsequently inform policy decisions [2]. In other words, allocation or intervention harms might occur if models from the Forecast Hub are used to inform decision making across communities without taking into account fairness metrics [5].
There are many reasons why the COVID-19 prediction performance can be different across social determinants such as race, ethnicity or urbanization levels. The Forecast Hub’s COVID-19 prediction models are trained on datasets containing COVID-19 statistics for hospitalizations, cases or deaths. Nevertheless, researchers have reported several problems associated to how these datasets are collected [6, 3]. For example, a lack of consistency in reporting race and ethnicity across jurisdictions, has generated a lot of missing racial data. That data is often excluded due to its incompleteness, potentially affecting the actual total hospitalizations, cases or deaths for minority race and ethnicity groups which might be less reported. In addition, there are occasions where the race is reported by the medical staff instead of being self-reported, which is the most accurate source and prevents errors. For example, the CDC reports that the latest research on race and Hispanic origin misclassification on COVID-19 death certificates shows that deaths are underreported by 33% for non-Hispanic American Indian or Alaska Natives, by 3% for non-Hispanic Asian or Pacific Islanders, and by 3% for Hispanic decedents [7]. But more concerning is the fact that testing has been inadequate for minority groups across the country, such as Latino communities [8], thus affecting the accuracy of the overall COVID-19 statistics, with under-reporting bias perpetuating the invisibility of racial and ethnic minorities in general COVID-19 statistics. A similar effect has been observed in rural counties and states, with rural areas associated to lower testing rates, thus disproportionately detecting fewer cases of COVID-19 in these regions [4].
To exacerbate this situation even more, COVID-19 prediction performance across social determinants can also be affected by additional datasets used in the training of some of the COVID-19 prediction models. Specifically, around 50% of the Forecast Hub’s models use human mobility data from Safegraph [9], Apple [10] or Google [11] among others, to complement COVID-19 predictions (see Figure 1a). Human mobility data can characterize origin-destination trips, visits to specific points of interest (POI), or the volumes of different types of trips (e.g., car vs. public transit). Research has shown that mobility data can improve the prediction accuracy of COVID-19 cases, deaths and hospitalizations [12, 13, 14]. Nevertheless, researchers have also identified that mobility data suffers from sampling bias across race and age groups [15] with, for example, elder and Black communities being less represented [16]. Similarly to the COVID-19 case under-reporting bias, mobility data sampling bias could also affect the fairness of COVID-19 predictions across social groups.
In this paper, we propose - to the best of our knowledge - the first thorough fairness analysis of the COVID-19 prediction models in the Forecast Hub. Specifically, we focus on COVID-19 case prediction models at the county level, since these are closer to local realities and allow for more actionable decision making than state-level predictions. We propose to measure the group fairness of COVID-19 case prediction models by assessing the differences in error rates at the county level across groups for two protected attributes: race or ethnicity, and urbanization level [17, 18]. Accurately computing this group fairness metric for race and ethnicity would require access to county-level COVID-19 case data stratified by race or ethnicity, which would allow us to compare predicted versus actual case county statistics for each racial group. Nevertheless, a systemic failure in COVID-19 data collection has prevented many counties in the US from collecting this critical data [19]. Hence, to be able to carry out a fairness analysis of the Forecast Hub’s COVID-19 prediction models, we propose several approaches to associate prediction errors in a given county with race or ethnicity labels using information from the American Community Survey (ACS) [20]; and evaluate whether these race association approaches might impact the fairness analysis. Additionally, to support researchers in the Forecast Hub, we also investigate how group fairness metrics for race, ethnicity and urbanization level change across model characteristics such as model type (e.g., deep learning versus statistical), training data (e.g, with or without mobility data), lookaheads (e.g., predicting cases for next week versus in four weeks) or pandemic phases. Finally, we also describe a dashboard that we have designed to allow decision makers and researchers explore fairness nutritional cards for each Forecast Hub model [21]. The main contributions of this paper are:
-
•
We present a thorough fairness analysis of the CDC Forecast Hub’s COVID-19 county case prediction models across race, ethnicity and urbanization level. We carry out statistical analyses identifying differences in performance across groups and types of models, datasets, lookaheads and phases. Our research shows statistically significant differences in predictive errors with some minority racial and ethnic groups as well as rural areas associated with significantly higher errors.
-
•
We propose several approaches to associate county model prediction errors to race or ethnicity, and evaluate whether different associations produce similar or different fairness results. Our analysis depicts similar findings across approaches, with higher prediction errors often associated with minority groups independently of the race association approach used.
-
•
We present a dashboard where researchers and decision makers at the CDC and beyond will be able to explore fairness nutritional cards per individual model across race, ethnicity and urbanization level, and how fairness might vary across model and data characteristics.
2 Related Work
Over the past four year, numerous research groups from both academia and industry have focused on developing models to forecast COVID-19 cases, hospitalizations and deaths in the United States. The COVID-19 Forecast Hub [22] has been instrumental in collating these efforts, ranging from deep learning methods [23, 24, 25, 26] to compartmental models [27, 28], statistical models [29, 30], or combinations of these via ensemble models [31, 22].
Human mobility data has been used in the past to model and characterize human behaviors in the built environment [32, 33, 34, 35, 36], to support decision making for socio-economic development [37, 38, 39, 40, 41], for public safety [42, 43], as well as during epidemics and disasters [44, 45, 46, 47, 48, 49]. During the COVID-19 pandemic, human mobility has also played a central role in driving decision making, and more than of the Forecast Hub models have incorporated mobility data into their prediction models, acknowledging the impact of human movement on virus propagation [24, 25, 26, 15, 50, 13].
A pivotal concern in the development of COVID-19 prediction models is their fairness and potential bias. The pandemic has highlighted existing disparities in healthcare, with significant differences in COVID-19 infection rates, hospital admissions, and deaths among different racial and ethnic groups as well as across the urban-rural spectrum [51, 4]. These disparities risk being perpetuated in model predictions if not adequately addressed. Research in the area of COVID-19 forecasts has focused on incorporating socio-economic and demographic data to evaluate model fairness [13, 15] and employing techniques like reinforcement learning for bias mitigation [52]. However, fairness analyses have not been carried out for the Forecast Hub models, which is critical given that model predictions are being shared by the CDC to support decision making.
Prior work has proposed several regression fairness metrics to assess group fairness in regression-type models like the ones used for COVID-19 predictions [53, 54, 55]; and researchers have proposed multiple hypothesis testing frameworks to identify the presence of statistically significant differences in fairness metrics across various social determinants [56, 57, 58, 59, 60]. In this paper, we focus on error parity as a measure of group fairness [57] to reveal whether the distribution of prediction errors is statistically significantly different, or not, across groups for two social determinants: race or ethnicity and urbanization level.
3 Data
For the purpose of our study, we focus exclusively on the weekly, county-level COVID-19 case predictions publicly available from the COVID-19 Forecast Hub across all US counties [1]. The weekly incidence predictions in the Forecast Hub are uploaded by participating teams and defined as the newly anticipated COVID-19 cases per county within the following epidemiological week, extending from Sunday to Saturday. We use the weekly forecasts during the period from July 2020 to October 2022.
The hub’s data repository offers both point forecasts and quantile-based probabilistic forecasts. Our study employs the latter, leveraging the seven provided quantiles ([0.025, 0.100, 0.250, 0.500, 0.750, 0.900, 0.975]) to gain insights into the uncertainty ranges and confidence intervals posited by the forecasting models. From the entire cohort of models and teams contributing to the Forecast Hub, we selected teams that met our inclusion criteria: they provided comprehensive quantile forecasts throughout our period of analysis and they submitted predictions at the county-level. A Gantt chart depicting the specific quantile forecasts used to evaluate each model is shown in the Appendix (see Figure 10). The empirical evaluation of the group fairness of these forecasts - modeled as error parity across social groups - is conducted using the ground truth case data sourced from the JHU CSSE COVID-19 Data [61]; race and ethnicity data from the ACS [20] and urbanization levels from the CDC [62].
Given our interest in understanding how group fairness metrics for race, ethnicity and urbanization change across model and data characteristics, we break down the prediction performance and fairness analyses across four aspects:
-
•
Model Types: Based on information reported in the papers associated to each of the predictive models, we have manually classified them into five categories, namely: Statistical, Compartmental, Deep Learning, Baseline, and Ensemble (see Table 1 in the Appendix). This classification aims to discern the potential influence of model typologies on forecast performance and to identify any systematic biases inherent to specific modeling approaches.
-
•
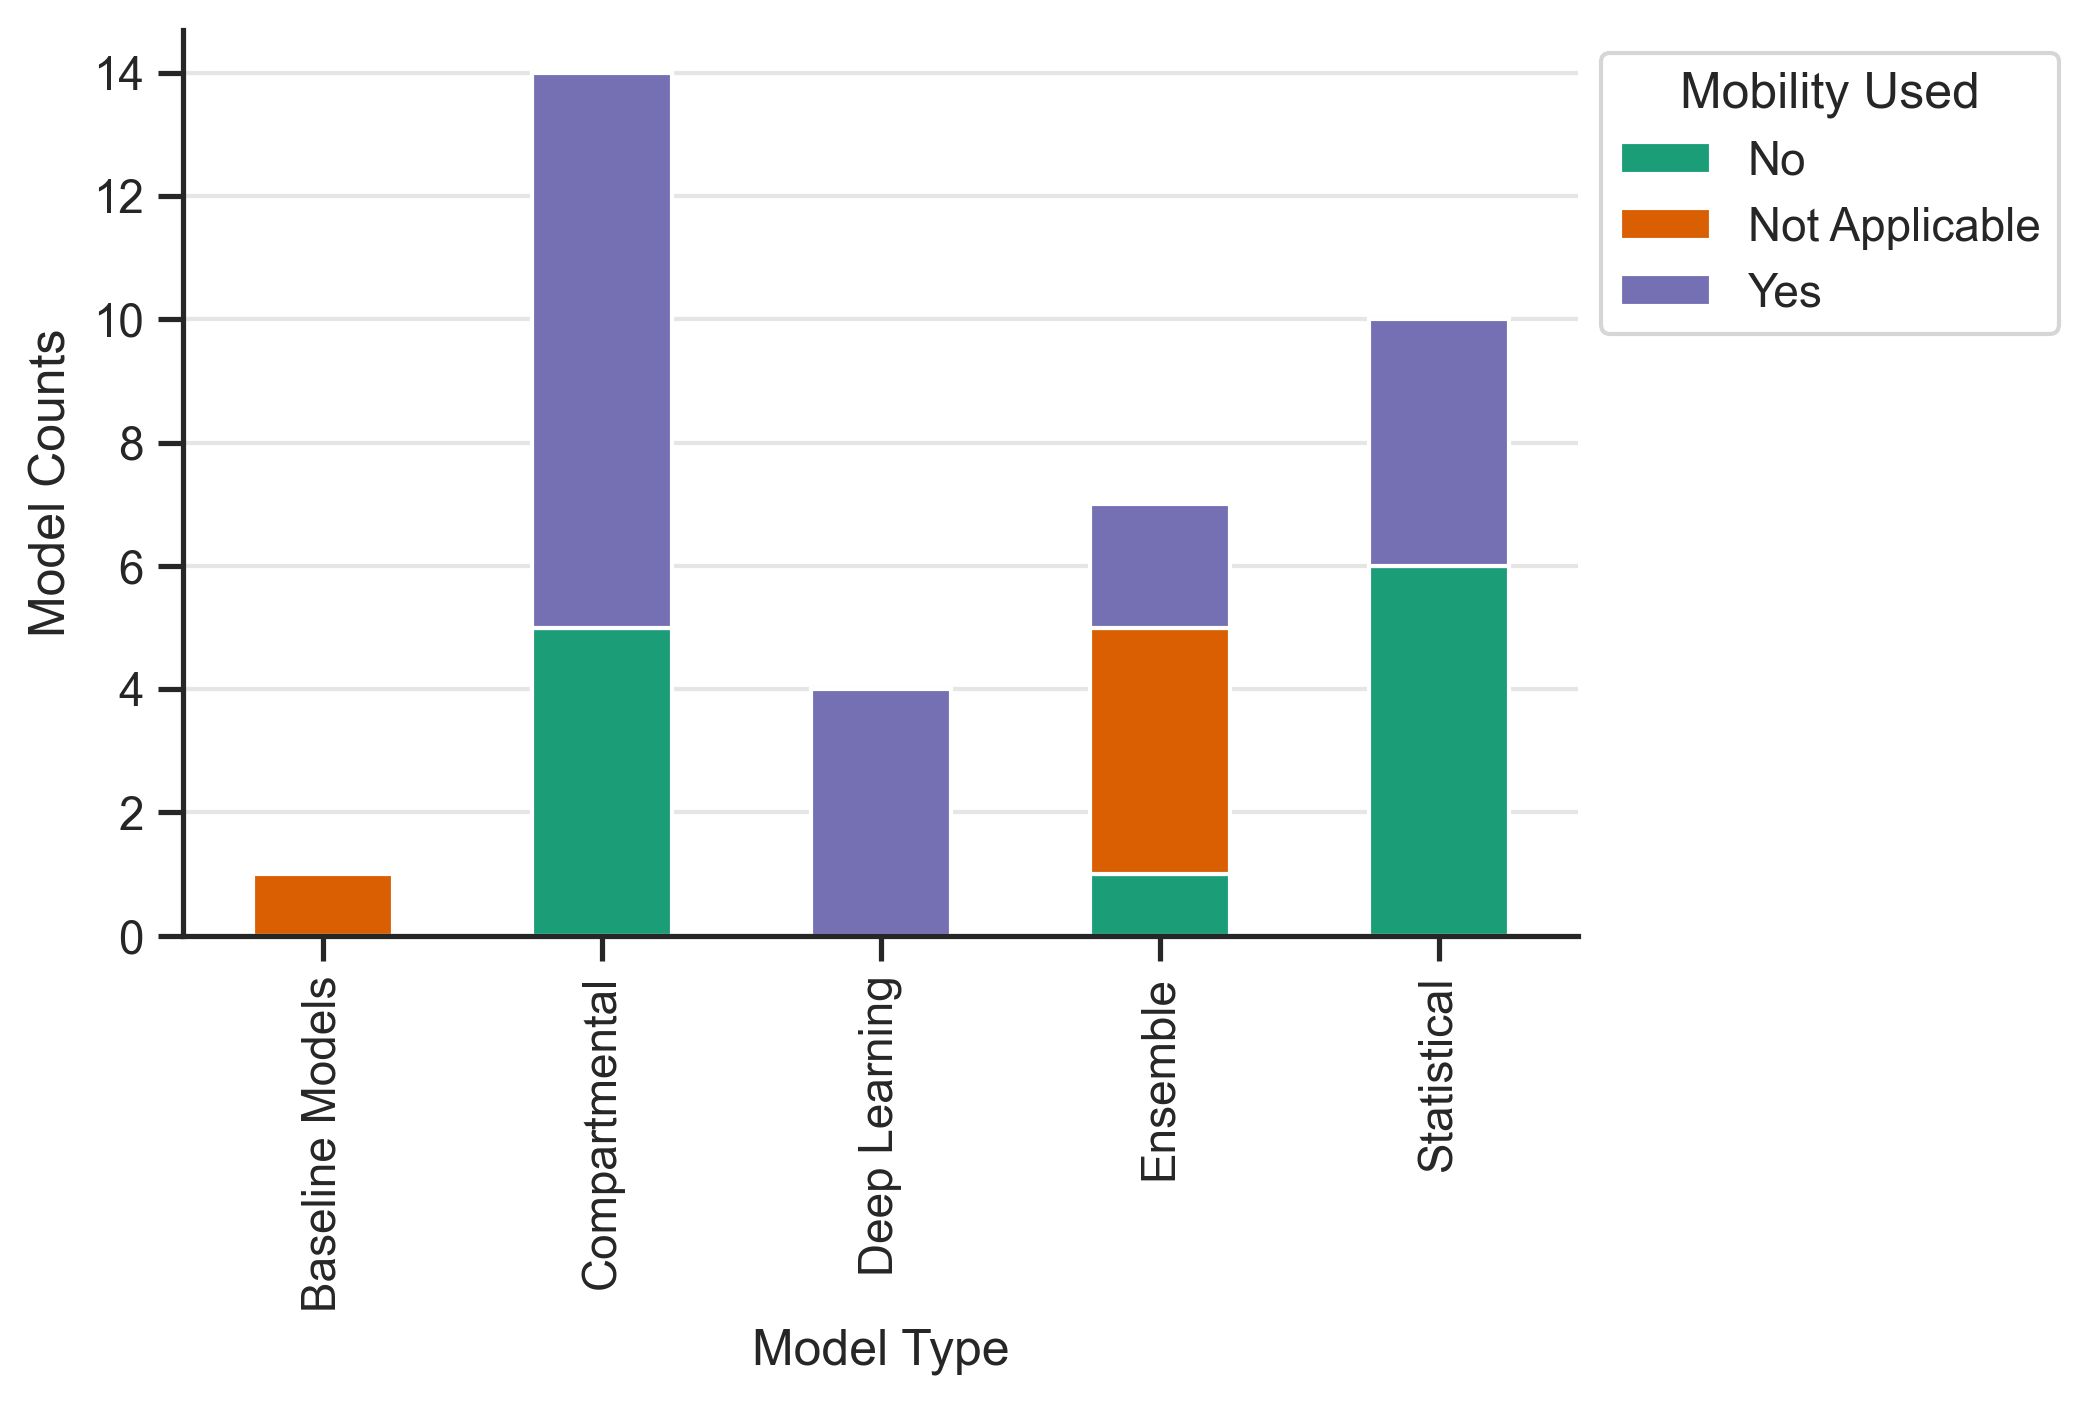
Mobility Used: By distinguishing between models that integrate mobility data and those that do not, we explore the effect of mobility trends on forecast accuracy and the possible introduction of biases resulting from this additional data dimension. Figure 1a displays a categorization of the forecasting models, differentiated by both the type of model and the incorporation of mobility data, as quantified by their respective counts.
-
•
Lookaheads: We use forecasts ranging from 1 week to 4 weeks (a.k.a lookaheads), allowing us to evaluate differences in the predictive accuracy of the hub’s models across race, ethnicity and the rural-urban spectrum for short and medium-term horizons: at 7, 14, 21 and 28 days.
-
•
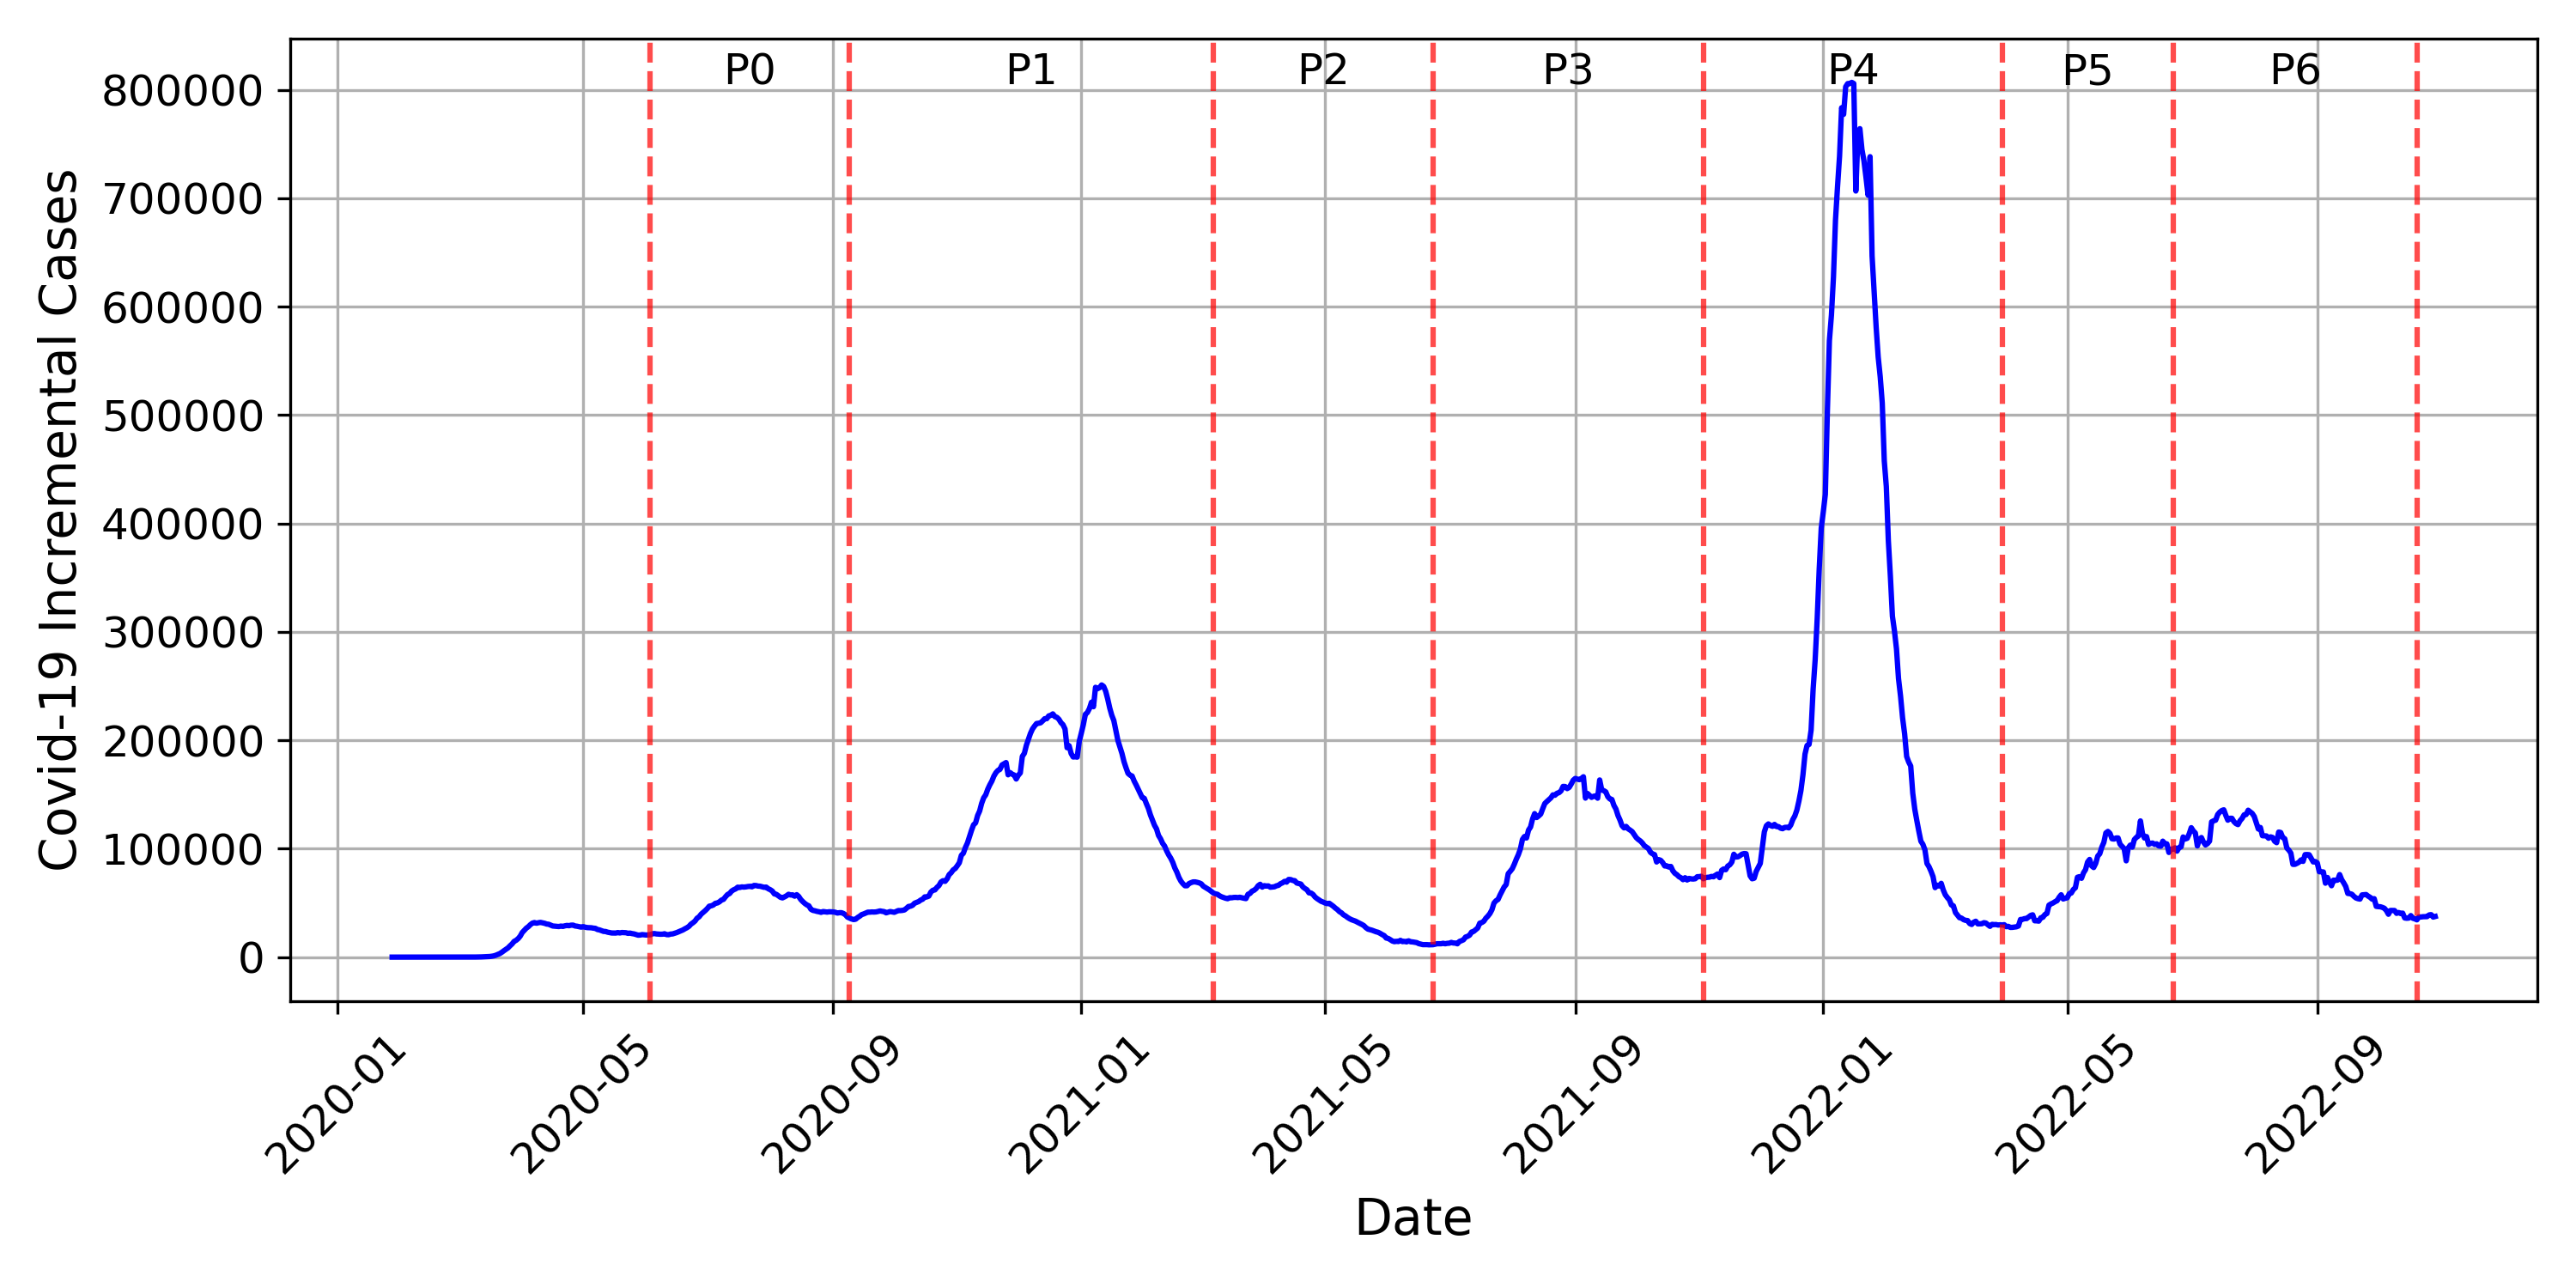
Phases: COVID-19 case numbers differ a lot across pandemic stages. To understand whether phases play a role in model fairness across race, ethnicity and urbanization level, we divide the period under study into seven phases, identified based on the presence of valleys and peaks in the volume of COVID-19 cases (see Figure 1b).
4 Analytical Approach
Our analysis focuses on two thrusts (i) quantifying the fairness of the COVID-19 case predictions from the Forecast Hub models, with fairness measured as county PBL error parity for two protected attributes: race or ethnicity and urbanization level i.e., we evaluate whether there exist statistically significant differences between the PBL errors across racial and ethnic groups as well as across urban-rural codes; and (ii) quantifying the changes in fairness when county PBL errors are stratified by model and data characteristics including model type, training data used (w/o mobility), lookahead and pandemic phases. To carry out this analysis, we follow three steps.
Step One. We focus on county error parity as a measure of fairness. Hence, we first need to compute the weekly forecast error at the county level for all the counties in the US. To evaluate the accuracy of COVID-19 case forecasts, and given that forecasts in the Forecast Hub are uploaded by teams as quantiles, we employ the pinball loss metric. This metric quantifies the error of a probabilistic forecast by measuring the distance between observed values and the predicted quantiles, penalizing over- or under-estimation asymmetrically to reflect the actual cost of errors in the prediction. The pinball loss is represented as: and as , where denotes a county’s pinball loss for a given quantile , is the observed value, and is the forecasted value at quantile . For our analysis, we use the average county pinball loss (PBL), computed across the set of quantiles: , and normalized by the county population.
Step Two. Once weekly average PBLs have been computed per county, we need to associate counties - and their corresponding prediction errors - with a protected attribute: race or ethnicity as well as urbanization level; these associations will then be used to quantify similarities and differences between errors and attributes - error parity - in Step Three. Associating counties, and their PBL errors, to urbanization levels is straight forward using the CDC urban-rural classification scheme [62]. This scheme classifies counties into six urbanization levels, from highly urban (1) to rural (6). For this paper, we group them into three labels: Large Metropolitan areas (LM, which correspond to codes 1 and 2), Small and Medium Metropolitan (SMM, codes 3 and 4) and Micropolitan and Non-core areas (MC, codes 5 and 6).
On the other hand, associating counties, and their PBL prediction errors, with race and ethnicity would require access to race-stratified predictions. However, due to systemic data collection failures during the pandemic, the race-stratified COVID-19 case data necessary to compute race-stratified prediction errors were not collected, hence limiting the predictions provided by the Forecast Hub to county level predictions across all racial and ethnic groups [19]. To overcome this limitation, we propose three different approaches that associate county PBL errors with the county’s race and ethnicity. Our analysis will also evaluate whether different associations produce similar or different fairness results. Using race and ethnicity distributions from the American Community Survey (ACS), we propose three approaches:
-
•
Majority Approach: This method involves categorizing each county based on its predominant racial group i.e., the county is labeled as being of race or ethnicity X if that county has more than 50% of the population of group X. The PBL for that county is then associated with the majority race. Given the county race and ethnicity distributions in the US, no county can be labeled as Asian majority. As a result, we create a ‘Non-white’ categorization, where any county where the White population is 49% or less is classified as ’Non-White’. Overall, this approach identifies four different labels: Black (Black or African American Non-Hispanic); Hispanic (Hispanic only from the census), White (White Non-Hispanic); and Non-White. See Table 4 in the Appendix for specific counts, and Figure 11 for a map of the county distribution by race.
-
•
Plurality Approach: This approach categorizes each county based on plurality or in other words, the race percentage that is the highest. For this approach, and given the US county race and ethnicity distributions, we identify four groups: Asian (Asian American Non-Hispanic), Black (Black or African American Non-Hispanic), Hispanic (Hispanic only from the census), and White (White Non-Hispanic). The PBL error for a given county is then associated with one of these four labels (see Table 4 in the Appendix for specific counts, and Figure 12 for a map of the county distribution by race).
-
•
Distribution Approach: Rather than assigning counties to one unique race or ethnicity, this method represents each county by the distribution of race and ethnic percentages provided by the ACS i.e., a county is labelled as being A% Asian, B% Black, H% Hispanic and W% White; and we then associate the PBL county errors to its county race distributions (further details about this process are covered in Step Three).
Step Three. Once all county forecast errors have been associated with race, ethnicity and rural-urban codes, we carry out a statistical analysis to measure the prediction error parity across two protected attributes: race and urbanization level i.e., we evaluate whether there exist statistically significant differences between the normalized PBL errors across racial and ethnic groups as well as between the PBL errors across urban-rural codes.
For majority and plurality approaches, as well as for rural-urban codes, we conduct one-way Analysis of Covariance (ANCOVA) tests followed by Tukey-HSD (Honest Significant Difference) post-hoc tests between the PBL error distributions across racial and ethnic groups as well as between the PBL error distributions across rural-urban codes to expose whether significant differences exist between these distributions, which could point to unfairly higher errors for certain racial or urban-rural groups. Differences between error distributions across racial/ethnic groups or rural-urban codes, could be due to underlying COVID-19 risk factors such as age 65+ or pulmonary diseases (COPD) i.e., counties with elder individuals or individuals with underlying respiratory conditions are more prone to COVID-19 infections [63, 64], which might in turn affect the volume of cases and the errors associated with their prediction. To account for these confounders, we incorporate the percentage of individuals age 65+ per race as a control variable in the ANCOVA tests. Although county level estimates of respiratory disease (COPD) exist at the county level (see the PLACES survey from the CDC [65]), these are not disaggregate by race and hence we cannot consider it as a control for the ANCOVA tests.
Additionally, to understand whether the similarities and differences in the error distributions across race, ethnicity or urbanization levels might change when model or data characteristics are taken into account (model type, the use of mobility data during training, lookahead or phase) we use two-way ANCOVA tests. The two-way ANCOVA, followed by Tukey-HSD, will allow us to identify whether statistically significant differences in error distributions for a given race, ethnicity or rural-urban code hold across modeling and data choices or whether the performance differences are more prevalent for specific types of models or datasets. To achieve this, we run two-way ANCOVA tests between the PBL error distributions of all race and ethnicity groups and the PBL distributions of one model or data characteristic at a time; and we replicate this approach for the rural-urban codes. ANCOVA tests have been shown to be an adequate choice even in violation of normality, and in the presence of unequal sample sizes, like our racial and urbanization level distributions (see Tables 4, 4, 4); thus, we choose this parametric test due to its superior strength. Similarly to the one-way ANCOVA, we control for the percentage of individuals who are age 65+ per race when running the two-way ANCOVA tests between the errors across race/ethnicity or urban-rural codes and model or data characteristics.
For the distribution approach, we need a different process to evaluate the fairness of the predictions across racial and ethnic groups. In fact, unlike the majority and plurality approaches that associate counties with a unique racial or ethnic group, the distribution approach associates counties with the percentages of all the racial and ethnic groups present in its territory. Hence, to evaluate whether there exist differences between PBL error distributions across racial and ethnic groups, we propose to conduct a regression analysis where county PBL errors are regressed against the racial and ethnic percentage distributions within each county (with White race as the reference group to avoid collinearity). An analysis of the resulting regression coefficients can provide insights into how different racial compositions might be positively or negatively associated with forecast accuracy, potentially identifying unfairly higher errors for certain racial or ethnic groups. Similarly to the ANCOVA tests, we include controls in the regression to account for the potential role of age and underlying respiratory conditions in the prediction errors. Given that counties are represented by a distribution of the percentages of all of its racial and ethnic groups, we include as control variables the percentage of individuals in a county who are 65+ (across races) as well as the percentage of individuals in a county that suffer from COPD (across all races in the county). Both statistics are available at the county level from the ACS and from PLACES [65]. The final regression for the fairness analysis using the distribution approach for race assignment can be formalized as: .
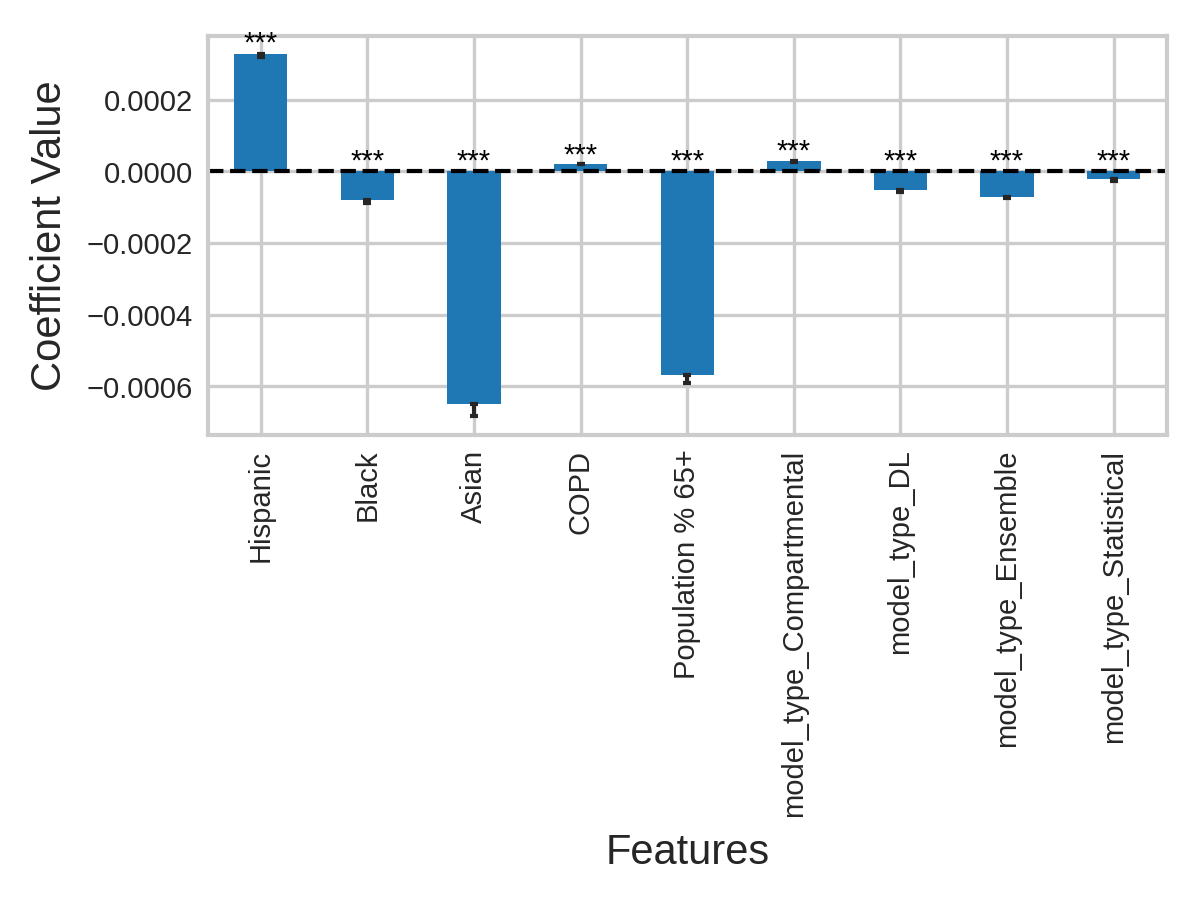
On the other hand, to evaluate whether the relationship between PBL error distributions and race or ethnicity (defined using the distribution approach) might change when model or data characteristics are taken into account, we regress the county PBL errors against racial and ethnic percentages for that county (with the White group as a baseline) while controlling for one categorical model or data characteristic at a time, for the percentage of individuals in the county that are 65+ and for the percentage of individuals in the county that suffer from COPD. For example, to understand the relationship between errors, race and ethnicity controlling for model type, we would carry out a coefficient analysis for this regression: with race being Asian, Black, Hispanic (White as reference) and Model Type being Statistical, Compartmental, Deep Learning, or Ensemble (Baseline as reference since model type is also a categorical variable). In the rest of the paper, we present our main findings following the methodology described in this section.
5 Results
racial and ethnic groups.

5.1 Fairness of COVID-19 case predictions across race and ethnicity
Next, we discuss differences in error distributions (PBL) across racial and ethnic groups using each of the three race association approaches described in section 4.
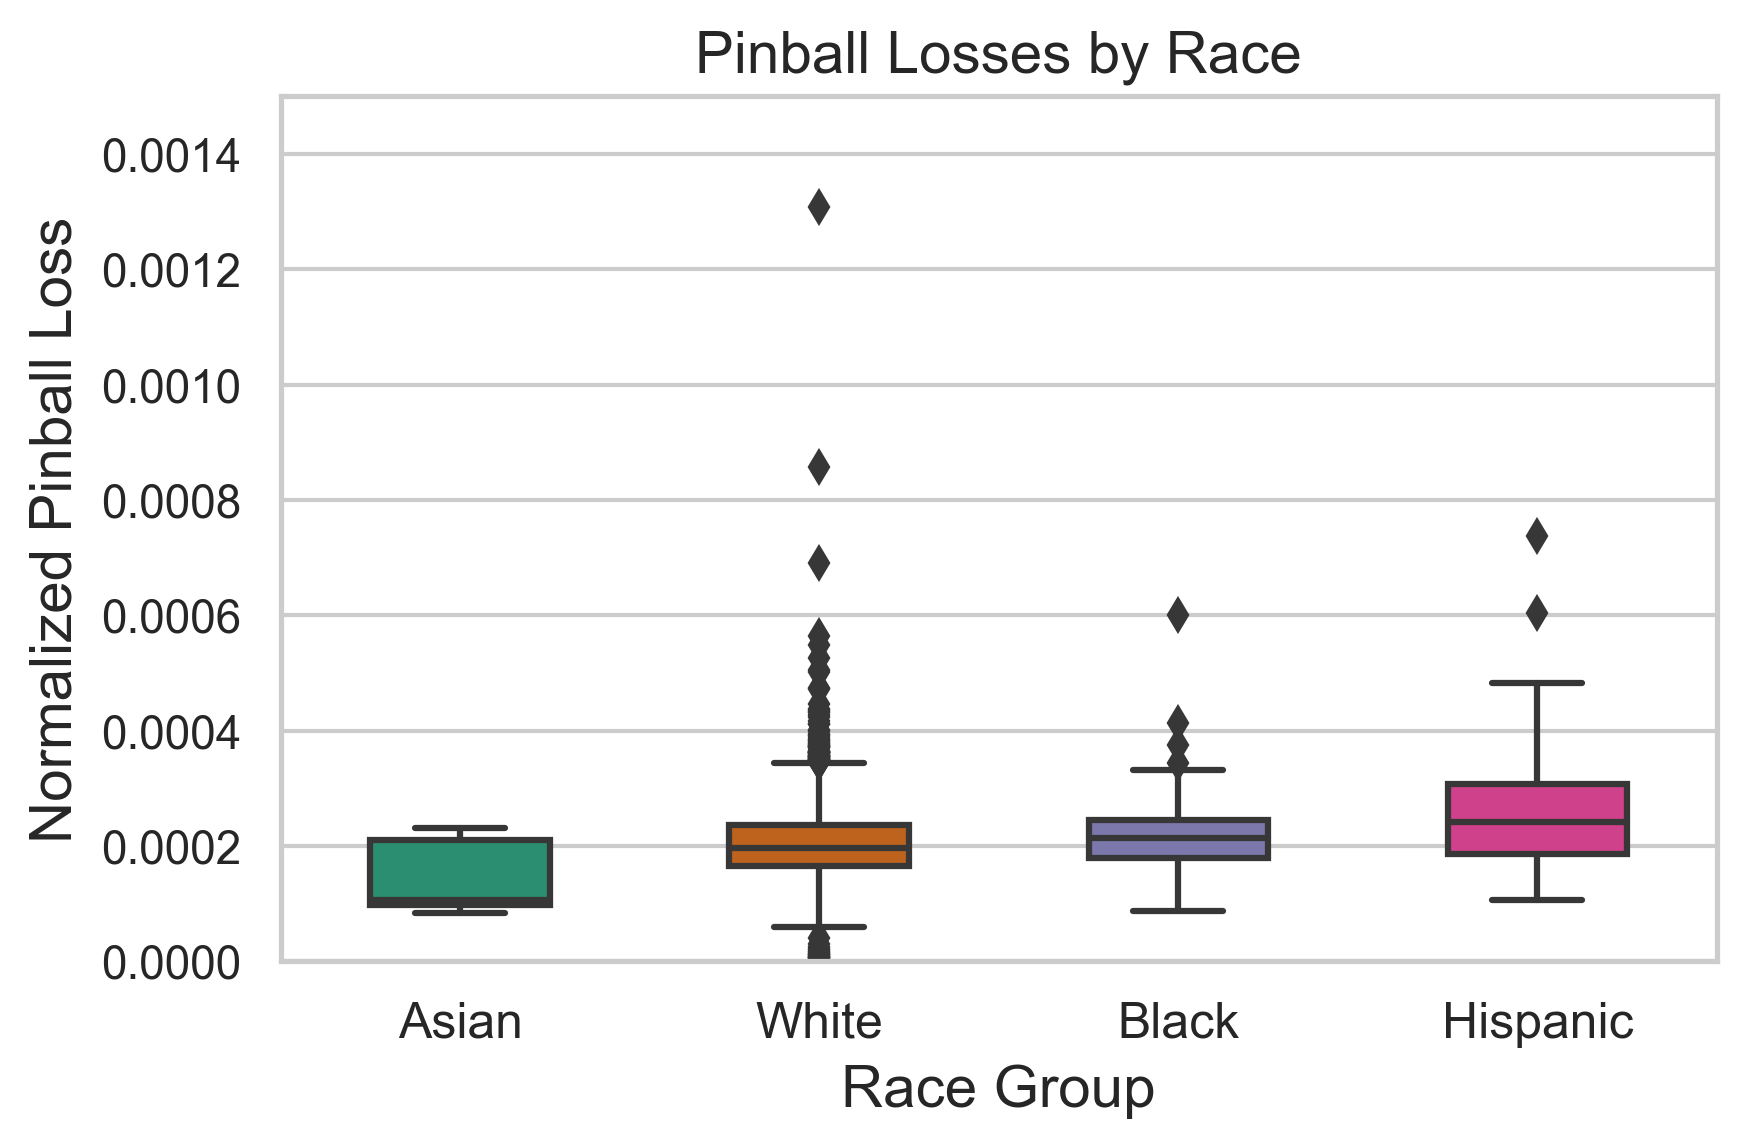
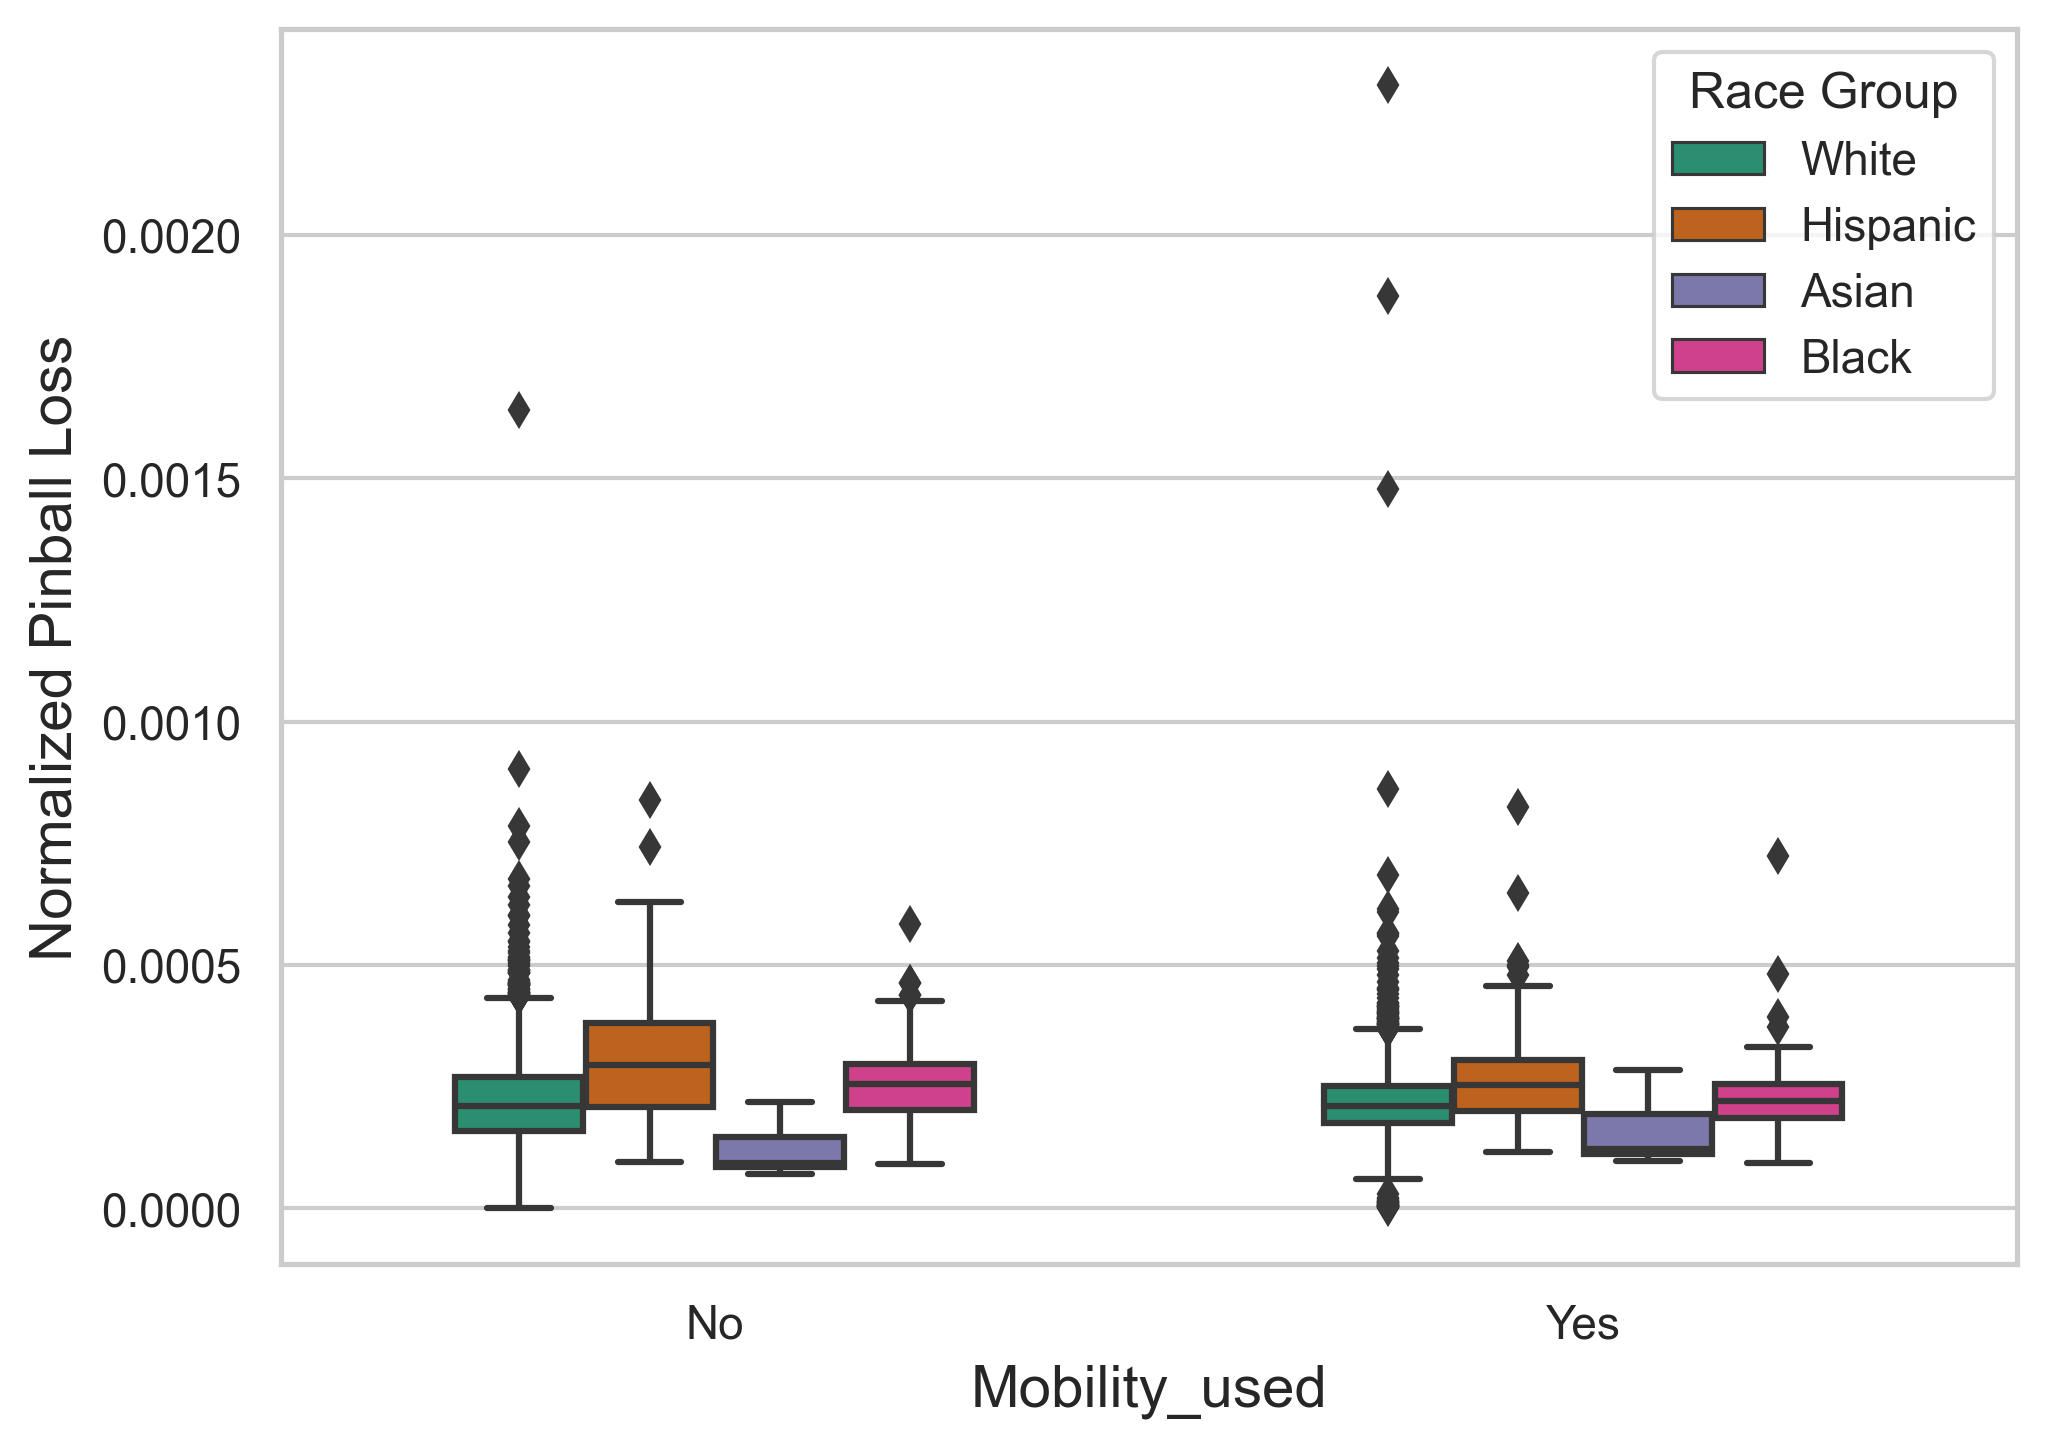
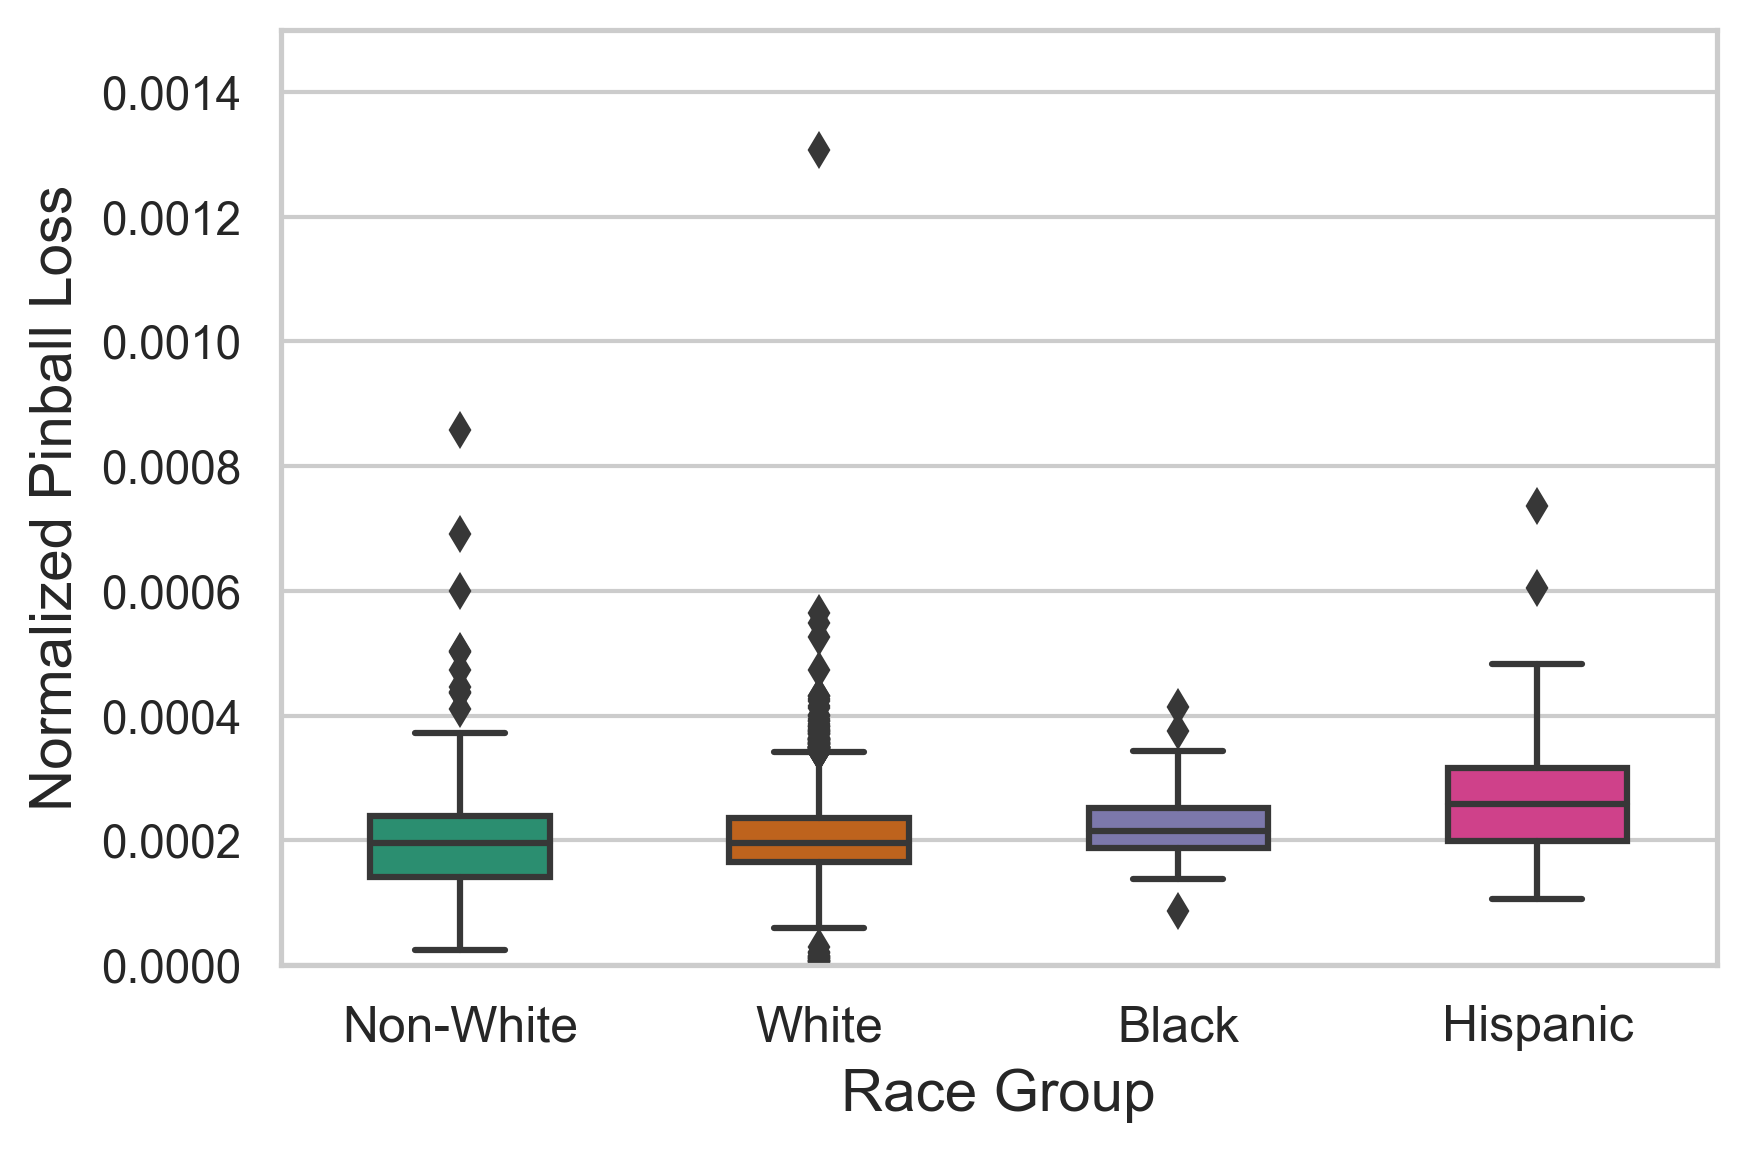
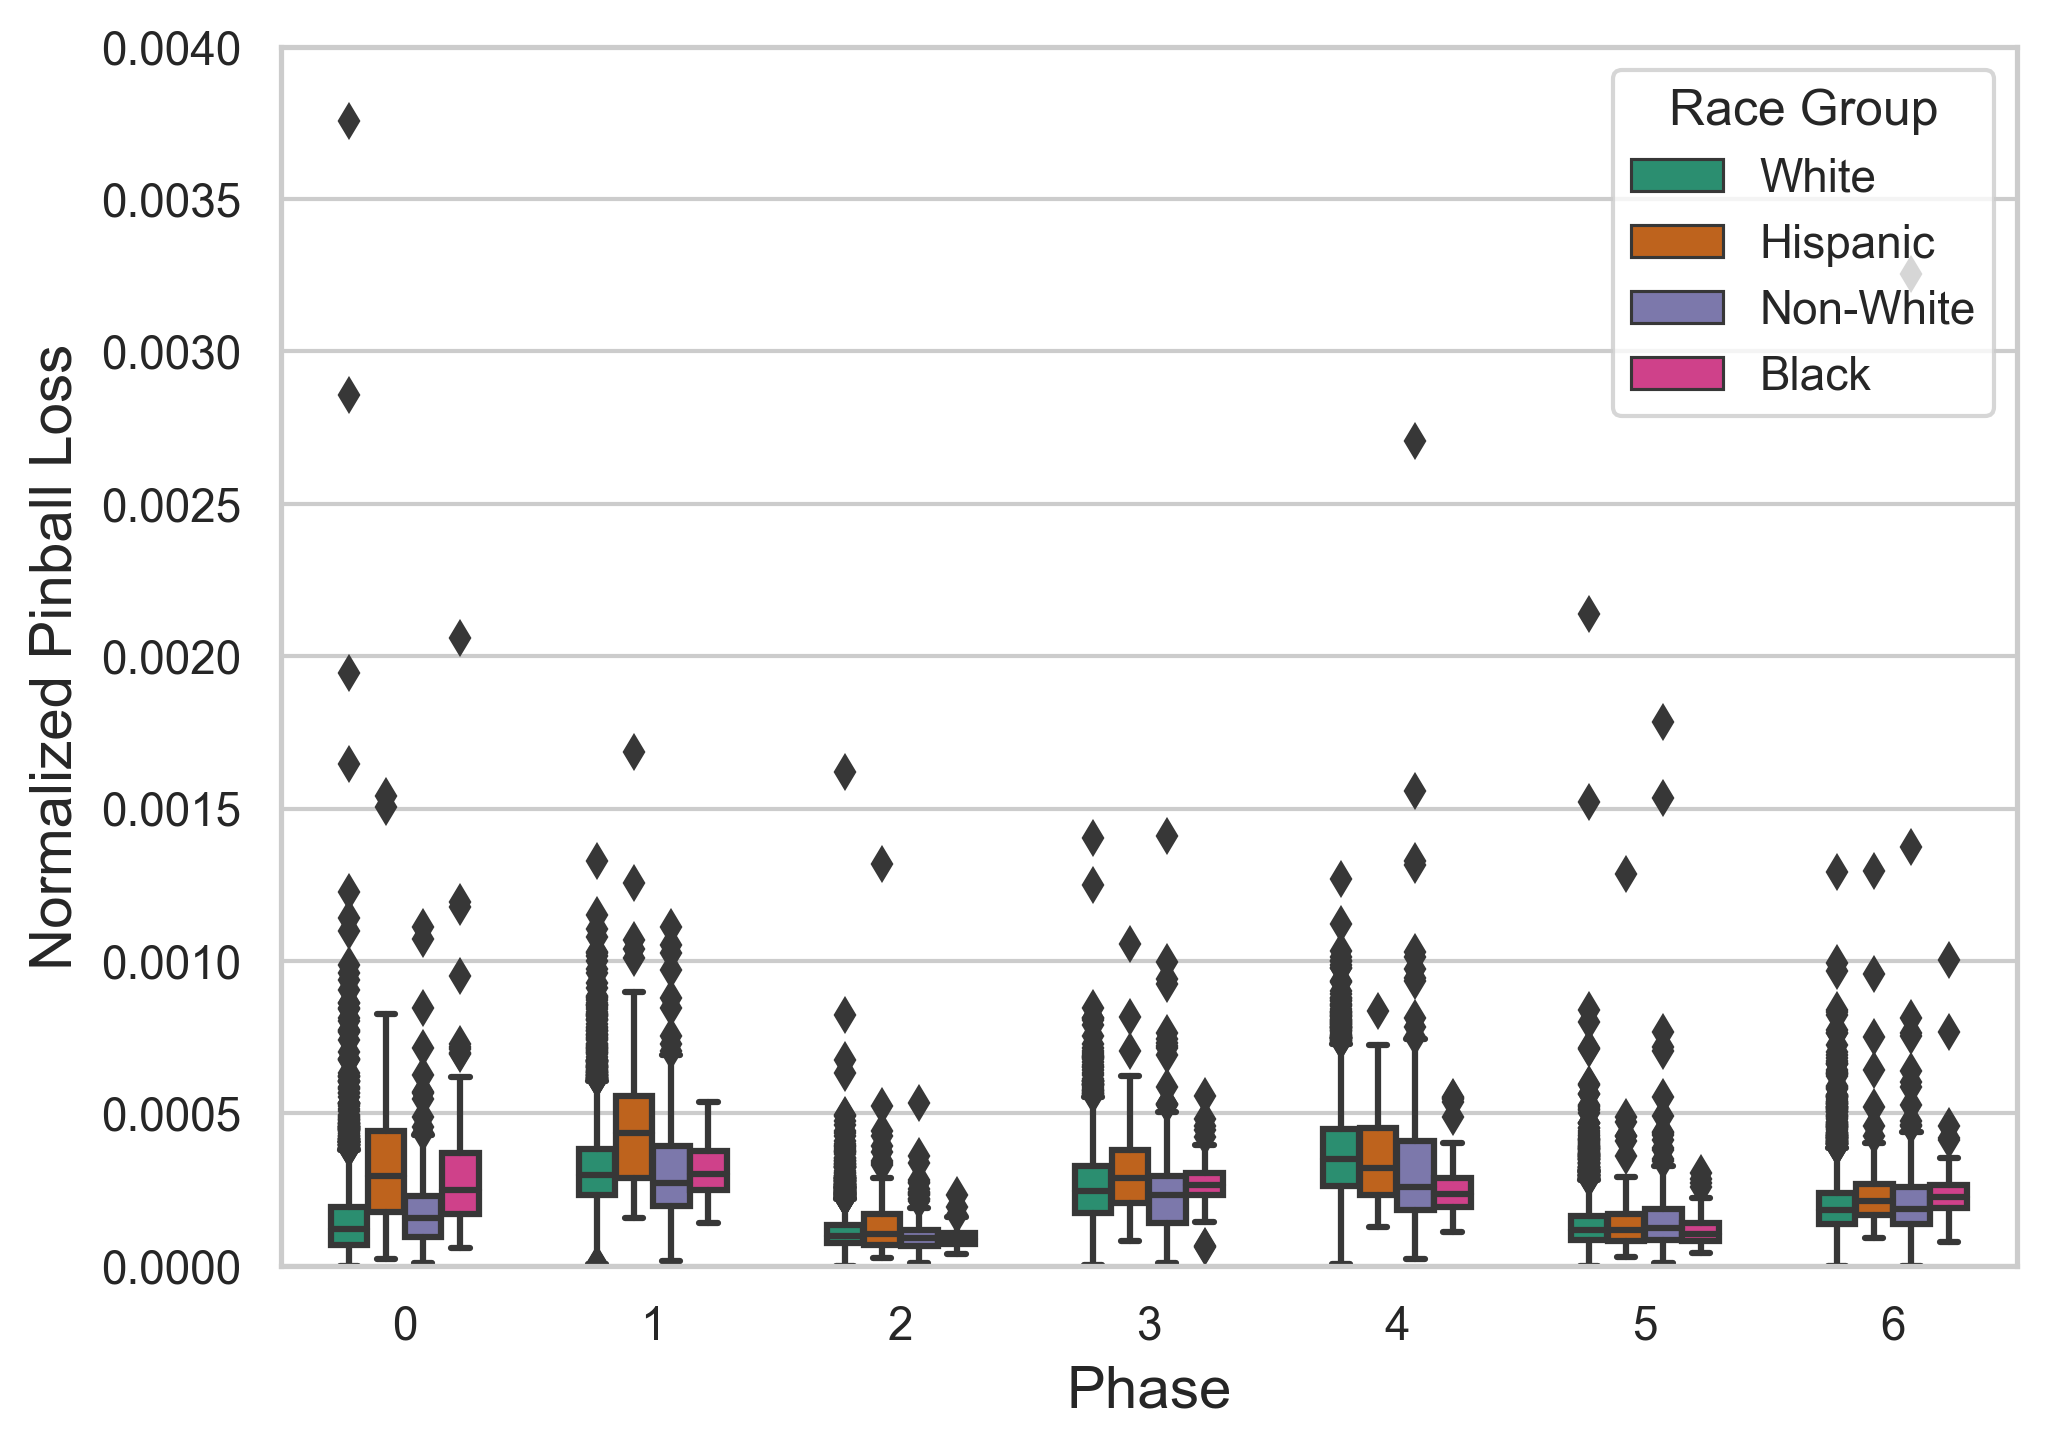
Majority Approach. In Figure 2a, we present the error distributions (PBL) normalized by county population for each of the four racial and ethnic groups, incorporating predictions from all models in the Forecast Hub. The data exhibit clear variations in prediction accuracy among different racial demographics. Specifically, majority Hispanic counties incur notably higher median prediction errors (around higher), and larger standard deviations, in comparison to counties with a White majority. This disparity suggests a potential systematic bias in model performance, disproportionately affecting predictions for Hispanic majority counties.
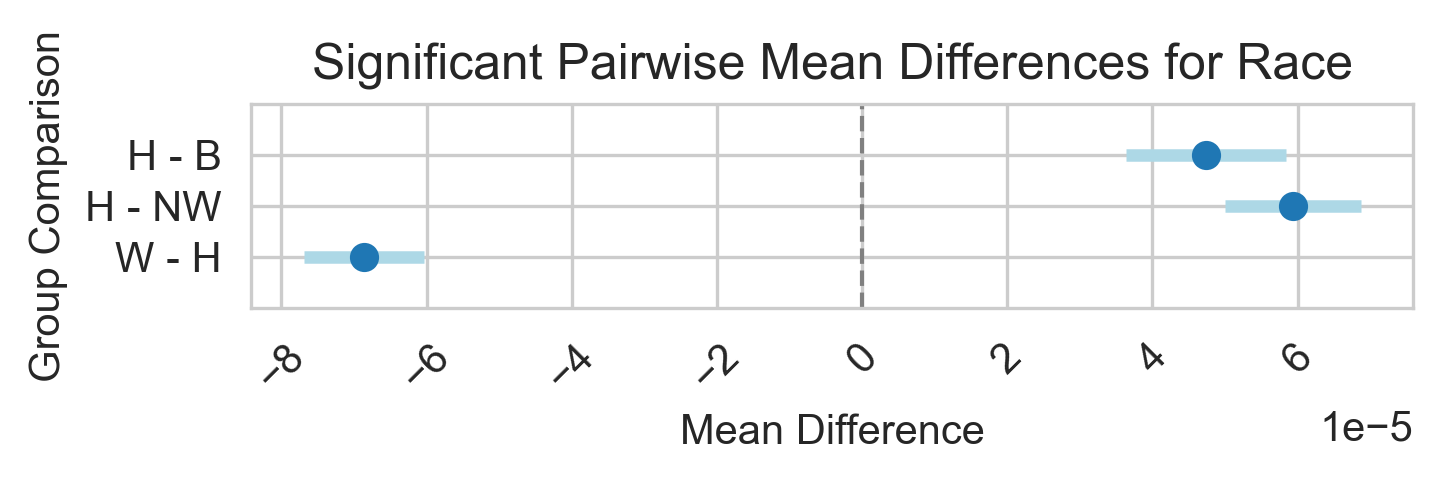
A one-way ANCOVA was conducted to assess the statistical significance of the observed differences in mean PBL values across the racial groups while controlling for the percentage of individuals with age 65+. The test yielded a significant result for race () after controlling for age 65+ population percentages. Further examination using Tukey’s HSD test for multiple comparisons, revealed a large, significant difference in PBL errors between Hispanic and White majority counties, with a mean difference in prediction error of -0.000066. In practical terms, for a county with a population of one million, this equates to a PBL difference in the hundreds of more erroneous cases in Hispanic majority counties relative to White counties. Significant PBL errror differences were also detected between Hispanic vs. Non-White and Black vs. Hispanic groups, with mean differences of 0.000060 and 0.000046 respectively, reflecting statistically significant biases with less accurate predictions for counties with Hispanic majorities with respect to Black and Non-white counties (see detailed statistics in the Appendix in Figure 13). These findings point to a prevalent, albeit non-uniform, bias in predictive accuracy across racial lines, underscoring the need to report fairness metrics together with performance in the Forecast Hub.
Plurality Approach. Similarly to the majority race approach, the plurality race assignment also identified significant disparities in PBLs across race and ethnicity in the one-way ANCOVA tests, while controlling for age 65+ population percentages (). The Tukey-HSD test results underscored a significant difference in the PBL error for the Hispanic group when compared to other racial groups, similar to the majority approach. Specifically, the test identified a mean difference of 0.000059, 0.000017, 0.00011 with respect to White, Black and Asian plurality counties, respectively, pointing to significantly higher errors for Hispanic counties. Detailed statistical results can be found in the Appendix, Figure 14b.
Distribution Approach. Figure 2b shows the coefficients of the regression analysis to evaluate the relationship between PBL errors and county race and ethnicity, defined using the distribution approach. In this context, the regression coefficients provide insights into how different racial and ethnic groups (with White as a reference) might be associated with prediction errors, while controlling for the presence of elder population (65+) and underlying respiratory illnesses (COPD). As shown, all coefficients, are statistically significant, pointing to a relationship between PBL and race and ethnicity. Consistent with the previous approaches, the Hispanic ethnicity is positively associated with the PBL error, with a 1% increase in Hispanic population associated with a higher error ( higher) than the White race. In addition, the Asian race is negatively correlated with the pinball loss (-) signifying that increases in Asian population with respect to the White baseline are related to lower PBLs. This finding was not revealed in the plurality approach, possibly due to the small number of Asian counties. The R-squared value for the regression is low (0.001) indicating that a very small variance in PBL is explained by this model, which is understandable as there are many factors significantly impacting the error values other than the racial percentages.
Summary. Statistically significant higher mean PBLs are identified for Hispanic counties (compared to all other racial groups) across the three race association approaches; and lower mean PBLs for Asian counties are identified with the distribution approach, when compared to White, pointing to a lack of error parity between these two groups.
5.2 Fairness of COVID-19 case predictions across urbanization levels
In assessing the fairness of the Forecast Hub COVID-19 case prediction models, a stratification of counties by rural-urban codes also revealed some consequential disparities. As depicted in Figure 3, the normalized PBL distributions present a clear gradient in prediction errors correlated with urbanization scale. Notably, Large Metropolitan (LM) areas demonstrate a significantly lower mean error compared to Small and Medium Metropolitan (SMM) and to Micropolitan (MC) areas. This trend suggests an inverse relationship between the level of urbanization and the magnitude of predictive error, with less urbanized areas experiencing higher PBL errors. The median PBL for SMMs, while lower than that of MCs, still exceeds that of LMs, reinforcing the notion of a disparity gradient. The interquartile ranges indicate a broad variability in errors within MC and SMM categories, implying a less consistent prediction model performance in these regions.

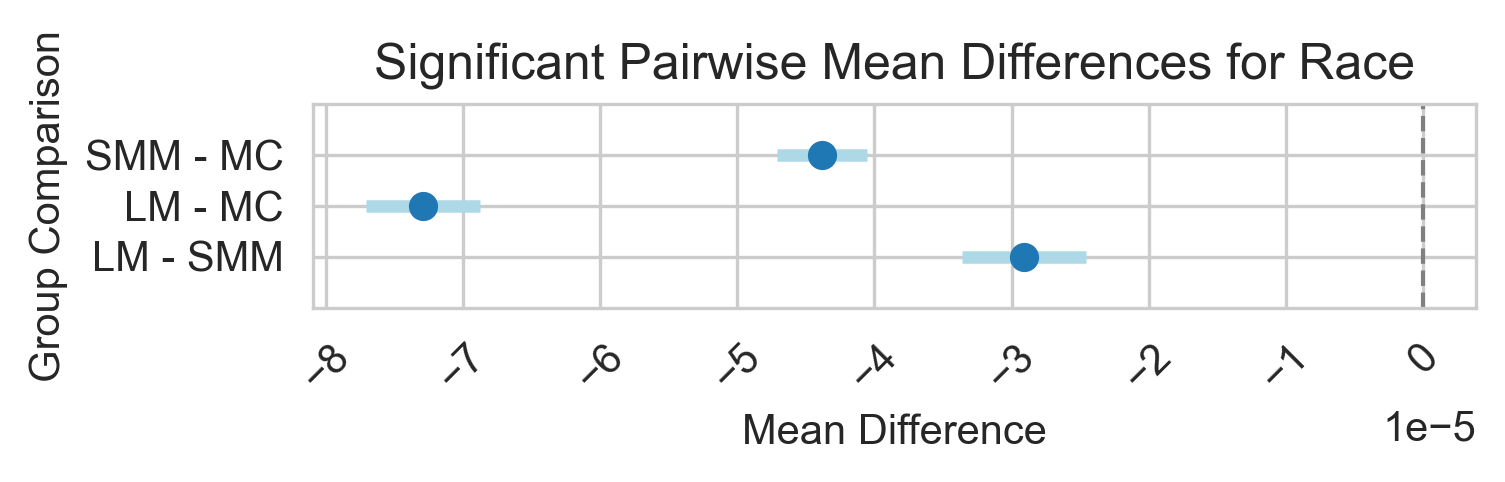
Statistical analysis through one-way ANCOVA refuted the null hypothesis of equal mean PBL across the rural-urban spectrum while controlling for age 65+ (). Subsequent application of the Tukey HSD test revealed that both SMM as well as LM areas exhibit PBLs that are statistically distinct from those of Micropolitan (MC) areas (see Appendix, Figure 15). The mean differences indicated by the Tukey HSD test affirm that LM regions have a significantly lower PBL compared to MCs regions with a mean difference of , pointing to a disparity in prediction model performance that aligns with urbanization levels. Put in context, for a LM area of 1M people this would imply a PBL difference in the hundreds with less erroneous cases when compared to a MC region. Additionally, SMMs were also significantly associated with lower PBLs than MC areas (mean difference of ), revealing that the most unfair predictions are associated with the least urbanized areas.
5.3 Fairness of COVID-19 case predictions across race, ethnicity and model-data characteristics
Our prior analysis has showed that some racial and ethnic groups are associated with statistically significant higher median PBLs, pointing to unfair performance across the Forecast Hub models. In this section, we explore more in depth whether these associations hold or change we also consider model types, the use (or not) of mobility data during training, lookaheads and pandemic phases.
5.3.1 Model Type

Majority Approach. Figure 4a presents the normalized Pinball Loss (PBL) distributions across model types and stratified by racial and ethnic groups - defined using the majority approach. As can be observed, ensemble and baseline models are the ones with the lowest PBL errors - with median PBL values of 0.00018 and 0.00019, respectively across races. The lower PBL errors for ensemble models are likely due to the synergistic integration of diverse modeling techniques. Intriguingly, baseline models register the second lowest median PBL across all model types. This is counterintuitive as baseline models, often simpler in design, are typically expected to serve merely as a comparative standard. The observed accuracy of these models could be indicative of their capacity to capture fundamental epidemiological trends more effectively than their more complex counterparts, or it may suggest a potential overfitting within the advanced models. The figure also shows that compartmental, statistical and deep learning models are in general associated with higher PBL values.
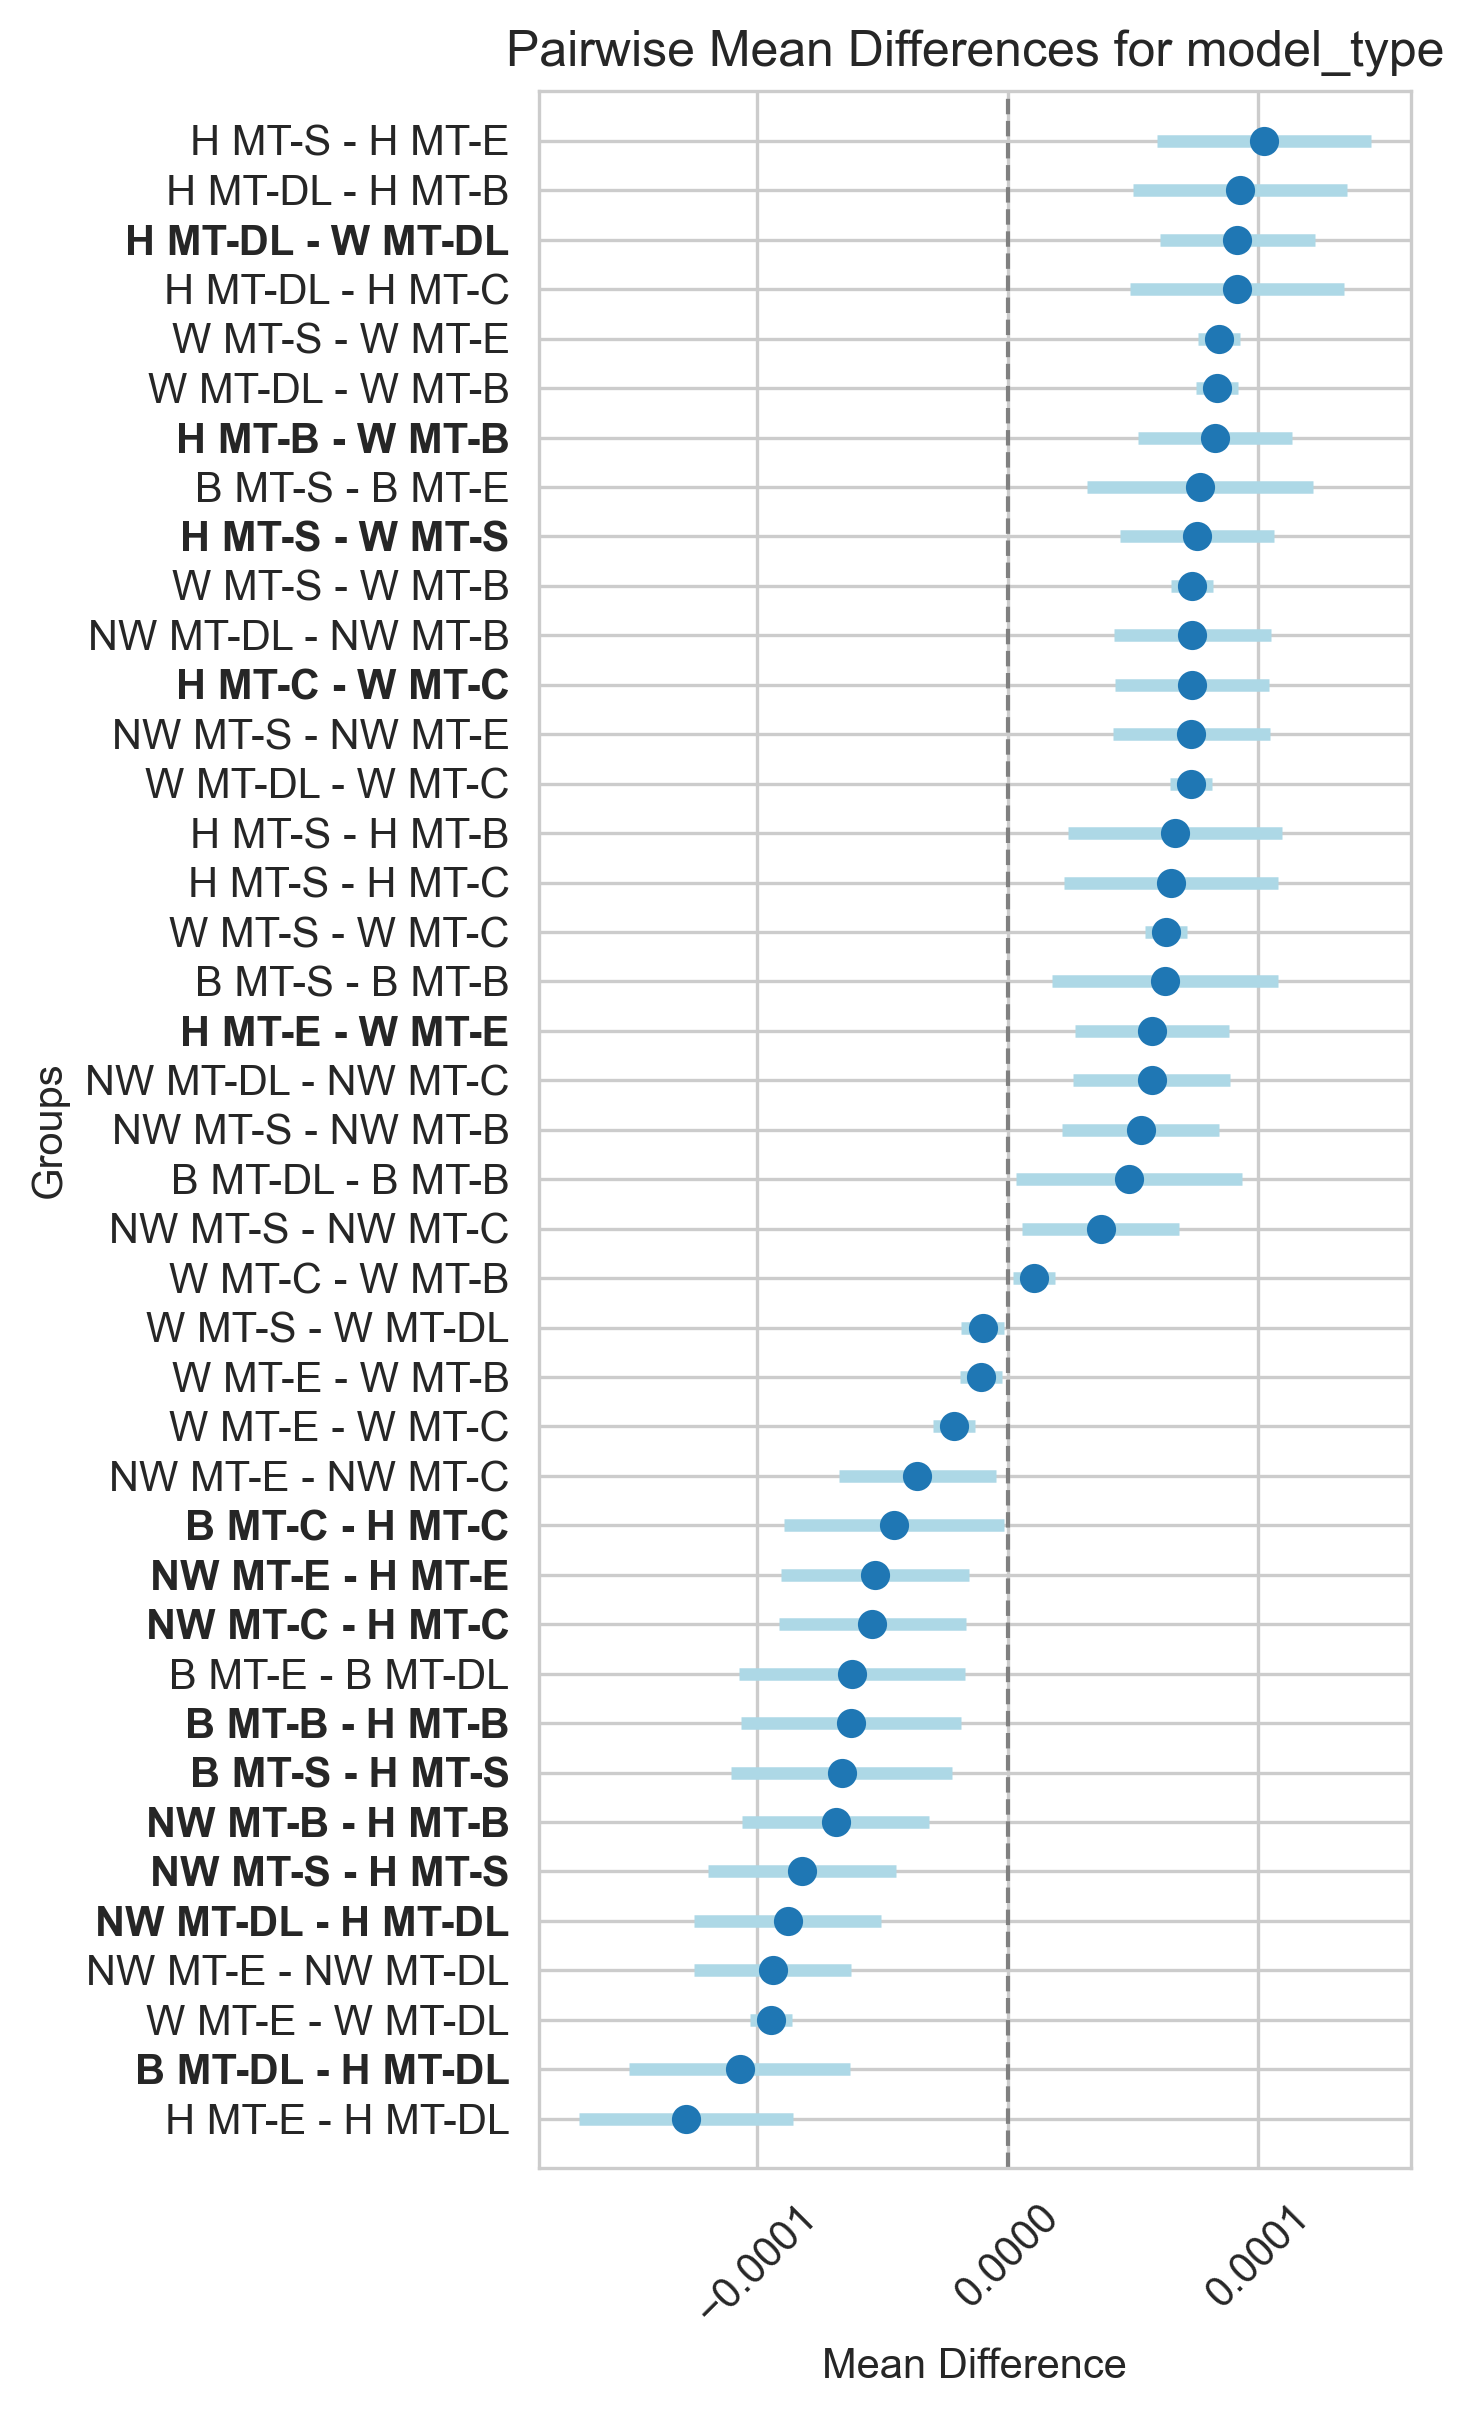
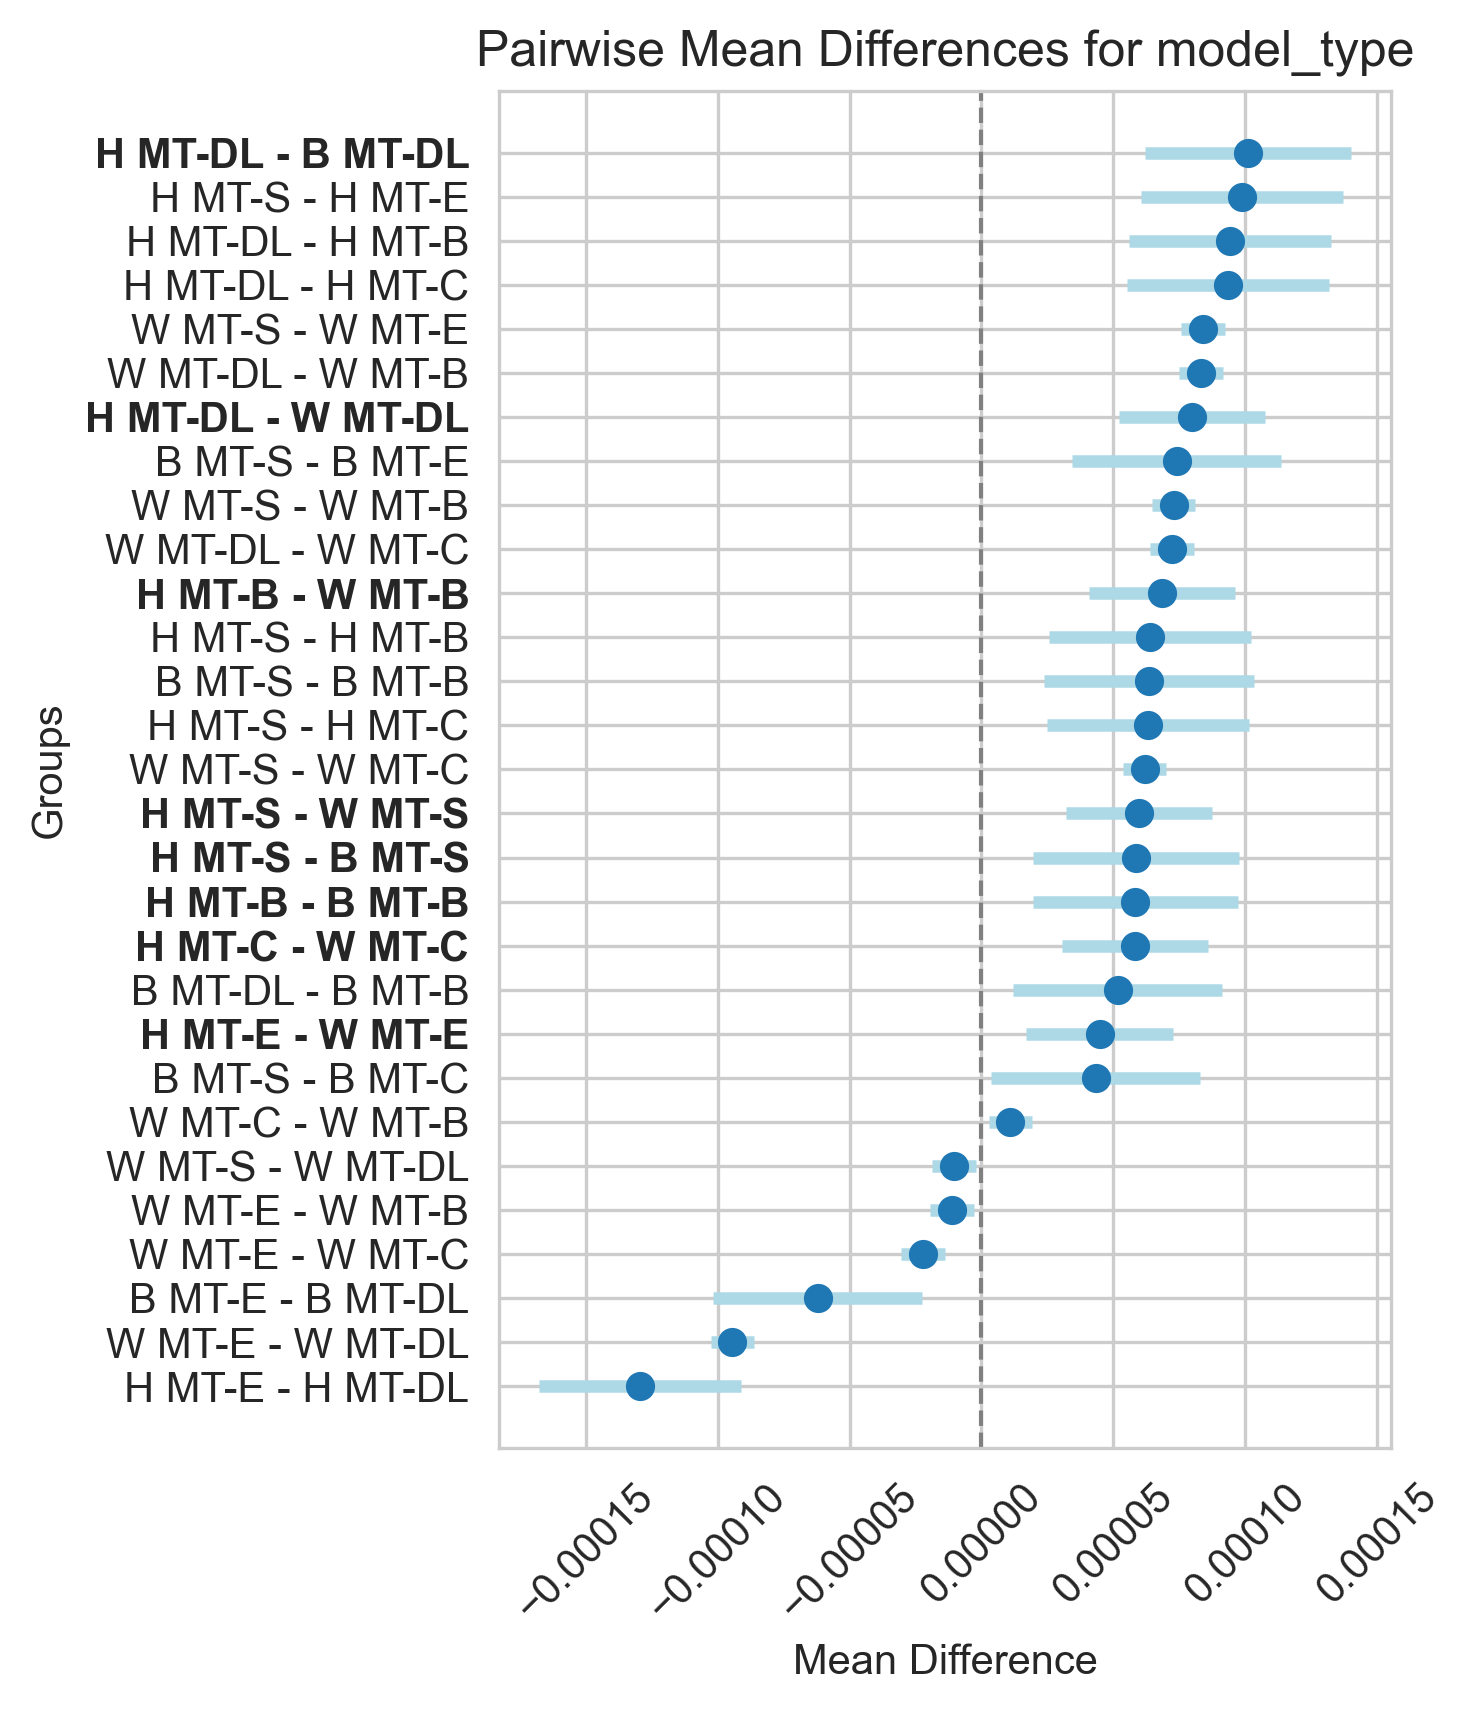
Looking into the statistical effect of majority race and model types on the PBL error distribution, the two-way ANCOVA revealed significant differences after controlling for age 65+ ( for race and for model type). Delving deeper into the pairwise differences, the Tukey-HSD test uncovered significant disparities. Figure 16a in the Appendix depicts all Tukey-HSD test results. Hispanic majority counties, in particular, exhibit higher PBLs across all five model types compared to the other racial and ethnic groups (mean increase of ), with the exception of Black majority counties, where no significant difference was found for ensemble models. Looking into the interaction effect of types of models and race, the Tukey-HSD tests show that deep learning models are associated with the highest significant mean PBL error differences between Hispanic and all other races (), pointing to the lowest fairness; while ensemble models were associated with the highest fairness (most similar prediction errors). These results suggest that it would be specially critical to audit the distribution of errors across races and model types, with a special focus on Hispanic ethnicity and deep learning models, given that our analysis has revealed statistically significant unfair predictions that are perpetuated across predictive models.
Plurality Approach. The Tukey-HSD results align closely with those observed using the majority approach, revealing significant disparities across all model types for Hispanic groups when compared to both White and Black groups. Notable exceptions include comparisons between Hispanic and Black groups for Ensemble and Compartmental models. Interestingly, the mean PBL differences observed were higher when using the plurality approach, revealing Hispanic counties associated with mean PBL differences of , compared to for the majority approach. Detailed test results are documented in the Appendix, under Figure 18a.
Distribution Approach. Similarly to the majority and plurality approaches, higher percentages of Hispanic population are statistically significantly associated with higher forecast errors (PBL) when compared to the White population (reference group); with a significant regression coefficient of , while controlling for model type, age 65+ and COPD. The Asian population showed a significant, negative coefficient (), signaling better performance that the White reference group. This finding was not revealed in the majority or plurality approaches, possibly due to the small number of Asian counties (see Table 4). The regression coefficients are reported in detail in the Appendix, Figure 19a.
5.3.2 Mobility Data
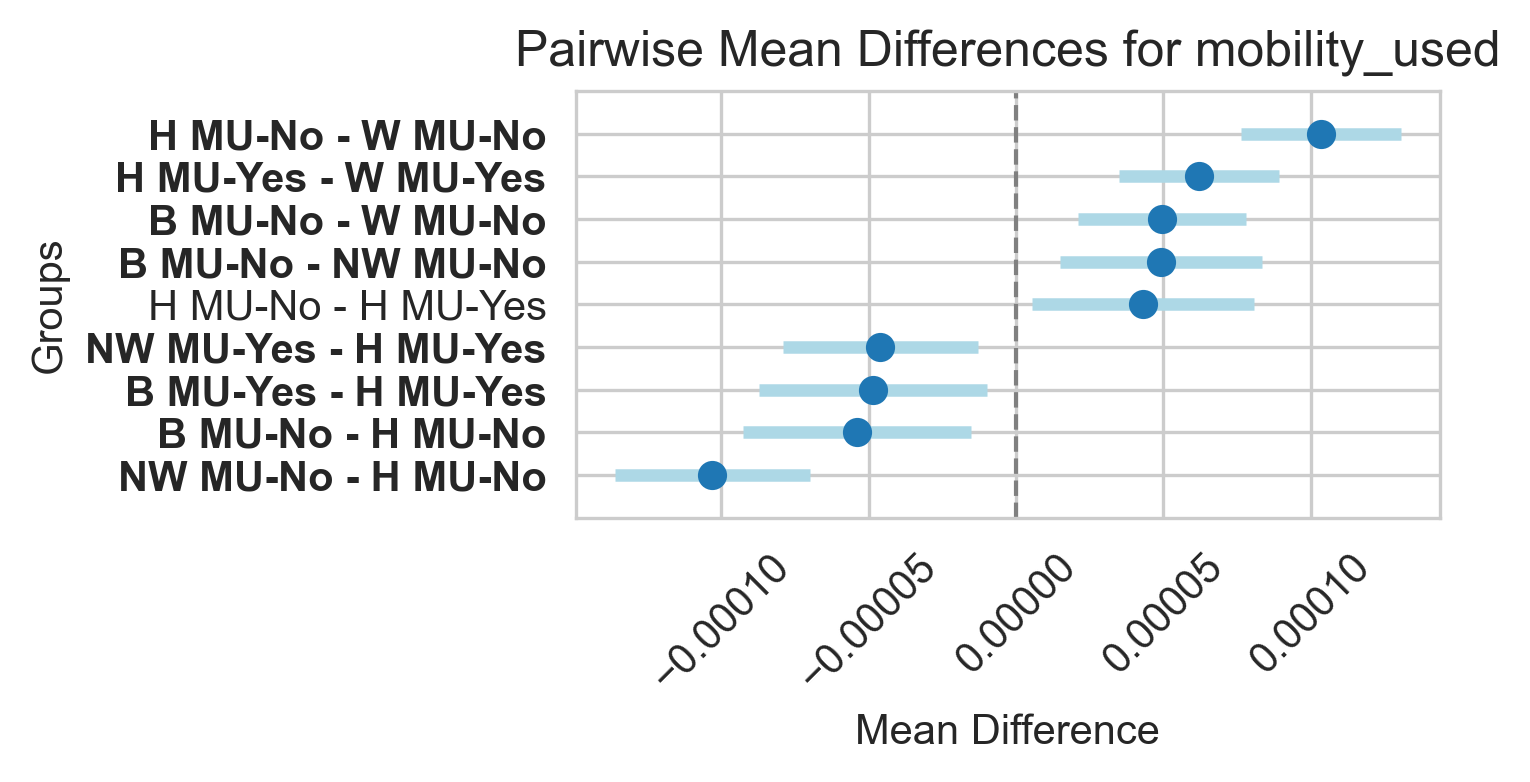
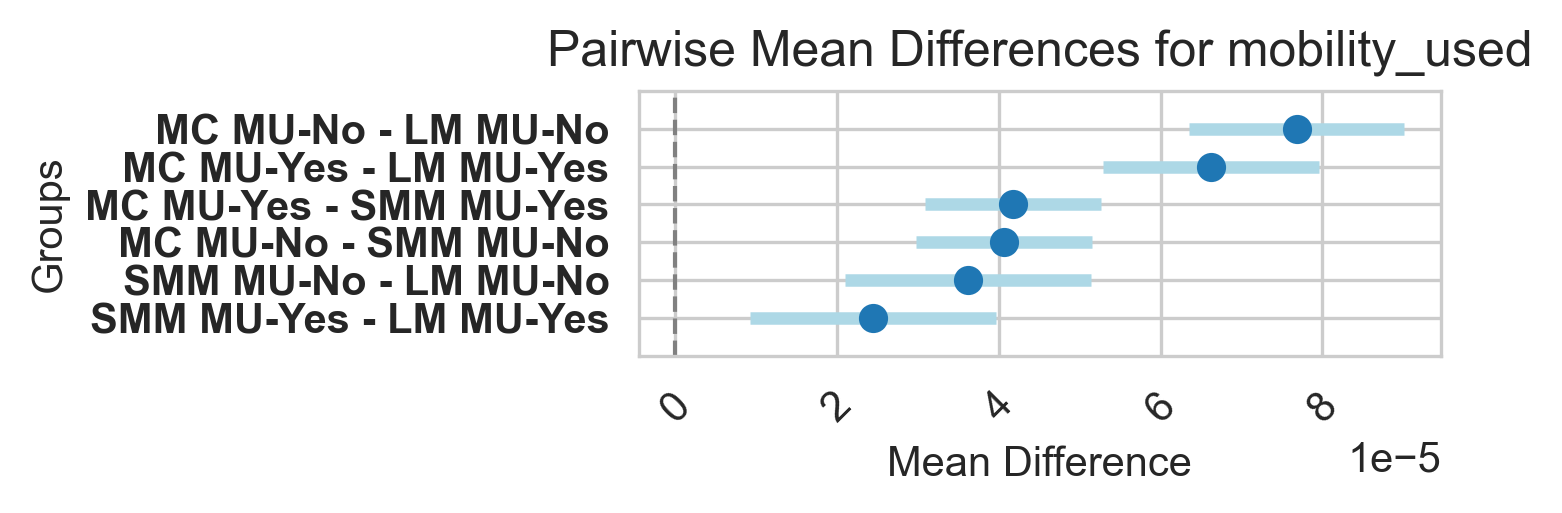
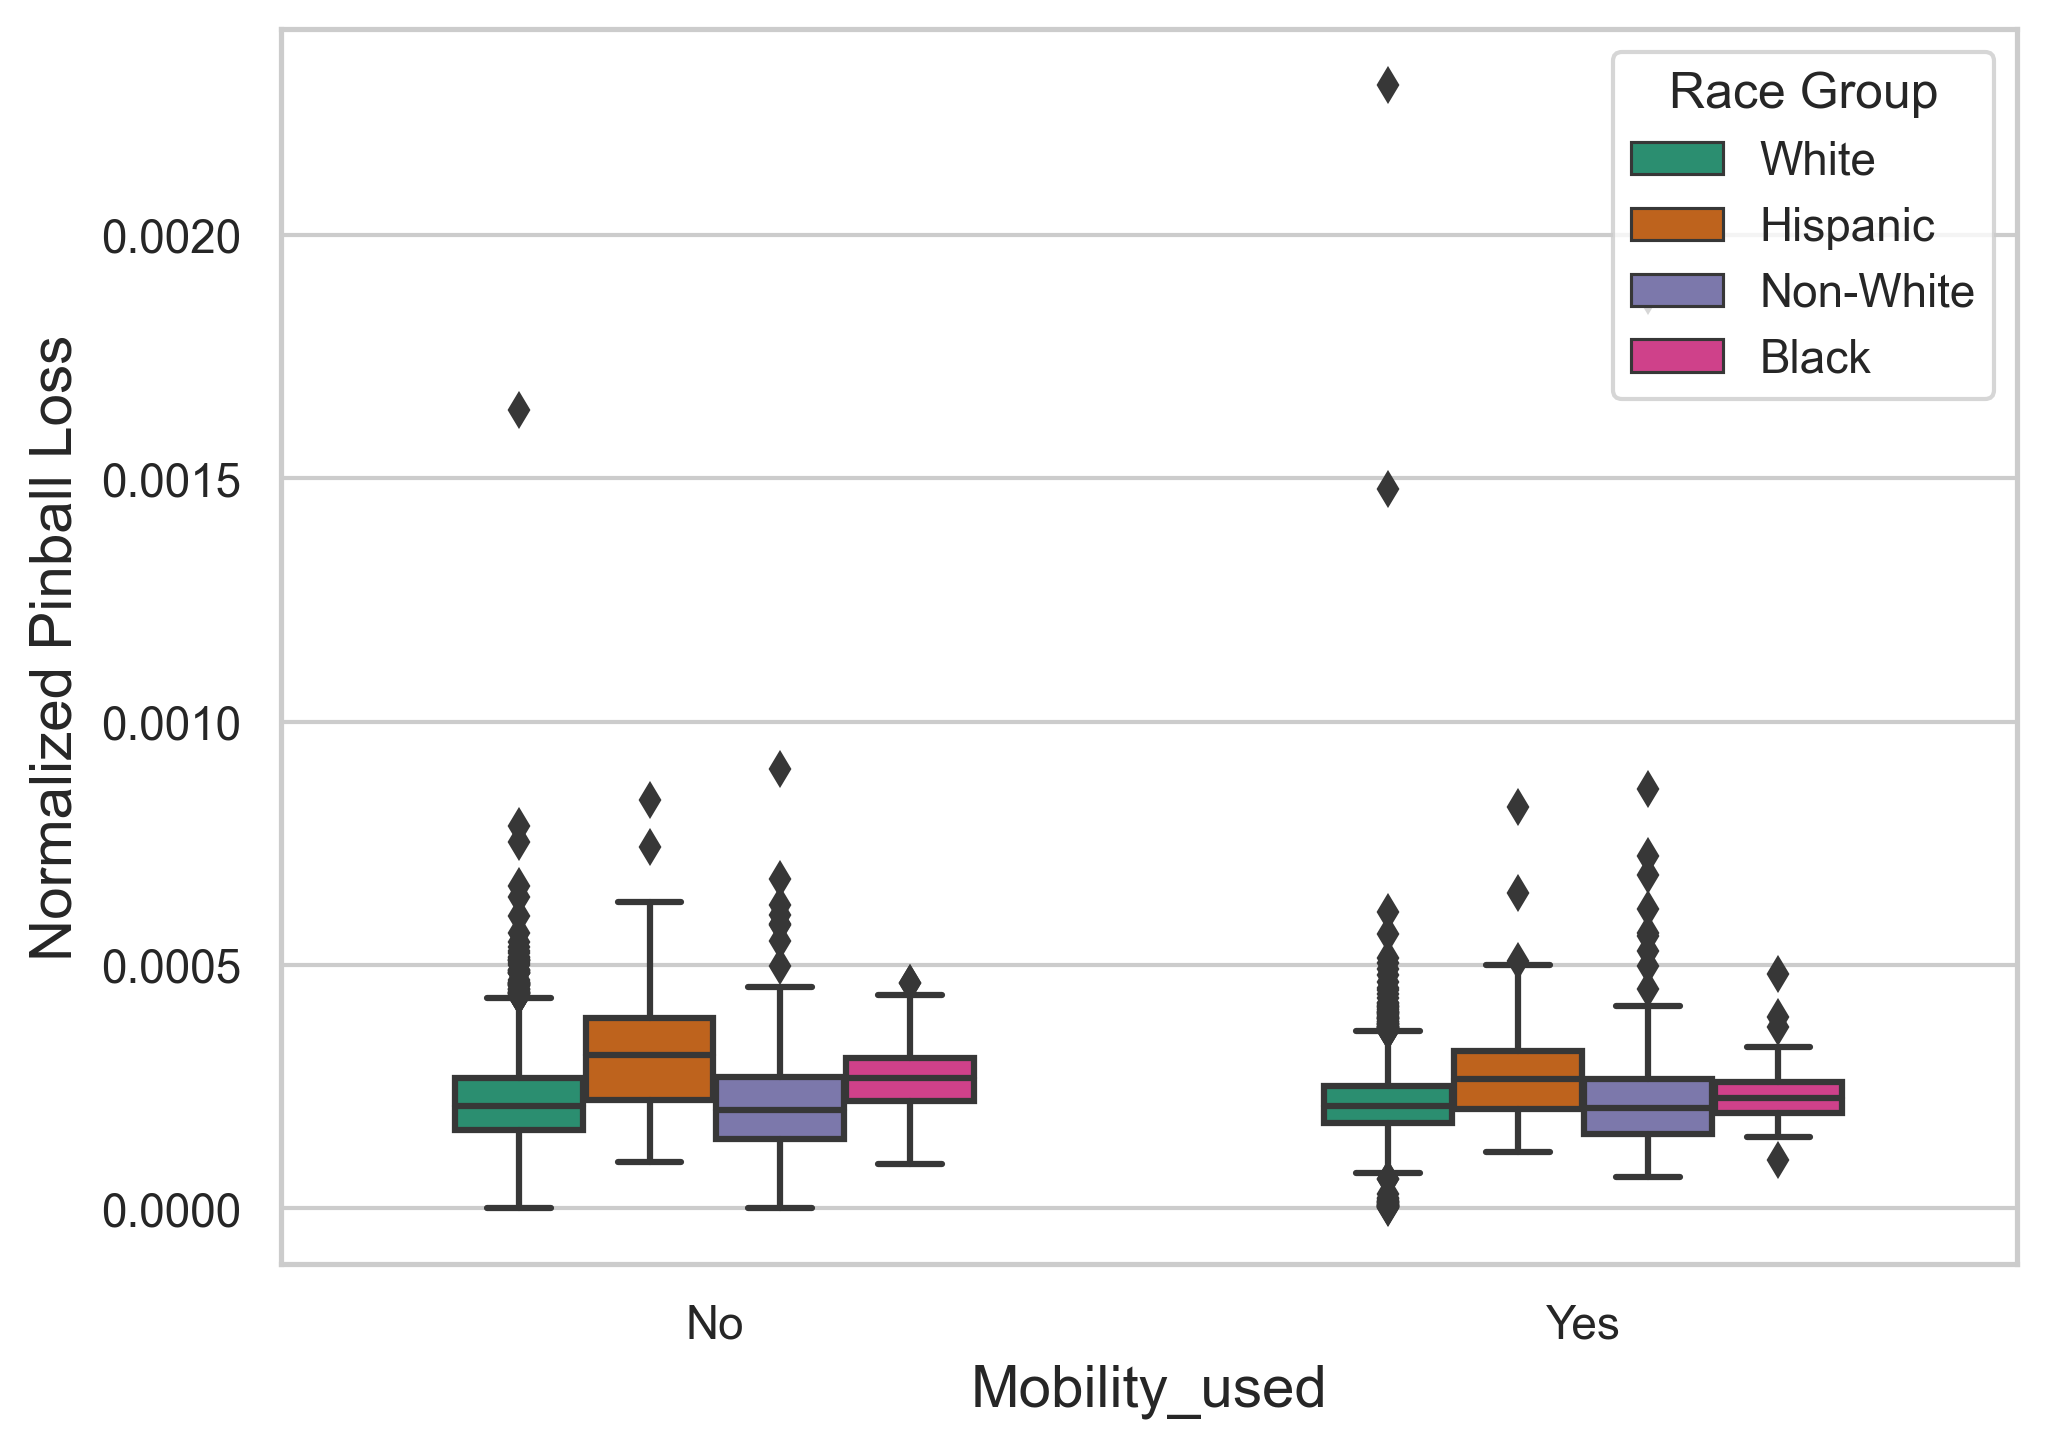
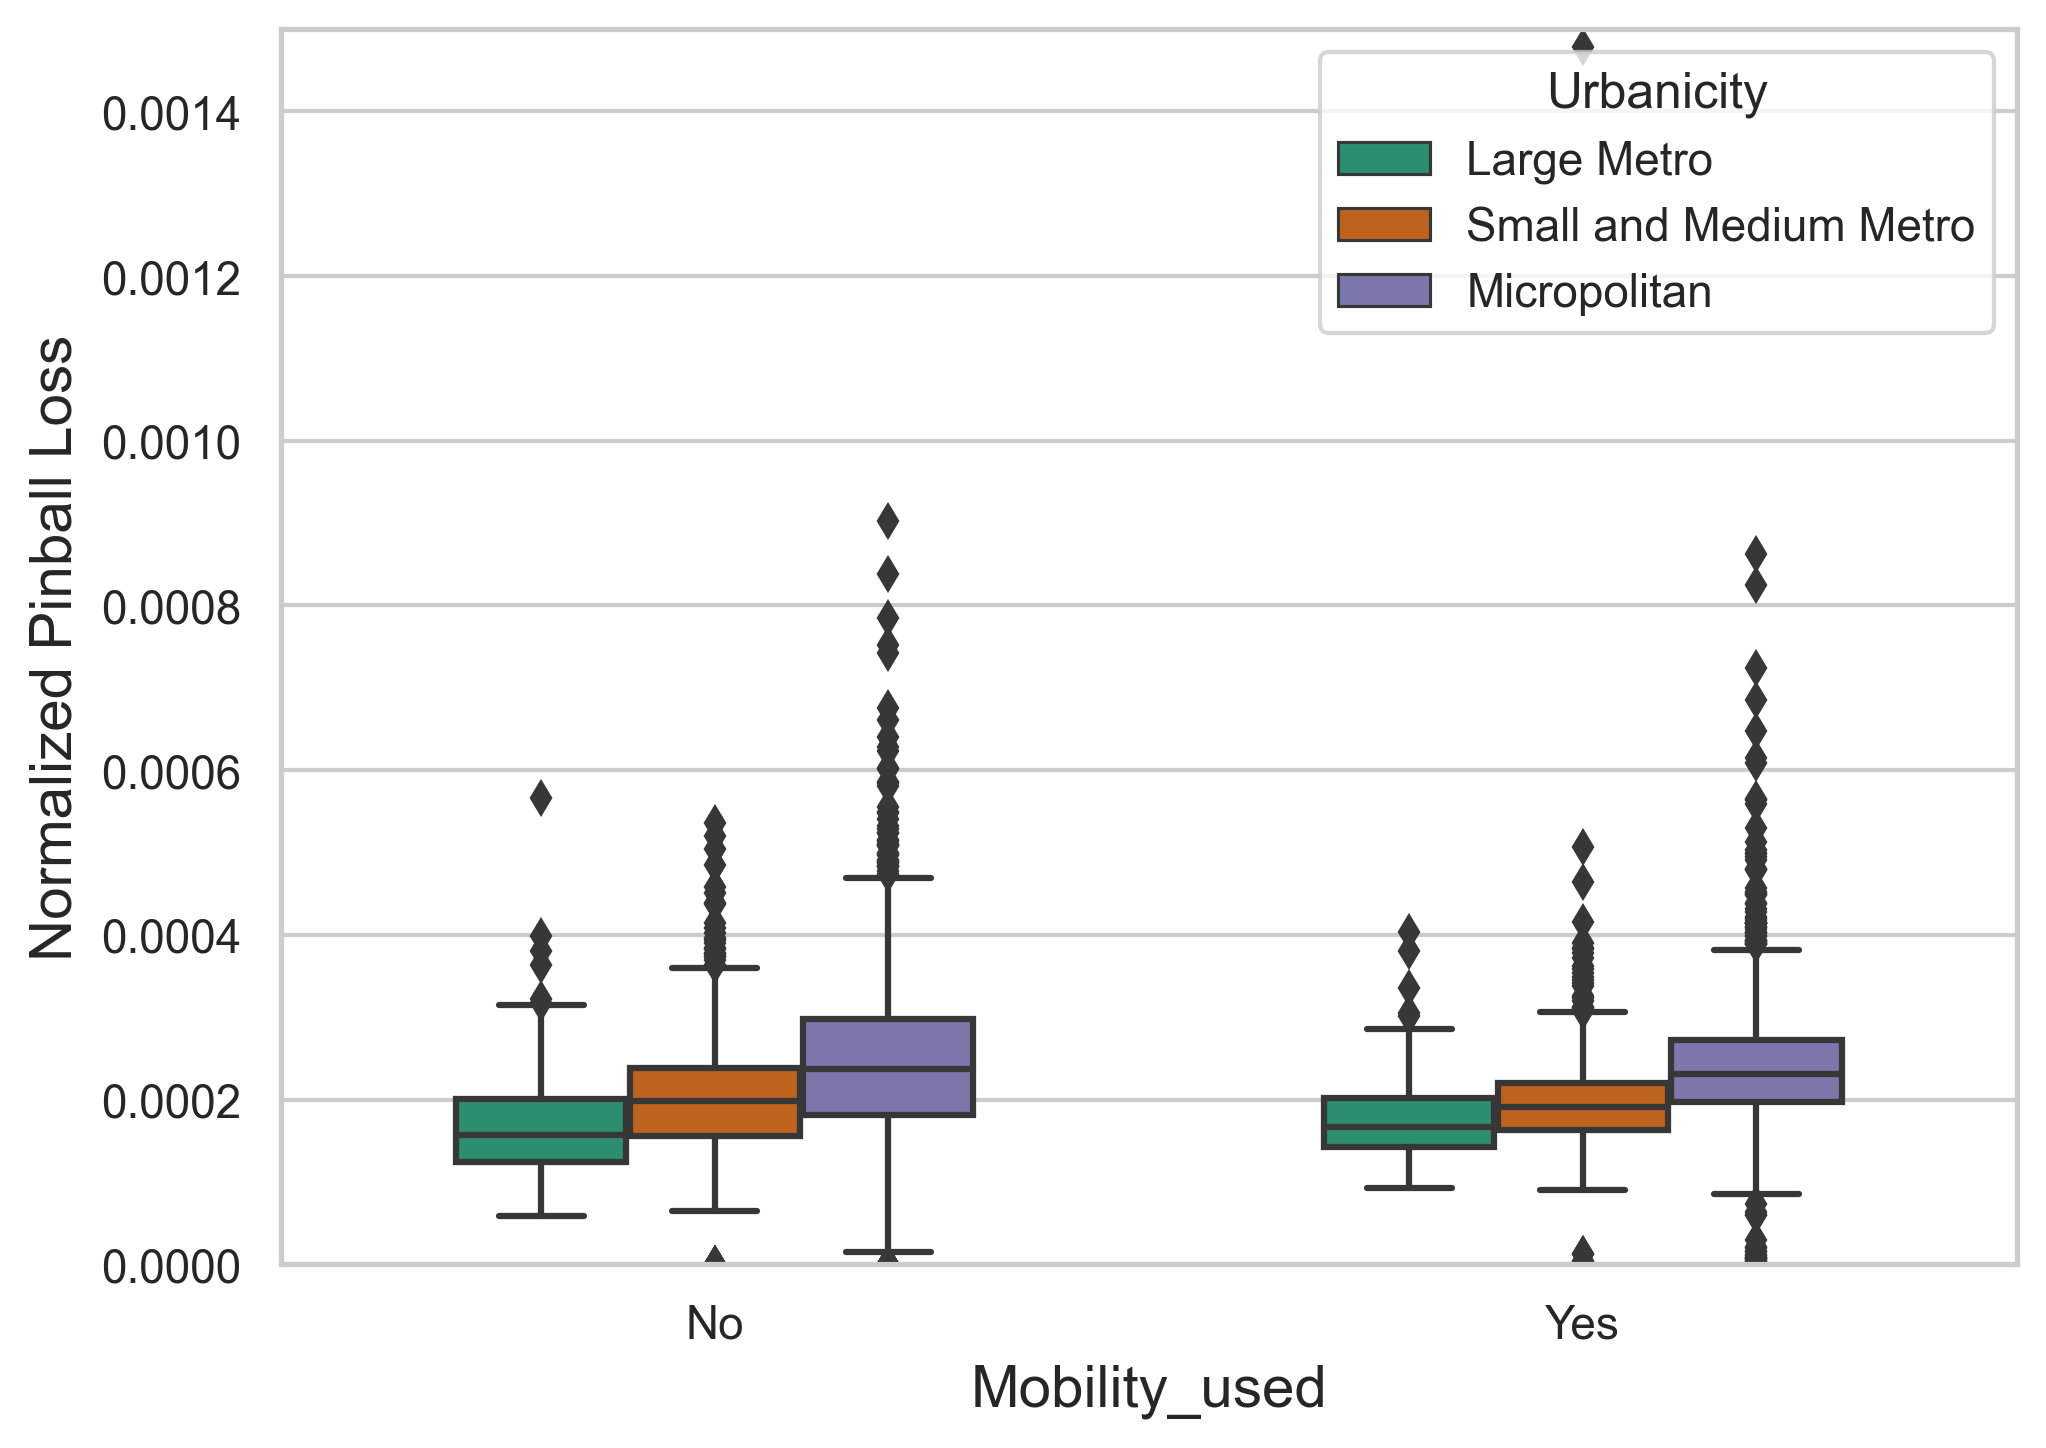
Majority Approach. Figure 4b examines the distribution of normalized PBL errors across predictive models using mobility data during training - or not - stratified by race and ethnicity, computed using the majority approach. Contrary to expectations [66], incorporating mobility data does not uniformly enhance the accuracy of predictions across all races, and in general, the median error remains the same when compared to non-mobility models. This could be due to the lack of quality or granularity of the mobility data which could lead to noise rather than useful signals. More importantly, racial disparities are observed across mobility- and non-mobility based models, with Hispanic majority counties consistently exhibiting the highest Pinball Loss (PBL) irrespective of whether mobility data was used in the predictive model.
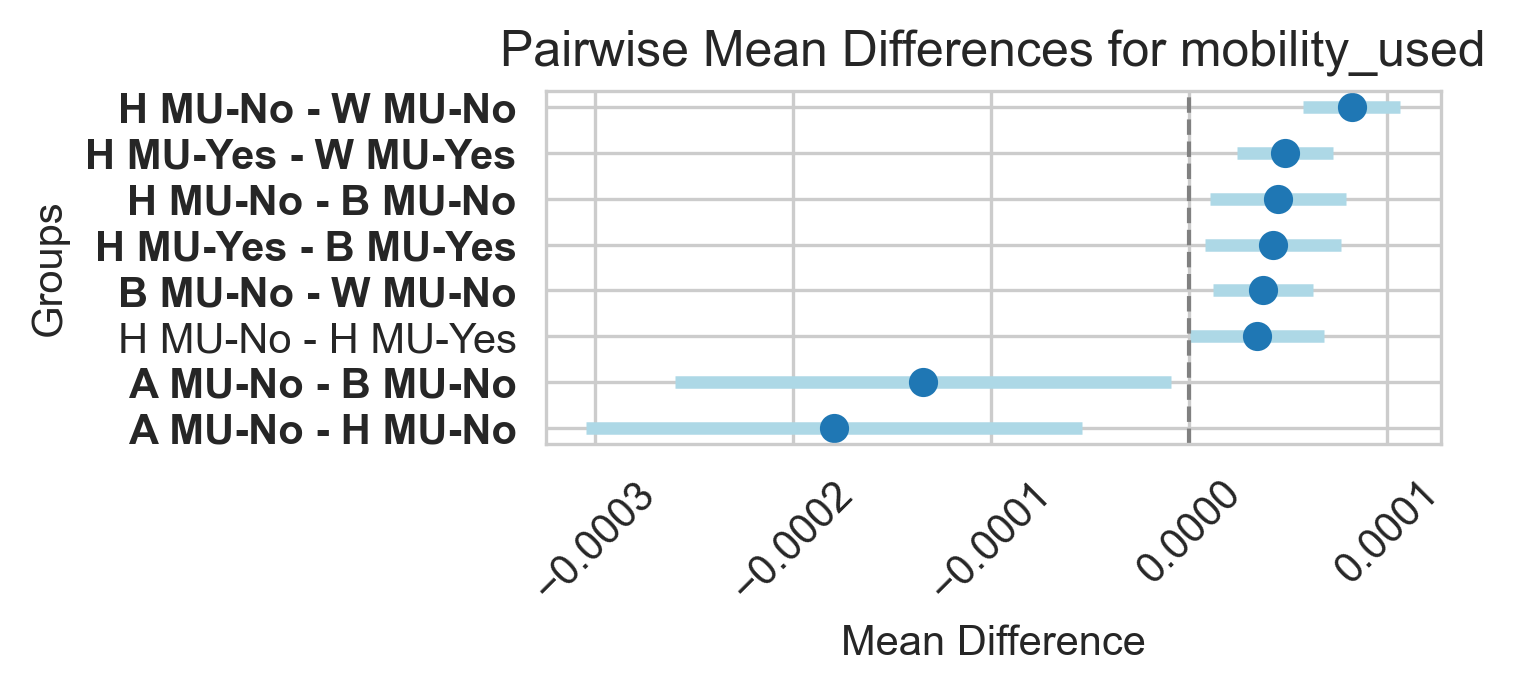
Statistical analysis employing a two-way ANCOVA highlighted significant effects of race and ethnicity on the predictive errors (), while mobility being used in model training did not reveal a significant effect () after controlling for age 65+. Further exploration through the Tukey-HSD test results revealed significant disparities among racial and ethnic groups when considering the use of mobility data. Notably, model predictions exhibited higher error rates for Hispanic populations compared to other groups, regardless of the inclusion of mobility data in model training. Interestingly, the incorporation of mobility data in model training improved prediction accuracy within the Hispanic group, when compared to White, Non-White and Black majority counties, by at most 0.000057, while still being statistically significant. Tests details can be found in the Appendix (Figure 16b). Overall, these findings underscore the critical need for scrutinizing prediction performance across racial and ethnic groups, especially when mobility data is not integrated during the training phase, due to pronounced error discrepancies observed predominantly between Hispanic and other racial majorities.
Plurality Approach. We obtained similar results using the plurality approach. Hispanic counties were associated with statistically significantly higher errors when compared to White and Black for mobility-based and non-mobility based predictions; and when compared to Asian group for non-mobility-based predictions. Similarly to the majority approach, the inclusion of mobility data reduced the difference in errors between Hispanic and other races, while still being statistically significant. Further test details are in Figure 18b in the Appendix.
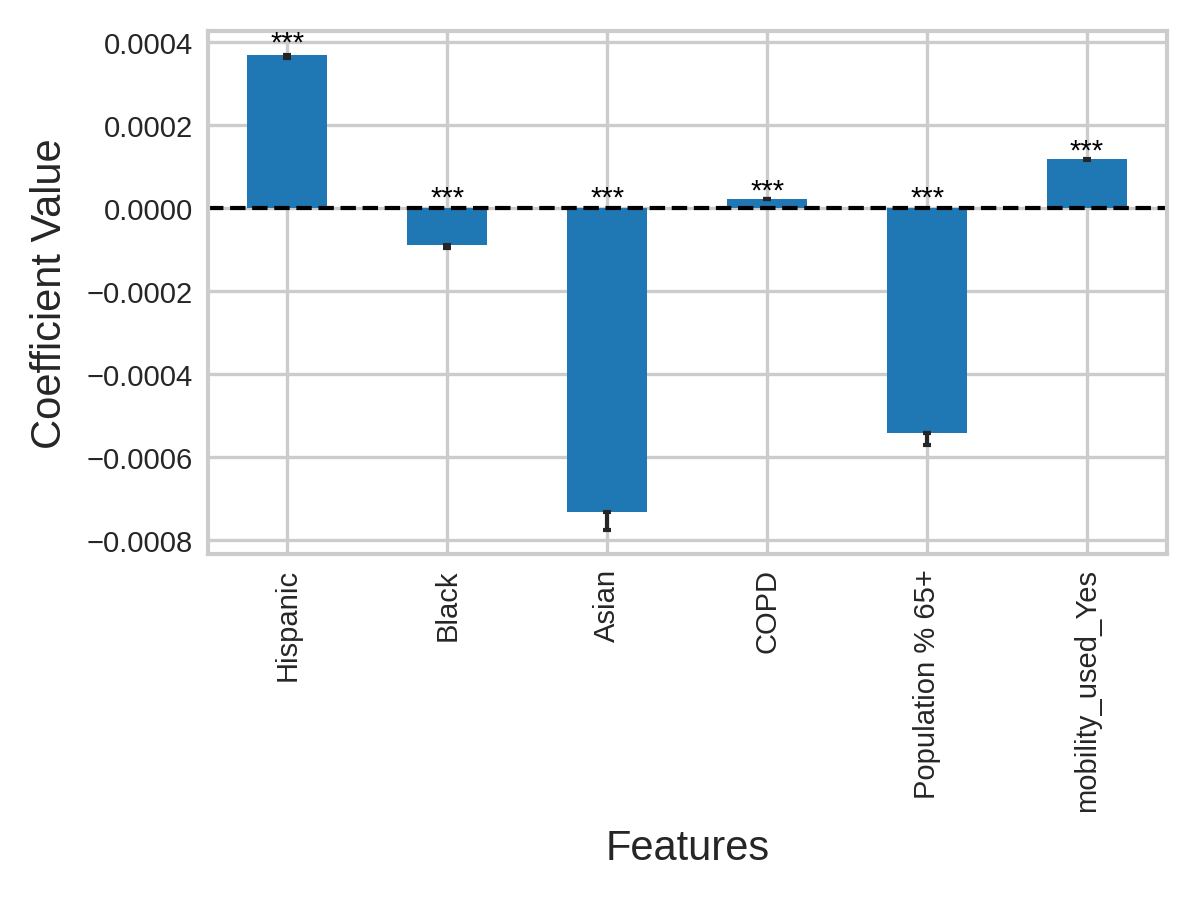
Distribution Approach. Similarly to the majority and plurality approaches, the Hispanic coefficient in the regression approach was significant and positive (), while controlling for the presence of mobility data, age 65+ population and the prevalence of COPD, corroborating that higher Hispanic population percentages are associated with an increase in prediction error when compared to White population percentages. The distribution approach also revealed a significant, large negative coefficient for Asian population (-), signifying that increases in Asian population with respect to the White group are related to lower PBLs. This finding was not revealed in the plurality or majority approach, possibly due to the small number of Asian counties. Interestingly, the use of mobility data when holding race and ethnicity constant has a positive, significant coefficient (), indicating slightly worse predictions when mobility is incorporated into models. It is important to highlight that this finding is a general finding when considering all races constant, and that the two-way ANCOVA tests for the majority and plurality approaches provide a more disaggregate insight showing that for Hispanic ethnicity the use of mobility data improved the predictions when compared to other races. All regression coefficients are reported in the Appendix, Figure 19b.
5.3.3 Lookaheads
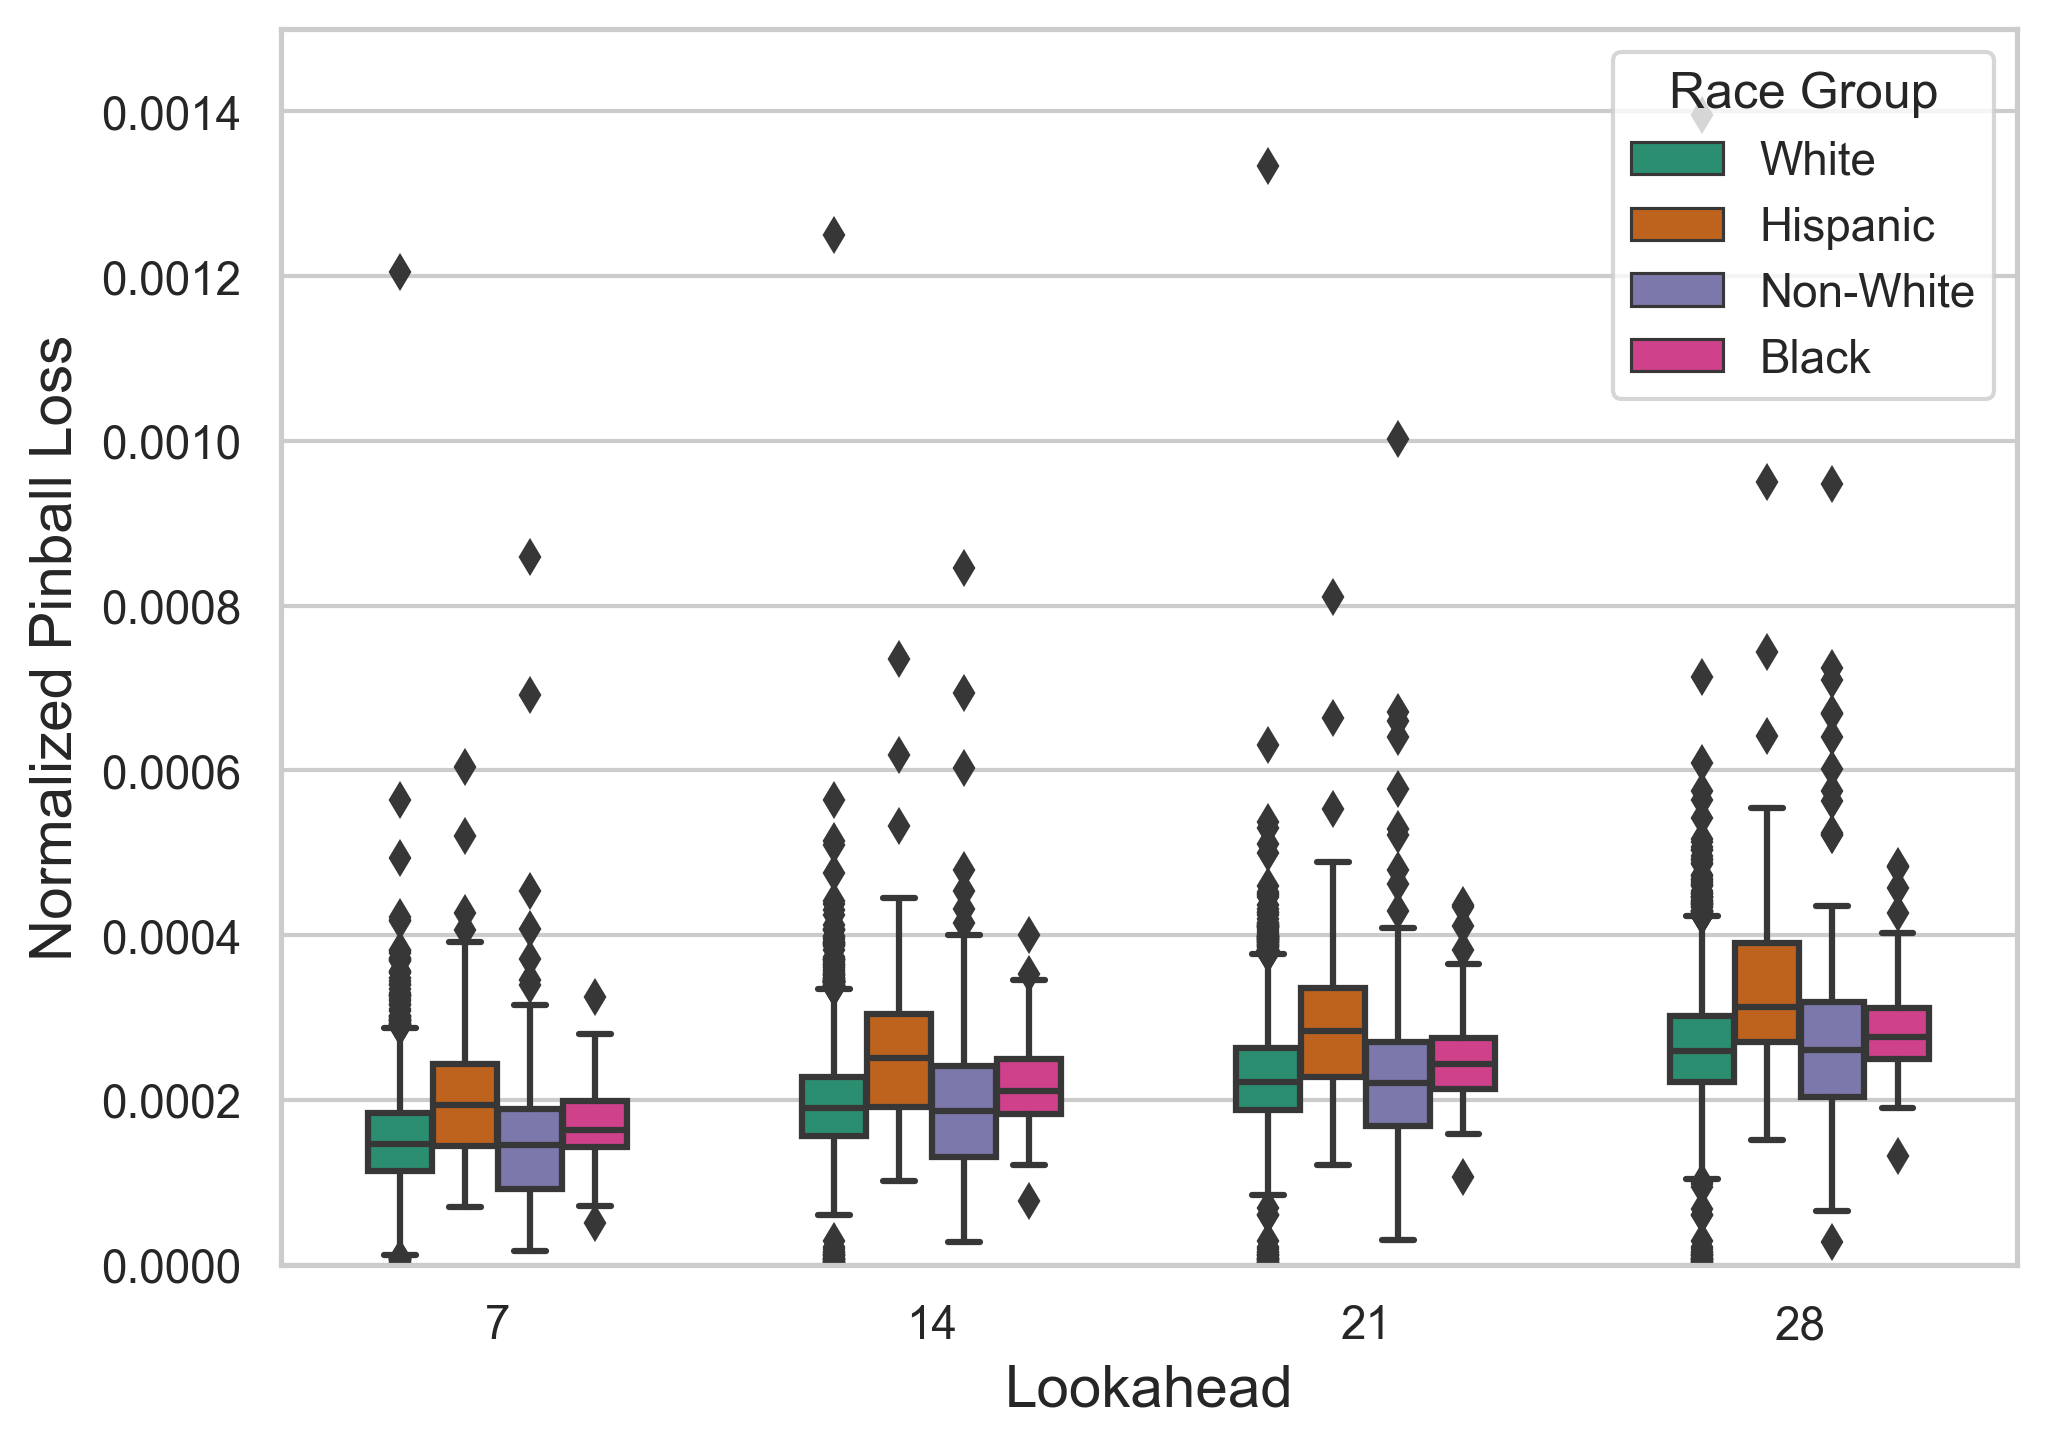
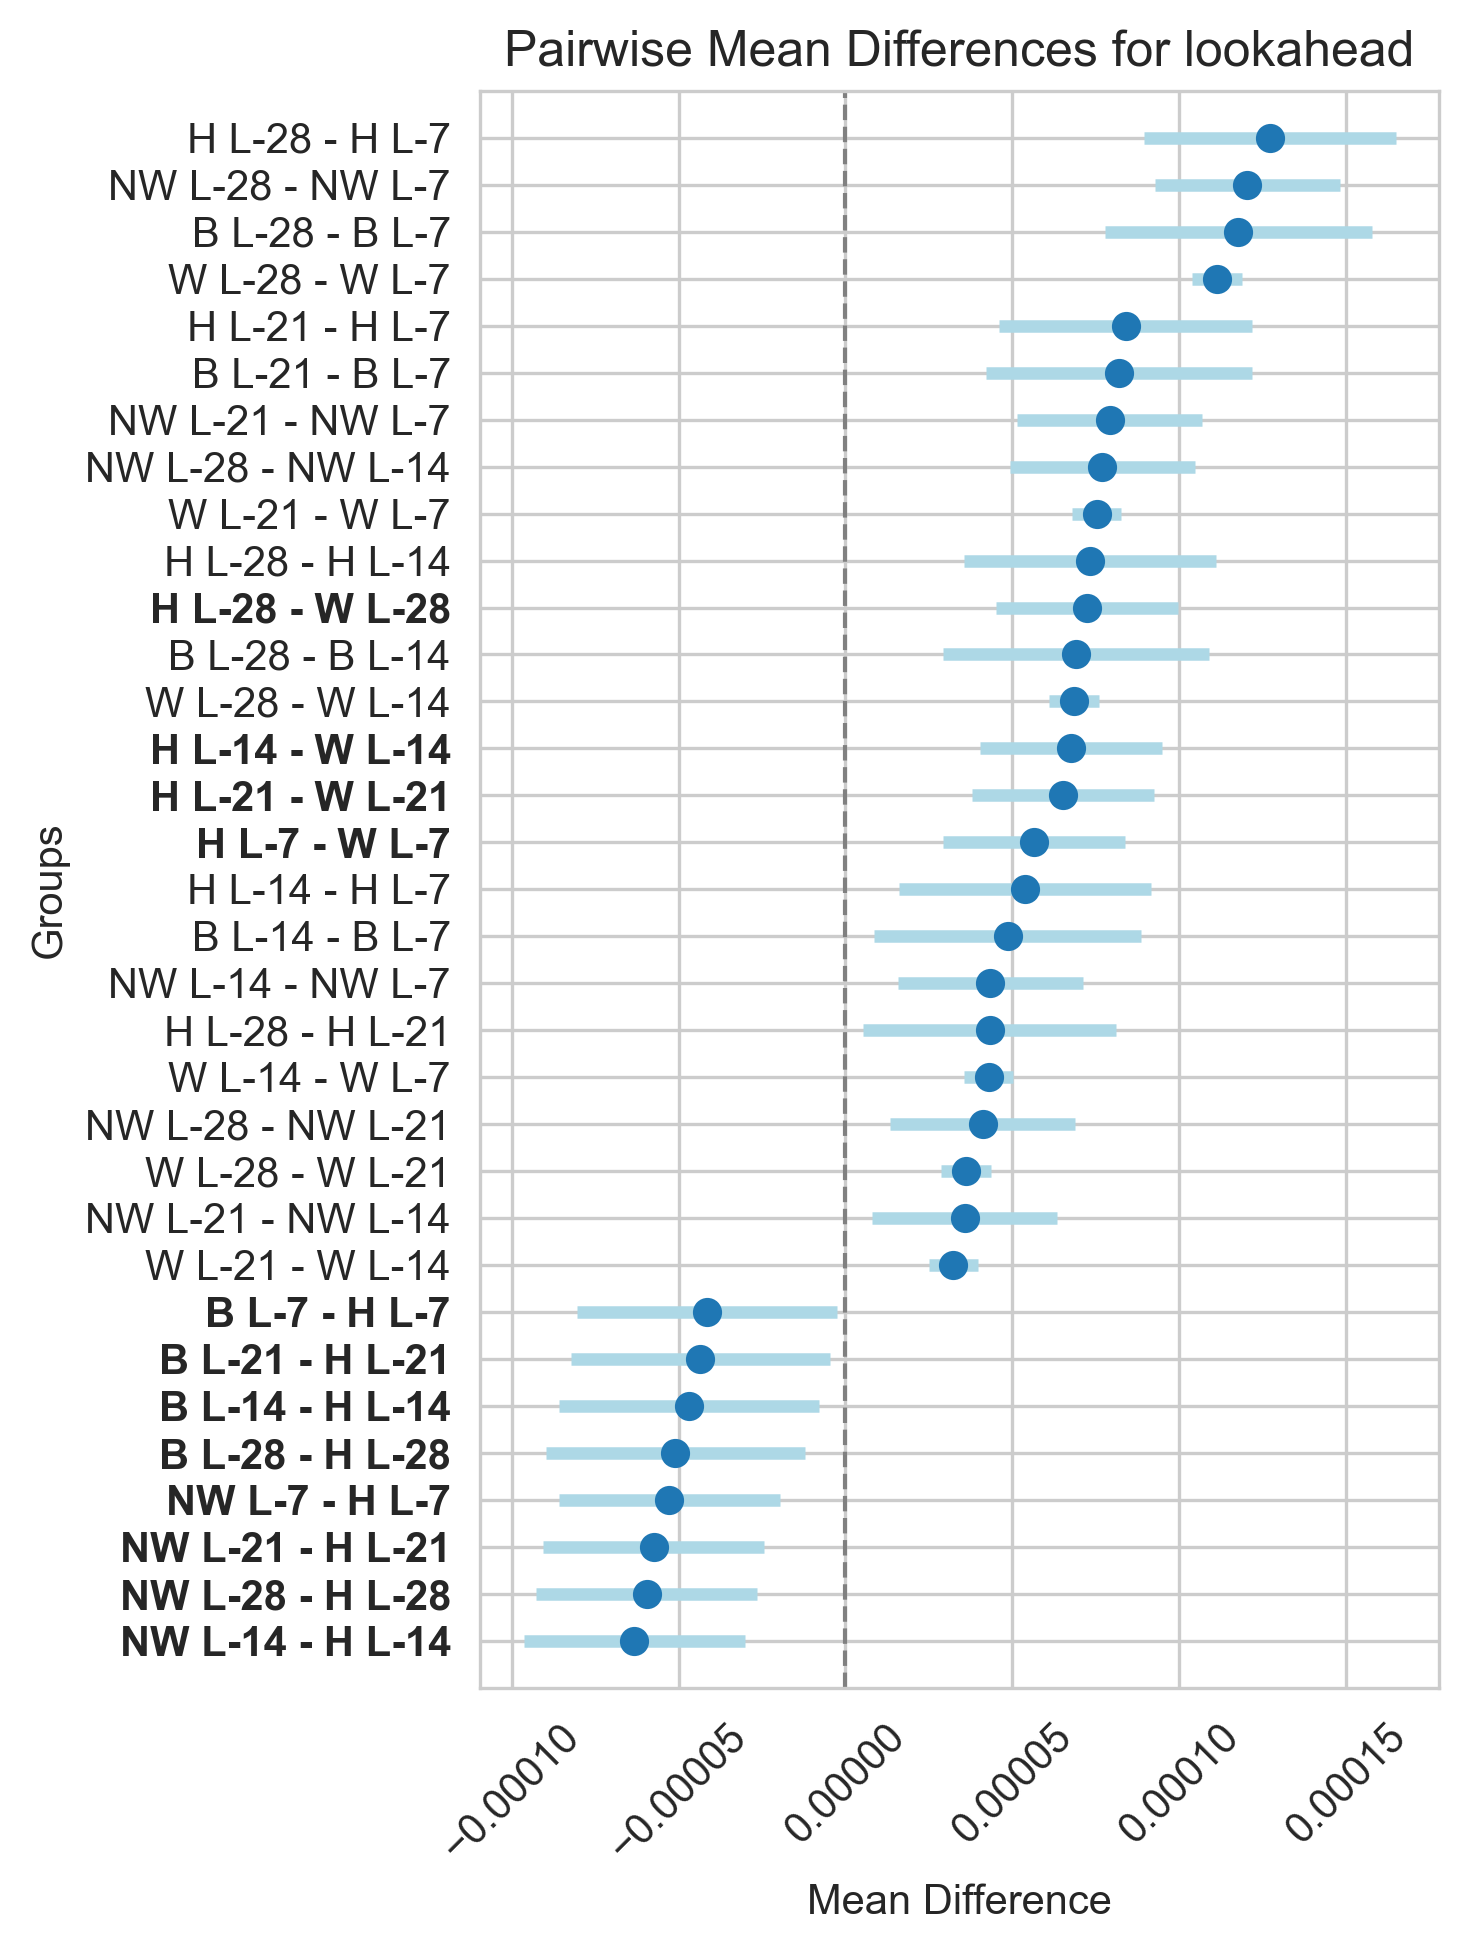
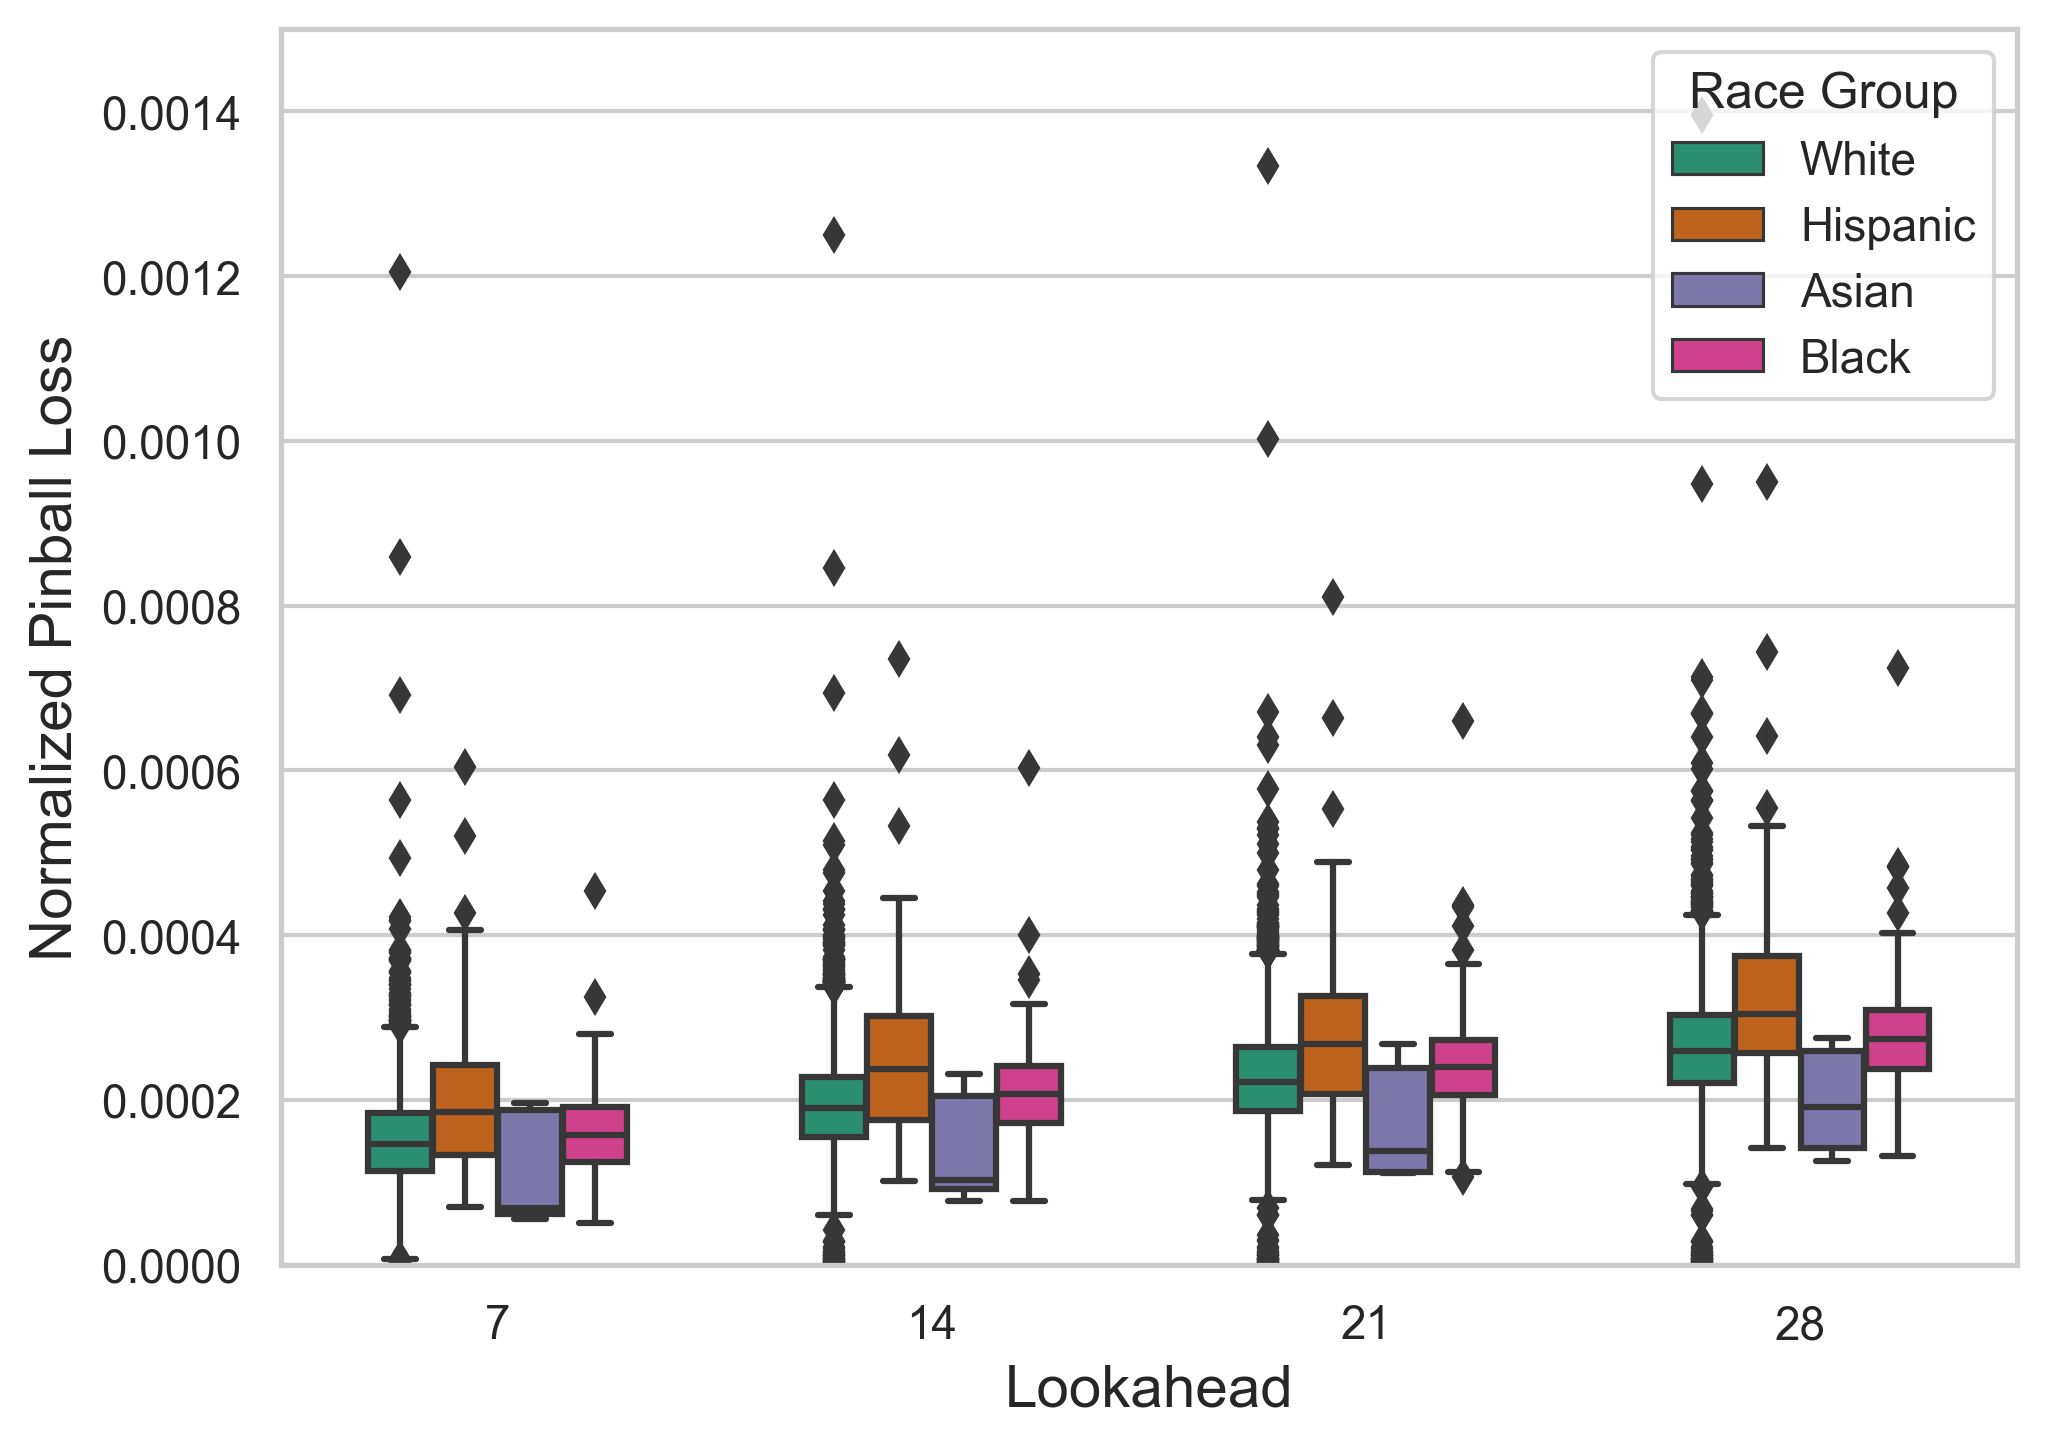
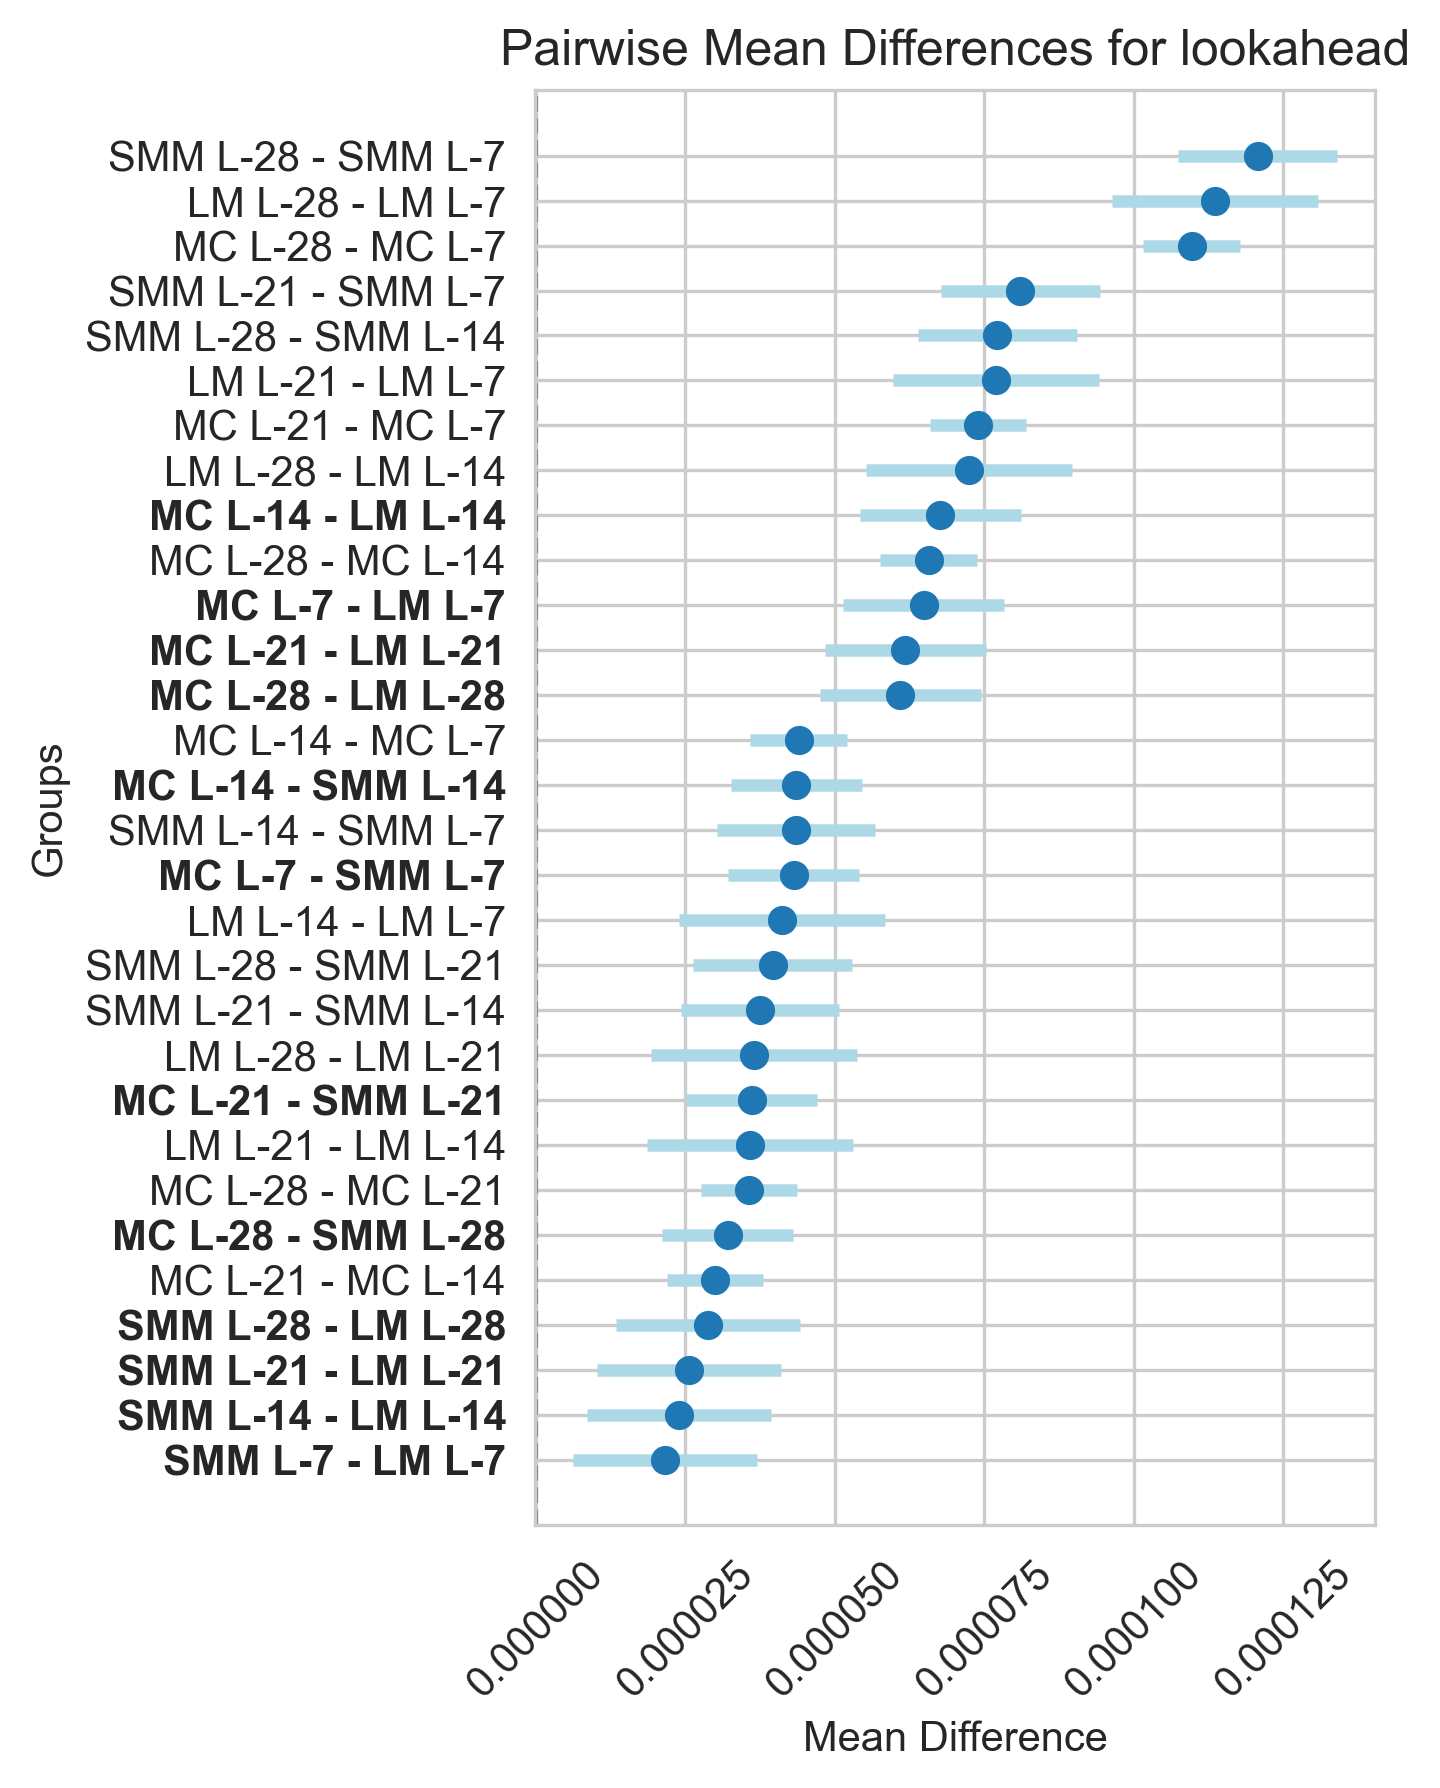
Majority Approach. Figure 5a illustrates the distribution of the normalized Pinball Loss (PBL) across different lookaheads (7, 14, 21, and 28 days) for COVID-19 case predictions, disaggregated by race using the majority approach. We can observe that, as the lookahead increases, the median PBL increases across all racial groups, suggesting a decrease in prediction accuracy over longer time horizons, as previously shown in the literature [13]. Throughout the different lookahead periods, the Hispanic majority counties consistently show higher median PBLs compared to the White majority counties, indicating that predictions for these racial category are consistently less accurate.
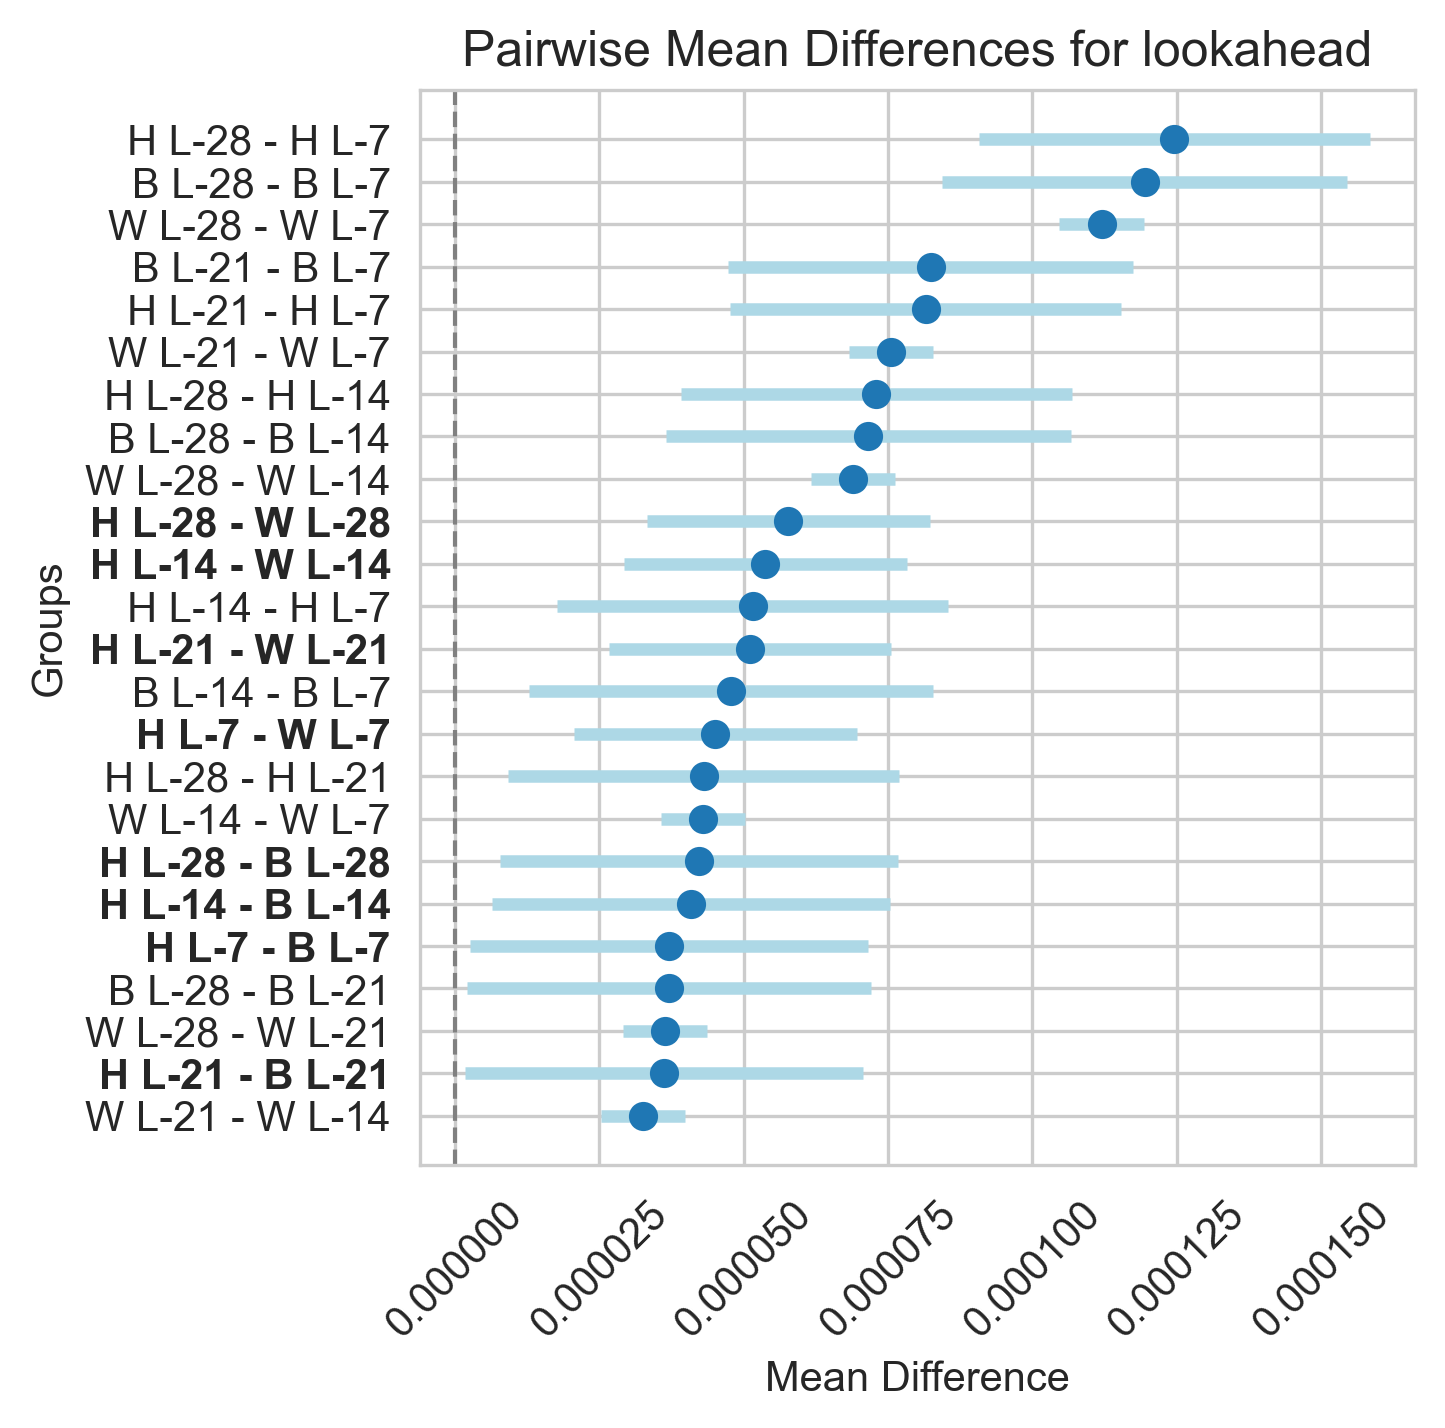
Further analysis through a two-way ANCOVA, identified significant disparities among racial groups and lookahead periods after controlling for age 65+; with both factors significantly affecting prediction accuracy ( for race and for lookahead). The post-hoc Tukey HSD analysis reveals significant disparities between Hispanic and all other groups across all lookahead, whereby Hispanic counties are associated with higher PBL errors. Understandably, the lookahead 7 was consistently associated to lower PBL values compared to other lookaheads. All other significant interactions of the Tukey-HSD test are illustrated in 16d in the Appendix. This variation in predictive accuracy across racial and ethnic groups, particularly the consistently higher errors in Hispanic majority counties regardless of the lookahead period, indicates a potential systematic bias in the performance of predictive models. This suggests an urgent need to address these disparities to ensure fairer outcomes in predictive analytics.
Plurality Approach. Consistent with findings from the majority approach, the plurality approach also indicates an increase in mean Pinball Loss (PBL) values with extended lookahead periods across all racial groups. Furthermore, counties with a Hispanic plurality consistently exhibited higher PBLs compared to those with a majority of White or Black populations. See Figure 18d in the Appendix for further details.
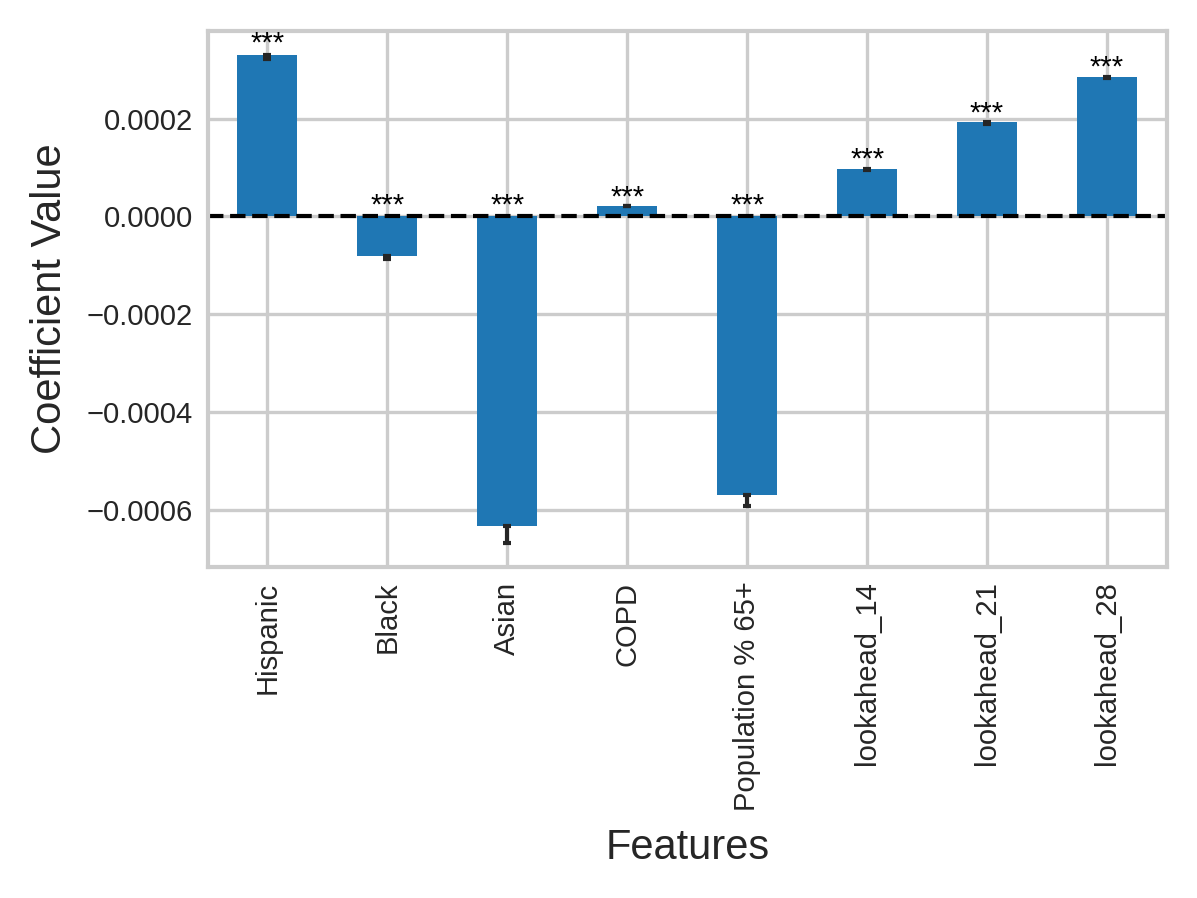
Distribution Approach. The regression analysis revealed a significant, positive coefficient for Hispanic percentage population (), which aligns well with the results discussed for the majority and plurality approaches. This result highlights that an increase of the Hispanic county population percentage is associated with an increase in prediction error when compared to White population percentages and after controlling for the lookahead, age 65+ and the prevalence of COPD. In addition, the distribution approach also revealed a significant, negative regression coefficient for the county percentage of Asian population i.e., lower prediction errors for the Asian population when compared to the reference group (White). This finding was not revealed in the majority or plurality approaches. These race associations were observed together with positive coefficients for all lookaheads with respect to the reference group (lookahead 7), signaling increased forecast errors for lookaheads 14, 21 and 28, while holding race percentages constant. See Figure 19c in the Appendix for full details.
5.3.4 Phases
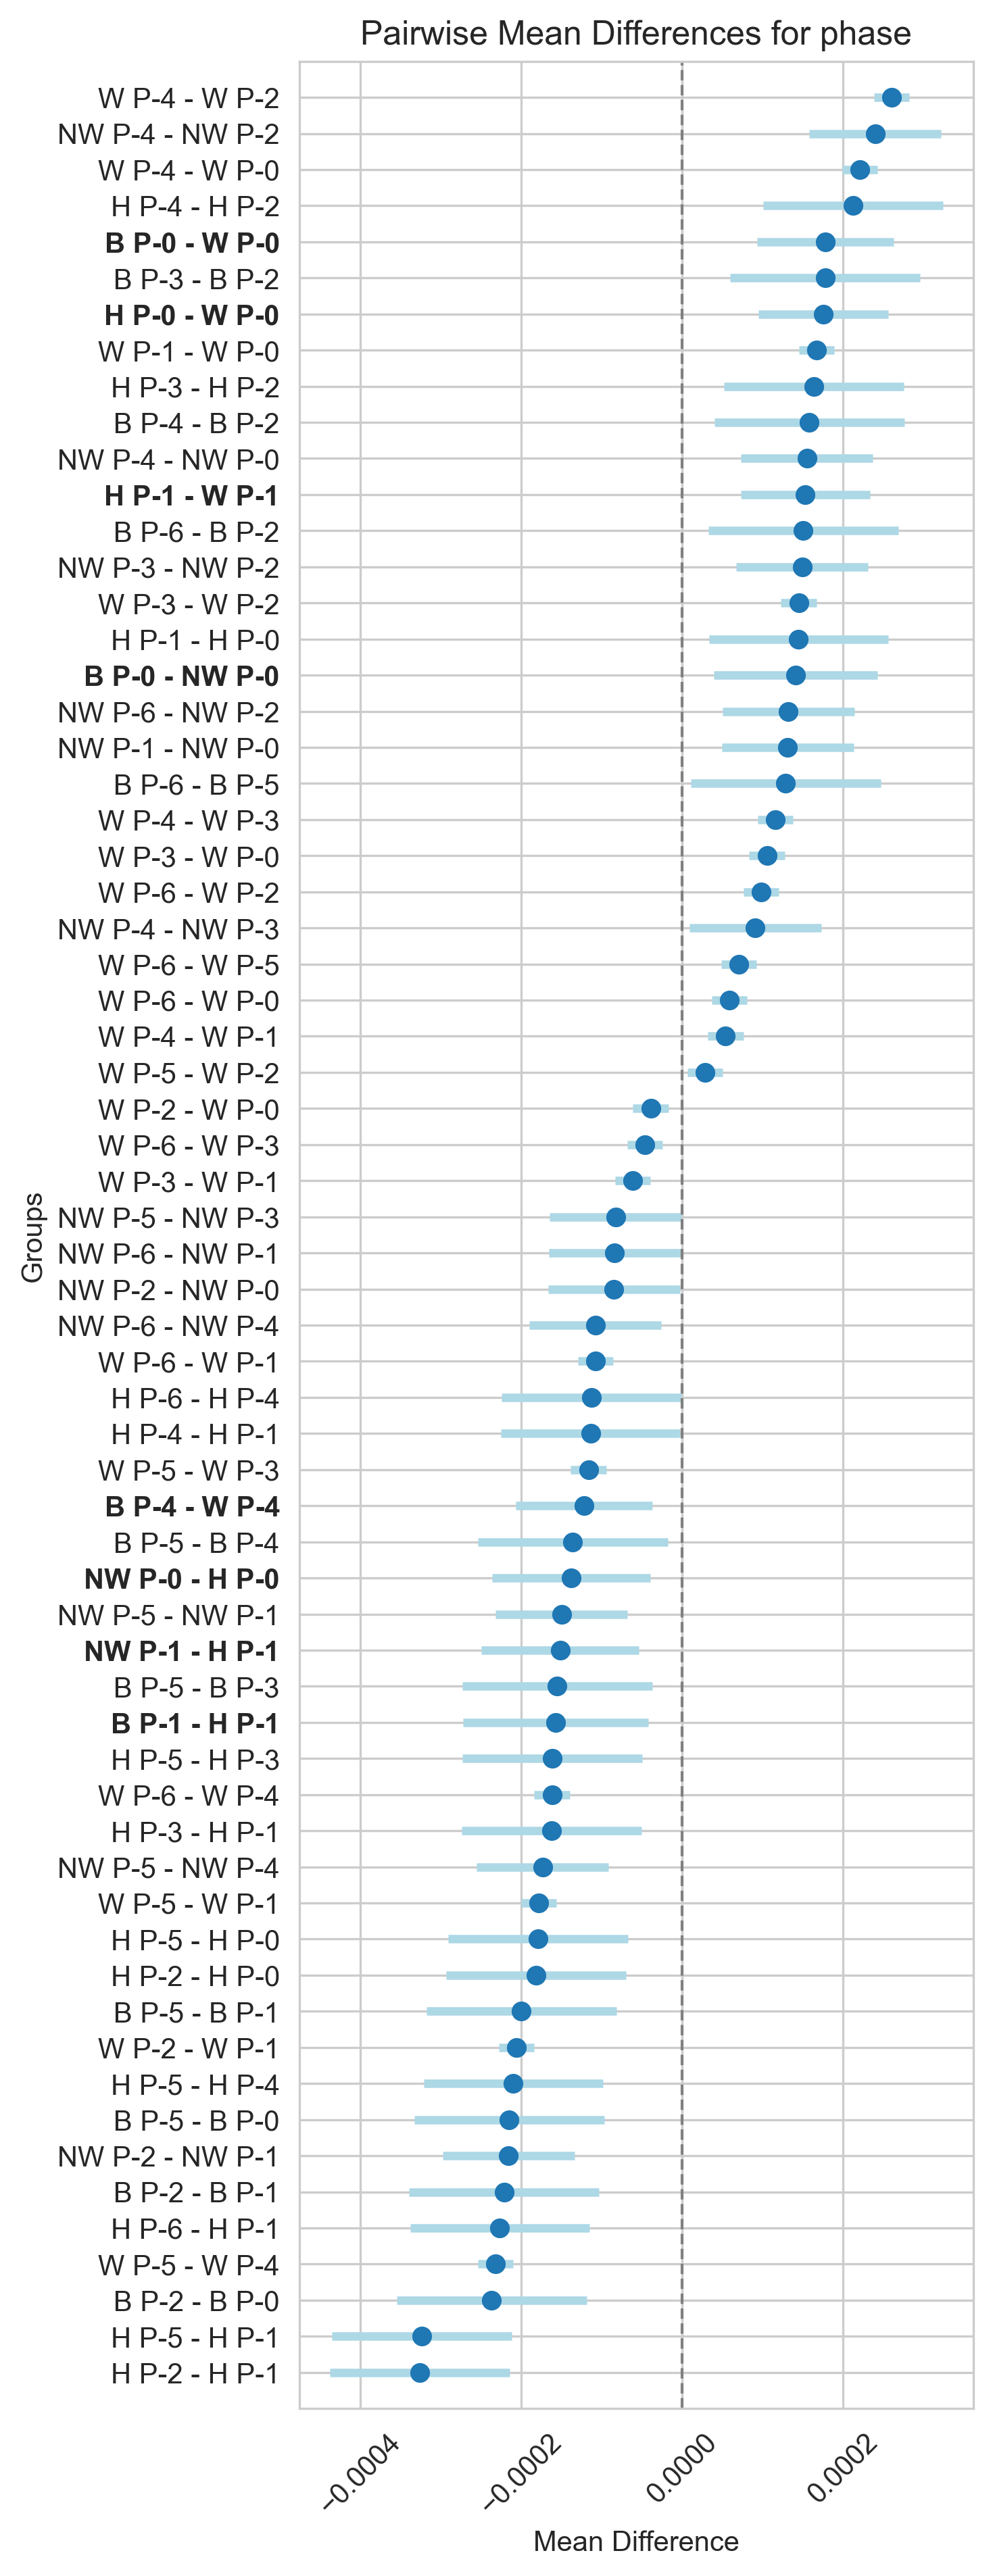
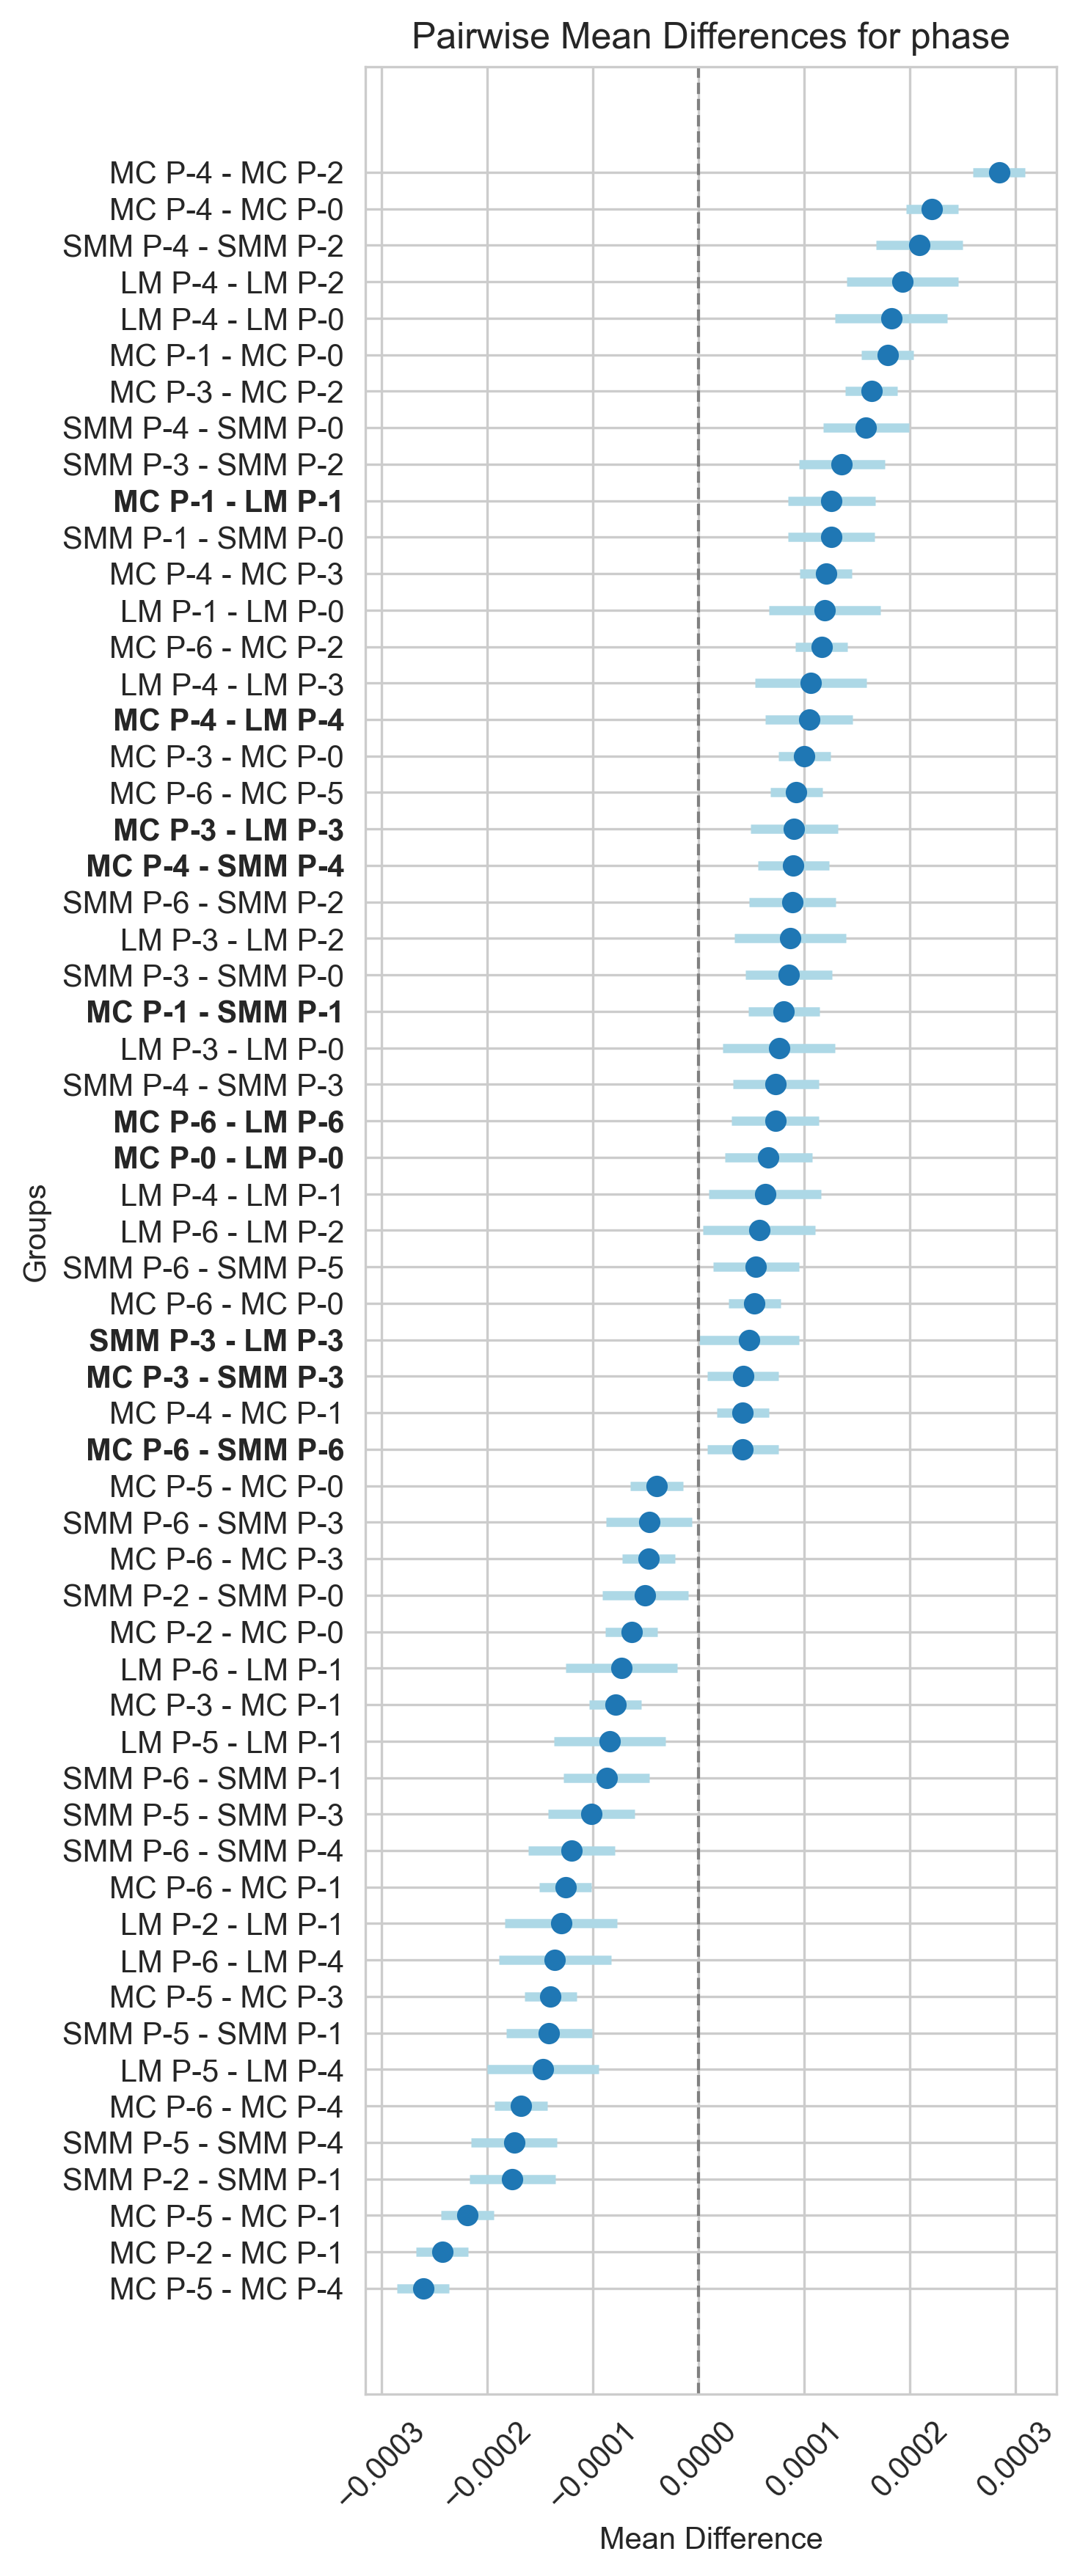
Majority Approach. Figure 5b depicts the normalized PBL distributions across seven distinct phases of the COVID-19 pandemic, segmented by racial group using the majority approach. The visualization reveals dynamic fluctuations in mean PBL both between racial groups and temporally, through different pandemic stages. Initially, phases 0 and 1 are characterized by a heightened PBL across all racial groups with mean values of 0.00012 and 0.00029, respectively, likely indicative of the uncertainties and limited data inherent in the early pandemic response. Progressing to phases 2 and 3, a decline and subsequent stabilization in mean PBLs are observed, hinting at the enhanced precision of predictive models as they adapt to accumulating data and evolving pandemic trends. A resurgence in PBL in phase 4 interrupts this trend, followed by a reduction during phases 5 and 6, which may reflect the models’ recalibration in response to pandemic developments. Disparities within the first pandemic phases (0–3) are apparent, with Hispanic and Black majority counties consistently exhibiting higher PBLs.
The two-way ANCOVA analysis, identified significant disparities among racial groups and phases after controlling for age 65+ population ( for race and ethnicity and for phases). The subsequent Tukey-HSD analysis, revealed statistically significant intra-phase differences across PBLs and race, specifically for phases 0, 1 and 4. During the initial phases (0 and 1) Hispanic counties are associated with significantly higher median PBL when compared to White and non-White majority groups (mean differences between –); while similar higher median PBLs were observed for Black majority counties when compared to White during phase 1 only. Interestingly, this result changes for phase 4, when Black majority counties display significantly lower PBLs compared to the White groups (). Figure 16c in the Appendix shows a comprehensive visualization of all the statistical tests. These results suggest that unequal PBL distributions might be associated with more unstable, harder to model periods due to either lack of training data (phases 0 and 1) or large changes in COVID-19 case spreading (phase 4). We encourage researchers to report prediction fairness specially during periods when training accuracy might be low.
Plurality Approach. Utilizing the plurality approach to examine the distribution of Pinball Loss (PBL) values across seven distinct phases of the COVID-19 pandemic, segmented by racial group, yielded results consistent with the majority approach. Notably, Hispanic and Black counties exhibited statistically higher PBLs compared to White and groups during phase 0 (); and the trend continued during phase 1 for Hispanic plurality counties. During phase 4, and similarly to the majority approach, PBLs were notably higher in White plurality counties compared to Black groups. As in other analyses, the results for Asian counties did not show significant differences, which may be due to the smaller sample size of counties categorized under the Asian group. Detailed results can be found in Figure 18c in the Appendix.
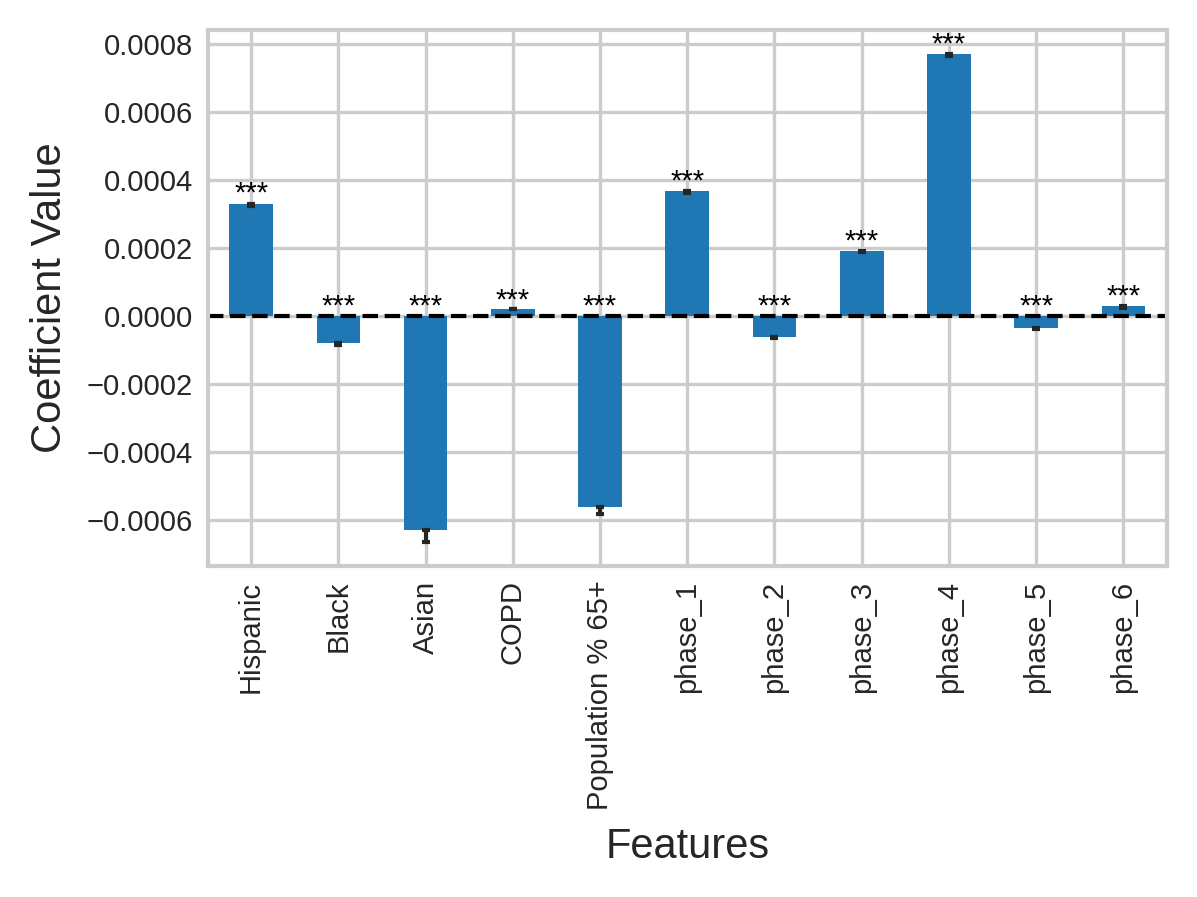
Distribution Approach. A positive coefficient for Hispanic percentage (), confirms the results from the majority and plurality approaches pointing to higher Hispanic population percentages associated with an increase in prediction error when compared to White population percentages and after controlling for the phase, percentage of 65+ population and COPD prevalence. New to the majority and plurality approaches, the distribution approach also revealed a significant, large negative coefficient, pointing to a decrease in prediction errors when compared to the reference group (White race). These race associations were observed together with positive coefficients for Phases 1, 3 and 4 with respect to Phase 0, signaling increased forecast errors for these phases, while holding percentage races constant. See Figure 19d in Appendix for all results.
5.3.5 Summary.
When looking into model and data specifics, we show that (i) deep learning models are less fair i.e., produce higher errors for some racial and ethnic groups, (ii) using mobility data can help reduce the disparities associated with certain racial and ethnic groups, (iii) longer lookaheads are associated with higher PBL errors for some racial and ethnic groups and (iv) early and recalibration pandemic phases are associated with higher PBLs for some groups. And, more importantly, we show that these results hold across different race assignment approaches.
5.4 Fairness of COVID-19 case predictions across urbanization level and model-data characteristics
Our prior analysis in section 5.2 showed that less urbanized areas are associated with statistically significant higher prediction errors (PBLs). In this section, we explore whether that association holds or changes across predictive model types, the use of mobility data during training, lookaheads and pandemic phases.

5.4.1 Model Type
Figure 6a illustrates the normalized Pinball Loss (PBL) values across various COVID-19 pandemic modeling approaches, stratified by urbanization levels. As discussed in section 5.2, the Figure shows a consistent trend: regions with higher levels of urbanization exhibited lower PBL values, signaling enhanced predictive precision within these areas. ANCOVA statistical analyses to quantify the effect of urbanization levels and model types on the prediction error, while controlling for population age 65+, revealed that both variables have a significant effect ( for urbanization level and for model type). Post-hoc Tukey-HSD tests revealed significant differences between urbanization levels across all model types, with less urbanized areas experiencing higher PBL errors across all five model types i.e., prediction errors for micropolitan areas (MS) were higher than those of small and medium areas (SMM), which were higher than those for large metro areas (LMs) across all model types. Looking into differences per model types, we observe that, irrespective of urbanization categorization, deep learning and statistical models consistently exhibited elevated PBLs in contrast to ensemble, baseline, and compartmental models. This trend aligns with previous findings correlating racial demographics and model types, where elevated PBLs were prevalent for statistical and deep learning models. The highest statistically significant disparity in the post-hoc tests was between large metro areas (LMs) and micropolitan areas (MCs) for the statistical models, with a mean difference of 0.0001, followed by deep learning models with a mean difference of 0.00008. All test results are detailed in Figure 20a in the Appendix. Overall, these results highlight the imperative to evaluate fairness and accuracy across different urbanization levels, independent of model selection, but with a special focus on deep learning and statistical models.
5.4.2 Mobility Data
The boxplot representations in Figure 6b detail PBL distributions for models trained with or without mobility data across varying levels of urbanization. We can observe that the presence of mobility data in the training process does not significantly alter the PBL values. However, the models trained without mobility data exhibit a marginally wider interquartile range, which suggests a greater variance in prediction errors. Consistently with prior findings, a trend is evident wherein higher urbanization is related with reduced PBL values, demonstrating more precise predictions, regardless of the inclusion of mobility data in model training. ANCOVA tests between urbanization levels and the inclusion (or not) of mobility data revealed a significant effect of the urbanization levels () and no effect of mobility data (), after controlling for population of age 65+. Nevertheless, the examination of the Tukey-HSD test pairwise mean differences between urbanization levels and the inclusion of mobility data revealed an interesting nuance. When mobility data is integrated into model training, we observe a marginal reduction in PBL values for models pertaining to LM compared to MC and SMM, by mean differences of 0.000011 and 0.000012, respectively. This denotes a slight improvement in prediction accuracy for more urbanized areas with the inclusion of mobility data. Figure 20b in the Appendix contains a complete description of these tests.

5.4.3 Lookaheads
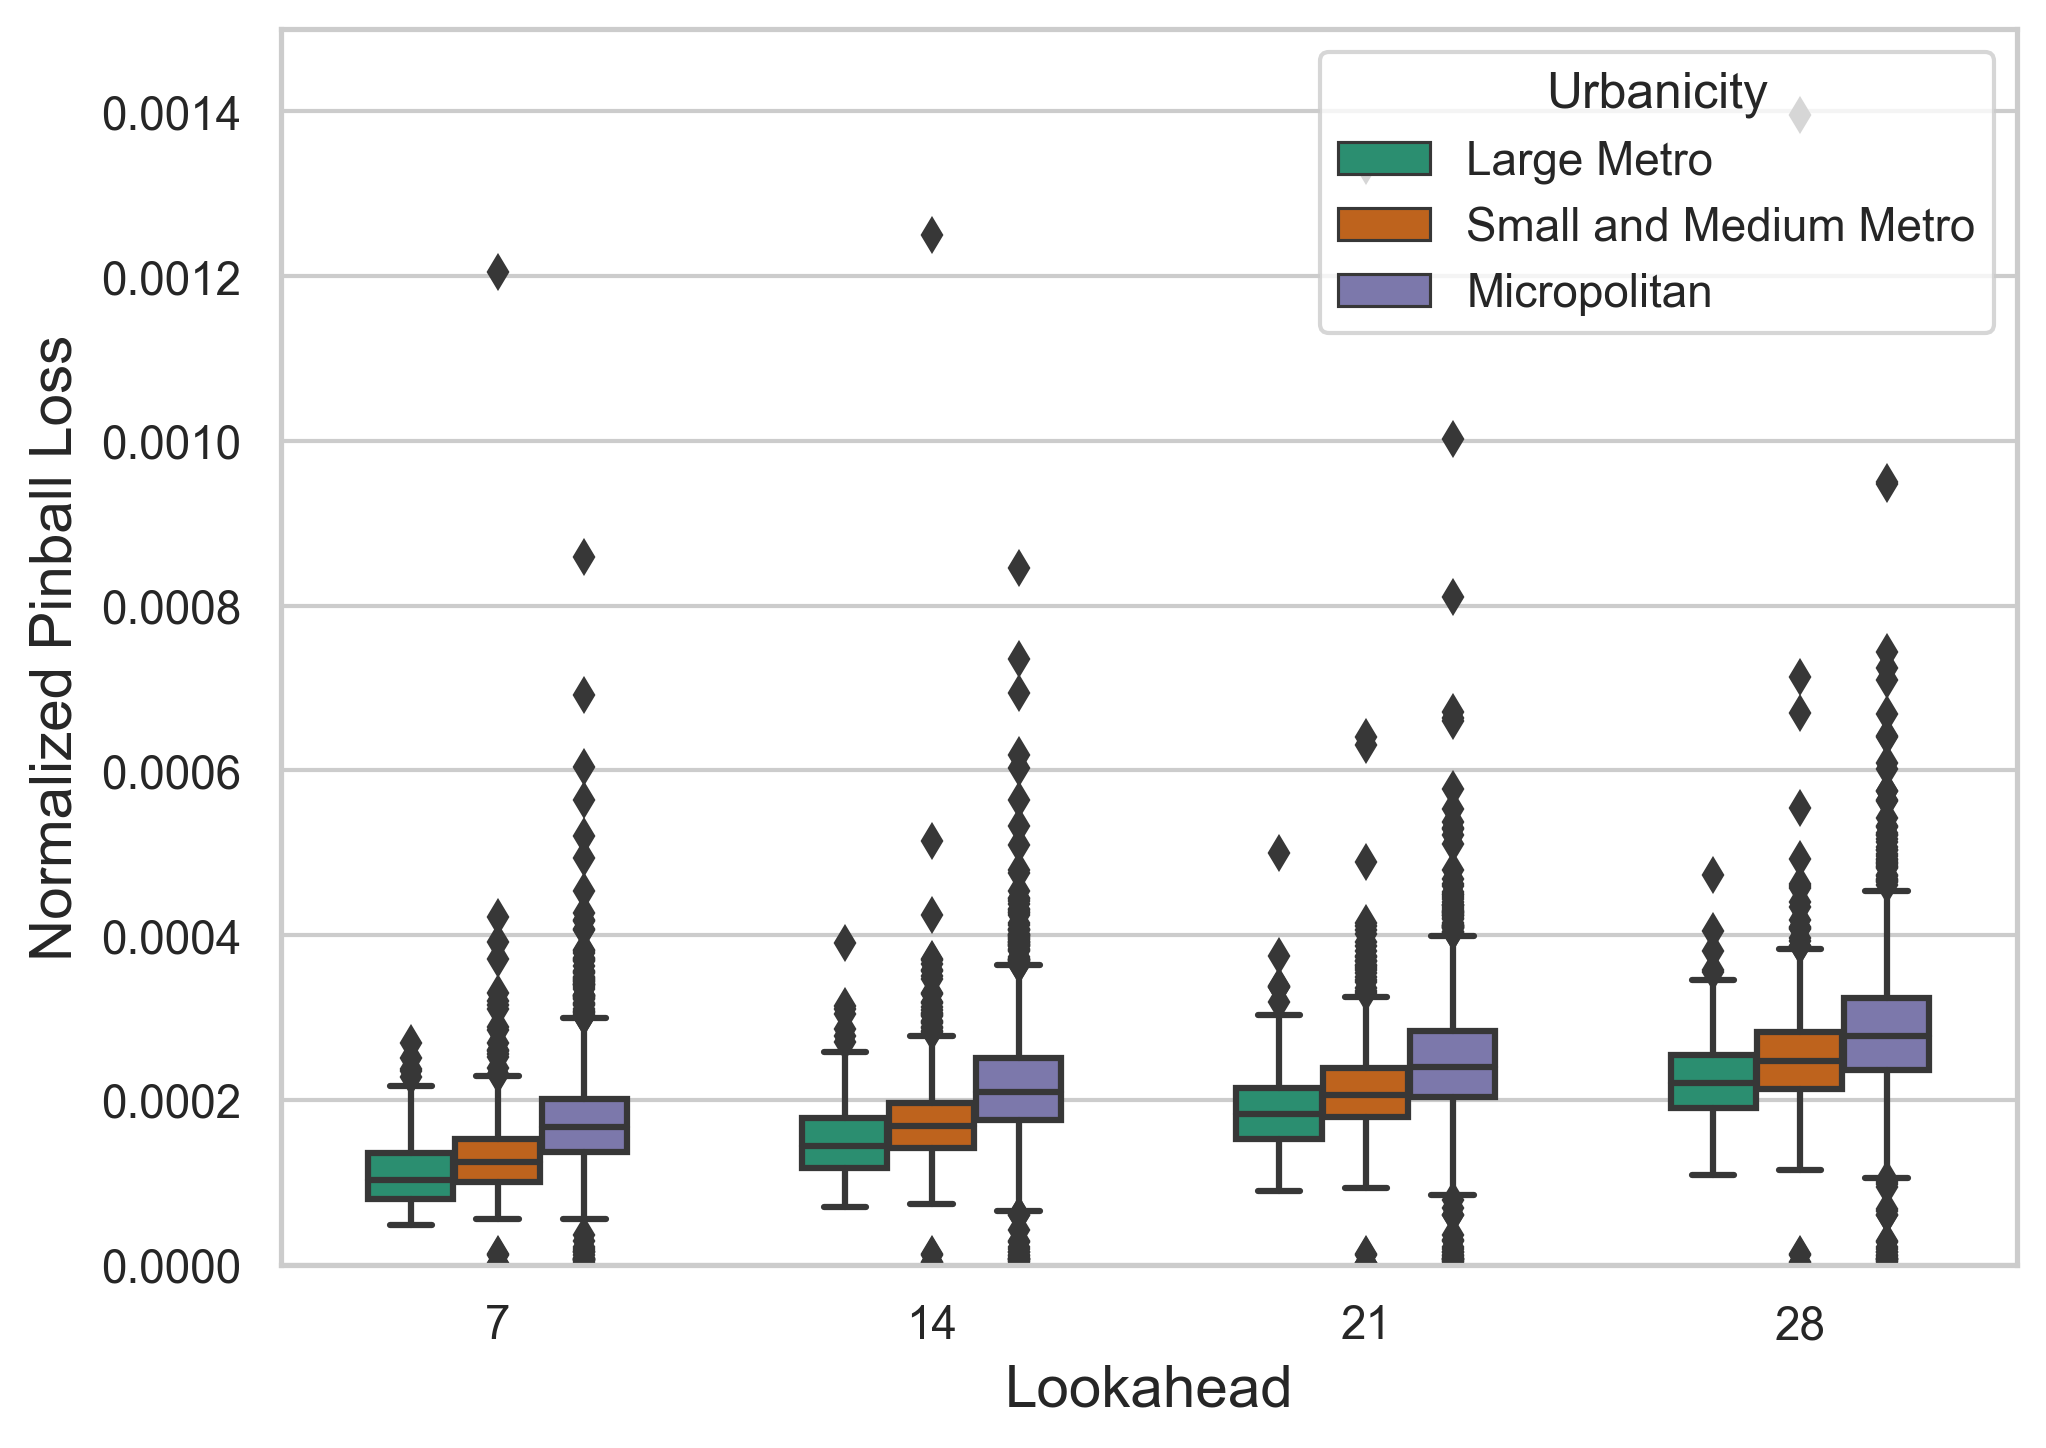
Figure 7a depicts the normalized COVID-19 case prediction errors for the intersection of rural-urban codes with lookahead periods. We observe that LMs consistently exhibit the lowest PBL values compared to MC and SMM areas, highlighting a clear gradient of predictive accuracy that favors more urbanized regions. More importantly, this hierarchy in PBL values is observed for each lookahead; and higher lookaheads are associated with higher PBLs across urbanization levels. This rise in PBL across lookaheads suggests a widespread increase in predictive errors for longer-term predictions, a trend similarly observed for racial and ethnic groups in section 5.3. ANCOVA tests confirm the significance of these disparities, with both urbanization levels () and lookaheads () being statistically significant after controlling for population 65+. Tukey-HSD tests revealed significant pairwise differences between urbanization levels and lookaheads, with two interesting nuanced findings. While small metropolitan areas (SMMs) have larger error differences for longer-term lookaheads, when compared with large metro areas (LMs); micropolitan regions show the opposite trend, with larger prediction errors for short-term lookaheads when compared to large metro areas, Further details for the Tukey-HSD test results can be found in Figure 20d in the Appendix.
5.4.4 Phases
Figure 7b delineates a significant variation in normalized PBL across phases and urbanization levels, with patterns very similar to what we observed in the analysis of the variation of PBL with respect to race and phase. Looking into the interaction between phases and rural-urban codes, Figure 7b shows that the disparity gradient favoring more urbanized regions is distinctive across all phases, with the exception of phases 2 and 5. In fact, in phase five, there seems to a small inversion of the disparity gradient favoring the rural regions, although the differences seem very small. This inversion could reflect specific regional challenges, potential data anomalies, or varying impacts of the pandemic that may have temporarily disrupted the predictive models’ accuracy.
Statistical analysis using two-way ANCOVA, indicates a significant interaction between the pandemic’s phases and urbanization levels, after controlling for the age 65+ demographic ( for urbanization levels and for phase). Subsequent Tukey-HSD post-hoc tests highlight significant differences in PBL between large metropolitan (LM) and micropolitan (MC) areas in all phases except for 2 and 5; with the highest PBL differences for phases 1 and 4, possibly pointing to higher errors due to lack of limited data during the early pandemic or during resurgence periods that required model recalibration. Similarly, small and medium metropolitan (SMM) areas show significant PBL variations compared to MC areas in all phases except for phase 0, 2 and 5. Complete results for the statistical tests are shown in Figure 20c in the Appendix. These results highlight the need to measure the distribution of COVID-19 case prediction errors across urbanization levels, with special attention to periods when the training data might be less accessible (early pandemic like phase 1) or changing (recalibration period phase 4).
5.4.5 Summary.
When looking into model and data specifics, our results show that (i) models produce higher errors for rural areas, with statistical and deep learning models exhibiting the highest disparities, (ii) using mobility data does not significantly impact the mean errors across urban-rural codes when compared to non-mobility models, however, using mobility helps reduce the error disparity between highly urbanized areas and less urbanized areas, (iii) the lower the urbanization level, the higher the prediction errors across lookaheads, and (iv) early and recalibration pandemic phases produce higher prediction errors for micropolitan areas, when compared to more urbanized regions. These results point to more unfair results for rural areas, and convey the need to report accuracy results across urbanization levels, and to address unfairness via, for example, de-biasing approaches.
6 Dashboard
This paper has revealed significant disparities in COVID-19 case prediction accuracy across race, ethnicity and urbanization level. Our statistical analyses aggregate the performance of Forecast Hub models by racial, ethnic and urban-rural groups, as well as by model type, the use of mobility data, lookahead, or phase to provide general recommendations for researchers working in COVID-19 prediction models and for decision makers using case predictions to inform pandemic policies. For example, we have revealed that deep learning models are associated with higher errors for some minority groups and for rural areas. This finding can inform modelers to deepen into the reasons why deep learning models are failing more for certain racial groups, and can also guide decision makers to take predictions from deep learning models with a grain of salt when making decisions for rural areas.
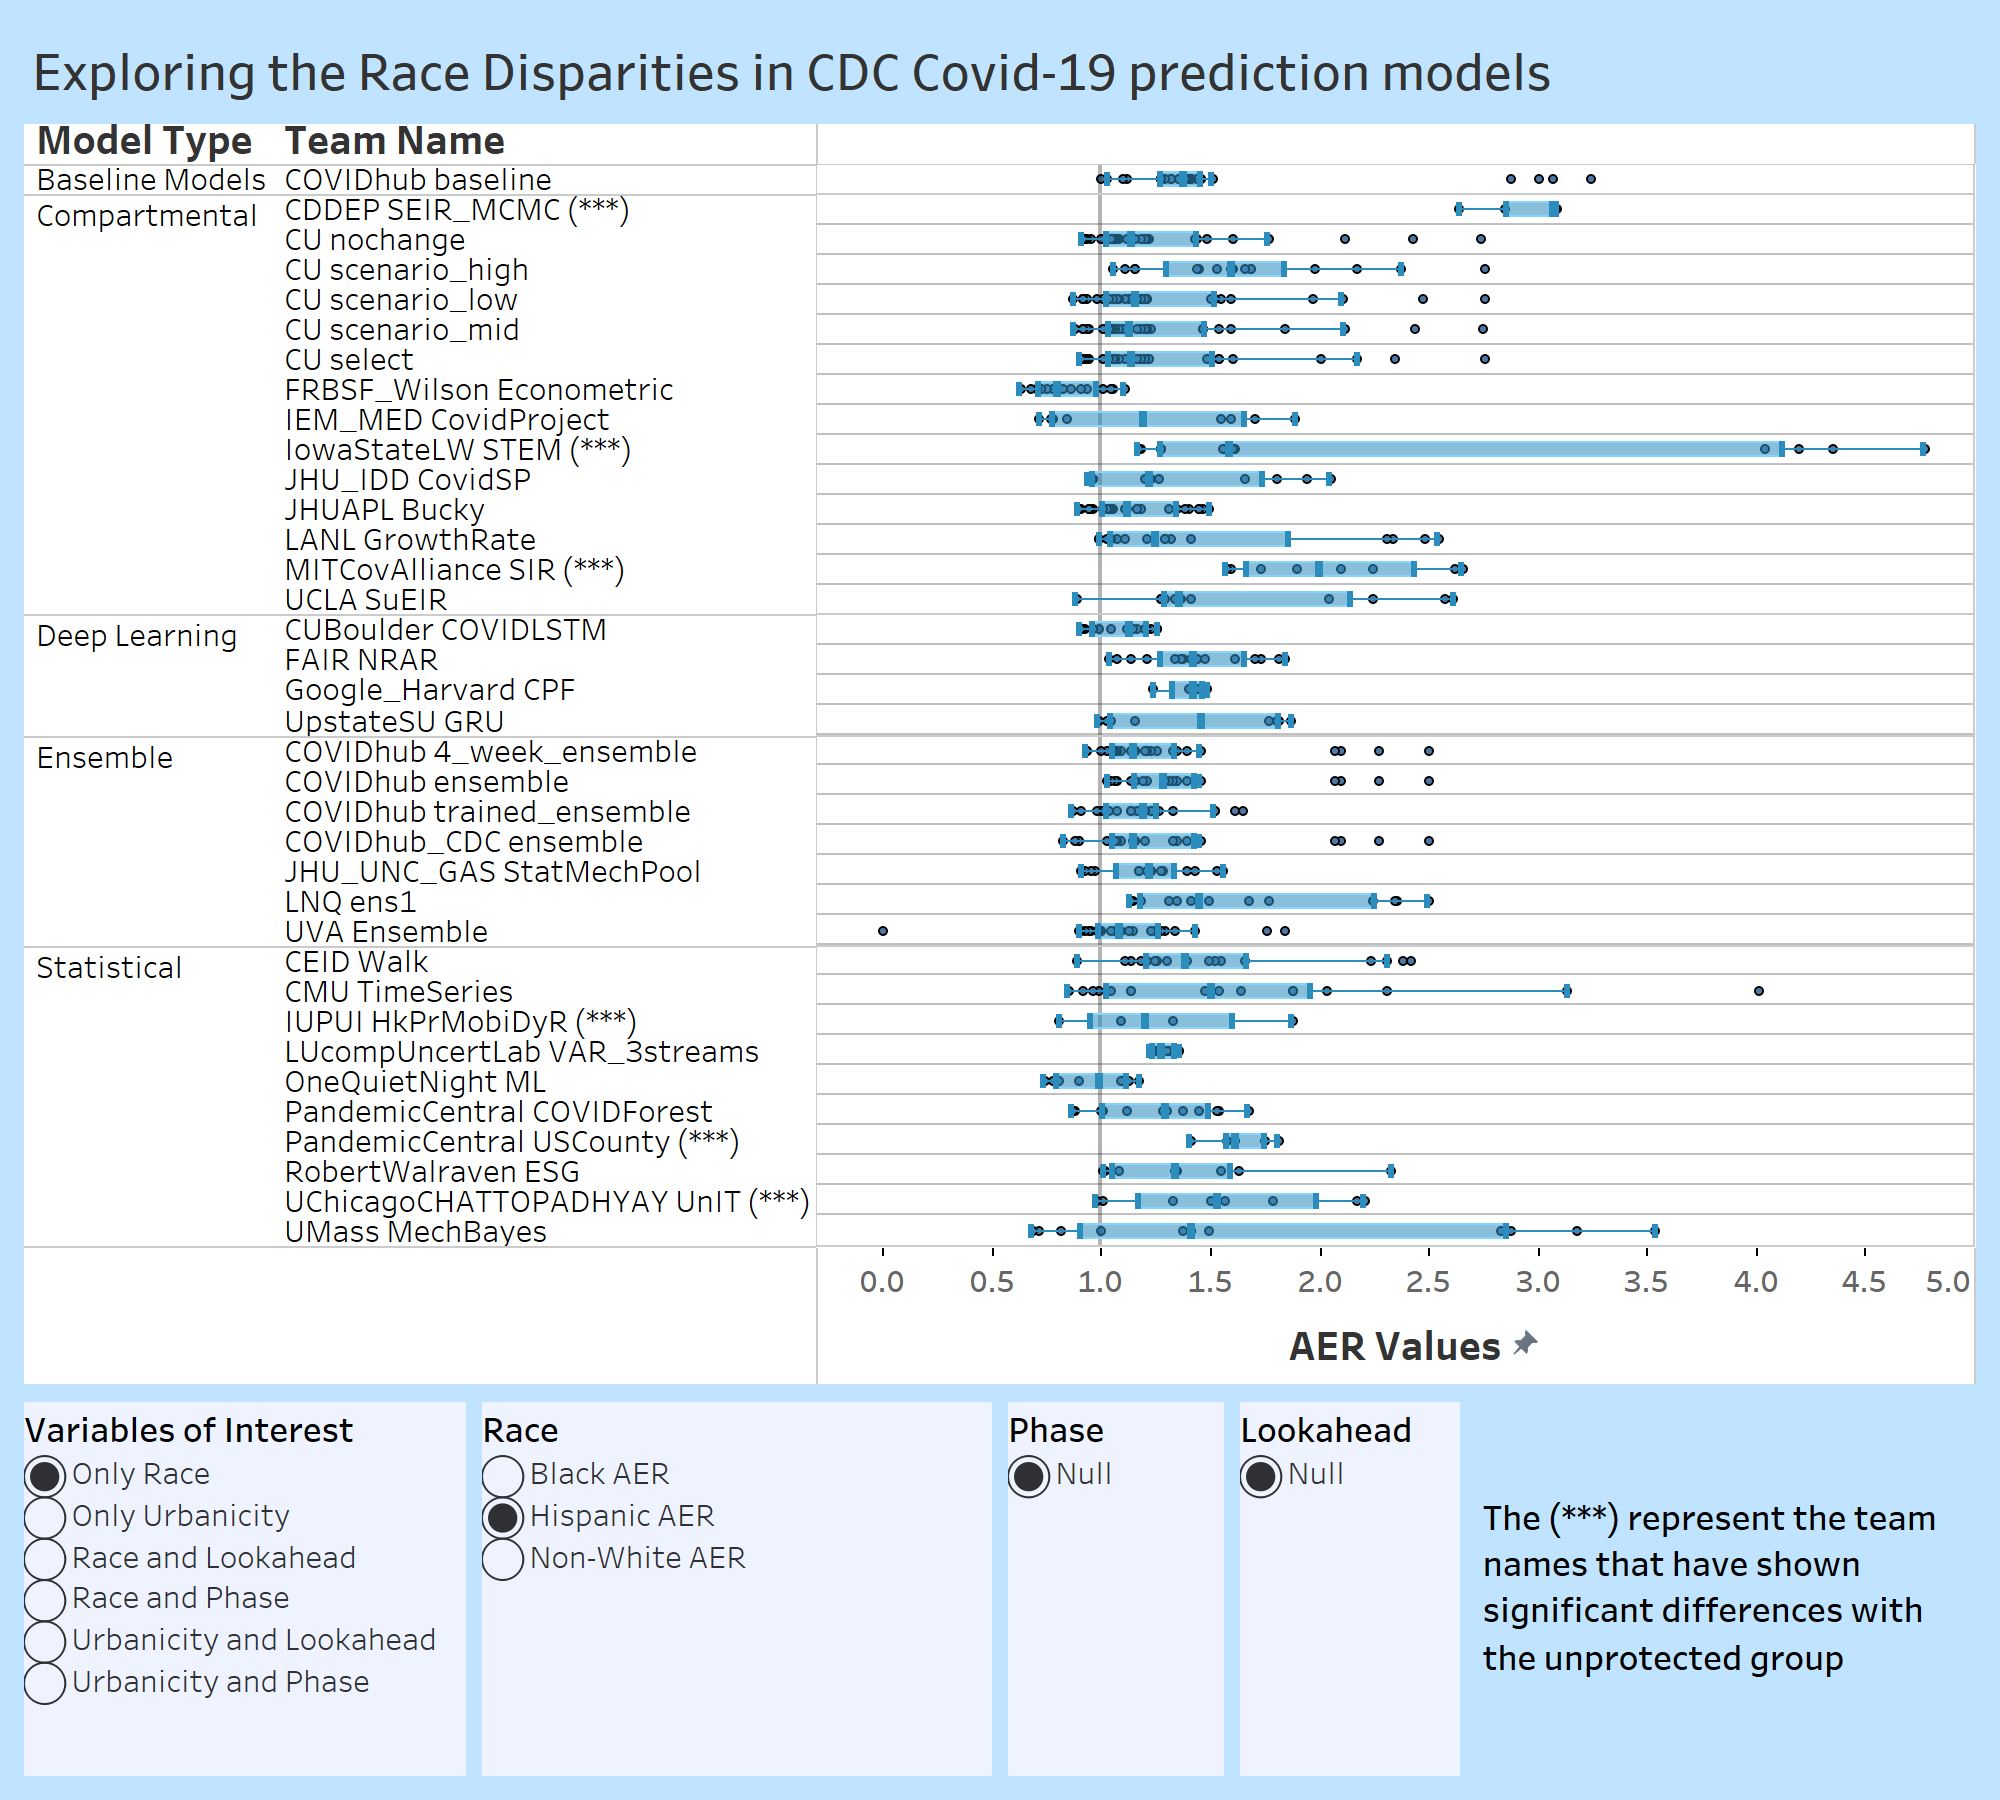
Nevertheless, it is important to acknowledge that researchers and decision makers might also want to assess the specific performance of each COVID-19 county case prediction model individually, exploring PBL error differences between racial and ethnic groups or urbanization levels for a given model, their statistical significance, or whether these differences persist when considering specific lookaheads or phases. To enable individual model evaluation, we have created an interactive dashboard (see Figure 8), that will be made publicly available upon the publication of this paper. The dashboard displays a model’s performance error (PBL) for a given protected attribute - race and ethnicity or urbanization level - that can be selected by the user from the user interface.
To allow for meaningful explorations, the individual model errors are displayed using the Accuracy Equality Ratio (AER) [67], which measures the difference in error distributions between protected and unprotected groups for a given protected attribute.
The AER is computed as a quotient between the model’s performance error (PBL) for a given protected group across all counties and the model’s performance error for the unprotected group across all counties: where and are the pinball ball loss metric for protected and unprotected groups respectively. For the race and ethnicity protected attribute we define the following protected groups with respect to White: Black, Hispanic and Non-White for the majority approach; and Asian, Black and Hispanic for the plurality approach. For the urban rural code protected attribute, we define the following protected groups with respect to Large Metropolitan Areas: Micropolitan and Non-core as well as Small and Medium Metro Areas. Similar error distributions between the protected and the unprotected groups will produce AER values close to one. AER values larger than one point to higher errors for the protected group, and AER values smaller than one point to higher errors for White majority counties.
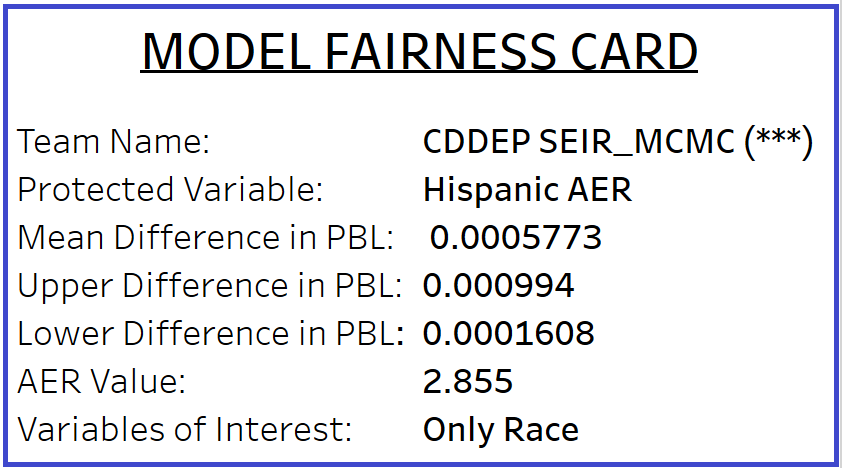
Figure 8 shows an example of the dashboard for the exploration of individual model performance by race and type of model, with a focus on the relationship between the prediction errors for Hispanic and White counties (). The box plots for each model represent its AER distribution across all counties; and a user can explore the mean AER as well as its quantiles for each predictive model. Hovering over the model points displays all the information in the format of a ‘fairness nutritional card’ as shown in Figure 9, and inspired by the work of Stoyanovich and Howe [21].
The fairness nutritional card provides detailed information, including the model name, whether the differences between the protected (Hispanic) and unprotected (White) groups are statistically significant (indicated by ***), and the specific differences in prediction errors, including their lower and upper bounds in terms of the Pinball Loss (PBL) value, and the corresponding AER metric value. The dashboard also facilitates dynamic exploration of how the AER may vary with changes in pandemic phases and lookaheads, which can be selected through the user interface. Additionally, the nutritional card displays relevant information regarding the selected lookahead and phase when exploring these variables.
7 Discussion
This study highlights the critical need to audit COVID-19 prediction models due to significant disparities in prediction accuracy. Our findings reveal that certain minority groups, especially within Hispanic communities, and less urbanized areas consistently experience higher prediction errors. This trend holds true across various model types, data inputs, lookaheads, and pandemic phases. The race and ethnicity analysis revealed that Hispanic counties exhibit significantly higher mean errors compared to other racial and ethnic groups, and that these disparities are consistent across majority, plurality, and distribution race assignment methods, confirming the robustness of our results. Our analyses also showed that Asian counties generally see lower errors than White counties, albeit only when using the distribution approach. The analysis on urbanization levels, on the other hand, revealed an inverse relationship between the level of urbanization and the magnitude of prediction errors underscores the unique challenges encountered by rural areas. Rural counties consistently face higher prediction errors than their urban counterparts, a pattern that persists across various model types and forecast windows.
The implications of these findings are significant, since systematic disparities in model performance could lead to unfair distribution of public health resources or to less effective pandemic response efforts in Hispanic counties and in less densely populated regions, when compared to White and urban regions. Our definition of prediction fairness is focused on achieving similar prediction errors across racial, ethnic and urban-rural groups because COVID-19 cases have been used to make resource allocation and intervention decisions e.g., hospital beds or stay-at-home orders. Hence, higher prediction errors for minority racial groups or rural regions could in turn translate into unfair resource allocation for communities that have borne the brunt of the pandemic. Ultimately, we want to ensure our findings serve as a critical call to action for researchers and decision makers to analyze model performance disaggregated by racial/ethnic and urban-rural variables.
Our intersectional analysis provides a more multifaceted understanding of fairness in COVID-19 modeling. We find that deep learning models produce the highest disparities in errors across racial, ethnic and urban-rural groups, while the use of mobility data helps reduce disparities for racial and ethnic groups as well as across urbanization levels. Long-term lookaheads and certain pandemic phases (early stages and recalibration periods) are also associated with higher prediction errors for some minority racial groups and rural areas. These findings highlight the complex interplay between model characteristics, data inputs, and social determinants in shaping prediction fairness. As a result, researchers and modelers must carefully examine their data sources, model assumptions, and potential biases that could lead to unfair predictions for certain population groups. Incorporating fairness considerations into the model development, validation, and deployment processes is essential to ensure equitable outcomes. Public health officials and policymakers should be aware of the potential disparities in the accuracy of COVID-19 prediction models and work closely with modelers to mitigate these disparities. Failure to address these issues could lead to the perpetuation of health inequities and could eventually undermine the effectiveness of pandemic response efforts.
Due to systemic data collection failures during the pandemic, county-level COVID-19 case data stratified by race and ethnicity is not available. Nevertheless, we posit that evaluating the relationship between COVID-19 case prediction errors and racial and ethnic groups is critical to reveal prediction inequalities than can negatively impact policy decisions. Hence, we have presented three proxies to associate prediction errors to racial and ethnic groups: majority, plurality and distribution approach. The regression approach attempts to model a linear relationship between error, race/ethnicity and model-data characteristics; while the majority and plurality approaches remove the linear assumption and associate errors with a unique race/ethnicity. Using these three different association approaches allows us to assess the robustness of our findings across approaches. Indeed, for all three, we find statistically significant higher mean errors associated with racial and ethnic minority groups, which could negatively impact these communities in terms of resource allocation or pandemic interventions based on case predictions. While these three approaches to associate prediction errors with race and ethnicity provide valuable, robust results, there might be alternative approaches that we did not consider in this paper.
We posit that future research in COVID-19 case prediction models should focus on developing and validating bias mitigation strategies that account for performance disparities across race, ethnicity and urbanization levels. This may involve exploring alternative data sources, refining model architectures, and incorporating techniques to ensure fairness across different population groups. Additionally, more comprehensive and standardized race and ethnicity data collection in public health surveillance systems is crucial to enable accurate assessments of model fairness and to guide equitable decision-making.
8 Conclusions
Our paper shows significant diverse predictive performance across social determinants for the Forest Hub COVID-19 models, with some minority racial and ethnic counties as well as less urbanized counties often associated with statistically significant higher prediction errors. We also show that these higher errors are often times present for specific model types, lookaheads and pandemic phases; and that these findings generally hold across different race associations. We hope this paper will encourage Forecast Hub modelers, the CDC and COVID-19 modelers to report fairness metrics together with accuracy, and to reflect on the potential negative impacts of the models on specific social groups and contexts.
Declarations
Availability of Data and Materials
The datasets supporting the conclusions of this article are available in the following repositories:
-
•
COVID-19 Forecasts: https://github.com/reichlab/covid19-forecast-hub/tree/master
-
•
COVID-19 Ground Truth Data: https://github.com/CSSEGISandData/COVID-19
-
•
Race and Ethnicity, Population Data: https://www.census.gov/data/tables/time-series/demo/popest/2020s-counties-detail.html
-
•
Urban-Rural Classification Scheme for Counties: https://www.cdc.gov/nchs/data_access/urban_rural.htm#2013_Urban-Rural_Classification_Scheme_for_Counties
-
•
COPD Prevalence Data: https://www.cdc.gov/copd/data-and-statistics/county-estimates.html
Competing interests
The authors declare that they have no competing interests.
Funding
This work has been funded with a National Science Foundation grants, NSF #1750102, NSF #2210572. NSF has not played any role in the design of the study, collection, analysis, and interpretation of data or in writing the manuscript.
Author Contribution
S.M.A. and V.F.M. designed the study; S.M.A. carried out data collection; S.M.A. and V.F.M. carried out the analysis and interpretation of the data; S.M.A., N.A., D.S. and VFM helped to write the manuscript. All authors read and approved the final manuscript.
References
- \bibcommenthead
- CDC [2020a] CDC: Forecast Hub. https://covid19forecasthub.org/ (2020)
- CDC [2020b] CDC: CDC COVID-19 Visualization. https://www.cdc.gov/coronavirus/2019-ncov/science/forecasting/forecasting-math-modeling.html (2020)
- Gross et al. [2020] Gross, C.P., Essien, U.R., Pasha, S., Gross, J.R., Wang, S.-y., Nunez-Smith, M.: Racial and ethnic disparities in population-level covid-19 mortality. Journal of general internal medicine 35, 3097–3099 (2020)
- Souch and Cossman [2021] Souch, J.M., Cossman, J.S.: A commentary on rural-urban disparities in covid-19 testing rates per 100,000 and risk factors. The Journal of Rural Health 37(1), 188 (2021)
- Rajkomar et al. [2018] Rajkomar, A., Hardt, M., Howell, M.D., Corrado, G., Chin, M.H.: Ensuring fairness in machine learning to advance health equity. Annals of internal medicine 169(12), 866–872 (2018)
- Douglas et al. [2021] Douglas, M.D., Respress, E., Gaglioti, A.H., Li, C., Blount, M.A., Hopkins, J., Baltrus, P.T., Willock, R.J., Caplan, L.S., Dawes, D.E., et al.: Variation in reporting of the race and ethnicity of covid-19 cases and deaths across us states: April 12, 2020, and november 9, 2020. American Journal of Public Health 111(6), 1141–1148 (2021)
- CDC [2023] CDC: Health Disparities. Last accessed January 2024 (2023). https://www.cdc.gov/nchs/nvss/vsrr/covid19/health_disparities.htm#CountyRaceHispanicOrigin
- Del Rios et al. [2022] Del Rios, M., Puente, S., Vergara-Rodriguez, P., Sugrue, N.: Invisibilidad de los latinos en la pandemia. AMA Journal of Ethics, 289–295 (2022)
- Safegraph [2020] Safegraph: Safegraph Mobility Data. https://www.safegraph.com/guides/mobility-data (2020)
- Apple [2020] Apple: Apple Mobility Data. https://covid19.apple.com/mobility (2020)
- Google [2020] Google: Google Mobility Data. https://www.google.com/covid19/mobility/ (2020)
- Ilin et al. [2021] Ilin, C., Annan-Phan, S., Tai, X.H., Mehra, S., Hsiang, S., Blumenstock, J.E.: Public mobility data enables covid-19 forecasting and management at local and global scales. Scientific reports 11(1), 13531 (2021)
- Abrar et al. [2023] Abrar, S.M., Awasthi, N., Smolyak, D., Frias-Martinez, V.: Analysis of performance improvements and bias associated with the use of human mobility data in covid-19 case prediction models. ACM Journal on Computing and Sustainable Societies (2023)
- García-Cremades et al. [2021] García-Cremades, S., Morales-García, J., Hernández-Sanjaime, R., Martínez-España, R., Bueno-Crespo, A., Hernández-Orallo, E., López-Espín, J.J., Cecilia, J.M.: Improving prediction of covid-19 evolution by fusing epidemiological and mobility data. Scientific Reports 11(1), 15173 (2021)
- Erfani and Frias-Martinez [2023] Erfani, A., Frias-Martinez, V.: A fairness assessment of mobility-based covid-19 case prediction models. Plos one 18(10), 0292090 (2023)
- Coston et al. [2021] Coston, A., Guha, N., Ouyang, D., Lu, L., Chouldechova, A., Ho, D.E.: Leveraging administrative data for bias audits: Assessing disparate coverage with mobility data for covid-19 policy. In: Proceedings of the 2021 ACM Conference on Fairness, Accountability, and Transparency, pp. 173–184 (2021)
- Barocas et al. [2019] Barocas, S., Hardt, M., Narayanan, A.: Fairness and Machine Learning. fairmlbook. org (2019)
- Hardt et al. [2016] Hardt, M., Price, E., Srebro, N.: Equality of opportunity in supervised learning. Advances in neural information processing systems 29 (2016)
- Kader and Smith [2021] Kader, F., Smith, C.L.: Participatory approaches to addressing missing covid-19 race and ethnicity data. International Journal of Environmental Research and Public Health 18(12), 6559 (2021)
- CensusBureau [2023] CensusBureau: American Community Survey. https://www.census.gov/programs-surveys/acs (2023)
- Stoyanovich and Howe [2019] Stoyanovich, J., Howe, B.: Nutritional labels for data and models. A Quarterly bulletin of the Computer Society of the IEEE Technical Committee on Data Engineering 42(3) (2019)
- Cramer et al. [2022] Cramer, E.Y., Huang, Y., Wang, Y., Ray, E.L., Cornell, M., Bracher, J., Brennen, A., Castro Rivadeneira, A.J., Gerding, A., House, K., Jayawardena, D., Kanji, A.H., Khandelwal, A., Le, K., Niemi, J., Stark, A., Shah, A., Wattanachit, N., Zorn, M.W., Reich, N.G., Consortium, U.C.-.F.H.: The united states covid-19 forecast hub dataset. Scientific Data (2022) https://doi.org/10.1101/2021.11.04.21265886
- Zhang-James et al. [2021] Zhang-James, Y., Hess, J., Salkin, A., Wang, D., Chen, S., Winkelstein, P., Morley, C.P., Faraone, S.V.: A seq2seq model to forecast the covid-19 cases, deaths and reproductive r numbers in us counties. Research Square (2021)
- Arik et al. [2020] Arik, S., Li, C.-L., Yoon, J., Sinha, R., Epshteyn, A., Le, L., Menon, V., Singh, S., Zhang, L., Nikoltchev, M., et al.: Interpretable sequence learning for covid-19 forecasting. Advances in Neural Information Processing Systems 33, 18807–18818 (2020)
- Lucas et al. [2023] Lucas, B., Vahedi, B., Karimzadeh, M.: A spatiotemporal machine learning approach to forecasting covid-19 incidence at the county level in the usa. International Journal of Data Science and Analytics 15(3), 247–266 (2023)
- Le et al. [2020] Le, M., Ibrahim, M., Sagun, L., Lacroix, T., Nickel, M.: Neural relational autoregression for high-resolution covid-19 forecasting. Facebook AI Research (2020)
- Pei and Shaman [2020] Pei, S., Shaman, J.: Initial simulation of sars-cov2 spread and intervention effects in the continental us. MedRxiv, 2020–03 (2020)
- Zou et al. [2020] Zou, D., Wang, L., Xu, P., Chen, J., Zhang, W., Gu, Q.: Epidemic model guided machine learning for covid-19 forecasts in the united states. MedRxiv, 2020–05 (2020)
- Chiang et al. [2020] Chiang, W.-H., Liu, X., Mohler, G.: Hawkes process modeling of covid-19 with mobility leading indicators and spatial covariates (preprint) (2020)
- Galasso et al. [2022] Galasso, J., Cao, D.M., Hochberg, R.: A random forest model for forecasting regional covid-19 cases utilizing reproduction number estimates and demographic data. Chaos, Solitons & Fractals 156, 111779 (2022)
- Adiga et al. [2023] Adiga, A., Kaur, G., Wang, L., Hurt, B., Porebski, P., Venkatramanan, S., Lewis, B., Marathe, M.V.: Phase-informed bayesian ensemble models improve performance of covid-19 forecasts. In: Proceedings of the AAAI Conference on Artificial Intelligence, vol. 37, pp. 15647–15653 (2023)
- Vieira et al. [2010] Vieira, M.R., Frias-Martinez, E., Bakalov, P., Frias-Martinez, V., Tsotras, V.J.: Querying spatio-temporal patterns in mobile phone-call databases. In: 2010 Eleventh International Conference on Mobile Data Management, pp. 239–248 (2010). IEEE
- Hernandez et al. [2017] Hernandez, M., Hong, L., Frias-Martinez, V., Whitby, A., Frias-Martinez, E.: Estimating poverty using cell phone data: evidence from guatemala. World Bank Policy Research Working Paper (7969) (2017)
- Frias-Martinez and Virseda [2013] Frias-Martinez, V., Virseda, J.: Cell phone analytics: Scaling human behavior studies into the millions. Information Technologies & International Development 9(2), 35 (2013)
- Rubio et al. [2010] Rubio, A., Frias-Martinez, V., Frias-Martinez, E., Oliver, N.: Human mobility in advanced and developing economies: A comparative analysis. In: 2010 AAAI Spring Symposium Series (2010)
- Wu et al. [2021] Wu, J., Frias-Martinez, E., Frias-Martinez, V.: Spatial sensitivity analysis for urban hotspots using cell phone traces. Environment and Planning B: Urban Analytics and City Science (2021)
- Frias-Martinez et al. [2010] Frias-Martinez, V., Virseda, J., Frias-Martinez, E.: Socio-economic levels and human mobility. In: Qual Meets Quant workshop-QMQ, pp. 1–6 (2010)
- Fu et al. [2018] Fu, C., McKenzie, G., Frias-Martinez, V., Stewart, K.: Identifying spatiotemporal urban activities through linguistic signatures. Computers, Environment and Urban Systems 72, 25–37 (2018)
- Frias-Martinez et al. [2012] Frias-Martinez, V., Virseda, J., Gomero, A.: Mobilizing education: evaluation of a mobile learning tool in a low-income school. In: Proceedings of the 14th International Conference on Human-computer Interaction with Mobile Devices and Services, pp. 441–450 (2012)
- Hong et al. [2016] Hong, L., Frias-Martinez, E., Frias-Martinez, V.: Topic models to infer socio-economic maps. In: Proceedings of the AAAI Conference on Artificial Intelligence, vol. 30 (2016)
- Frias-Martinez et al. [2012] Frias-Martinez, V., Soto, V., Virseda, J., Frias-Martinez, E.: Computing cost-effective census maps from cell phone traces. In: Workshop on Pervasive Urban Applications (2012)
- Wu et al. [2022] Wu, J., Abrar, S.M., Awasthi, N., Frias-Martinez, E., Frias-Martinez, V.: Enhancing short-term crime prediction with human mobility flows and deep learning architectures. EPJ Data Science 11(1), 53 (2022)
- Wu et al. [2023] Wu, J., Abrar, S.M., Awasthi, N., Frías-Martínez, V.: Auditing the fairness of place-based crime prediction models implemented with deep learning approaches. Computers, Environment and Urban Systems 102, 101967 (2023)
- Wesolowski et al. [2012] Wesolowski, A., Eagle, N., Tatem, A.J., Smith, D.L., Noor, A.M., Snow, R.W., Buckee, C.O.: Quantifying the impact of human mobility on malaria. Science 338(6104), 267–270 (2012)
- Bengtsson et al. [2015] Bengtsson, L., Gaudart, J., Lu, X., Moore, S., Wetter, E., Sallah, K., Rebaudet, S., Piarroux, R.: Using mobile phone data to predict the spatial spread of cholera. Scientific reports 5(1), 1–5 (2015)
- Hong et al. [2017] Hong, L., Fu, C., Torrens, P., Frias-Martinez, V.: Understanding citizens’ and local governments’ digital communications during natural disasters: the case of snowstorms. In: Proceedings of the 2017 ACM on Web Science Conference, pp. 141–150 (2017)
- Isaacman et al. [2018] Isaacman, S., Frias-Martinez, V., Frias-Martinez, E.: Modeling human migration patterns during drought conditions in la guajira, colombia. In: Proceedings of the 1st ACM SIGCAS Conference on Computing and Sustainable Societies, pp. 1–9 (2018)
- Ghurye et al. [2016] Ghurye, J., Krings, G., Frias-Martinez, V.: A framework to model human behavior at large scale during natural disasters. In: 2016 17th IEEE International Conference on Mobile Data Management (MDM), vol. 1, pp. 18–27 (2016). IEEE
- Hong and Frias-Martinez [2020] Hong, L., Frias-Martinez, V.: Modeling and predicting evacuation flows during hurricane irma. EPJ Data Science 9(1), 29 (2020)
- Badr and Gardner [2021] Badr, H.S., Gardner, L.M.: Limitations of using mobile phone data to model covid-19 transmission in the usa. The Lancet Infectious Diseases 21(5), 113 (2021)
- Tsai et al. [2022] Tsai, T.C., Arik, S., Jacobson, B.H., Yoon, J., Yoder, N., Sava, D., Mitchell, M., Graham, G., Pfister, T.: Algorithmic fairness in pandemic forecasting: lessons from covid-19. NPJ Digital Medicine 5(1), 59 (2022)
- Yang et al. [2023] Yang, J., Soltan, A.A., Eyre, D.W., Clifton, D.A.: Algorithmic fairness and bias mitigation for clinical machine learning with deep reinforcement learning. Nature Machine Intelligence 5(8), 884–894 (2023)
- Agarwal et al. [2019] Agarwal, A., Dudík, M., Wu, Z.S.: Fair regression: Quantitative definitions and reduction-based algorithms. In: International Conference on Machine Learning, pp. 120–129 (2019). PMLR
- Calders et al. [2013] Calders, T., Karim, A., Kamiran, F., Ali, W., Zhang, X.: Controlling attribute effect in linear regression. In: 2013 IEEE 13th International Conference on Data Mining, pp. 71–80 (2013). IEEE
- Chzhen et al. [2020] Chzhen, E., Denis, C., Hebiri, M., Oneto, L., Pontil, M.: Fair regression with wasserstein barycenters. Advances in Neural Information Processing Systems 33, 7321–7331 (2020)
- Si et al. [2021] Si, N., Murthy, K., Blanchet, J., Nguyen, V.A.: Testing group fairness via optimal transport projections. In: International Conference on Machine Learning, pp. 9649–9659 (2021). PMLR
- Gursoy and Kakadiaris [2022] Gursoy, F., Kakadiaris, I.A.: Error parity fairness: Testing for group fairness in regression tasks. arXiv preprint arXiv:2208.08279 (2022)
- Taskesen et al. [2021] Taskesen, B., Blanchet, J., Kuhn, D., Nguyen, V.A.: A statistical test for probabilistic fairness. In: Proceedings of the 2021 ACM Conference on Fairness, Accountability, and Transparency, pp. 648–665 (2021)
- Blanchet et al. [2021] Blanchet, J., Murthy, K., Nguyen, V.A.: Statistical analysis of wasserstein distributionally robust estimators. In: Tutorials in Operations Research: Emerging Optimization Methods and Modeling Techniques with Applications, pp. 227–254. INFORMS, ??? (2021)
- Tramer et al. [2017] Tramer, F., Atlidakis, V., Geambasu, R., Hsu, D., Hubaux, J.-P., Humbert, M., Juels, A., Lin, H.: Fairtest: Discovering unwarranted associations in data-driven applications. In: 2017 IEEE European Symposium on Security and Privacy (EuroS&P), pp. 401–416 (2017). IEEE
- Dong et al. [2020] Dong, E., Du, H., Gardner, L.: An interactive web-based dashboard to track covid-19 in real time. The Lancet infectious diseases 20(5), 533–534 (2020)
- CDC [2023] CDC: CDC National Center for Health Statistics: Urban-Rural Classification Scheme for Counties. https://www.cdc.gov/nchs/data_access/urban_rural.htm#2013_Urban-Rural_Classification_Scheme_for_Counties (2023)
- Starke et al. [2021] Starke, K.R., Reissig, D., Petereit-Haack, G., Schmauder, S., Nienhaus, A., Seidler, A.: The isolated effect of age on the risk of covid-19 severe outcomes: a systematic review with meta-analysis. BMJ global health 6(12), 006434 (2021)
- Meza et al. [2021] Meza, D., Khuder, B., Bailey, J.I., Rosenberg, S.R., Kalhan, R., Reyfman, P.A.: Mortality from covid-19 in patients with copd: A us study in the n3c data enclave. International Journal of Chronic Obstructive Pulmonary Disease, 2323–2326 (2021)
- CDC [2023] CDC: County-level estimates of COPD. https://www.cdc.gov/copd/data-and-statistics/county-estimates.html (2023)
- Nikparvar et al. [2021] Nikparvar, B., Rahman, M.M., Hatami, F., Thill, J.-C.: Spatio-temporal prediction of the covid-19 pandemic in us counties: modeling with a deep lstm neural network. Scientific reports 11(1), 21715 (2021)
- Castelnovo et al. [2022] Castelnovo, A., Crupi, R., Greco, G., Regoli, D., Penco, I.G., Cosentini, A.C.: A clarification of the nuances in the fairness metrics landscape. Scientific Reports 12(1), 4209 (2022)
Appendix A
An appendix contains supplementary information that is not an essential part of the text itself but which may be helpful in providing a more comprehensive understanding of the research problem or it is information that is too cumbersome to be included in the body of the paper.
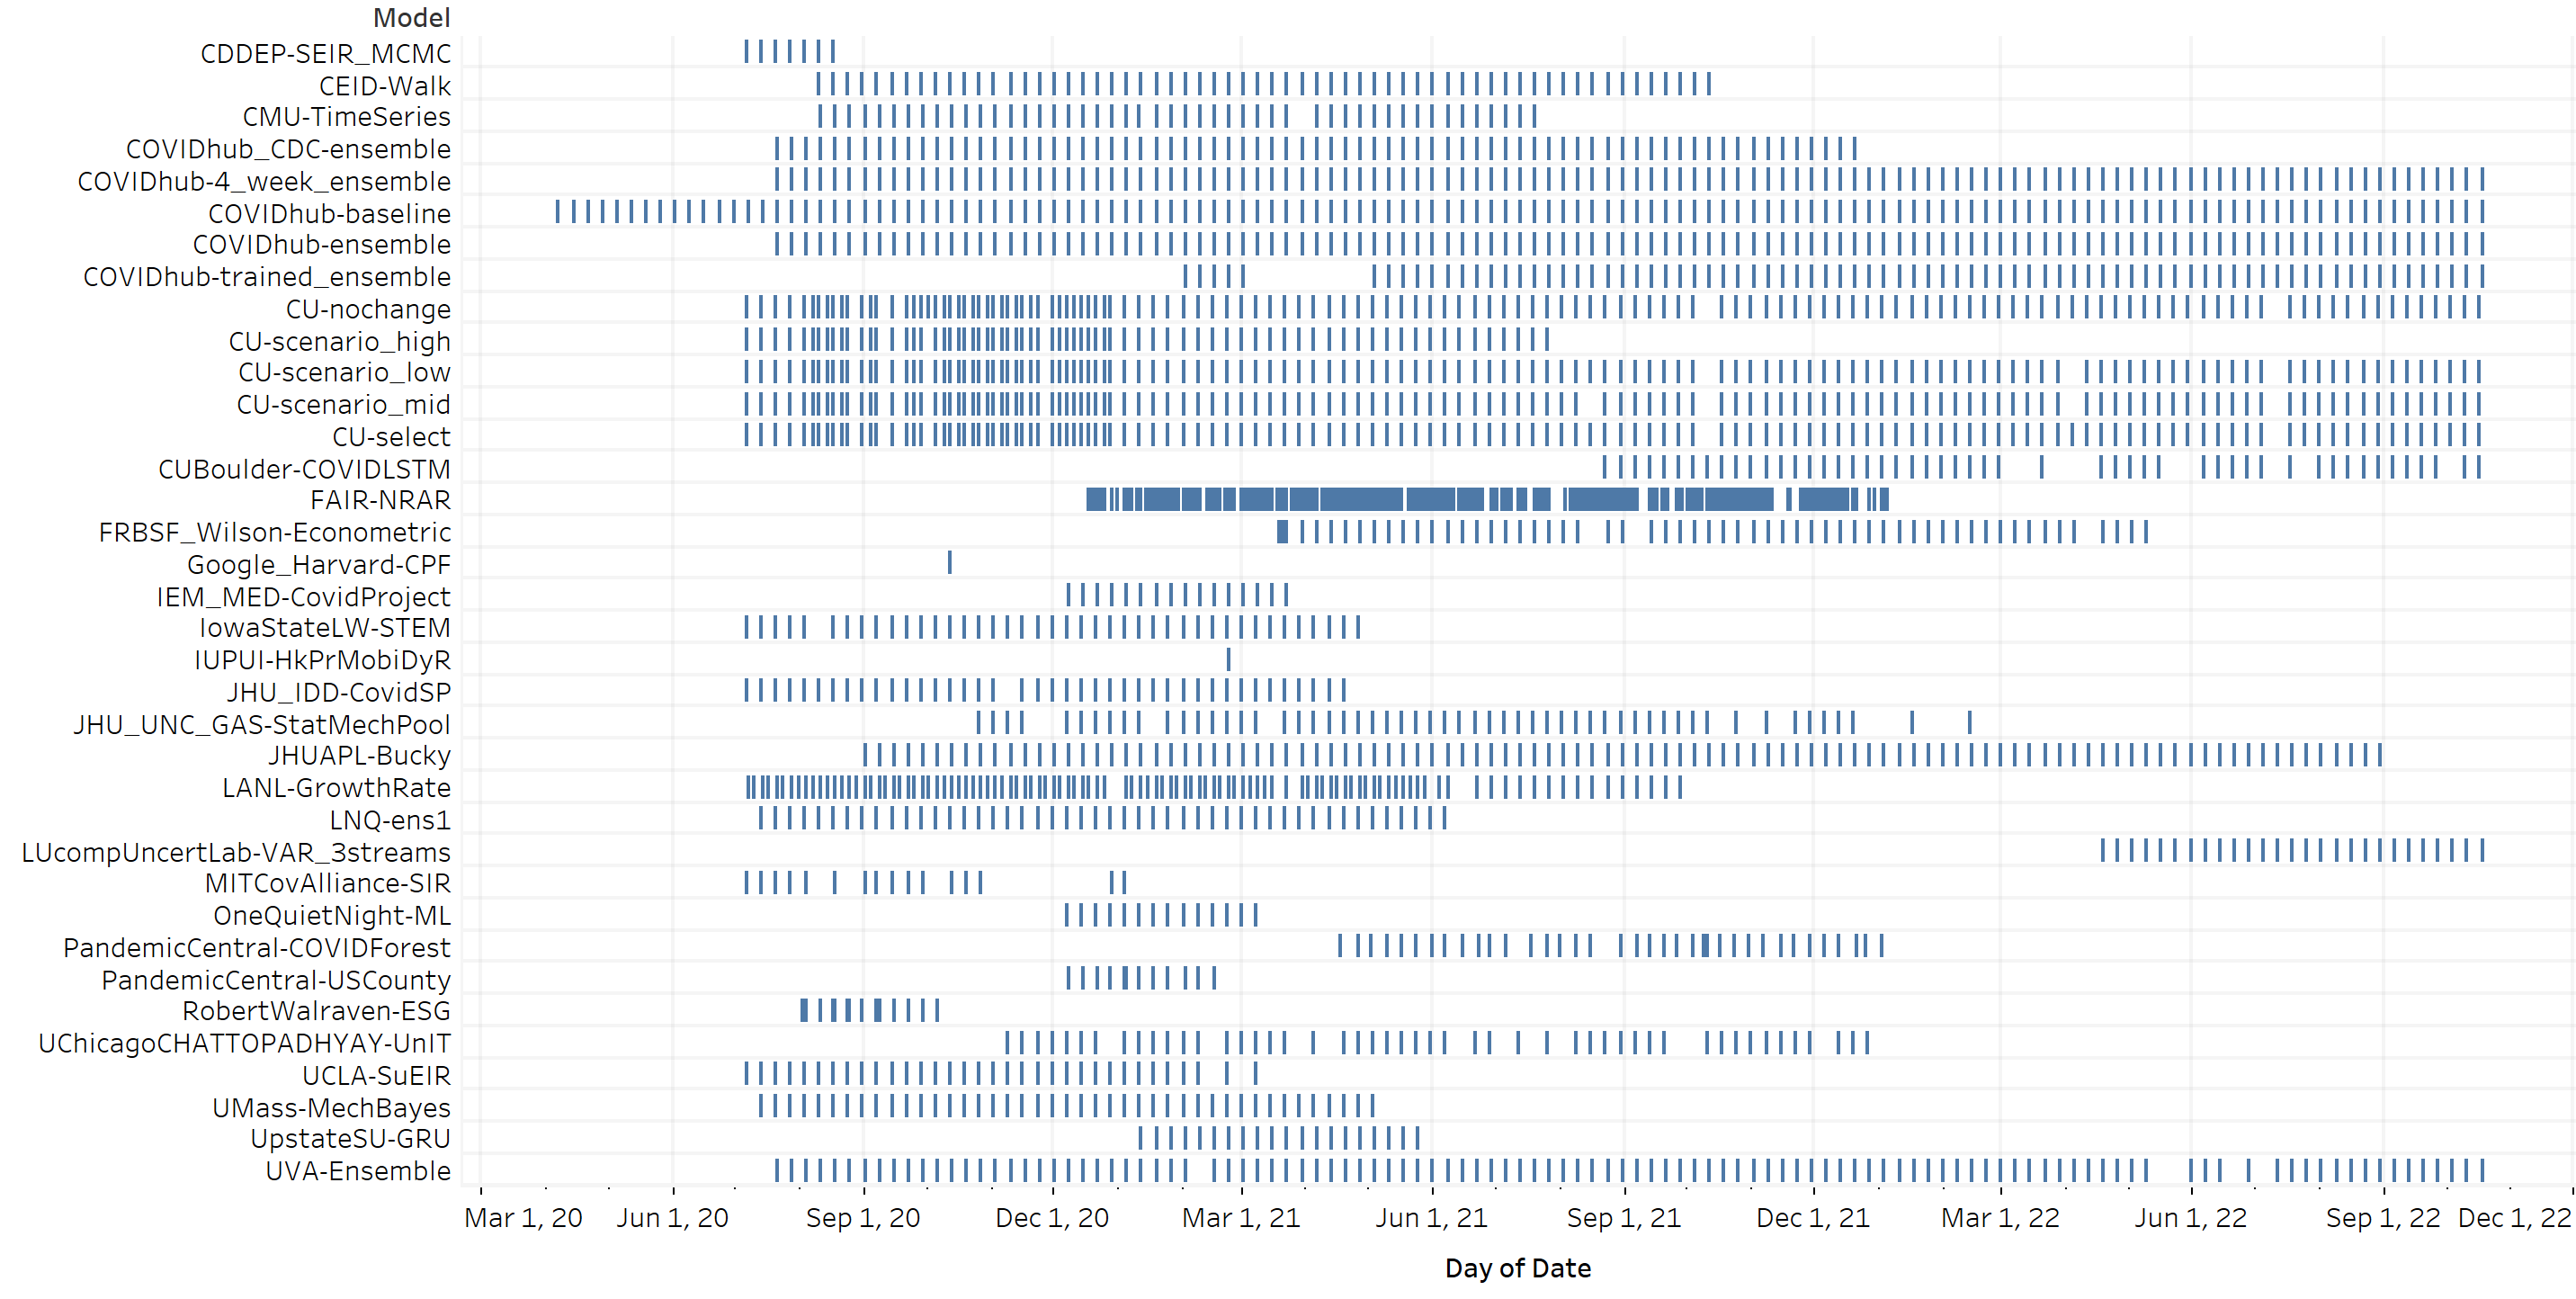
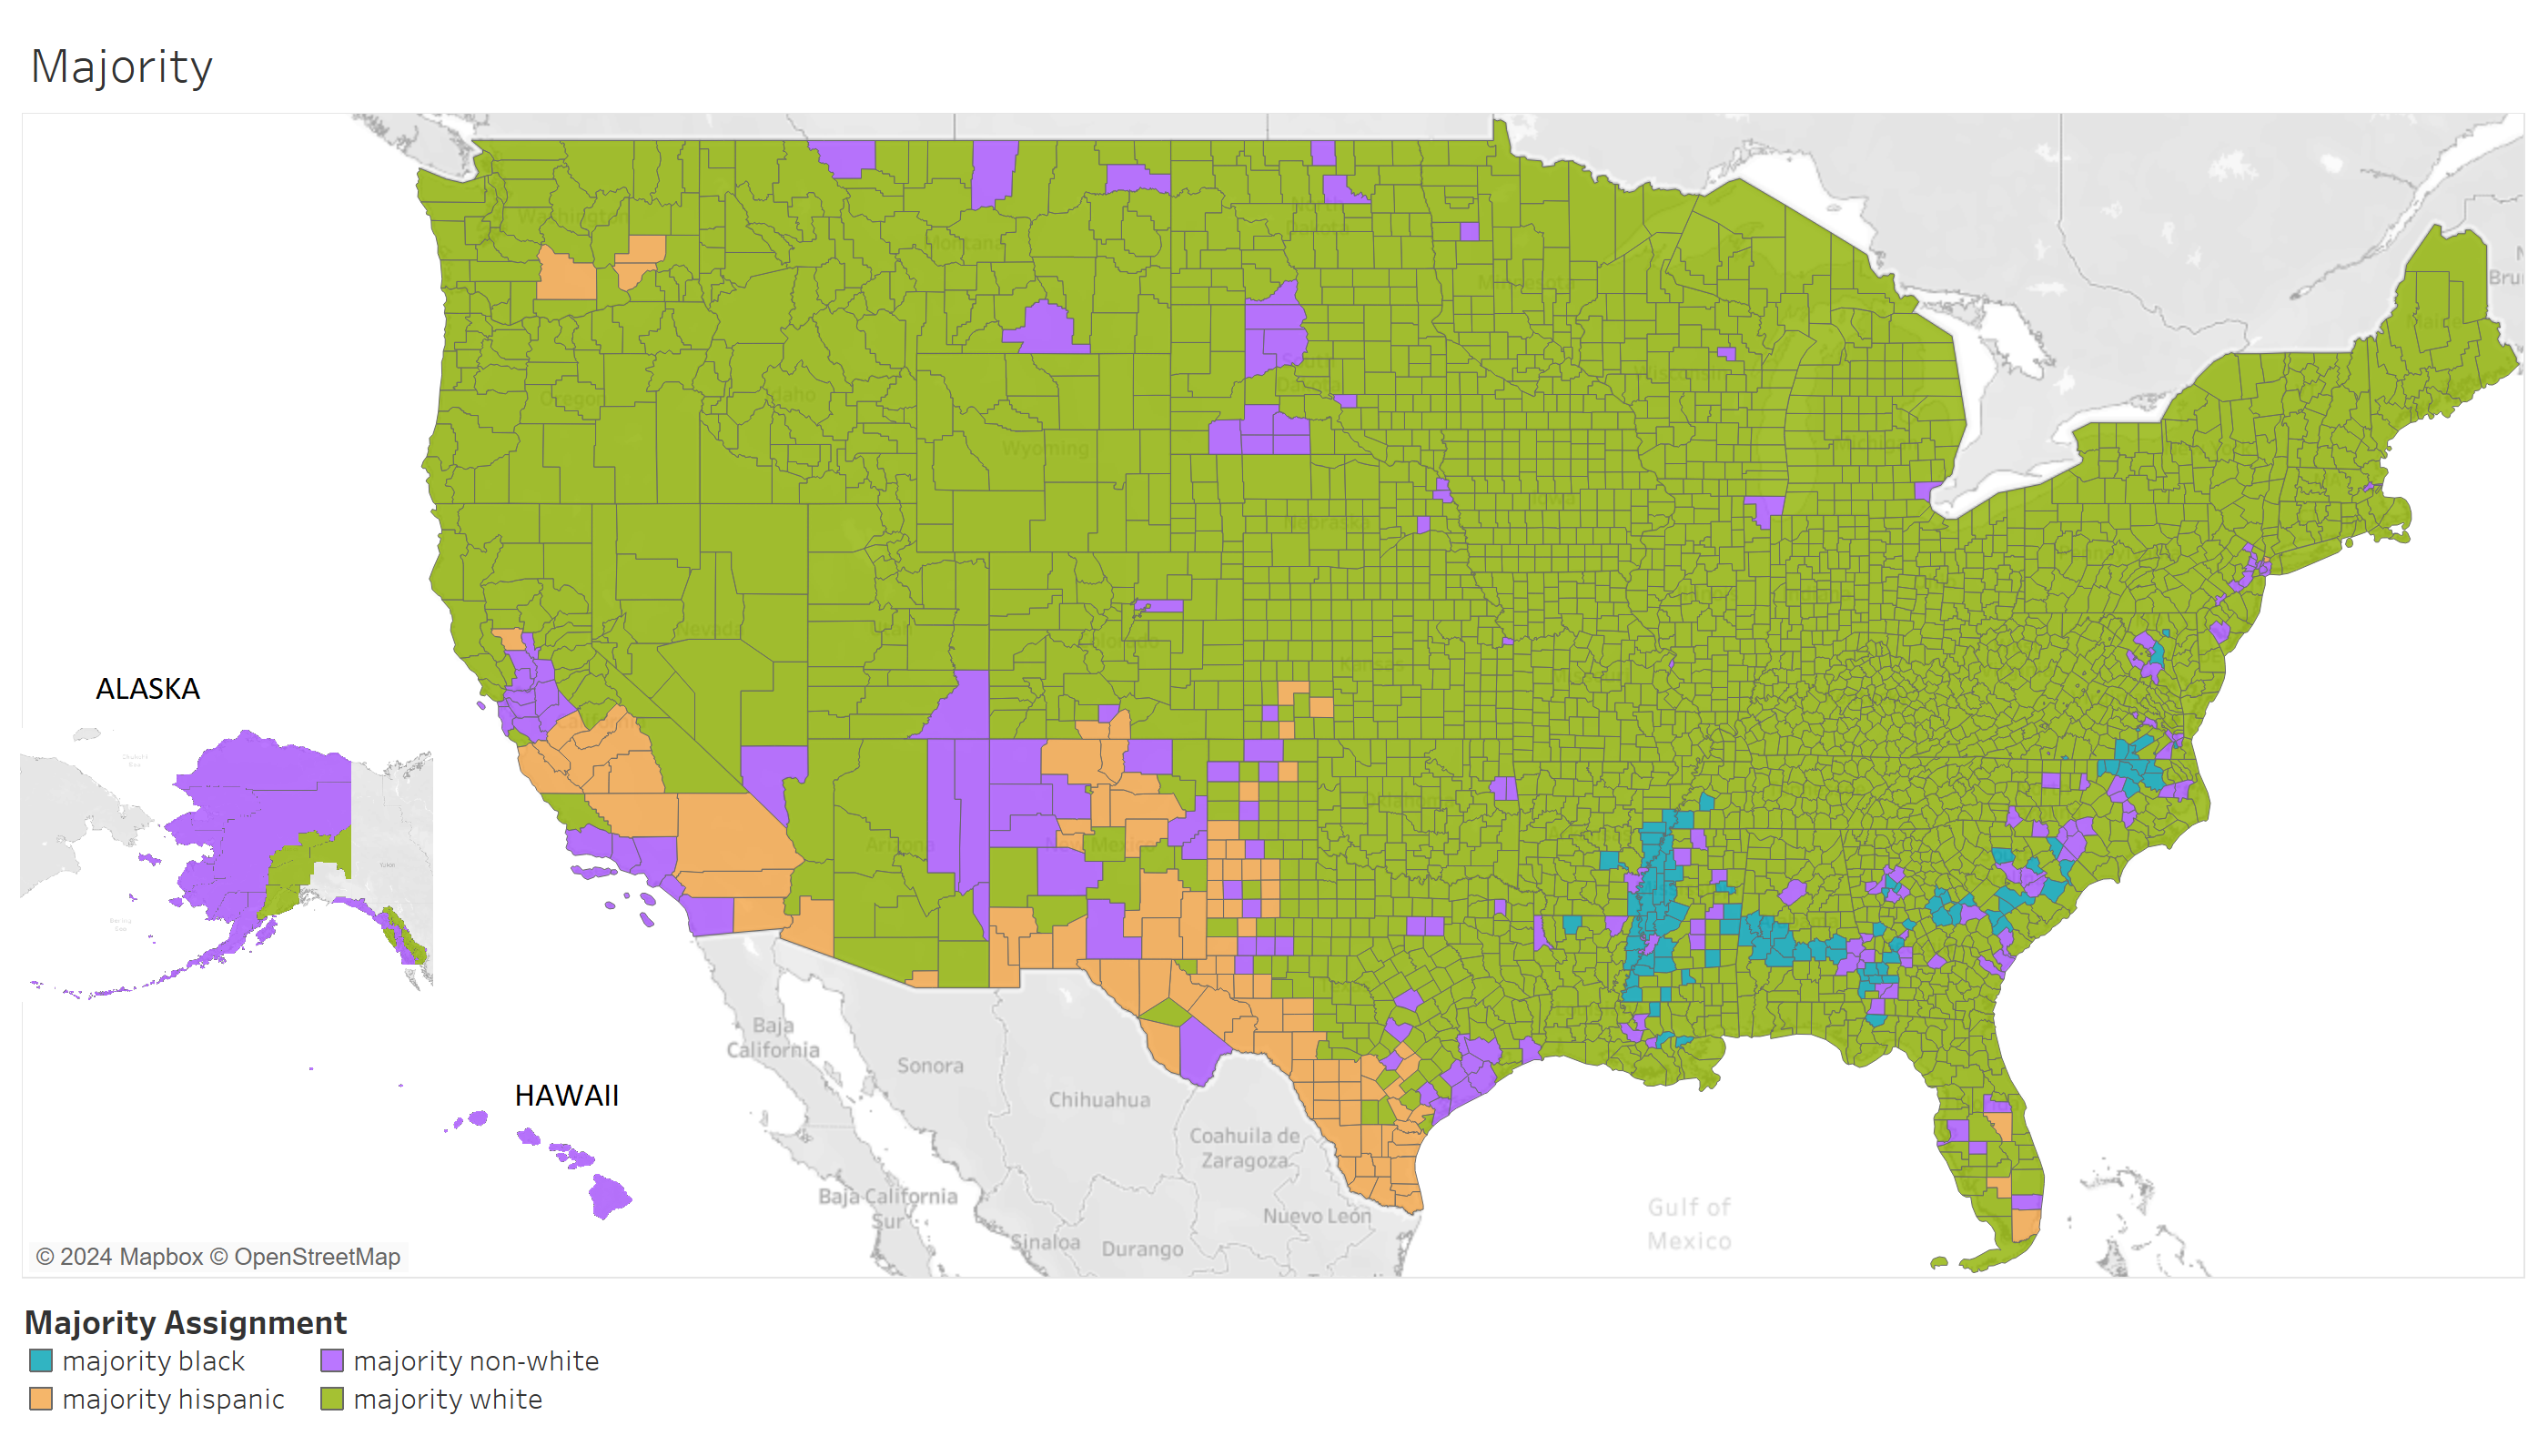
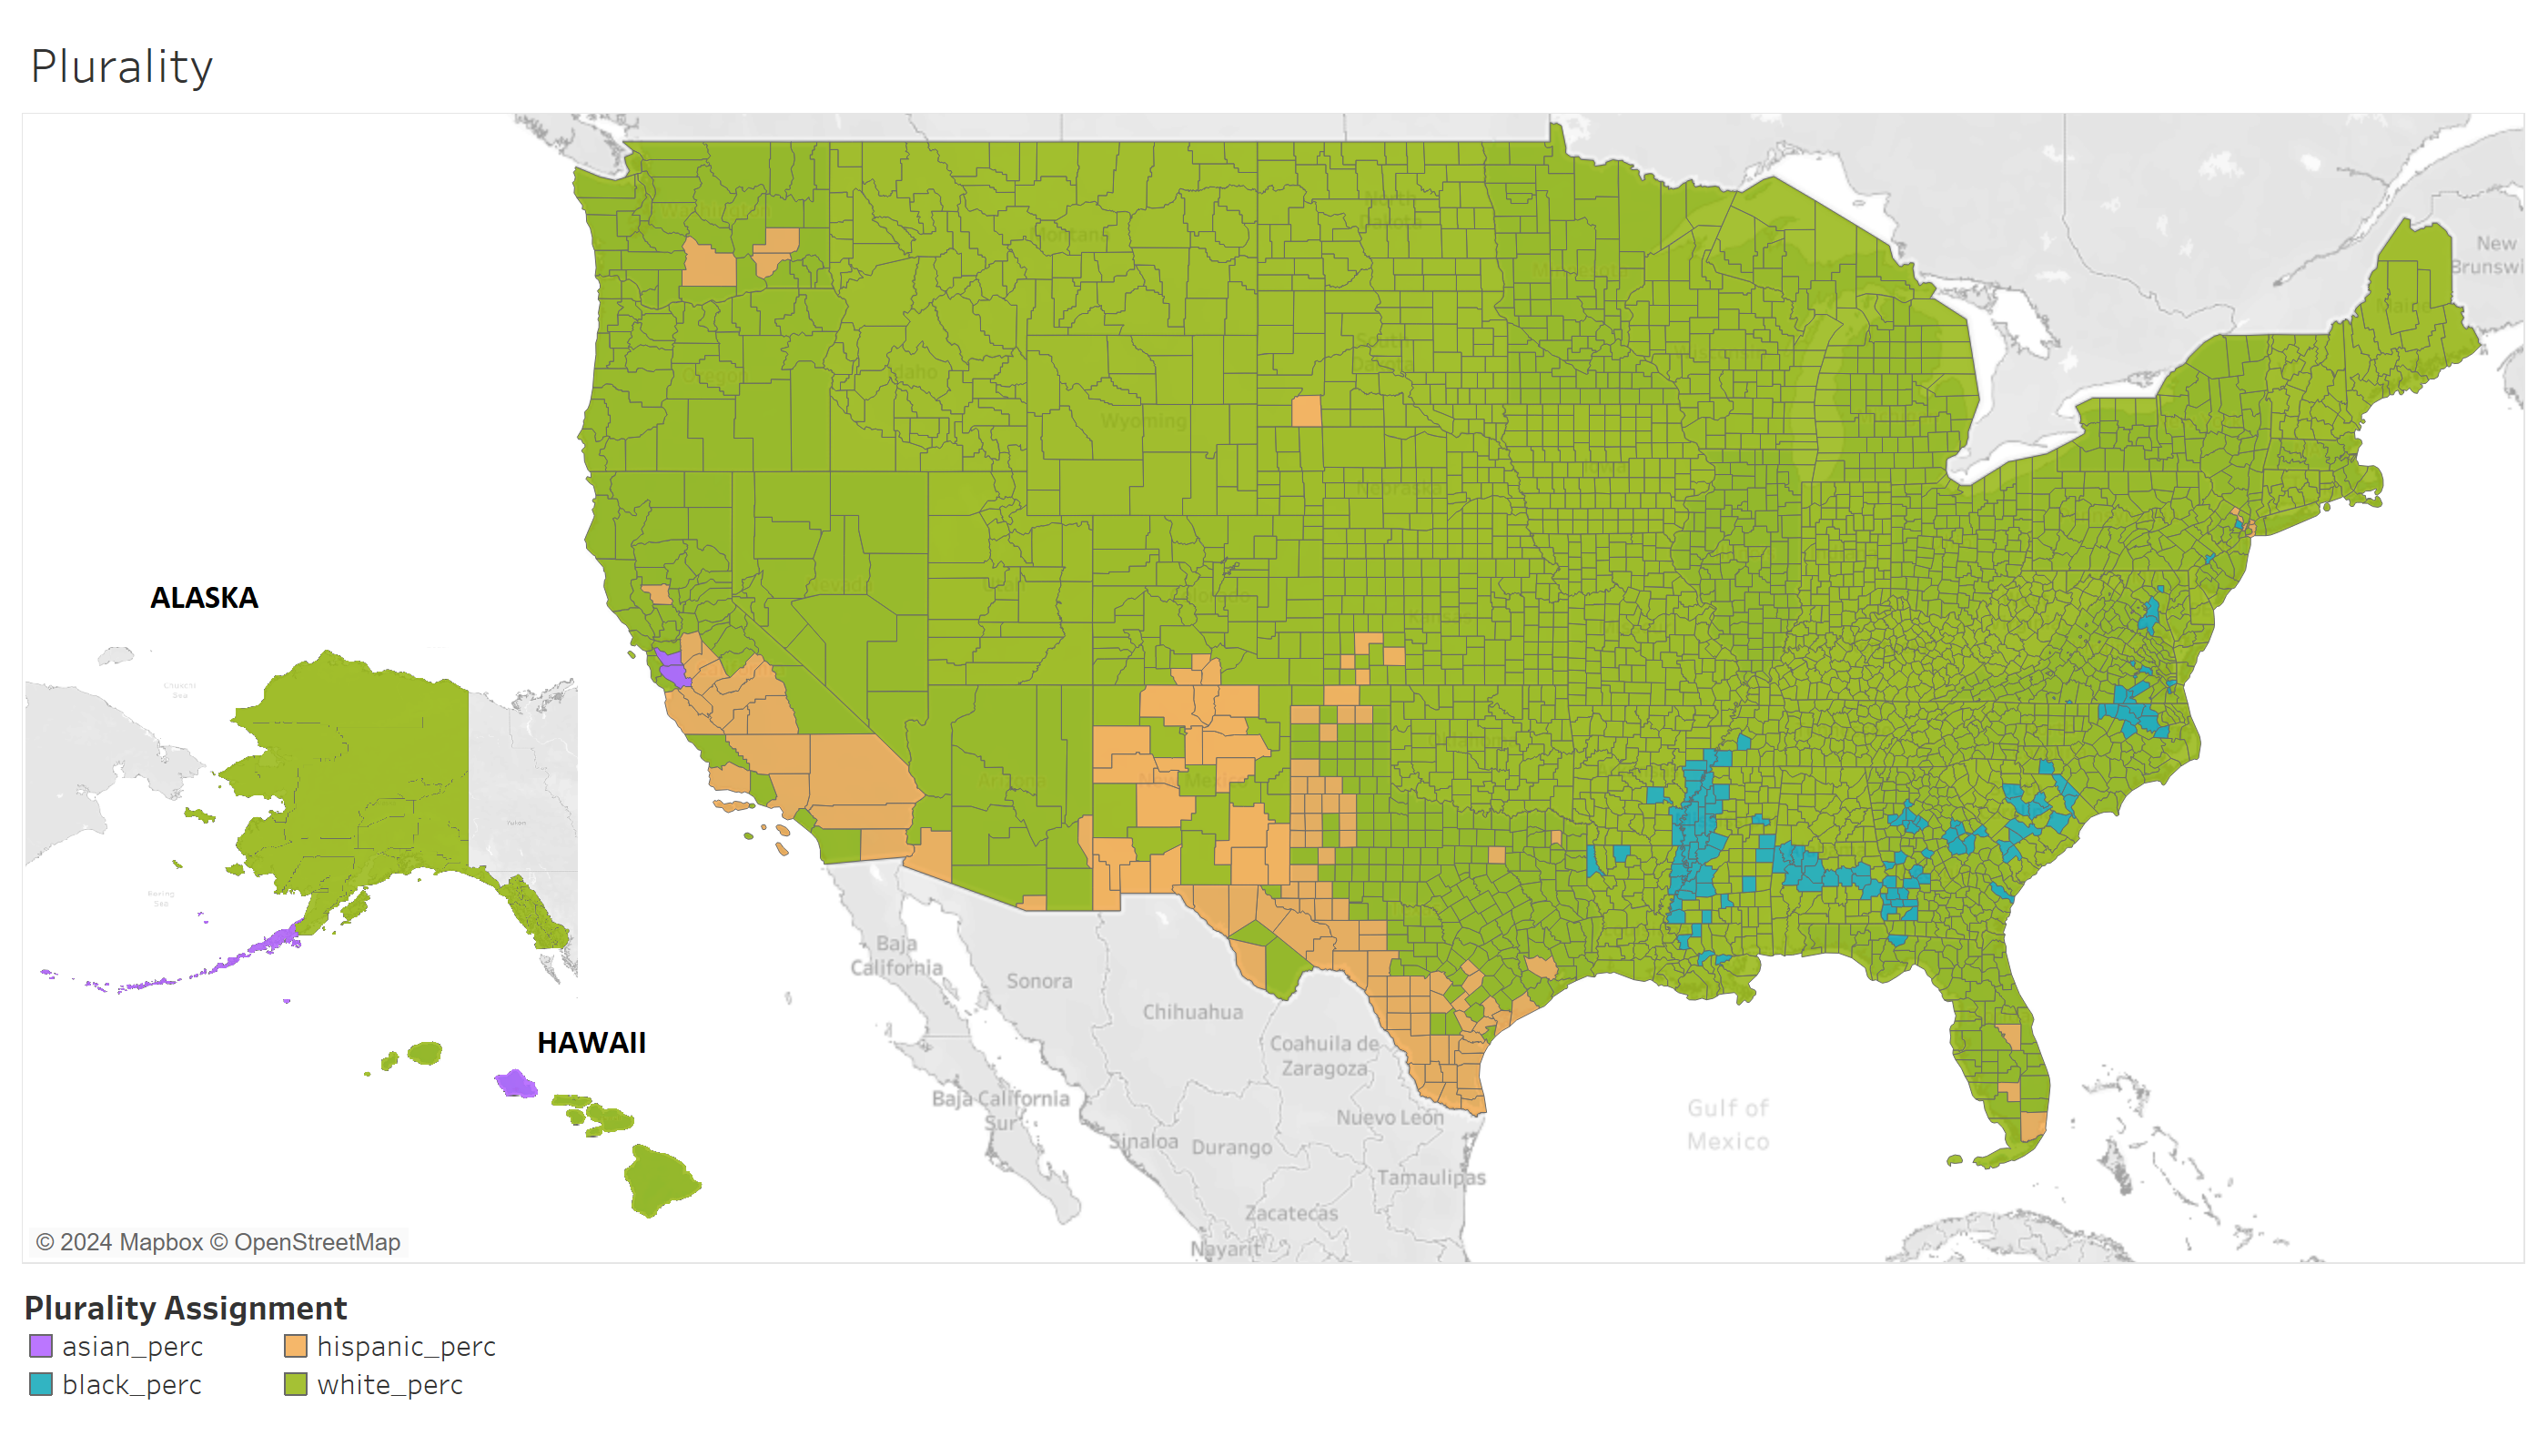
| Model Name | Model Type | Mobility Used? |
|---|---|---|
| CU-nochange | Compartmental | Yes (Census) |
| CMU-TimeSeries | Statistical | No |
| COVIDhub_CDC-ensemble | Ensemble | Not Applicable |
| COVIDhub-trained_ensemble | Ensemble | Not Applicable |
| COVIDhub-ensemble | Ensemble | Not Applicable |
| IEM_MED-CovidProject | Compartmental | No |
| LNQ-ens1 | Ensemble | No |
| JHU_IDD-CovidSP | Compartmental | No |
| CUBoulder-COVIDLSTM | Deep Learning | Yes (Facebook) |
| Google_Harvard-CPF | Deep Learning | Yes (Descartes Labs) |
| FRBSF_Wilson-Econometric | Compartmental | Yes (Google and Safegraph) |
| UMass-MechBayes | Statistical | No |
| LANL-GrowthRate | Compartmental | No |
| UCLA-SuEIR | Compartmental | No |
| COVIDhub-4_week_ensemble | Ensemble | Not Applicable |
| CEID-Walk | Statistical | No |
| RobertWalraven-ESG | Statistical | No |
| OneQuietNight-ML | Statistical | Yes(Apple, Google) |
| CU-scenario_high | Compartmental | Yes (Census) |
| IUPUI-HkPrMobiDyR | Statistical | Yes (Google) |
| CDDEP-SEIR_MCMC | Compartmental | No |
| UpstateSU-GRU | Deep Learning | Yes (Google) |
| CU-scenario_mid | Compartmental | Yes (Census) |
| CU-scenario_low | Compartmental | Yes (Census) |
| UChicagoCHATTOPADHYAY-UnIT | Statistical | No |
| PandemicCentral-USCounty | Statistical | Yes (Facebook) |
| JHUAPL-Bucky | Compartmental | Yes (Safegraph) |
| COVIDhub-baseline | Baseline Models | Not Applicable |
| PandemicCentral-COVIDForest | Statistical | Yes (Facebook) |
| LUcompUncertLab-VAR_3streams | Statistical | No |
| FAIR-NRAR | Deep Learning | Yes (Facebook, Google) |
| JHU_UNC_GAS-StatMechPool | Ensemble | Yes |
| CU-select | Compartmental | Yes (Census) |
| IowaStateLW-STEM | Compartmental | Yes (Descartes Labs, US DOT) |
| MITCovAlliance-SIR | Compartmental | Yes (Safegraph) |
| UVA-Ensemble | Ensemble | Yes |
| Majority | Count |
|---|---|
| Black | 95 |
| Hispanic | 106 |
| Non-white | 198 |
| White | 2745 |
| Plurality | Count |
|---|---|
| Asian | 6 |
| Hispanic | 128 |
| Black | 129 |
| White | 2879 |
| Urban-Rural Code | Count |
|---|---|
| 1 (Large central metro) | 68 |
| 2 (Large fringe metro) | 368 |
| 3 (Medium metro) | 372 |
| 4 (Small metro) | 358 |
| 5 (Micropolitan) | 641 |
| 6 (Non-core) | 1335 |