Cost-Optimal Microservices Deployment
with Cluster Autoscaling and Spot Pricing
Abstract
Microservices architecture has been established as an ideal software architecture for cloud-based software development and deployment, offering many benefits such as agility and efficiency. Microservices are often associated with containers and container orchestration systems for deployment, as containerization provides convenient tools and techniques for resource management, including the automation of orchestration processes. Among the factors that make the cloud suitable for commercial software deployment, transient pricing options like AWS Spot Pricing are particularly attractive as they allow consumers to significantly reduce cloud costs. However, the dynamic nature of resource demand and the abrupt termination of spot VMs make transient pricing challenging. Nonetheless, containerization and container orchestration systems open new avenues to optimize the cost of microservices deployments by leveraging spot pricing on the public cloud while achieving application and business goals.
We propose SpotKube, an open-source, Kubernetes-based, application-aware, genetic algorithm-based solution for cost optimization, which autoscales clusters for microservices-based applications hosted on public clouds with spot pricing options. SpotKube analyzes application characteristics and recommends the optimal configuration for resource allocation to the cluster. It consists of an elastic cluster autoscaler powered by an optimization algorithm that ensures cost-effective microservices deployment while meeting application performance requirements and handling abrupt termination of nodes, thereby minimizing the impact on system availability. We implement and evaluate SpotKube with representative microservices-based applications in a real public cloud setup, demonstrating the effectiveness of our approach against alternative optimization strategies.
Index Terms:
Microservice, Cost Optimization, Transient Pricing, Cluster AutoScalingI INTRODUCTION
Microservices architecture has gained immense popularity in recent years due to its ability to provide agility, flexibility, and efficiency to software development and deployment in the cloud environment [1]. This architectural pattern enables the creation of complex applications by breaking them down into smaller, more manageable services that can be developed, deployed, and scaled independently.
Container orchestration is an essential component when running containerized microservice workloads, as it automates much of the operational effort required to run those workloads and services. However, a cost-optimized container orchestration solution is necessary to minimize the overall financial costs for the consumer. By using transient pricing models, such as AWS Spot Pricing, which offers a dynamic pricing model, consumers can further minimize operational costs.
Optimal resource utilization is a critical factor for optimizing the costs associated with deploying microservices applications. Due to the dynamic and complex nature of these applications and the abrupt termination nature of spot VMs, achieving this optimization presents a considerable challenge. Consequently, a thorough characterization of the application, coupled with a comprehensive analysis of resource usage, is vital.
Numerous studies have focused on solving distinct use cases such as microservice application characterization, cost optimization through transient pricing models for microservice applications, and cost-optimized deployment strategies in public cloud environments. However, there exists untapped potential to develop a comprehensive framework that facilitates the deployment of microservice workloads in a public cloud environment, incorporating application characteristic analysis to deliver maximum monetary benefits to consumers via cost-optimized cluster autoscaling and transient pricing while simultaneously ensuring robust performance and gracefully handling the abrupt termination of spot instances.
As a result, we propose SpotKube, an open-source Kubernetes-managed service that optimizes the deployment cost of microservices applications. It achieves this through an application characterization tool that determines the optimal deployment configuration to meet user-defined SLOs and cost-optimized cluster autoscaling. SpotKube utilizes nodes from public cloud environments, leveraging transient pricing models such as AWS Spot Pricing to further minimize operational costs.
In this paper, we implement and evaluate SpotKube with representative microservices-based applications on a real public cloud setup. We compare the effectiveness of our approach against alternative optimization strategies and demonstrate that SpotKube significantly reduces cloud costs while ensuring that application performance requirements are met.
Key Contributions of the paper:
-
1.
Measurement driven reactive approach for cost-optimal microservices application deployment using spot instances
-
2.
An Elastic Cluster Autoscaler, powered by an optimization engine based on genetic algorithm, aims to find the optimal balance between cost and performance.
-
3.
SpotKube, an open-source Kubernetes managed service for public clouds, integrates all of the above components
The remainder of this paper is organized as follows: Section II offers an overview of related work on microservices architecture and cost optimization in public cloud environments. Section III details the SpotKube architecture, including a comprehensive explanation of its implementation. Sections IV and V present the experimental setup, followed by the results and their analysis. Section VI discusses and analyzes the key findings of SpotKube, while Section VII outlines future work and concludes the paper.
II RELATED WORKS
This section presents a comprehensive literature review on different aspects of deploying microservices-based applications in a public cloud environment in a cost-optimized manner, including application characterization, cost modeling, auto-scaling, and container scheduling.
II-A Application Characterization
Application characterization is a crucial step in deploying microservices-based applications in cloud environments. The process involves analyzing the performance of an application and identifying its optimal configurations to ensure optimal resource utilization and application performance.
Jindal et al. [2] introduced a novel tool, Terminus, which employs a methodology encompassing series of load tests to assess resource usage and calculate Microservice Capacity (MSC), defined as the maximum rate of HTTP or gRPC requests that can be served while adhering to Service Level Objectives (SLOs). One of the main drawbacks of this approach is that it can be time-consuming to conduct a series of load testing to estimate MSC.
Han et al. [3] proposed a framework for microservices placement in cloud-native computing environments that utilizes empirical profiling to identify and respond to workload characteristics. The framework involves conducting profiling experiments on selected workloads to derive delicate resource requirements and then performing microservices placement using a greedy-based heuristic algorithm that considers application performance based on the resource requirements. The proposed framework is practical and utilizes empirical profiling to identify and respond to workload characteristics, which has the potential to improve the efficiency and performance of microservices placement.
Overall, the two papers emphasize the importance of application characterization and its impact on microservices-based application deployment in cloud environments.
II-B Cost modeling
Cost modeling is required to estimate the deployment cost and identify an optimal combination of resources to deploy the microservices.
Jorn Altmann et al. [4] comprehensively analyzed the cost factors in cloud computing of federated hybrid clouds and developed a cost model consisting of a fixed cost formula, a variable cost formula, and a total cost formula.
A. Baldominos Gómez et al. [5] proposes the use of various machine learning techniques to predict the prices of Elastic Cloud Compute (EC2) spot instances offered by Amazon Web Services. The study uses two historical datasets and data extracted from the EC2 API to train separate regression models based on the instance type. The results show that forecasting performance varies significantly between instance types, with some models achieving almost perfect predictions while others barely outperform the baseline prediction of average price. The study concludes by introducing a Prediction-as-a-Service system, which is deployed in the cloud. This study only analyzes the last three months of data and the performance of the models may vary over time, yet the model has performed well for certain instance types.
II-C Auto-scaling and scheduling containers
Kubernetes is an open-source system for orchestrating and managing the lifecycle of containerized applications [6]. [7, 8, 9] propose extended components for Kubernetes to support auto-scaling and cost-optimized scheduling of containers.
Sami et al. [7] proposed an agent named FScaler, which utilizes reinforcement learning to horizontally scale the container’s instances and schedule the placement of newly created instances based on defined cost functions after studying the change in resource availability.
Rajkumar Buyya et al. [8] developed a custom scheduler, rescheduler and autoscaler as extended components for Kubernetes. The scheduler places incoming tasks on a cluster resource with at least the amount of CPU and memory resources requested by the task in an optimized manner. Then the autoscaler scale out based on the cluster’s workload to meet the resource demand and scale in to utilize the underutilized VMs to reduce the cost. The rescheduler consolidates applications into fewer VMs when possible, avoiding costly scaling-out operations or encouraging scale-in operations if the tasks can not be rescheduled.
M. Yan et al. [9] developed a tool to improve the horizontal auto-scaling policy of Kubernetes using SARSA based multi-agent parallel training module. This module predicts the task arrival rate and guarantees the assurance of SLA (Service Level Agreement). The complexity and resource usage of the task scheduling algorithm is comparatively high, which is an overhead to the overall performance.
Brandon et al. [10] introduces a Free and Open-Source Software (FOSS) solution based on Kubernetes (K8s) for autoscaling K8s worker nodes within a cluster to support dynamic workloads. The solution is based on VMware vSphere technology in a private cloud model, but it can be adapted to leverage FOSS platforms and scale into hybrid cloud architectures and edge computing.
Shridhar G. Domannal et al. [11] propose an efficient cost-optimized scheduling algorithm for a Bag of Tasks (BoT) using the Modified Particle Swarm Optimization technique. The authors present a Neural Network Based backpropagation algorithm to predict spot instances values to reduce the cost further.
Gu, Haihua, et al. [12] aim to schedule a suite of microservice tasks while minimizing the total renting cost of virtual machines from the cloud platform for a microservice-based workflow application that includes both the on-demand and the spot instances cost. The authors proposed a dynamic task scheduling heuristic algorithm (DSMT) to determine the number of VMs, the container configurations on those VMs, and the tasks allocated to the containers. Spot Instance Monitor is responsible for reallocating the tasks on the out-of-bid failure VMs to on-demand instances by considering both the rental cost and the sub-deadlines of interrupted tasks.
Bento, Araujo, Barbose, et al. [13] hss propose a method called Cost-Availability Aware Scaling (CAAS) which achieves cost savings primarily through a novel approach to scaling pods within a microservices architecture, utilizing a multi-objective optimization strategy that balances both cost and availability. They intergrated the Amdahl’s law with the Generalized Logistic Function (GLF), to model the non-linear variations in system availability in response to changes in workload and the number of replicas. By optimizing the number of pod replicas based on cost and availability, CAAS efficiently manages resource allocation, which leads to significant cost reductions compared to traditional autoscaling methods based on CPU utilization, like the Kubernetes Horizontal Pod Autoscaler (HPA).
III METHODOLOGY
III-A Overview
The underlying motivation of the proposed system is to identify the most cost-efficient and application-specific allocation of resources to a Kubernetes cluster while ensuring compliance with user-defined Service Level Objectives (SLOs) and preserving optimal application performance. Provisioning the public cloud infrastructure, characterizing the application, determining the most cost-effective allocation of resources, and dynamically scaling cluster resources based on the application requirements are significant challenges encountered by this approach. In response to these challenges, we present an architecture, as depicted in Fig 1, that addresses them effectively.
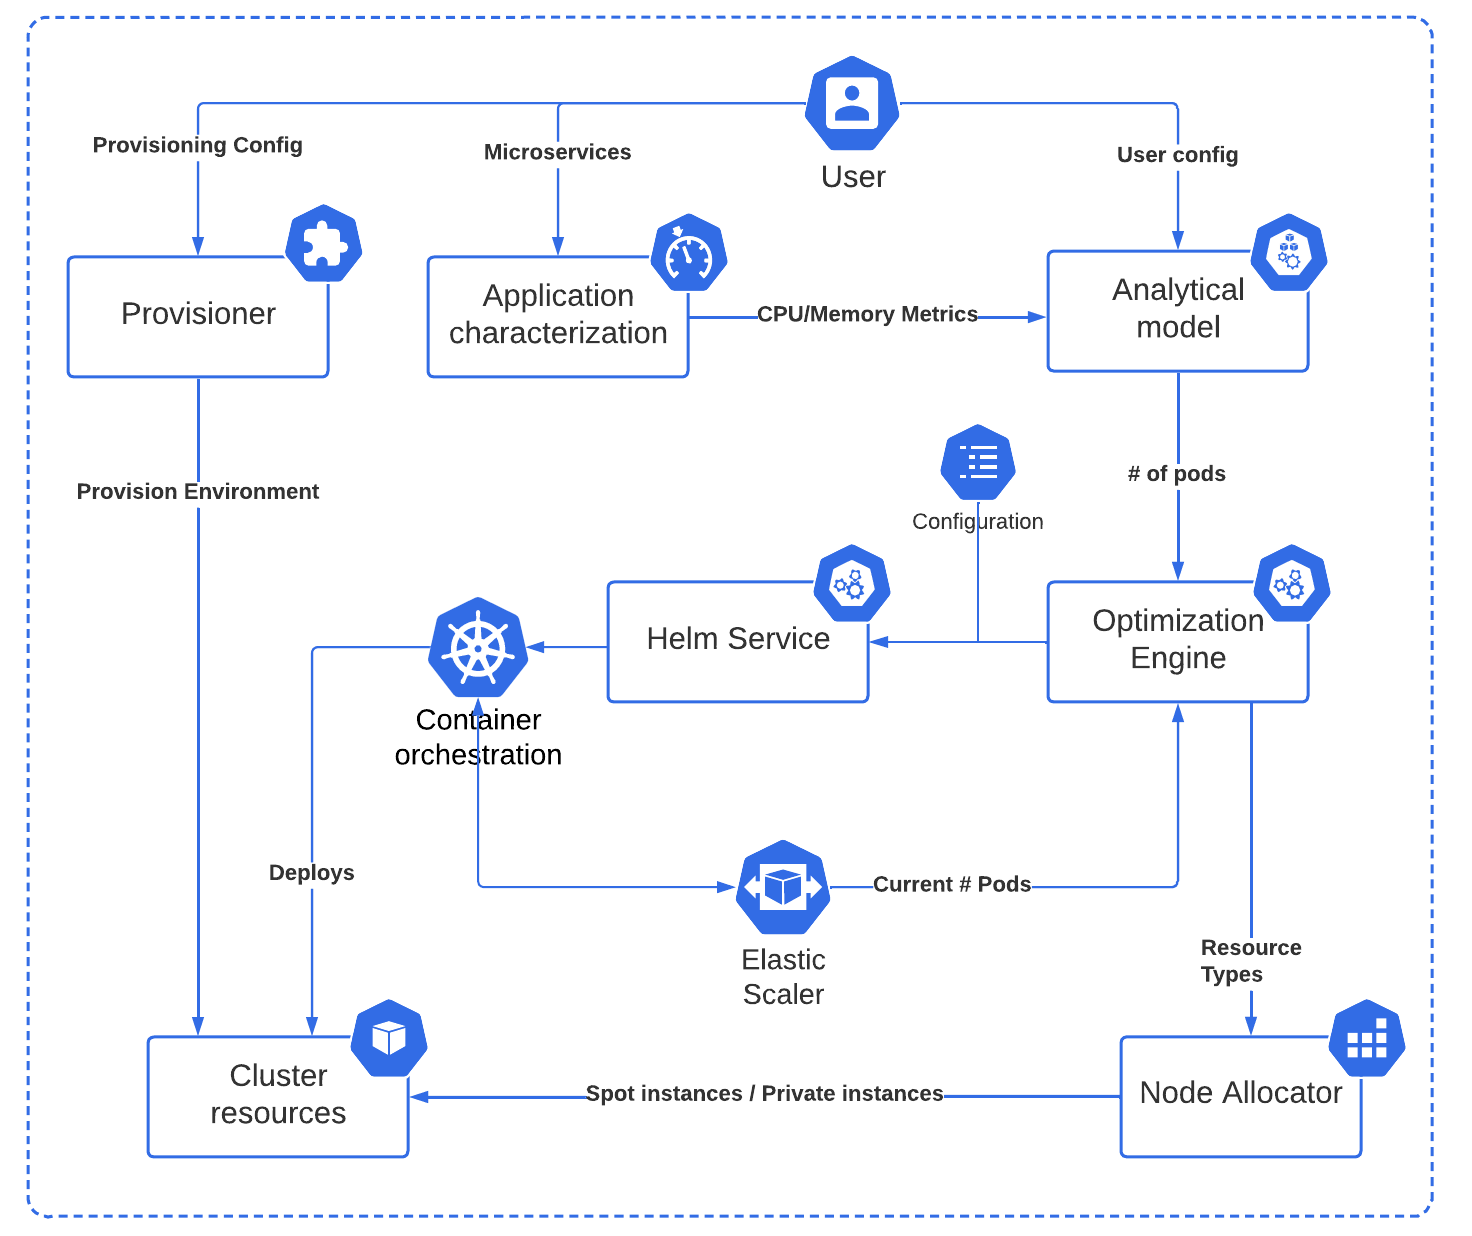
In summary, the user is required to provide three essential inputs, namely user configurations that incorporate SLOs, provisioning configurations, and a microservices application. Subsequently, the user must conduct load testing using an application characterization tool, and the results are then utilized by an analytical model to calculate the optimal number of replicas that can be deployed in the cluster while adhering to the user-defined SLOs. This replica count is subsequently utilized by the optimization engine, which determines the most cost-effective resource allocation to the cluster via the node allocator. The Helm service then deploys the application based on the configuration provided by the optimization engine. Furthermore, an elastic scaler has been implemented to facilitate the dynamic scaling of cluster resources while handling the abrupt termination of spot instances.
SpotKube can be extended to other cloud vendors and multi-cloud environments, but for demonstration purposes, we have integrated it with AWS services.
Detailed explanations of each challenge, solution, and implementation follow.
III-B Provisioning the Public Cloud Infrastructure
One of the important tasks in the SpotKube pipeline is provisioning the public cloud infrastructures based on the user-provided configuration. In order to facilitate this process, the Provisioner has been designed to automate the provisioning workflow.
Provisioner: Provisioning is a critical component of deploying microservice-based applications on public cloud, as it involves building the necessary environment in public cloud environments for deploying the microservice application and running SpotKube services. Provisioner automates this process, ensuring that the user’s configurations are implemented consistently across all public cloud environments. The provisioner is responsible for creating the necessary infrastructure, including Virtual Private Clouds (VPCs), security groups, network interfaces, and management nodes.
III-C Application Modeling
The process of application modeling represents a significant challenge due to the dynamic nature of each microservices application. In addition, it is important to note that the approach adopted by SpotKube is limited to CPU-intensive applications. In order to analyze the characteristics of the application and determine initial required number of pods (replicas) that need to be deployed, SpotKube has consist of two primary components which are Application Characterization and Analytical Model. There are certain assumptions and constraints that we used during modeling the application
Assumptions and Constraints:
-
•
Only CPU-intensive applications are considered
-
•
Only homogeneous pods are considered for deployment
-
•
Only one Service Level Objective(SLO) is considered.
-
–
Minimum number of request count that should be handled by a microservice
-
–
Application Characterization: The application characterization tool comprised multiple steps. Firstly, the microservice-based application needs to be subjected to load testing using Locust[14], a popular open-source tool that provides programmatically accessible APIs for simulating realistic user behavior and traffic patterns. Following this, CPU metrics are collected using Prometheus, and time series data are retrieved from Grafana API to capture the application’s performance characteristics.
To automate the load-testing workflow, SpotKube has provided a script that takes care of the entire process. Initially, the user deploys the microservices application using Minikube and the provided configuration, followed by running the aforementioned script. The duration of the load test is determined by the application, with the test running until the failure rate is surpass a specific threshold. Finally, the tool outputs the time series data which includes the load test results, providing insight into the application’s performance characteristics.
It is important to mention that deploying pods with the same resource limits on different instance types results in almost the same performance [2]. Hence regardless of the underneath infrastructure, load test results can be used for further analysis.
Analytical Model: By leveraging metrics collected through the application characterization tool and the user-provided configurations, the analytical model analyzes the behavior of the application. The model then determines the required number of pods that need to be deployed to the cluster, based on the Service Level Objectives (SLOs) specified by the user. Note that this pod count is the minimal number of pods that need to be initially deployed without violating the user defined SLOs.
The analytical model is composed of two key components, namely the Metric Analyzer and the Pod Calculator. The Metric Analyzer takes the metrics collected by the load test, which include CPU usage per load and failure rates. The primary objective of the Metric Analyzer is to determine the maximum load(request per seconds) that a pod can handle without any performance degradation.
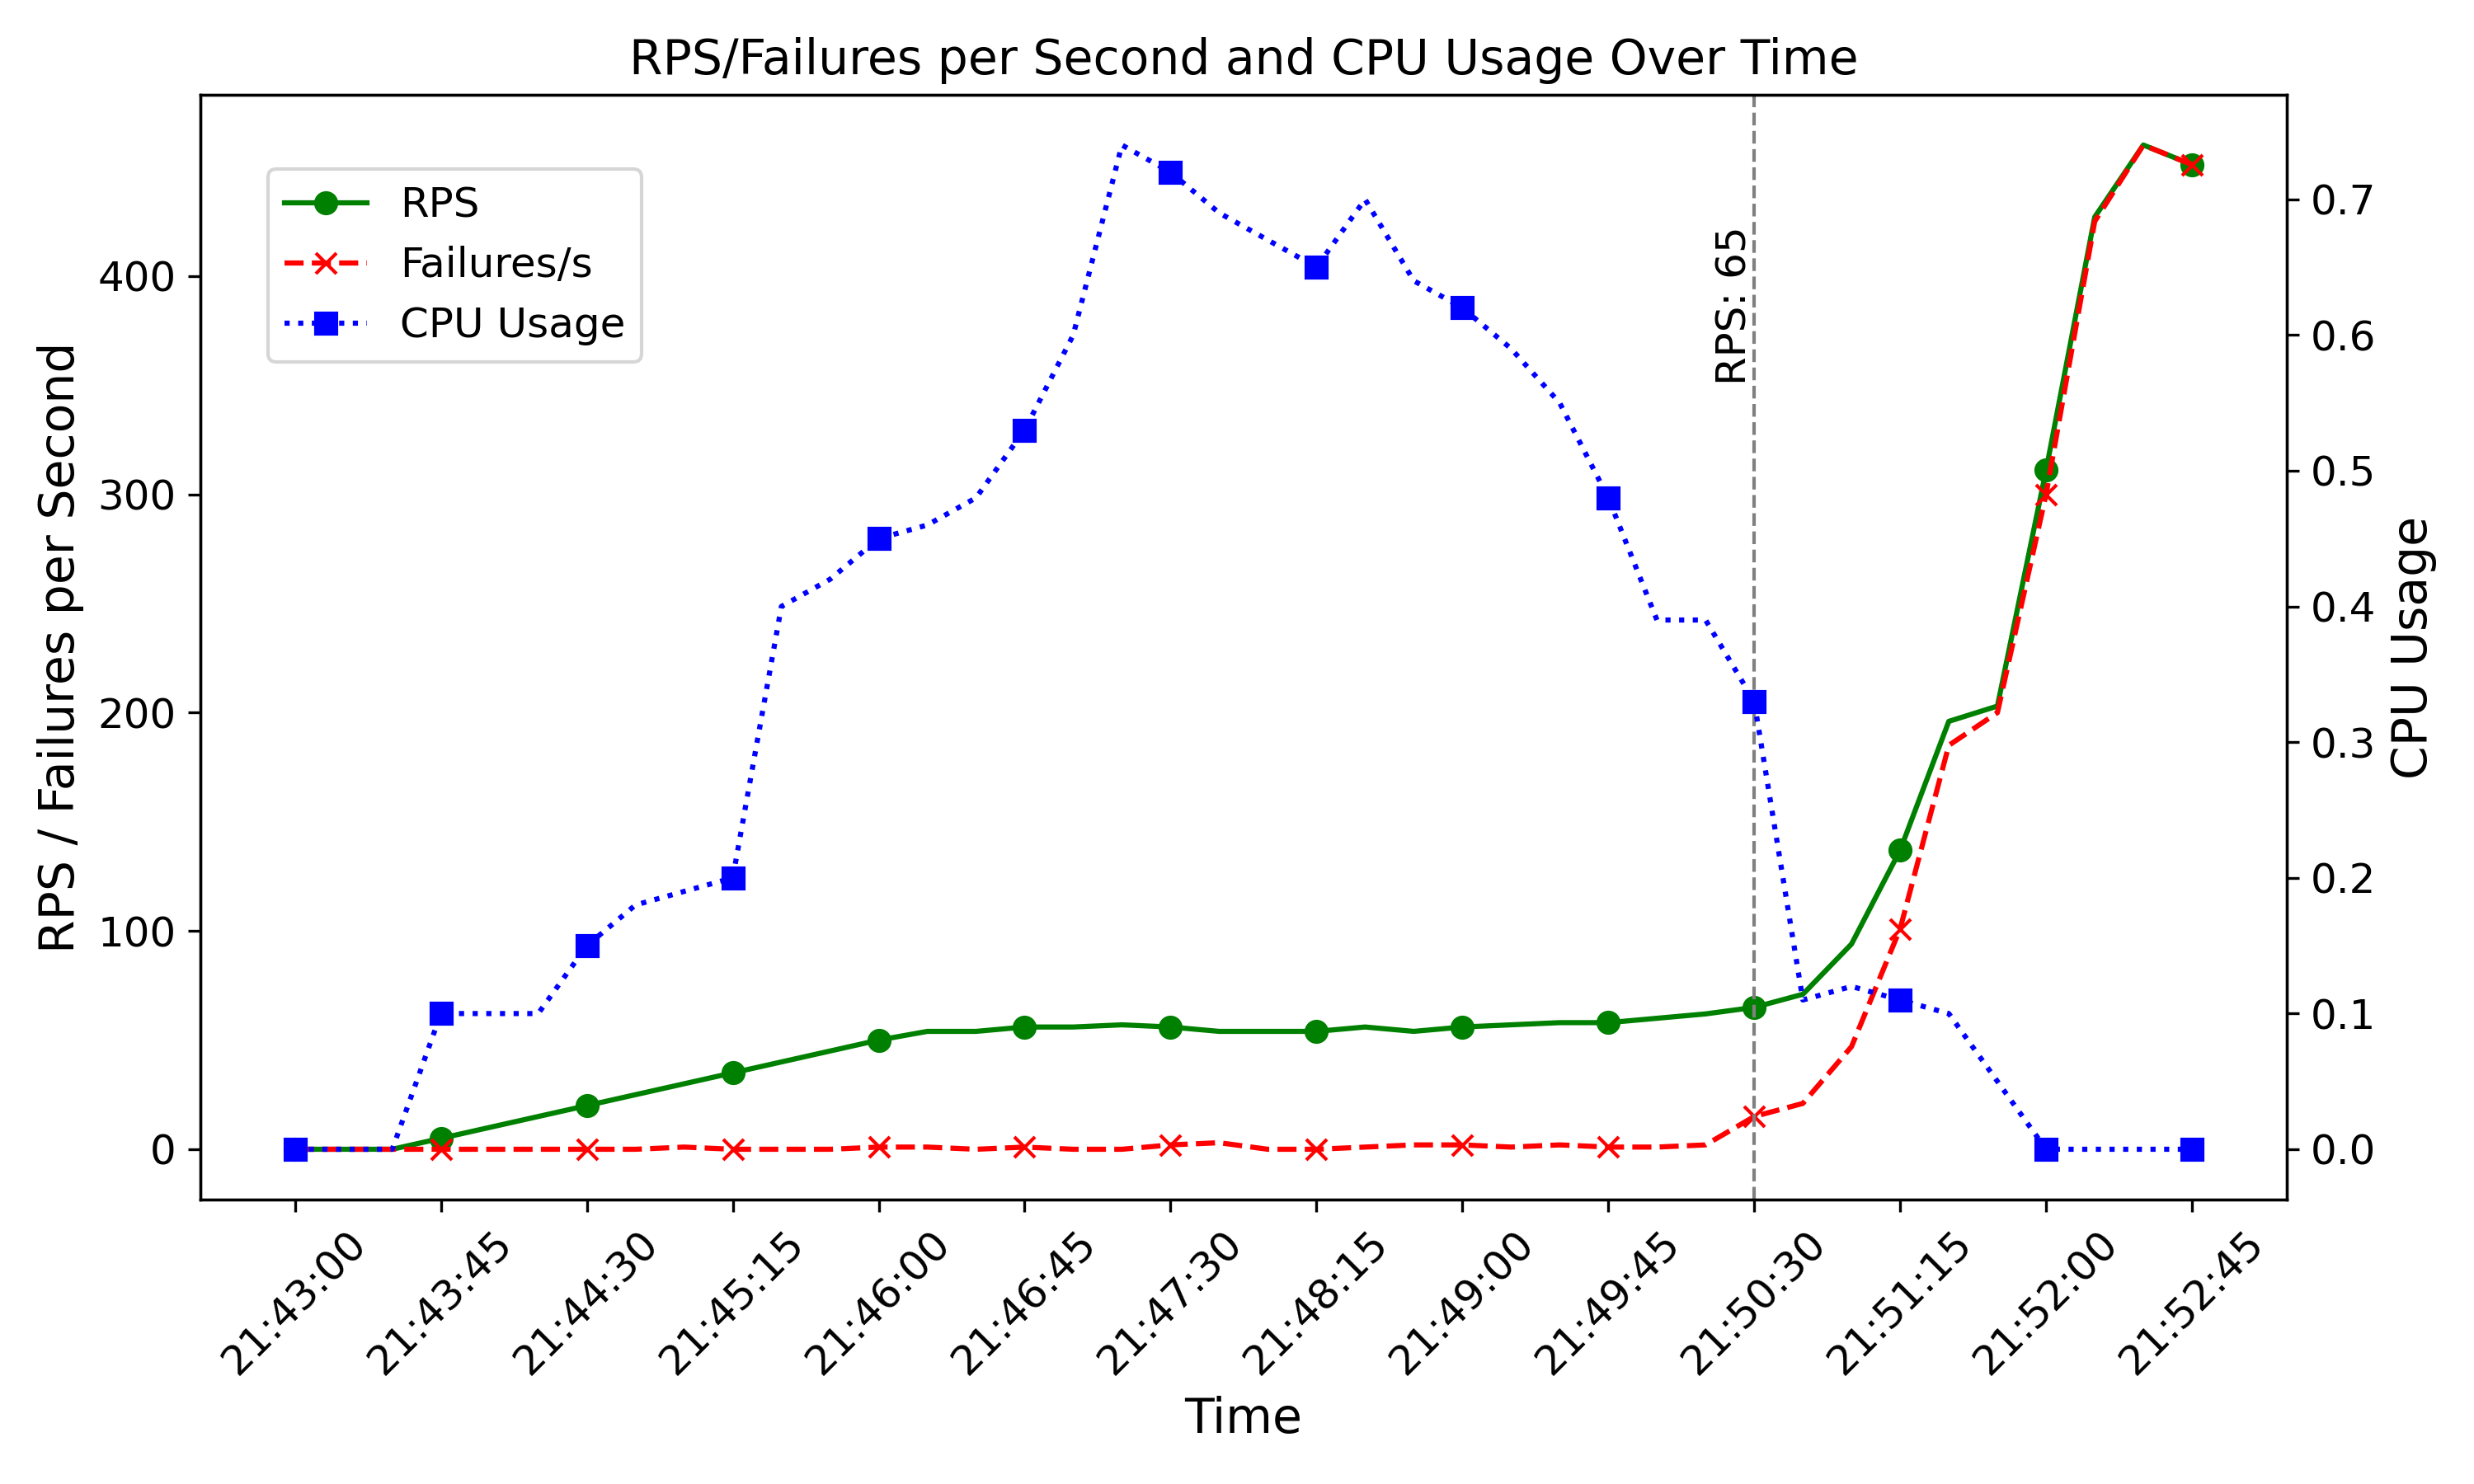
Figure 2 present data on CPU utilization and the corresponding failure rate obtained through load testing a prime number calculation application. Metrics related to CPU usage were collected using Prometheus[15]. As illustrated in Figure 2, there is a notable decline in CPU usage beyond a certain point as illustrated in the vertical line, coinciding with an increase in failure rate. This inflection point marks the application’s threshold for maximum load capacity, beyond which it experiences crashes.
Subsequently, the Pod Calculator integrates data from the Metric Analyzer and the SLO to output the initial optimal number of pods required for deployment, ensuring alignment with the application’s resource demands.
Here’s a breakdown of the components:
-
•
: Minimum RPS that the microservice should handle. This is the SLO.
-
•
: Maximum RPS that a Pod belonging to microservice can handle. This value is calculated using metric analyzer as depicted in figure 2
-
•
: Ceiling function, which rounds up to the nearest integer.
III-D Cost optimal Resource Allocation
Monetary cost optimization of deploying microservices applications is one of the vital research areas that we address in this paper. Due to many reasons such as the complexity, dynamicity, elasticity, and resource utilization requirements of microservice architecture, cost optimization while maintaining user-defined performance has become a more demanding task.
Optimization Engine: The optimization Engine is responsible for addressing those challenges and it mainly consists of the following three components.
Predictor: The predictor is utilized to predict the spot price for each predefined node type unless the user-defined them. By analyzing the last three months’ time series data, which is fetched in real-time from the AWS spot pricing history API [16], the predictor will train and predict the spot price in real-time. Since there is a very high variability in the prices depending on type [5], rather than using a pre-trained model, Prophet [17] is used to forecast the spot price in a more real-time manner.
Optimizer: The optimizer leverages the predicted spot prices to identify the best node combination that corresponds to the given workload, utilizing a brute force, a greedy approach or a genetic algorithm based Pareto optimization. The brute force approach will walk through the whole search space which is computationally expensive while the greedy approach tries to find out the optimal node configuration by using heuristics like recommending the most cost-effective node by considering the current workload. Genetic Algorithm based Pareto optimization tries to find the Pareto front of the two conflicting objectives, cost and the performance. Then this node configuration will be fed into the node allocator to allocate nodes to the cluster.
Genetic algorithm-based Pareto optimization solutions have demonstrated the best trade-off between cost and performance, which is one of the vital research outcomes of our study. The following diagram 3 illustrates the flow of the optimization approach based on NSGA-II optimization.[18].
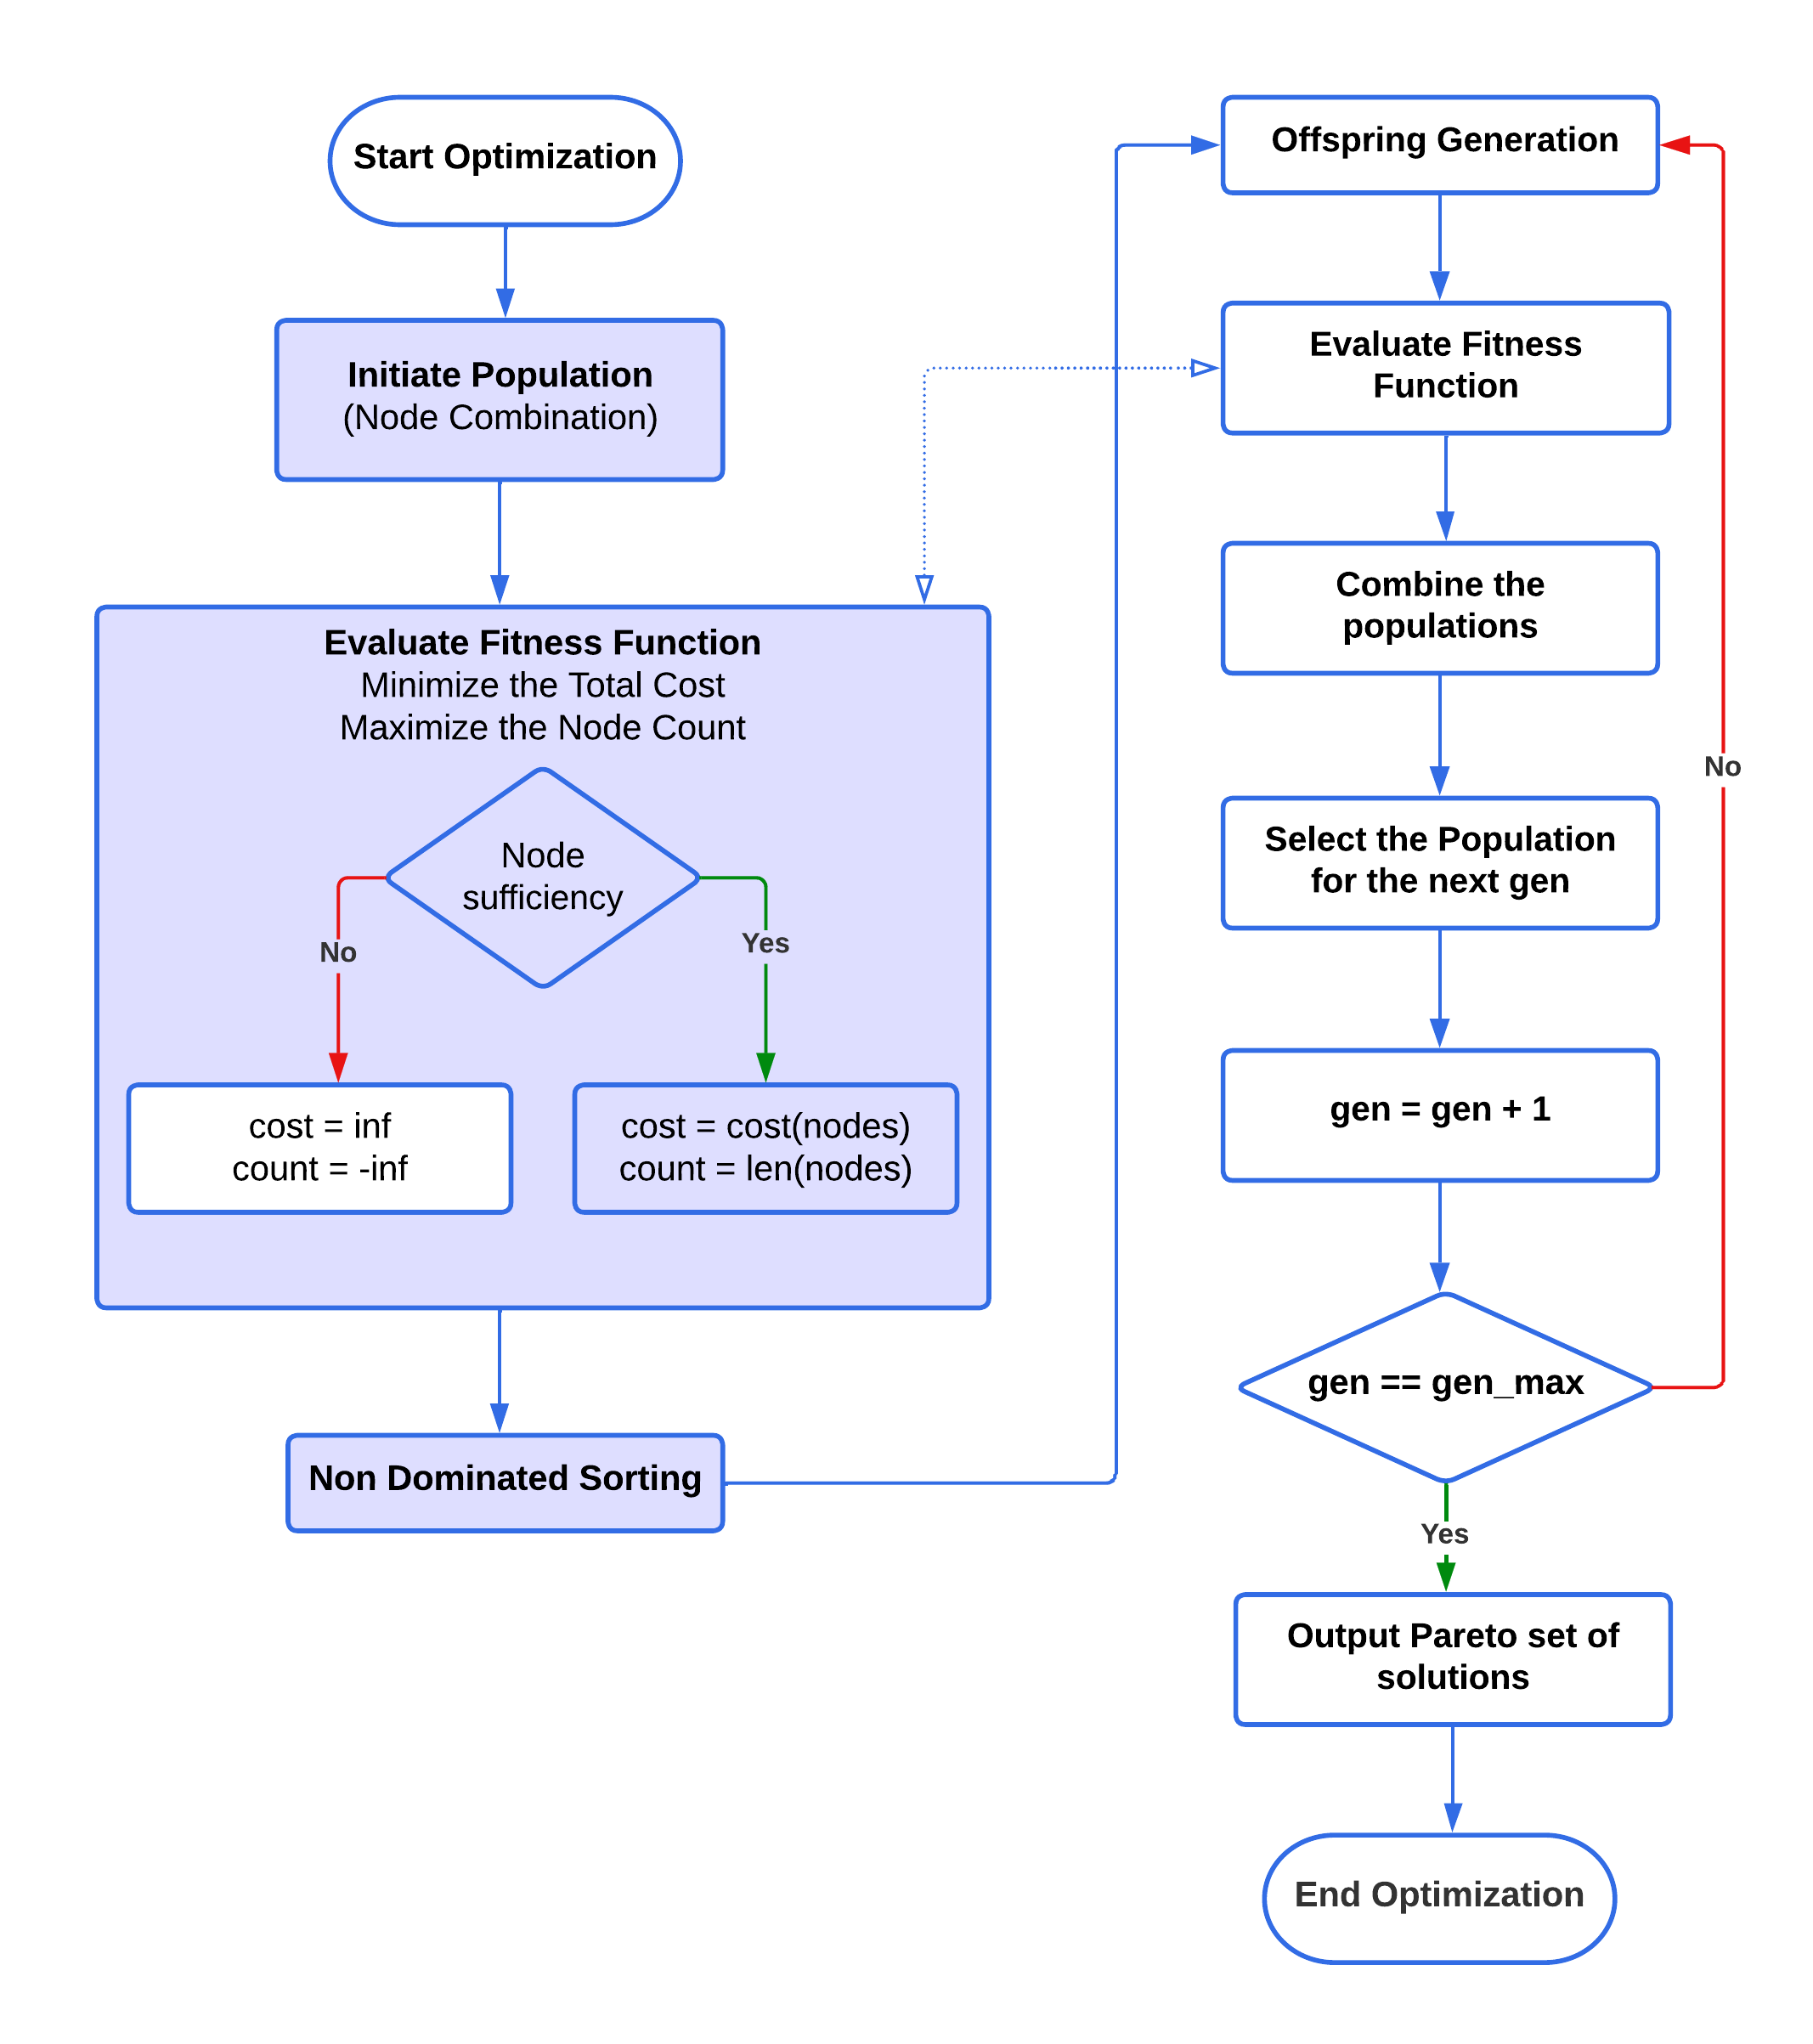
The fitness function plays a key role in identifying the optimal set of nodes that minimize total costs while maximizing the number of nodes. By maximizing the number of nodes and allocating mix of nodes belongs to different availability zones and instance families, the system’s availability is maintained even if there are sudden node terminations. This topic will be discussed in more detail in the discussion section.
In the fitness function, we ensure node sufficiency by comparing the resource availability of each node combination with the resource requirements of the currently running pods or workload.
Cost Model: The cost model calculates the cost of a selected set of nodes and returns the cost per unit time (1 hour) to the given pod count. This function definition, is inspired by and adapted from foundational concepts discussed in the related works section (II.B).
The total cost for utilizing cloud services during a time period is given by the following equation:
-
•
: Cloud server usage cost for server type per unit in time period .
-
•
: Amount of server usage of type in time period .
-
•
: Set of all server types considered for deployment in the cloud environment.
is calculated using the real-time spot price predictor model that we implemented for each spot instance type selected by the genetic algorithm-based optimizer.
Node Allocator: Based on the configuration provided by the optimization engine the node allocator requests spot instances from the spot market and assign them to the private subnet in the virtual private cloud inside the public cloud which is provisioned by the provisioner. Once the spot instances are acquired, the node allocator proceeds to configure the master node and other worker nodes, these worker nodes are then assigned to the cluster where the microservices application is deployed.
III-E Cluster Auto Scaling
Microservices applications are highly dynamic and require efficient management and automation to ensure optimal performance. Container orchestration tools like Kubernetes have emerged as effective solutions for handling such applications. Additionally, cluster auto-scaling has become an essential component of container orchestration to maintain availability and scalability based on the application’s demands.
Cost optimization in cluster auto-scaling is crucial for consumers to reduce the deployment costs. Maintaining system availability, especially with the abrupt termination of spot instances, is a challenging task for the elastic scaler. SpotKube’s elastic scaler addresses these challenges, ensuring cost-efficient auto-scaling while maintaining application availability.
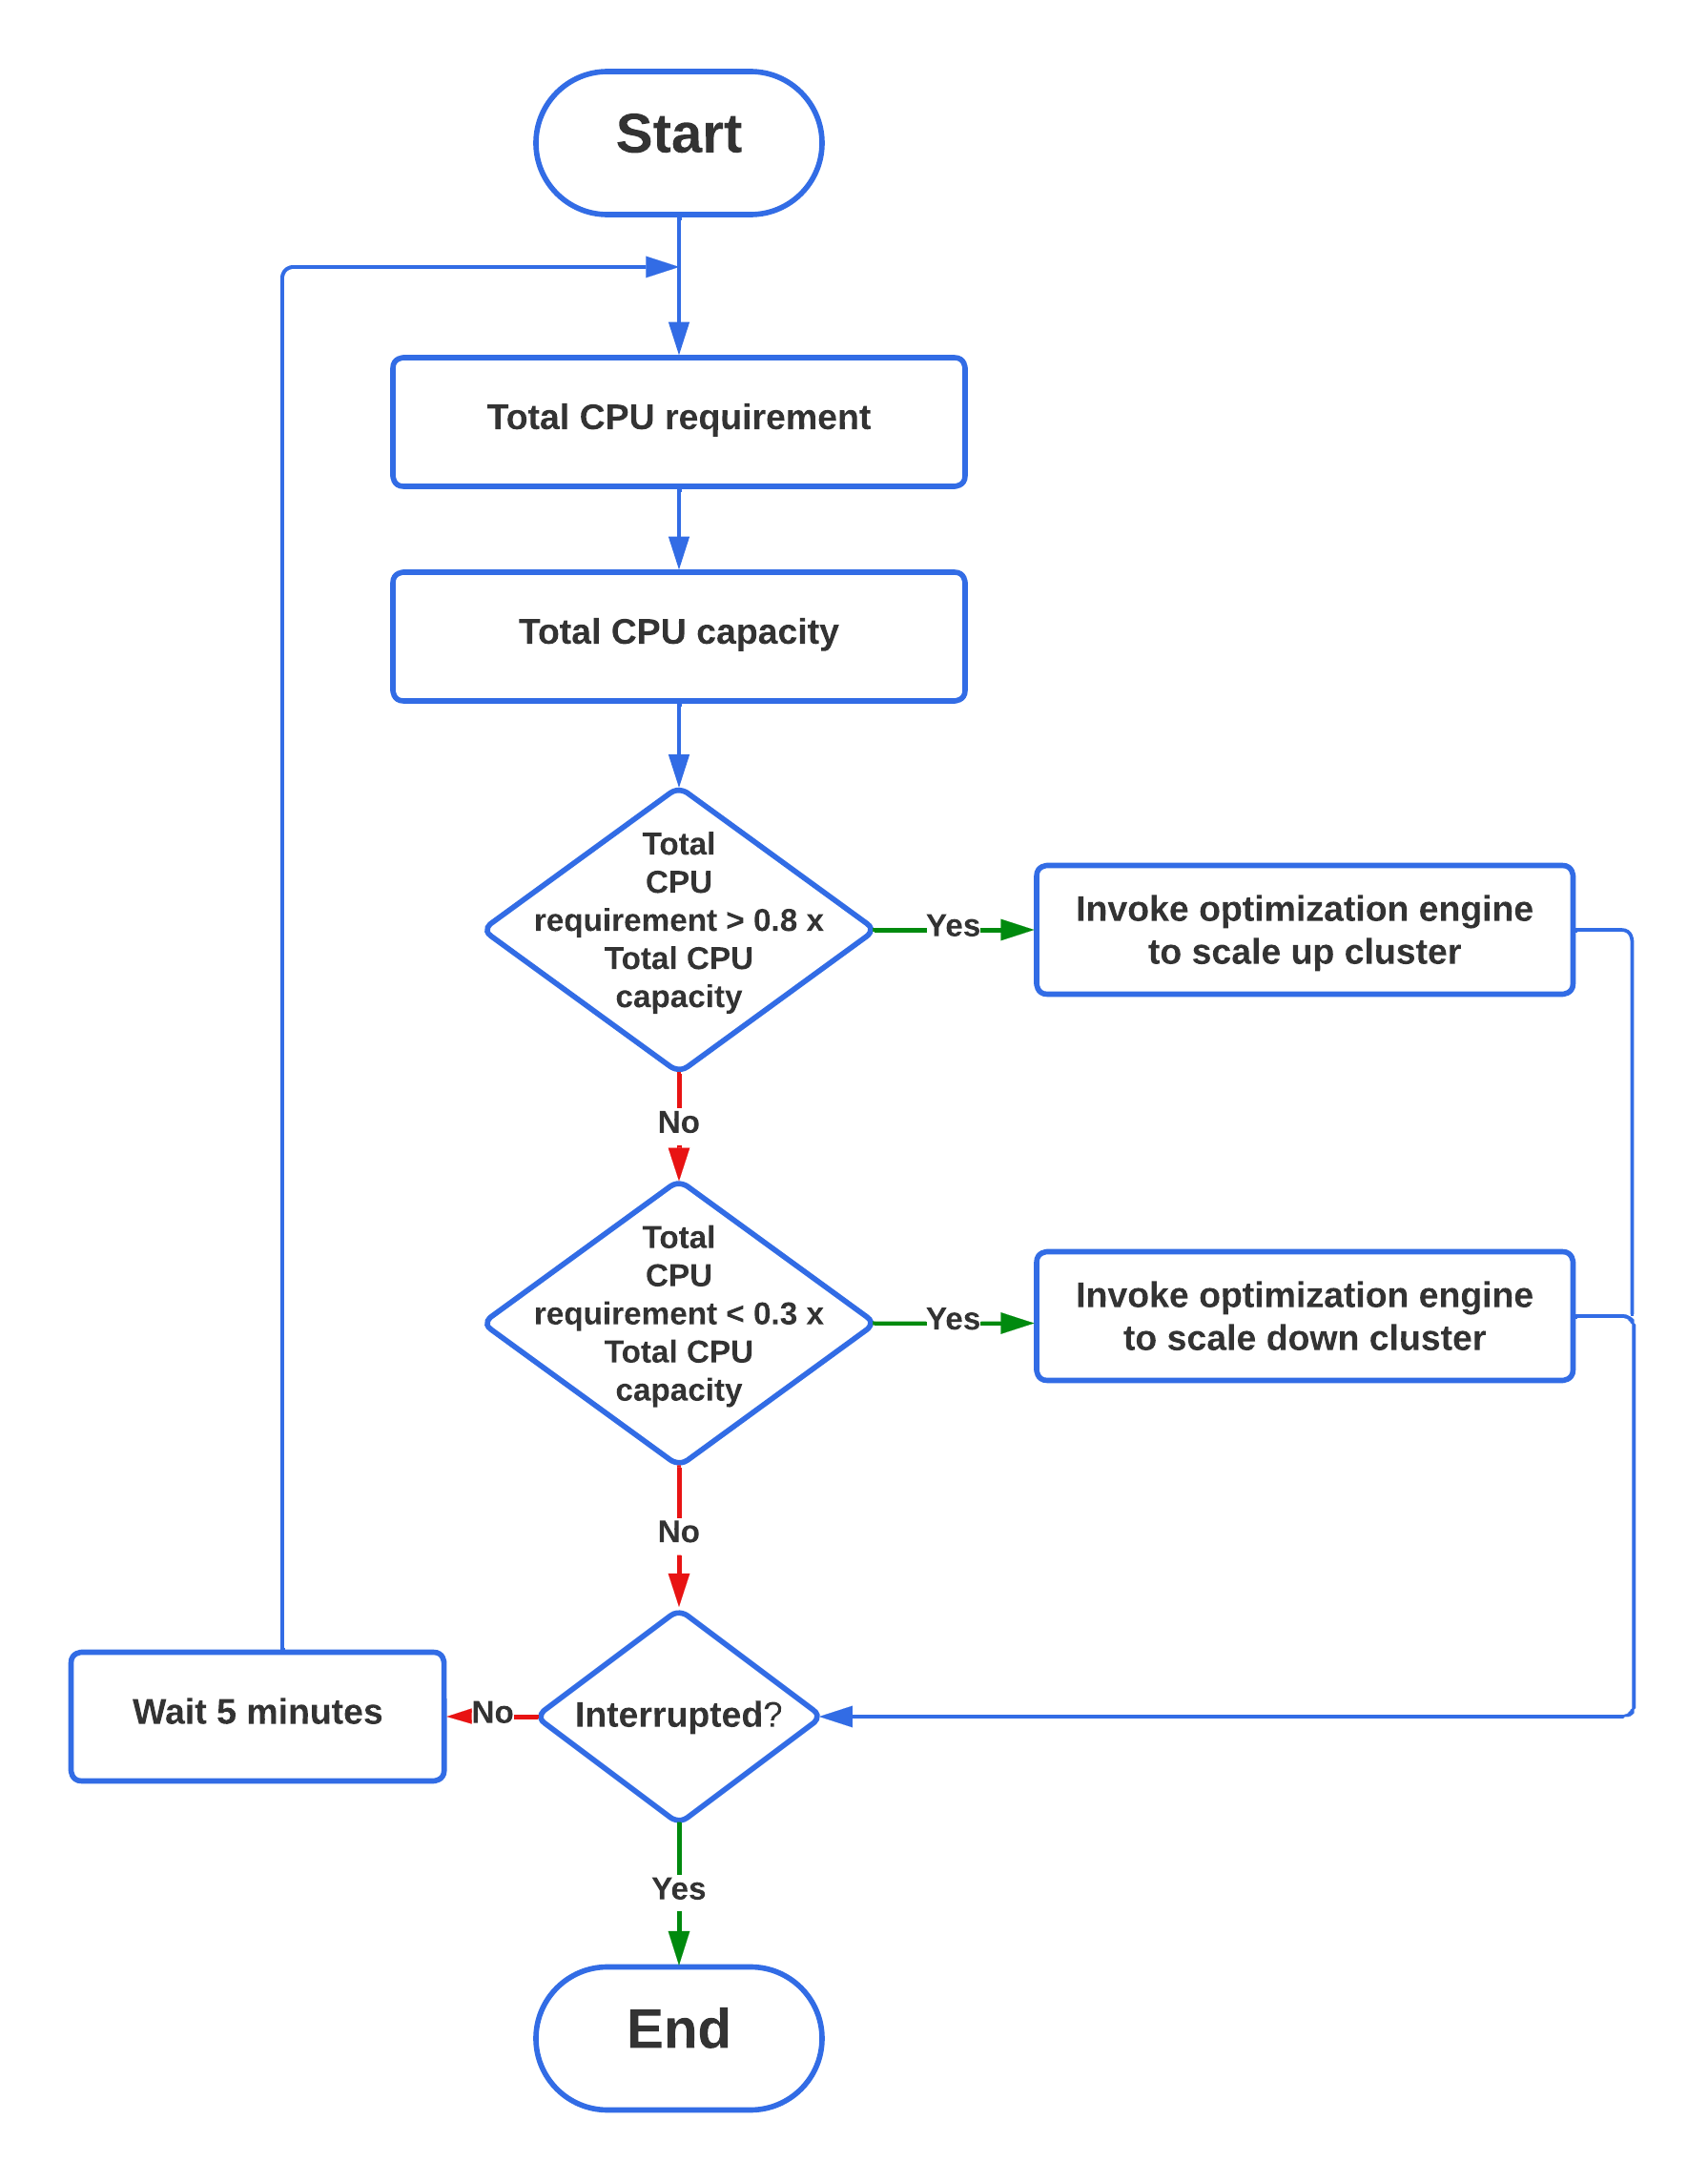
Elastic Scaler: Elastic Scaler operates by periodically notifying the optimization engine about the current configuration, enabling the cluster to adjust to the application’s needs. The elastic scaler comprises two primary components, namely the Worker API and the Scaler Engine. The lightweight Worker API continuously communicates with the Kubernetes API server and compares any changes in the current configuration with the initial configuration. Upon detecting a valid change, it will invoke the Scaler Engine. The Scaler Engine will collect more data from the API server and apply certain heuristics to determine if the configuration change is significant. If the change is deemed significant, the optimization engine will be invoked with the current configuration which includes the current pod count.
Further, to detect sudden spot termination signals, the elastic scaler has implemented a service utilizing the AWS node termination handler [19]. This ensures that when a sudden spot instance termination occurs, the relevant pods will be rescheduled gracefully, and the optimization engine will be notified of the unavailability of the specific instance type.
Based on the current pod count and other configurations, such as spot termination details, the optimization engine will recommend a new optimal node combination to the node allocator and resources will then be attached to or detached from the cluster.
Following flowchart 4 illustrate the high level workflow of the elastic scaler.
IV EVALUATION
IV-A EXPERIMENTAL SETUP
IV-A1 Hardware setup
Kubernetes Manager Node
The Kubernetes manager node was provisioned on an AWS EC2 instance of type t3.medium. This instance type was selected due to its balanced compute, memory, and networking resources, aligning with the requirements of managing the Kubernetes cluster efficiently.
Kubernetes Worker Node
A t3.medium EC2 instance was designated as the Kubernetes worker node. This instance type provides a suitable balance of resources to support the execution of containerized workloads within the Kubernetes cluster while remaining cost-effective.
SpotKube Services Node
The SpotKube services, responsible for managing AWS spot instances within the Kubernetes cluster, were deployed on a t2.micro EC2 instance. Despite its smaller resource footprint compared to other instance types, the t2.micro instance was deemed sufficient for hosting the SpotKube services without compromising their functionality.
IV-A2 Microservice applications
HTTP-based microservices are used for the experiment as HTTP-based microservices facilitate the evaluation of the impact of network latency and bandwidth on the performance of the microservices. Response times and network traffic were measured to identify potential bottlenecks in the system and assess the effectiveness of SpotKube in optimizing resource allocation to alleviate these issues. The following four microservices are selected from popular open-source projects for the experiments.
-
•
Gateway service (Network heavy application) - Work as a proxy and forward the traffic to internal services.
-
•
Auth service (Database access) - Query the MySQL database and validate the username and password.
-
•
Guest-book Go service (Web access) - Dynamically generate HTML content based on the users’ input.
-
•
Prime-app service (Compute intensive) - Calculate all prime numbers up to a given number.
Additionally, each microservice should have a load-testing script and user-defined Service Level Objectives.
IV-A3 Load testing
In order to conduct the load test, Spotkube utilized the Locust test script provided by the user. Locust linearly increases the number of users spawned per second. Prometheus collected CPU metrics, and Locust collected test statistics and saved them into a CSV file for analysis.
IV-A4 Deployment Strategy
Resource limits were imposed on each container to maintain simplicity, and Minikube was selected as the Kubernetes cluster for the experiment. Two deployment strategies were utilized to compare the effectiveness of the proposed approach.
In the first strategy, the Kubernetes horizontal pod autoscalar(HPA) was used to deploy the microservices along with the Cluster Autoscaler(CA) with AWS Autoscaling group, and subsequently, the applications were subjected to load testing.
In the second strategy, both HPA and SpotKube were used to deploy the microservices, and the applications were subjected to load testing.
IV-B EXPERIMENTAL EVALUATION
IV-B1 Analytical Model Validation
Assuming that the user-defined SLO for the Auth service is to support a minimum of 50 requests per second, the load test results for this service that was deployed using the first strategy which is enabling the HPA and AWS CA are depicted in Figure 5. However, it can be observed that this service encountered some failures before reaching the specified SLO.
On the other hand, Figure 6 displays the load test results for the same Auth service that was deployed using Spotkube and HPA, where it was able to achieve the user-defined objectives.
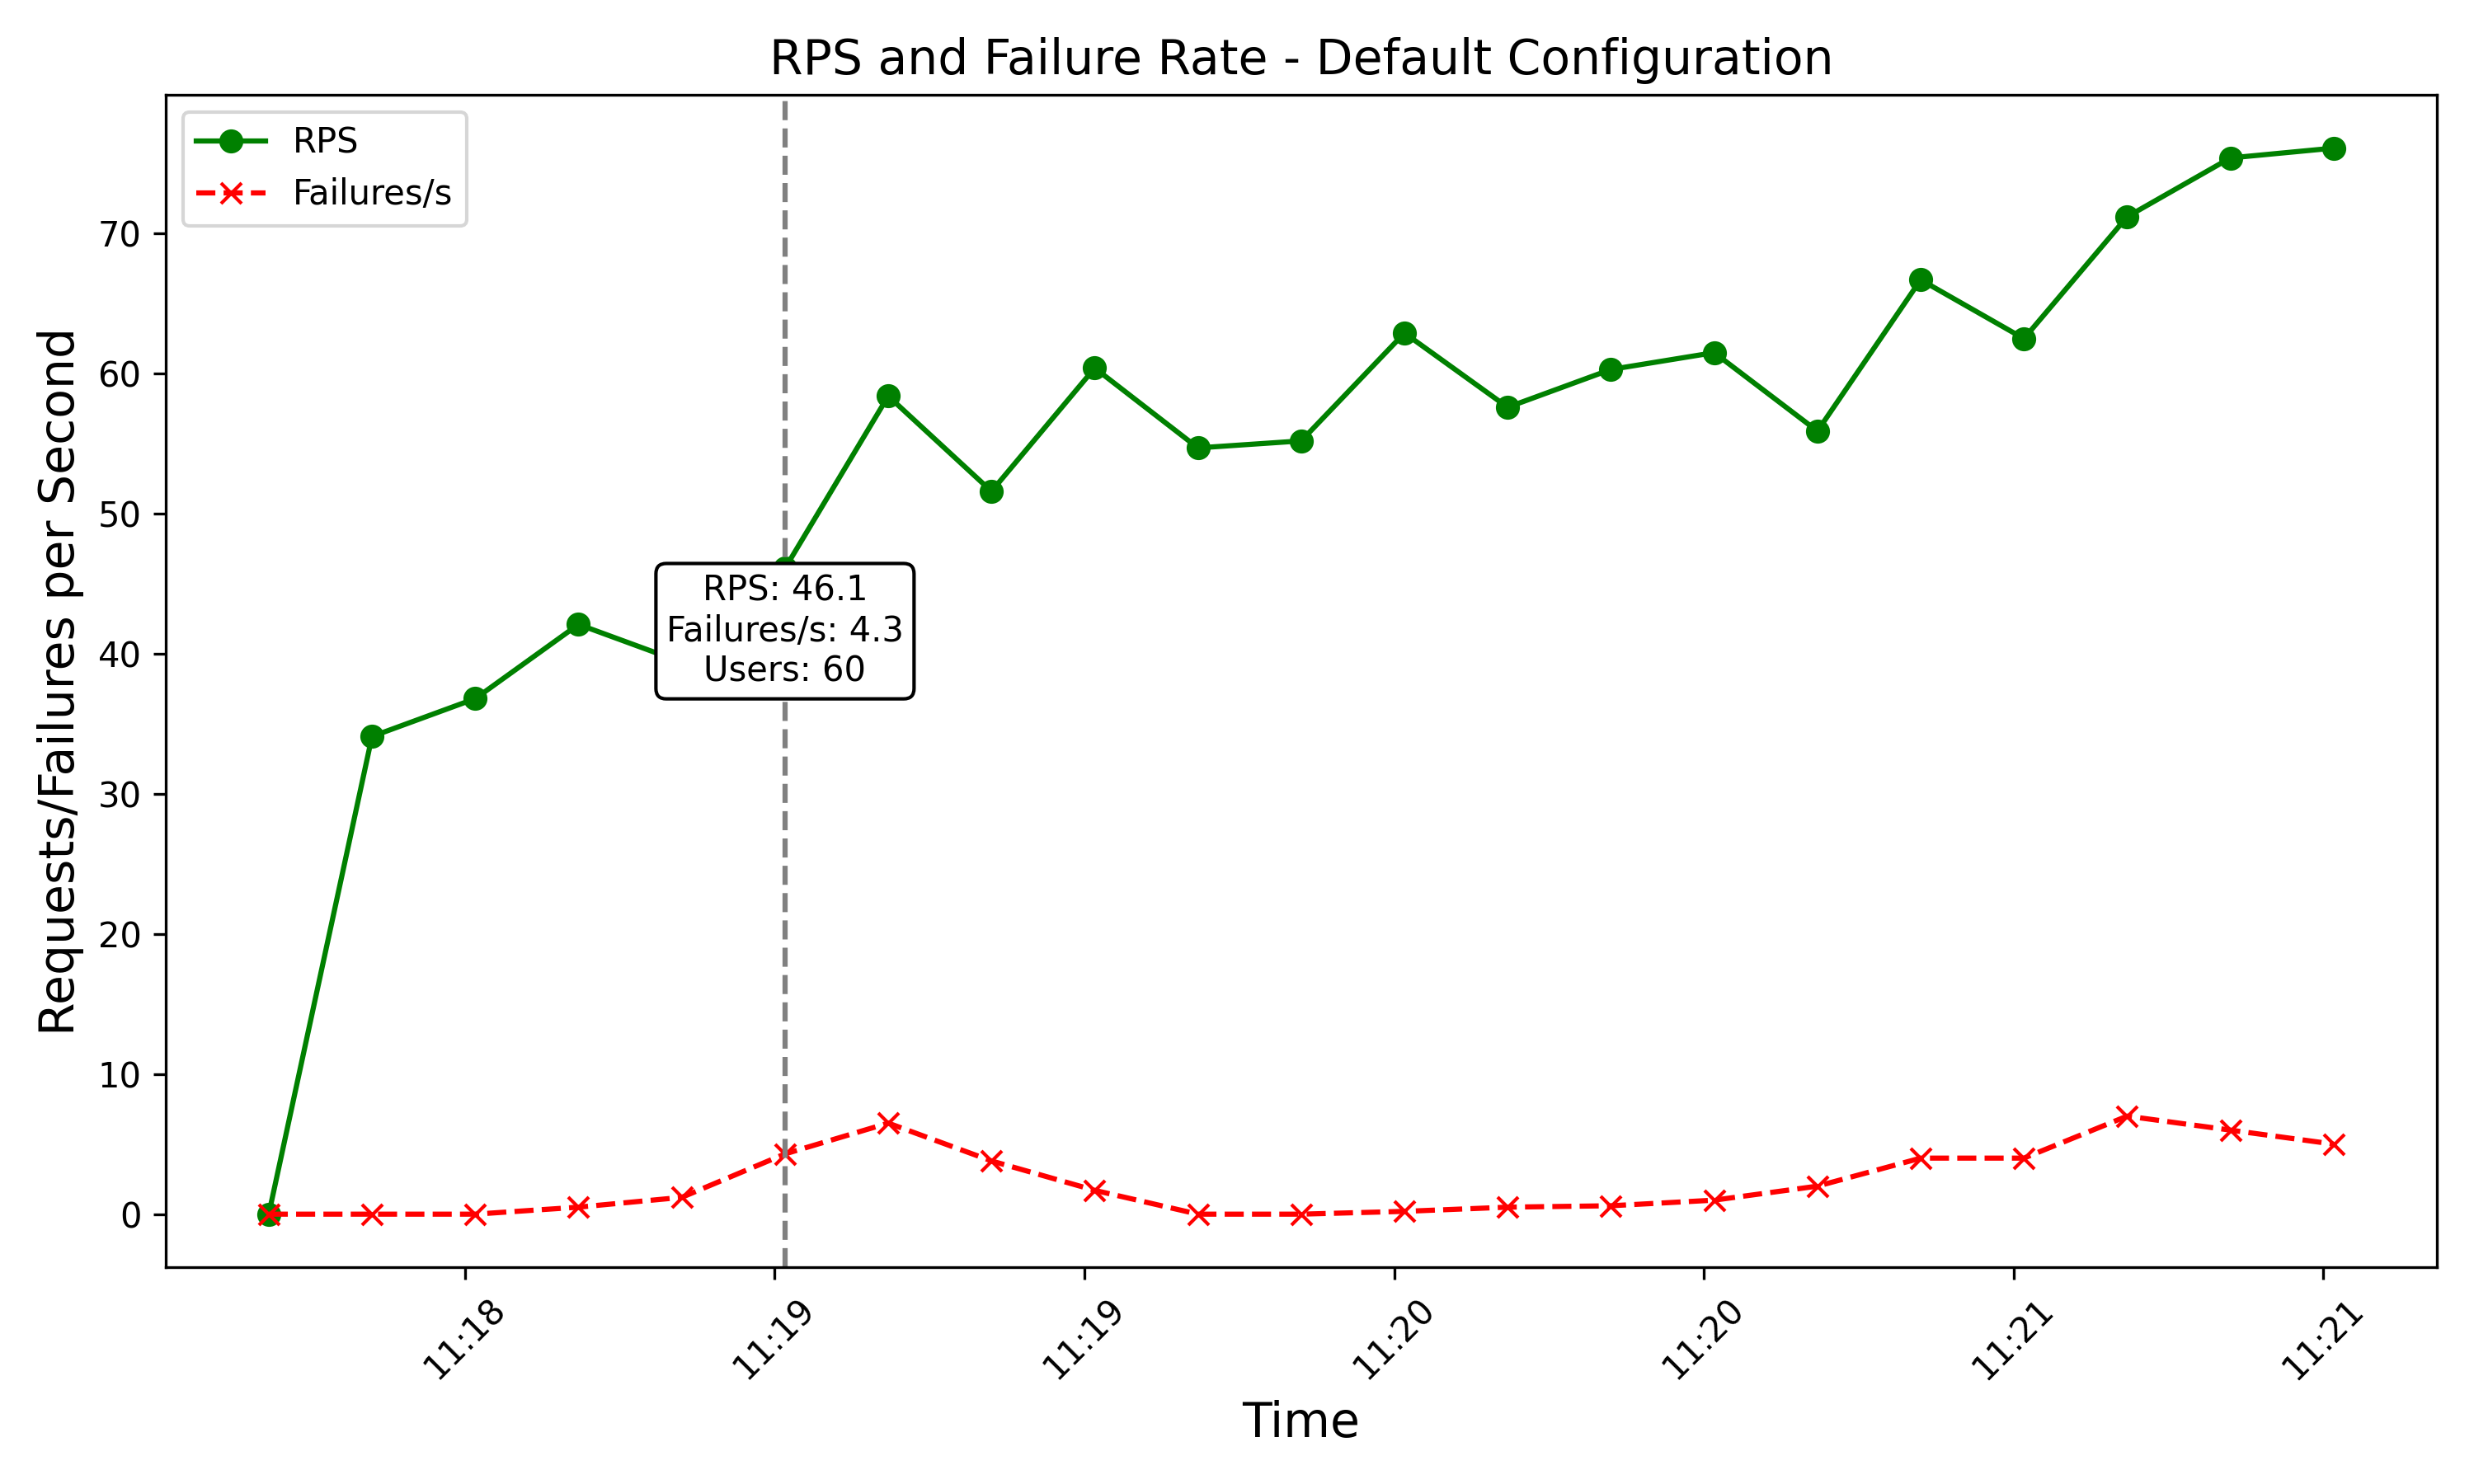
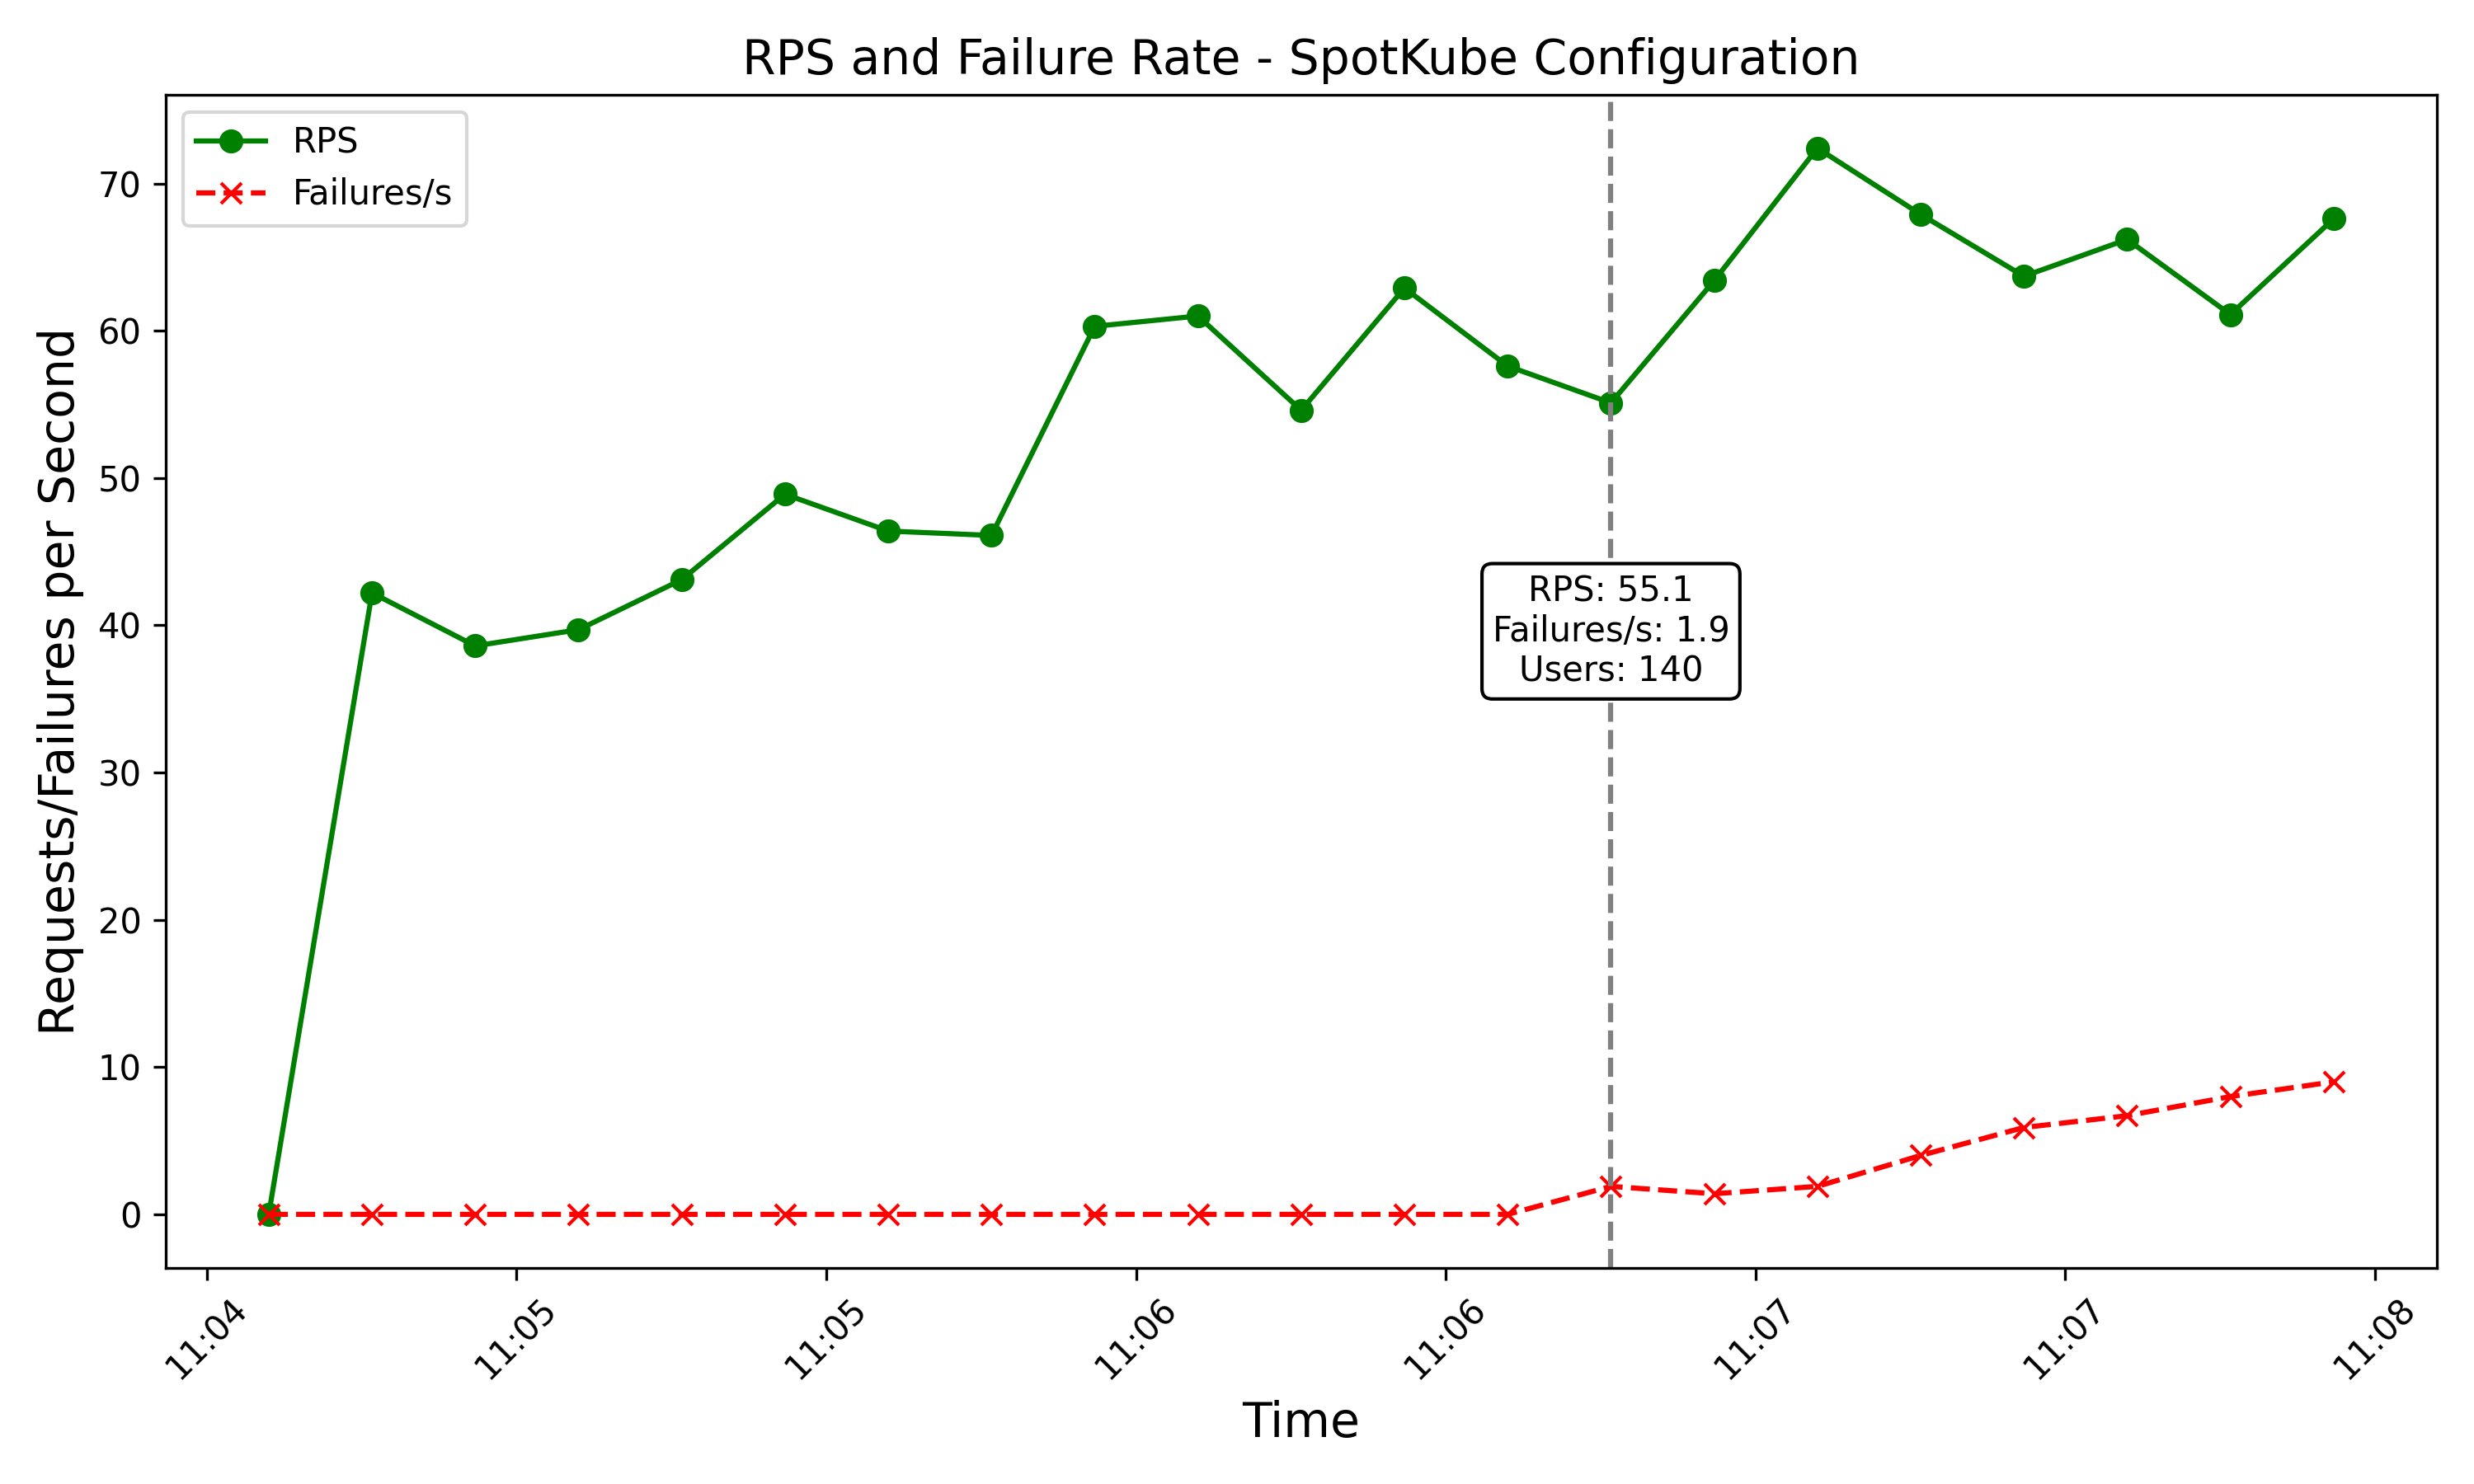
Table I & Table II show a comparison between the two deployment strategies. Each service user has specified the minimum number of requests that should support per second. These data indicate that using Spotkube to deploy microservices is more effective than deploying microservices in an ad-hoc manner.
| Service | Load testing | SLO (RPS) | Default | ||||||||
|
|
|
|
||||||||
| Auth | 1000 | 10 | 45 | 43,2 | 1.6 | ||||||
| Gateway | 1000 | 10 | 50 | 46.5 | 6.5 | ||||||
| Guestbook | 1000 | 10 | 50 | 43.3 | 2.8 | ||||||
| Prime-app | 500 | 2 | 60 | 51.2 | 0 | ||||||
| Service | Load testing | SLO (RPS) | Spotkube | ||||||||
|
|
|
|
||||||||
| Auth | 1000 | 10 | 45 | 49.4 | 1.5 | ||||||
| Gateway | 1000 | 10 | 50 | 55.1 | 1.9 | ||||||
| Guestbook | 1000 | 10 | 50 | 54.1 | 1.6 | ||||||
| Prime-app | 500 | 2 | 60 | 72.5 | 0 | ||||||
IV-B2 Spot Predictor Validation
SpotKube relies on the predicted spot prices when requesting spot instances from the AWS spot market. Hence, the accuracy of the prediction is crucial to mitigate unnecessary terminations of spot instances. We evaluate time series model accuracy for two instance types, and the results show that the prediction was accurate enough to bid spot instances from the spot market (Figures: 7, 8).
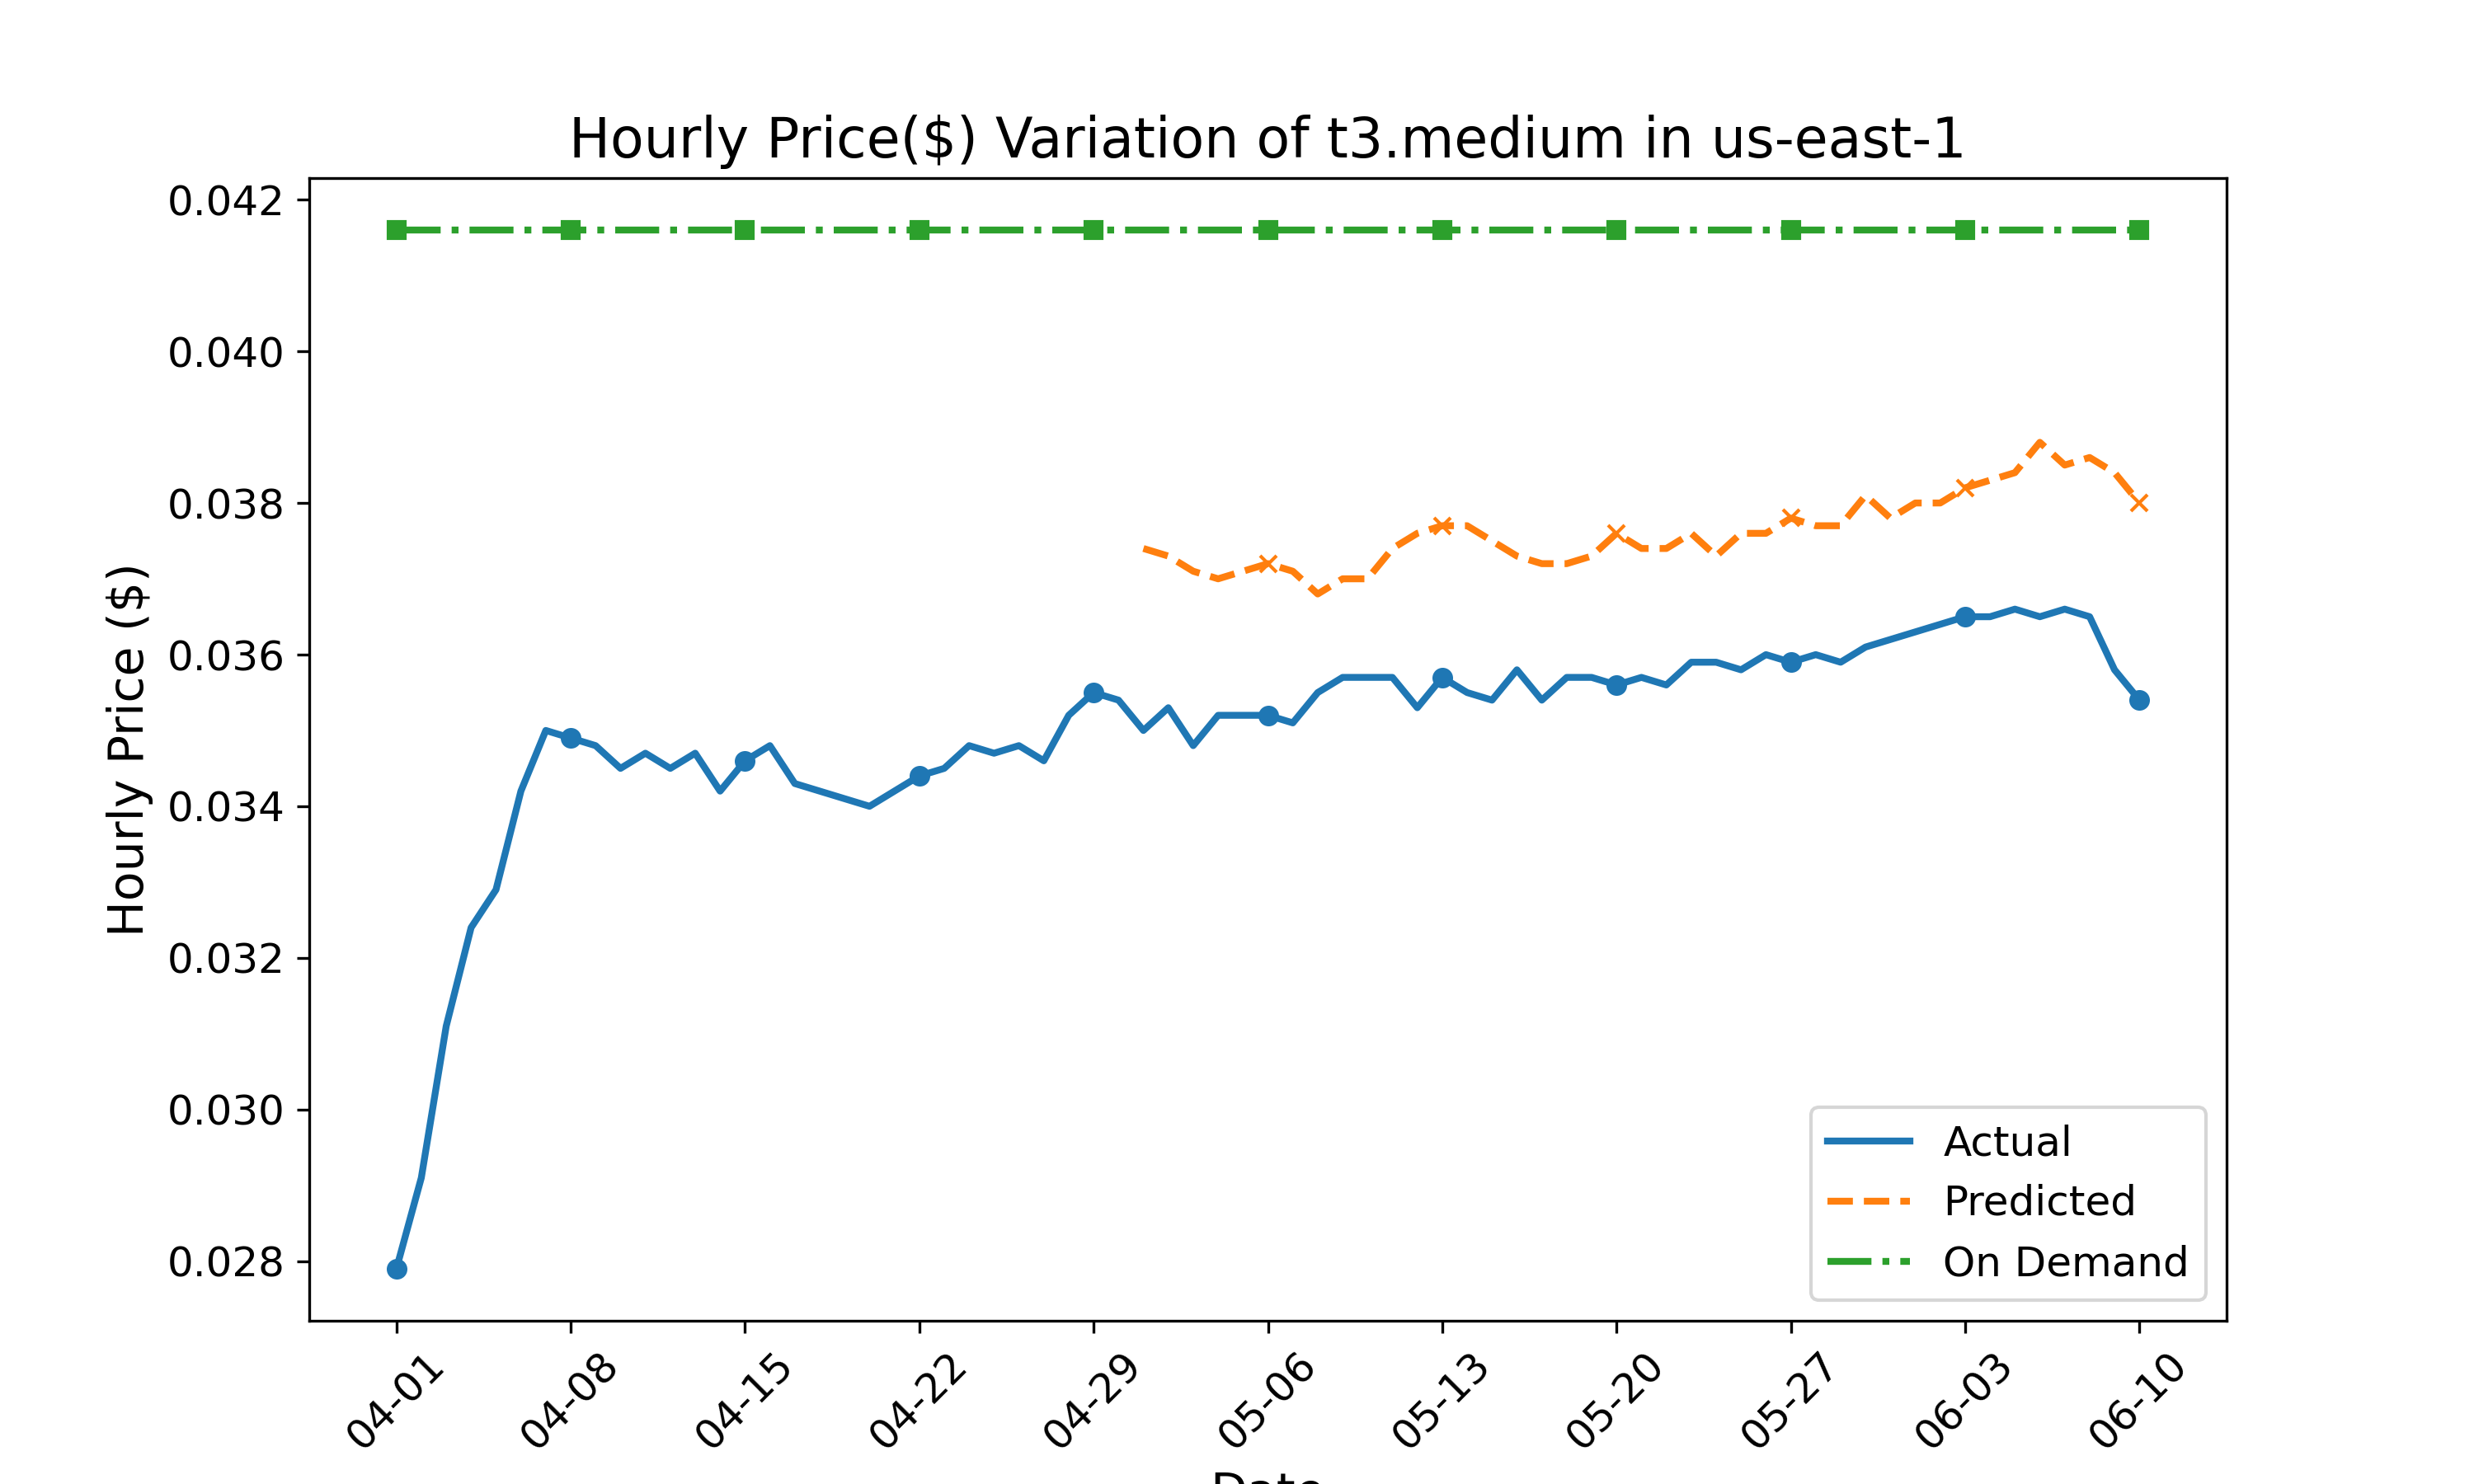
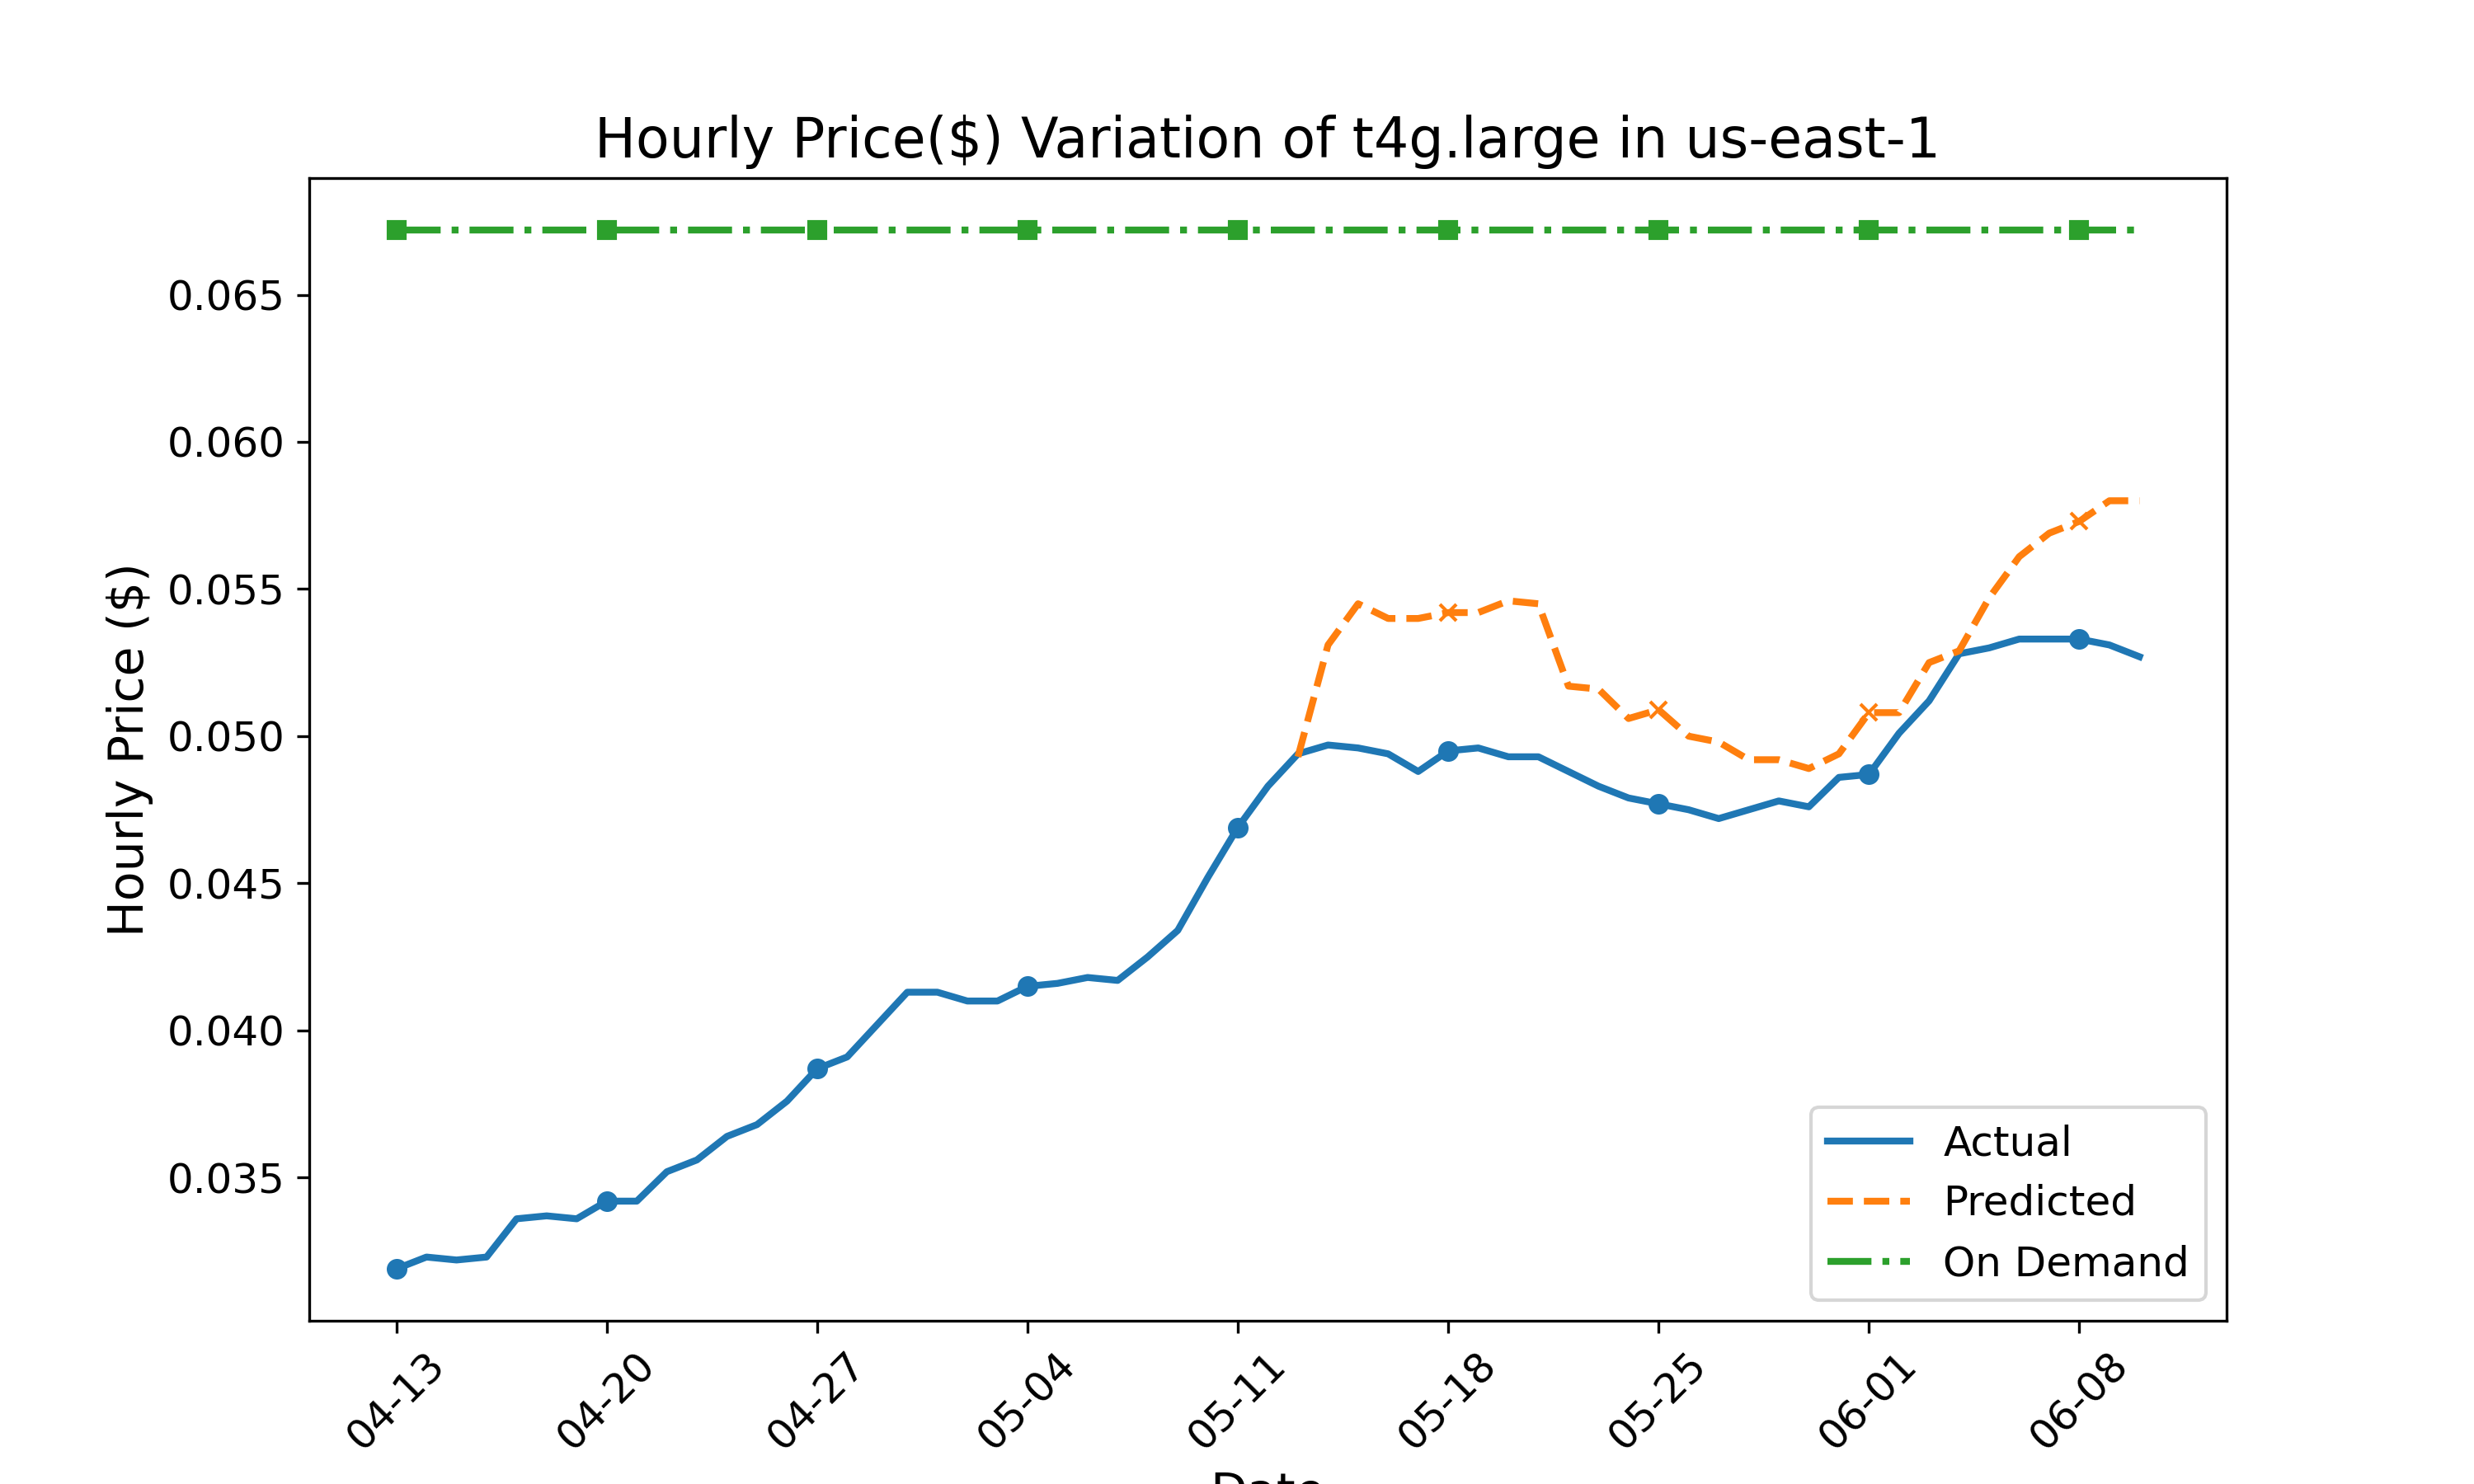
In summary, forecasting models are able to predict the spot price properly and these values can use to request spot instances from the spot market. Root Mean Square Error proves the effectiveness of each prediction.
IV-B3 Optimization Algorithms Comparison
We conducted an experiment to compare the performance of three optimization algorithms: Bruteforce, Greedy approach, and Genetic algorithm-based Pareto optimization. The objective of the experiment was to evaluate the algorithms based on three criteria: execution time, total cost, and the number of nodes.
Throughout the experiment, we analyzed the algorithms’ performance with varying numbers of pods. By considering different numbers of pods, we aimed to understand how the algorithms’ efficiency and effectiveness change in response to the scale of the problem.
-
•
pymoo: Pareto optimization
-
•
greedy: Greedy Approach
-
•
bruteforce: Bruteforce Approach
Time Comparison
According to the below graph,
-
•
pymoo - Regardless of the pod count, execution time is almost the same throughout the experiment
-
•
greedy - Execution time is less compared to other algorithms.
-
•
bruteforce - Exponentially grows with the pod count
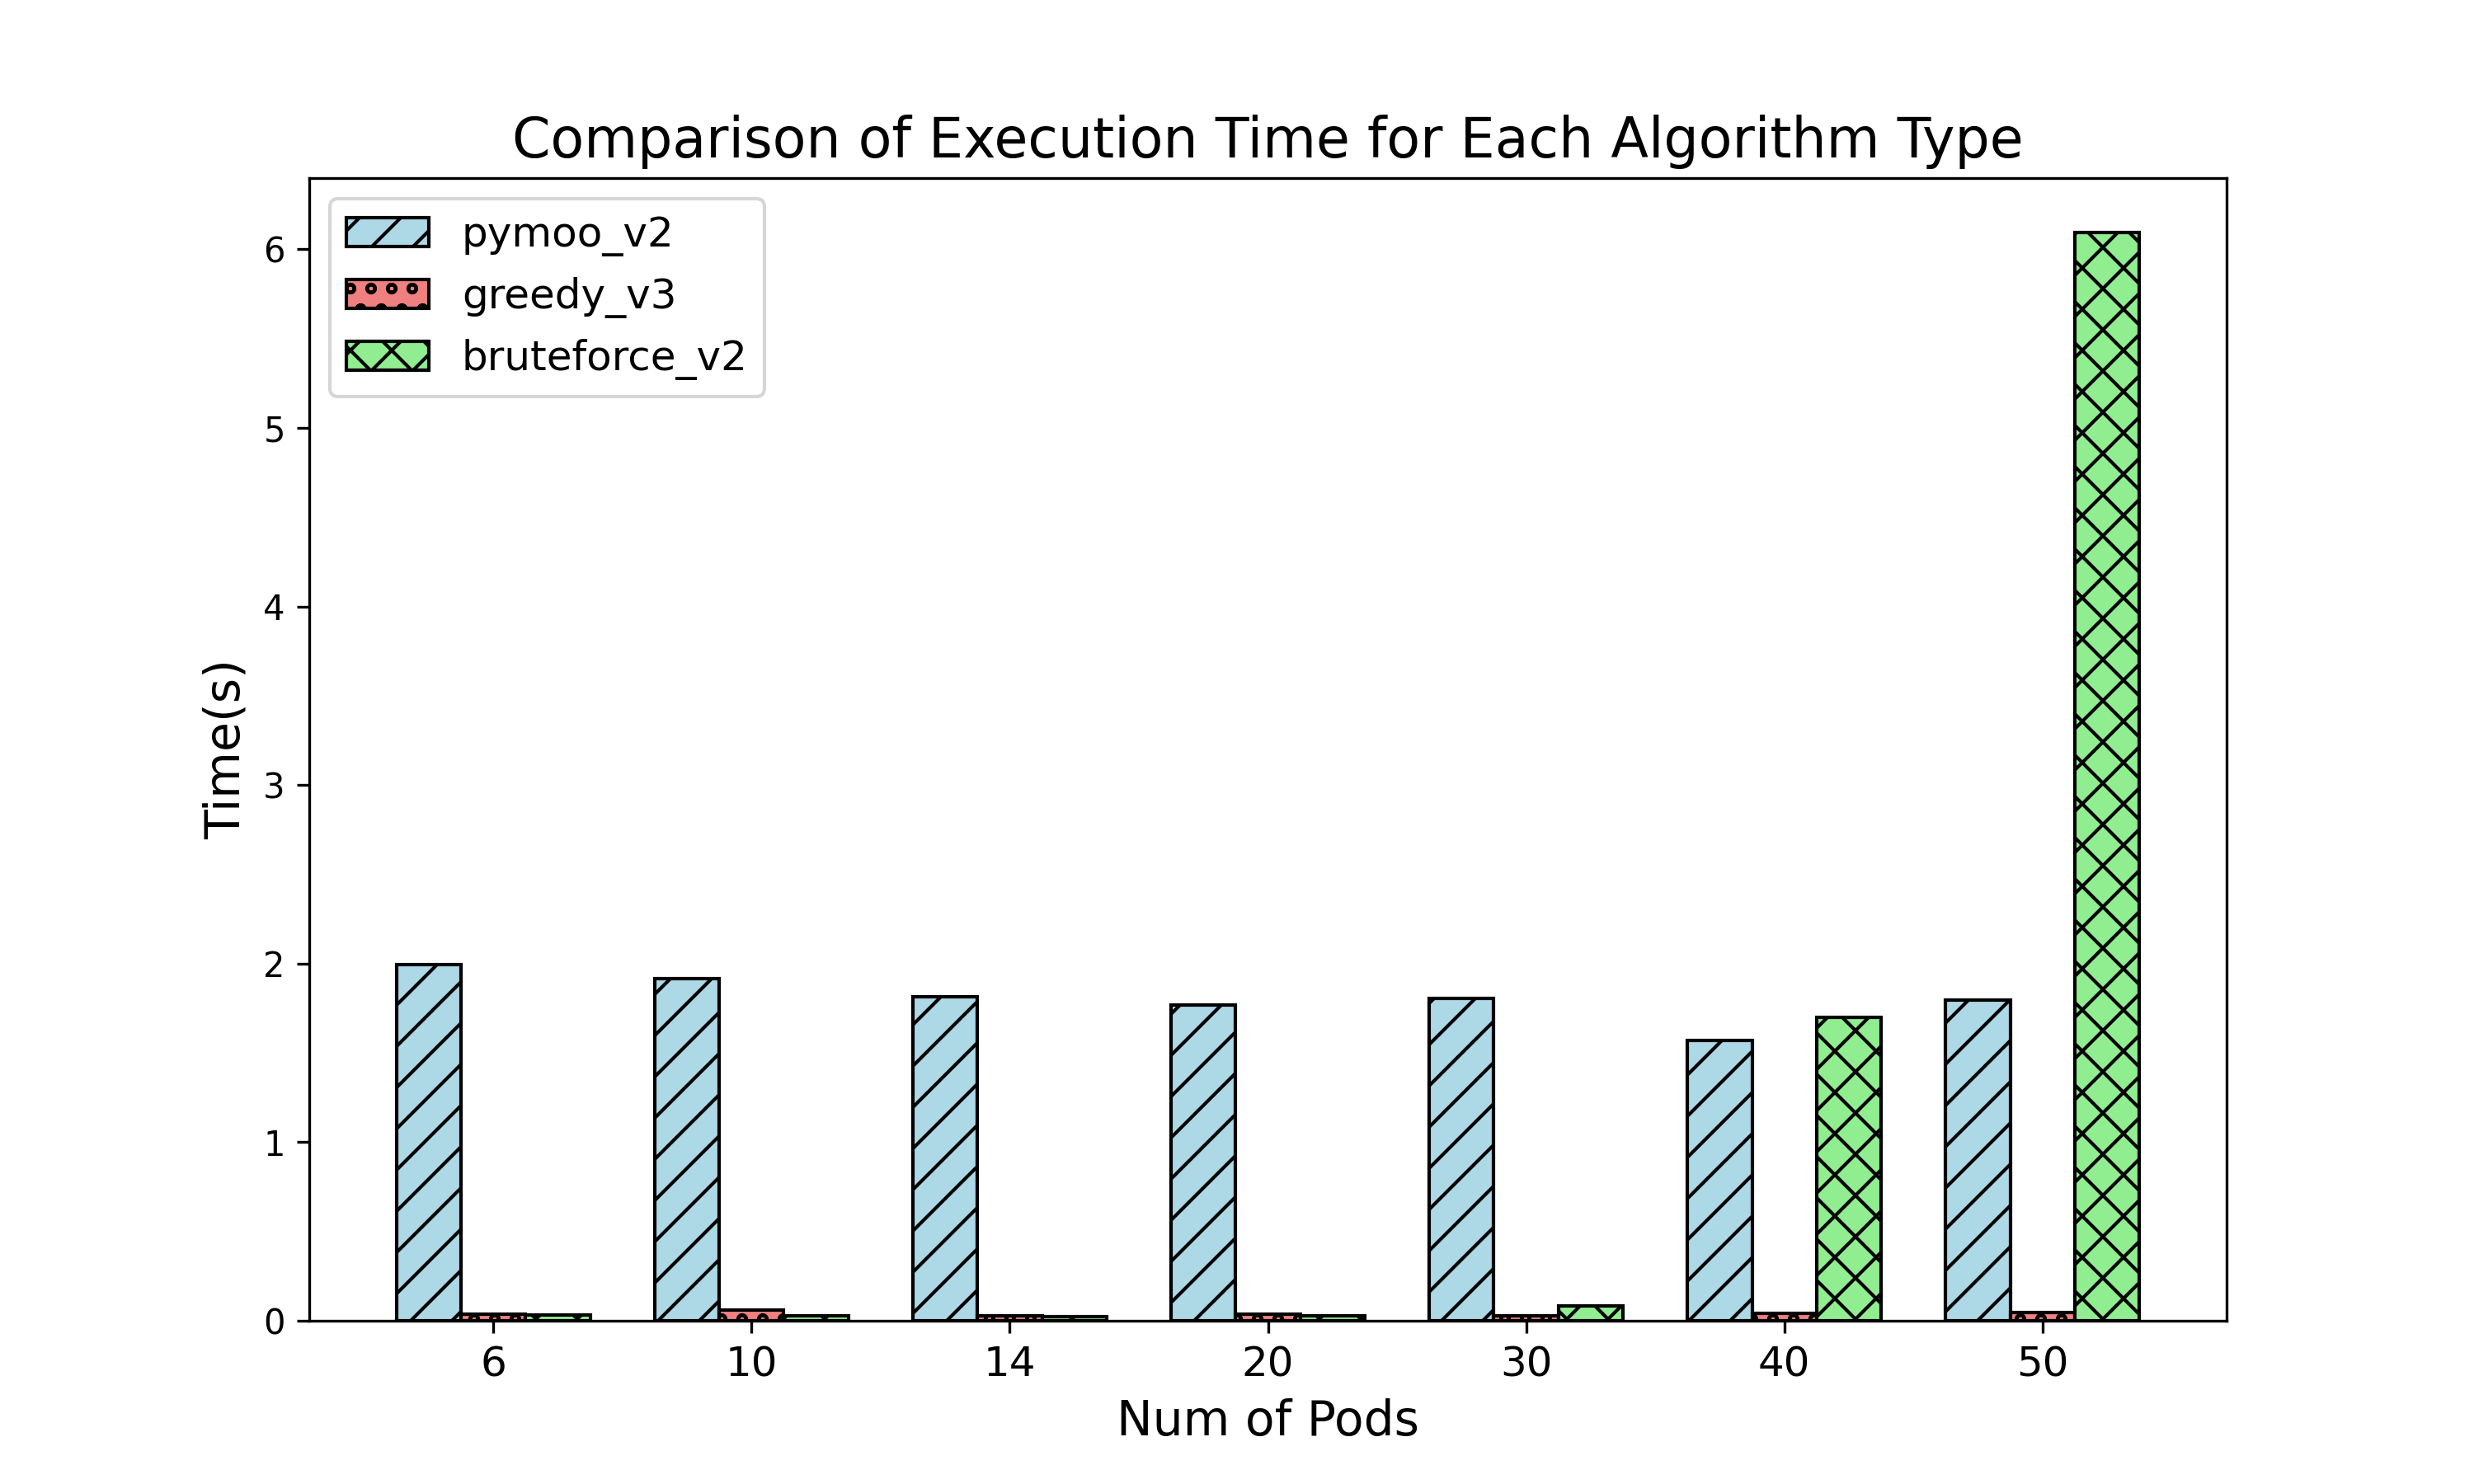
Outcome: Greedy approach performs better. Pymoo also comparatively performing well
Hourly Cost ($) Comparison
According to the below graph,
-
•
pymoo - Returns the lowest cost
-
•
greedy - Cost is not optimal
-
•
bruteforce - Gives the optimal cost. But when the pod count increases, the cost retuned by the brute force approach is greater than the cost returned by the Pareto-based implementation. This is due to the constraint that has been made during the implementation of the brute force approach to make it more efficient.
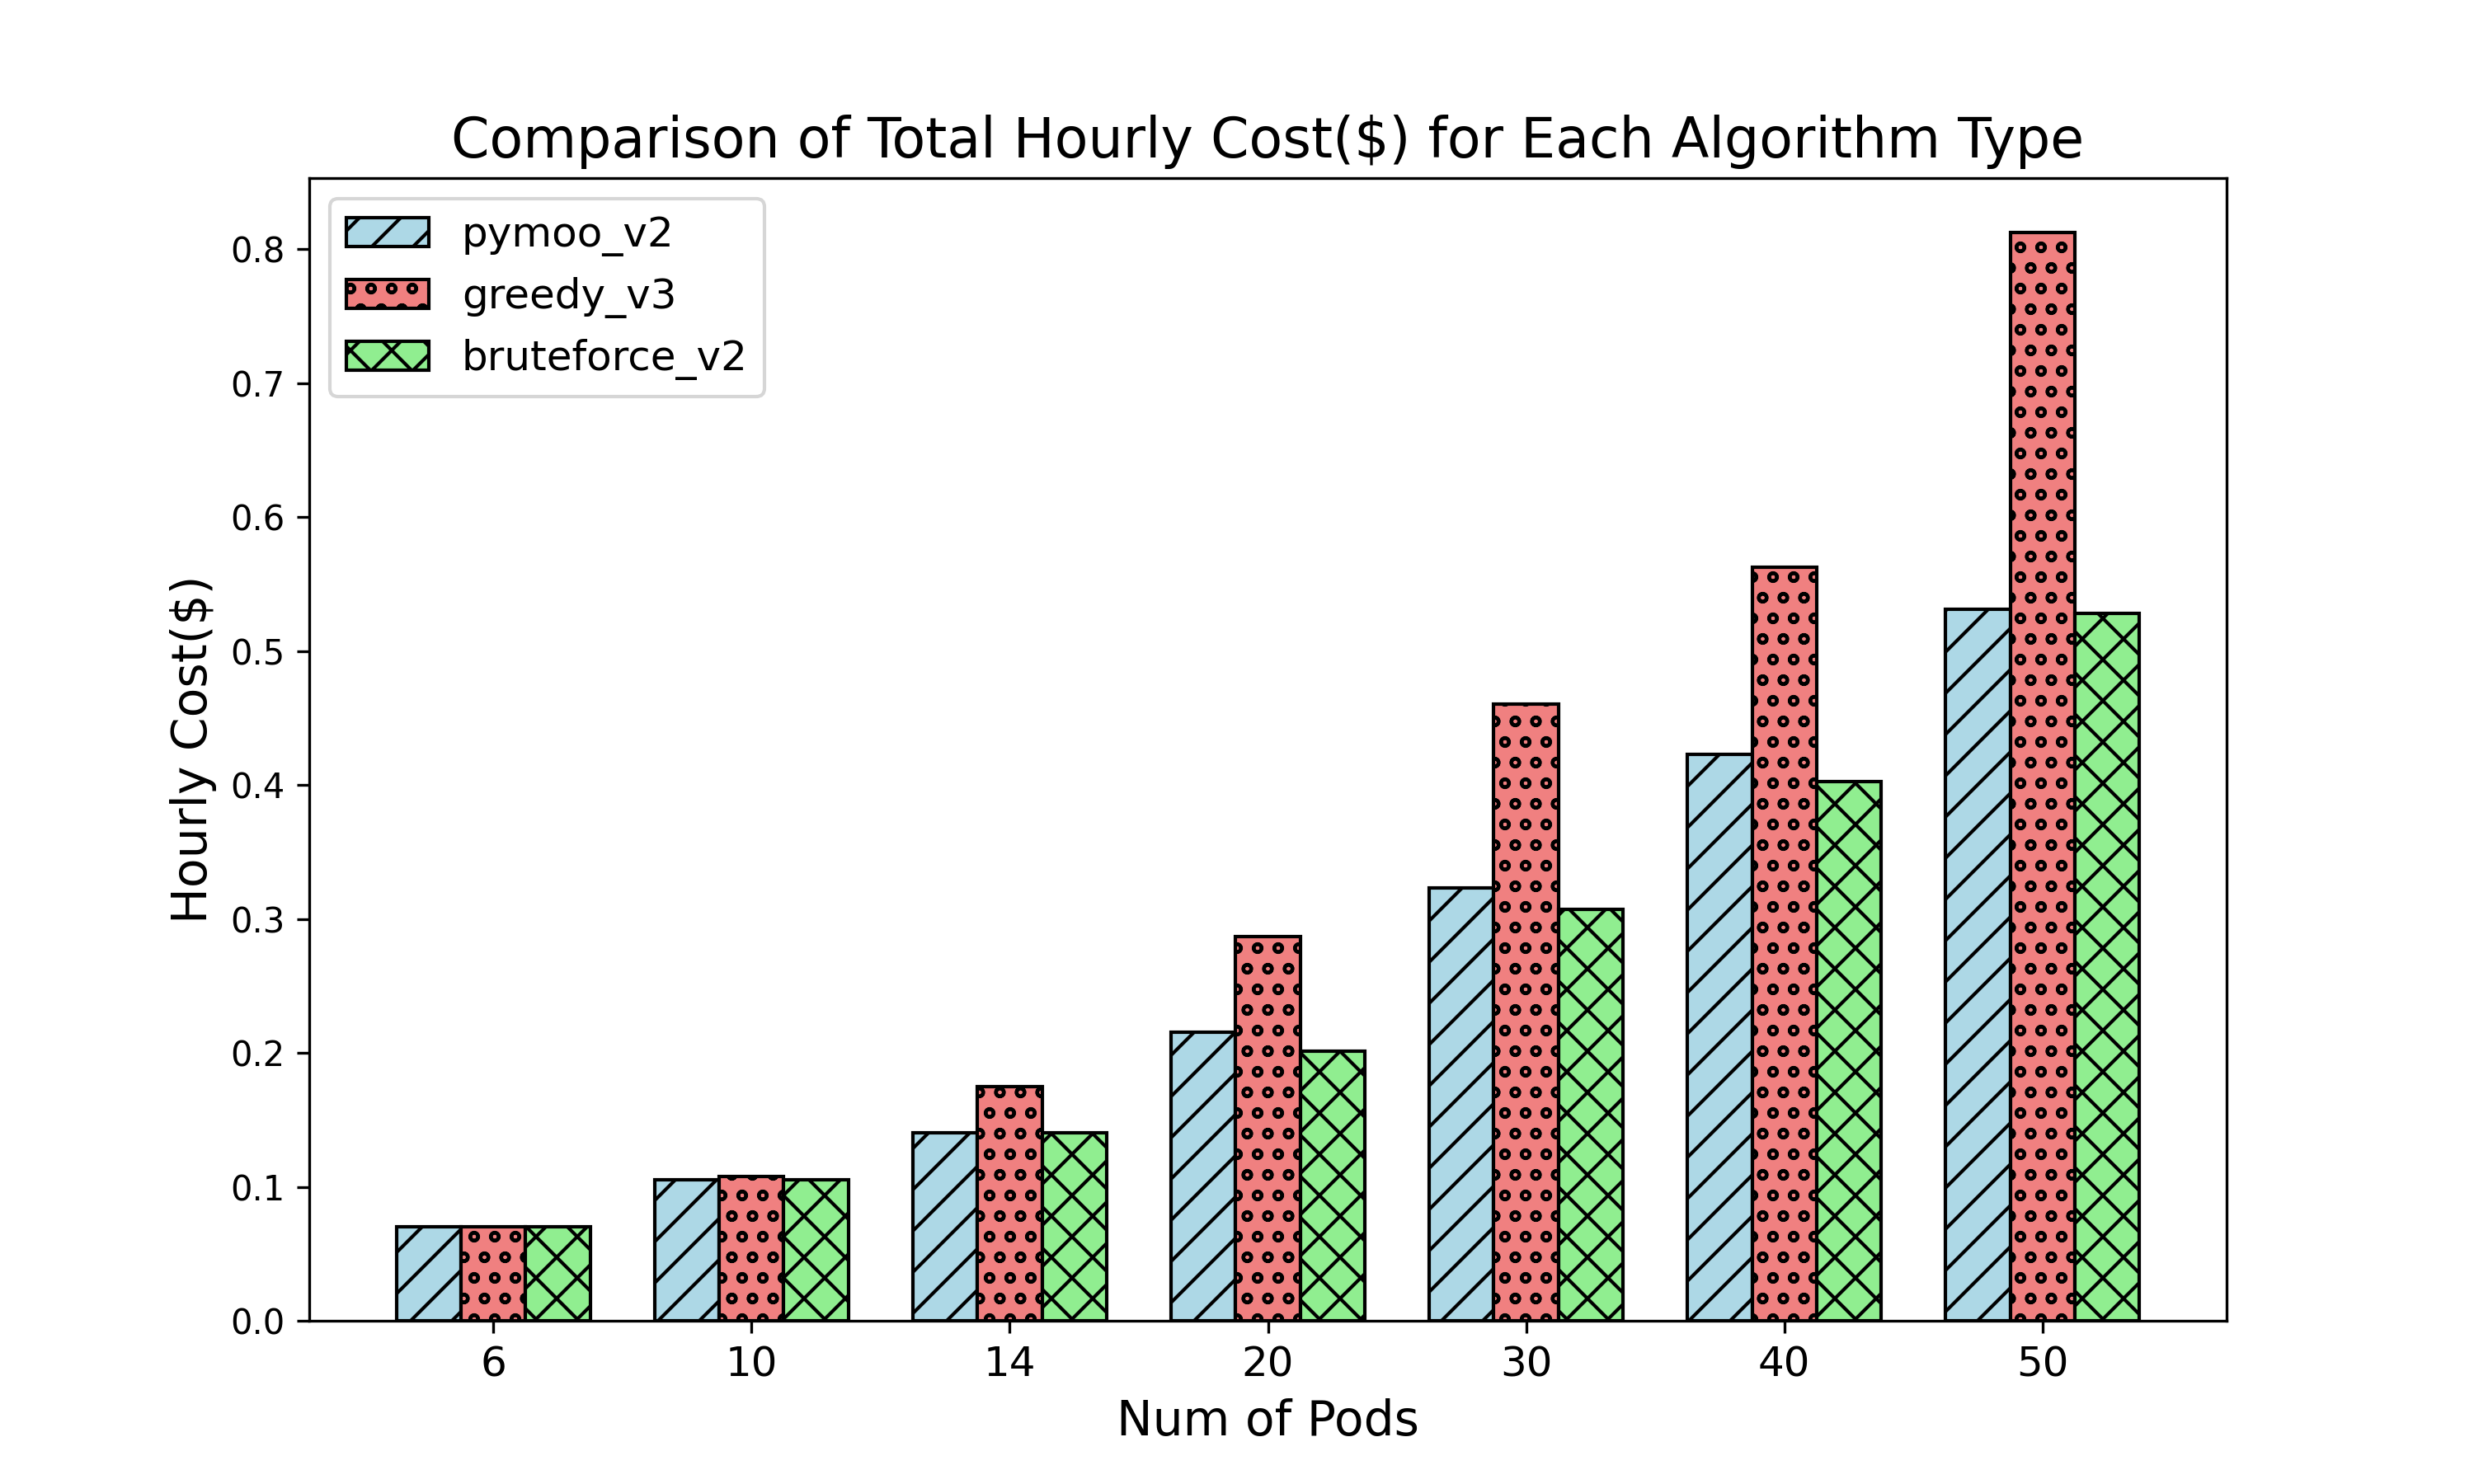
Outcome: Pymoo performs well by identifying the most cost-optimal node combination
Node Count Comparison
According to the below graph,
-
•
pymoo - Returns the maximum number of nodes
-
•
greedy - Returns a higher number of nodes
-
•
bruteforce - A lower number of node count is returned compared to other approaches
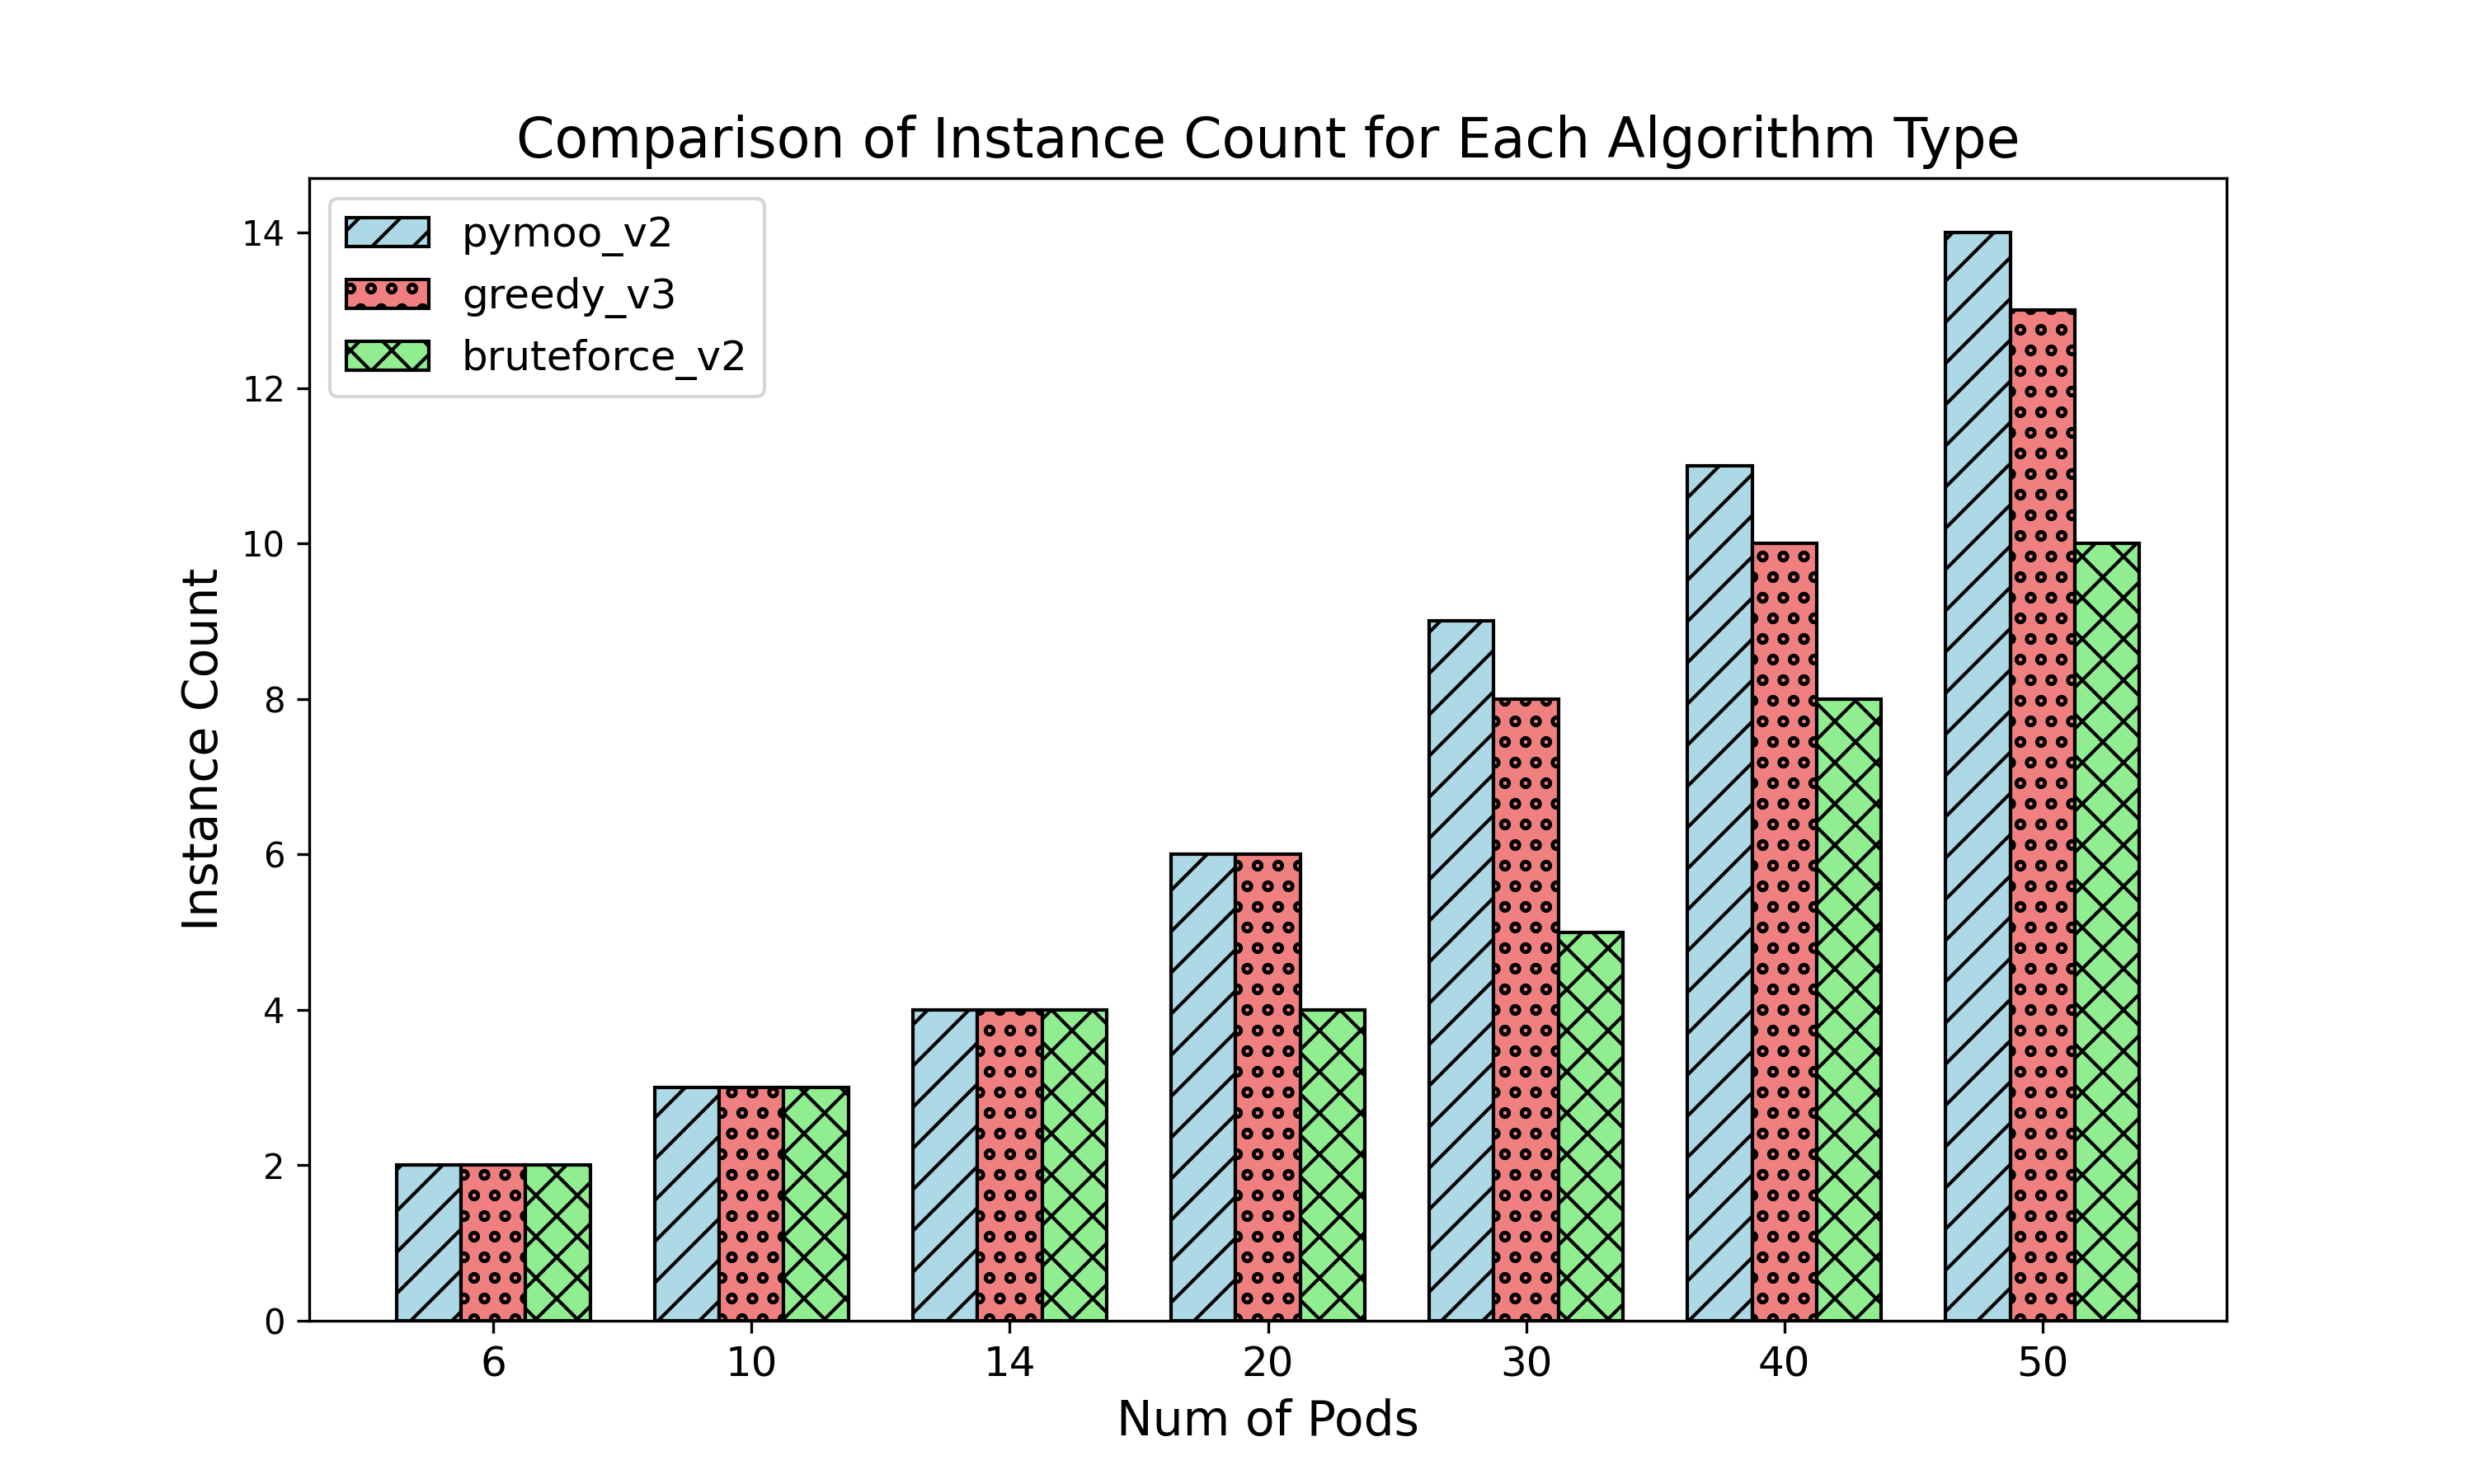
Outcome: Pymoo performs well by identifying the maximum possible node count
Summary
The primary goal of the optimization algorithm is to identify the best trade-off between cost and performance and output the optimal set of node combinations. Cost is calculated using the defined cost model, while the performance is guaranteed by deploying the pods on many nodes. In other words, distributing pods as much as possible. This will ensure that the availability of the system is maintained even in a sudden termination of nodes.
According to the above experiment, Pareto optimization was able to output the best set of nodes where the cost is minimal, and the node count is maximal.
| Service | Initial pod count | Final pod count | Initial node count | Final node count | Time taken (mins) |
| Prime app | 2 | 6 | 1 (t3.medium) | 2 (t3.medium, t3.medium) | 8.1 |
| Prime app | 2 | 10 | 1 (t3.medium) | 3 (t3.medium, t3.medium, m6g.medium) | 7.2 |
| Gateway | 8 | 4 | 2 (t3.medium, t3.medium) | 1 (t3.medium) | 7.7 |
| Gateway | 8 | 15 | 2 (t3.medium, t3.medium) | 4 (t3.medium, t3.medium, c6a.large, t4g.large) | 8.3 |
IV-B4 Elastic Scaler Validation
Elastic Scaler Efficiency Validation
To validate the effectiveness and efficiency of the Elastic Scalar, we deployed several microservices and enabled the HPA. For each pod, we assigned a compute-intensive task and closely monitored the environment using Grafana. The HPA was configured to scale up when the CPU usage exceeded 80%.
Gradually increasing the CPU pressure, we observed that a few nodes surpassed the 80% CPU usage threshold. At this point, the Elastic Scaler detected the change and triggered the optimization engine.
Elastic Scaler and the Optimization Engine decision were taken within 30 seconds while node allocation process took around 6-7 minutes. In comparison, the AWS Cluster Autoscaler with AWS Autoscaling group took less than 30 seconds to make scaling decisions, while the cloud provider required 2 to 8 minutes to create compute resources [20] [21]. Consequently, further research is necessary to decrease the cluster autoscaling time and enhance the performance of node allocation process.
Validation of Cost-Effectiveness of the Elastic Scaler
To assess the cost-effectiveness of our approach, we conducted a comparison between our SpotKube solution and Amazon EKS utilizing spot instances and the Cluster Autoscaler (CA). The Horizontal Pod Autoscaler (HPA) was enabled in both cases. For the comparison, we initially deployed two applications, Prime App and Gateway Service, utilizing the elastic scaler and other SpotKube services. We then sent requests to both applications according to a known pattern for 24 hours. Similarly, we performed the same deployment using EKS and CA, followed by the same request-sending process for 24 hours. We restricted the resource limit of each pod to 0.5 vCPU and 1 GiB of memory. For the node group, we chose the t3.medium, c6a.large, t4g.large, and c6g.xlarge spot instance types.
After the experiment, we calculated that the average pod count per hour was around 50 for both deployments. The resulting average spot instance count and associated cost are presented in the table below, with the left side indicating the cost for the Amazon EKS cluster and the right side representing the cost for the SpotKube cluster.
| EKS (Spot Instance) & CA | SpotKube | ||
| Service | Cost (Hourly $) | Service | Cost (Hourly $) |
| Amazon EKS | 0.10 | VPC | 0 |
| Elastic IP x 1 | 0 | Elastic IP x 2 | 0.01 |
| EC2 (t3.medium) x 1 | 0.0416 | ||
| EC2 (t2.micro) x 1 | 0.0116 | ||
| Spot (t3.medium) x 0 | 0.00 | Spot (t3.medium) x 8 | 0.1328 |
| Spot (c6a.large) x 0 | 0.00 | Spot (c6a.large) x 2 | 0.0610 |
| Spot (t4g.large) x 1 | 0.026 | Spot (t4g.large) x 1 | 0.0268 |
| Spot (c6g.xlarge) x 6 | 0.326 | Spot (c6g.xlarge) x 1 | 0.0544 |
| Total(Hourly $) | 0.4524 | Total(Hourly $) | 0.3382 |
| Total(Monthly $) | 330.25 | Total(Monthly $) | 246.88 |
The findings reveal a significant cost saving of up to 25% through the utilization of our SpotKube approach when compared to Amazon EKS with spot instances and Cluster Autoscaler. This highlights the cost-efficiency and economic advantages offered by our solution.
V DISCUSSION
In this discussion, we critically analyze and delve into the effectiveness of SpotKube, a framework designed to address these challenges through innovative approaches such as application characterization, elastic cluster autoscaling, and integration of spot pricing models.
V-A Effectiveness of Application Characterization
Application characterization is responsible for determining the initial number of pods (replicas) that need to be deployed without violating the user-defined SLOs. Due to the dynamic nature of microservice applications, SpotKube is only considered for CPU-intensive applications, and for the deployment, homogeneous pods are considered. As described in the methodology section, each microservice is subjected to a load test, and results were analyzed to determine the required pod count without violating SLOs. The data we collected through the load test consist of CPU usage and the failure rate per given load (RPS). Through experiments, we identified that by analysing the failure rates and CPU usage data related to the load test, we can determine the maximum RPS value that can be handled by a pod. Then, by mapping this RPS value with the SLO (Minimum RPS value that a microservice should handle), we were able to determine the initial pod count that needed to be deployed. Experimental results show that the default behaviour of Kubernetes with the HPA encountered some failures during pod scaling, while SpotKube is able to satisfy the user-defined SLOs without any failure. Although this can be thought of as an over-provisioning mechanism, due to the usage of spot instances, cost has been reduced significantly, and the application performance is maintained without any failures.
V-B Elastic Cluster Autoscaling through Pareto Optimization
The elastic resource allocation mechanism within the SpotKube dynamically adjusts the deployment of applications based on microservices architecture, taking into consideration the current spot market prices and the demand of the application. The elastic cluster autoscaler employs the default Horizontal Pod Autoscaler (HPA) for the autoscaling of pods. This process is triggered once the total CPU utilization of the cluster surpasses an 80% threshold or falls below a 30% threshold, at which point the optimization engine is invoked to perform the necessary resource allocation or deallocation within the cluster. The determination of these specific threshold values, 80% and 30%, was informed by an extensive review of existing literature as well as iterative trials and errors, to maintain the required performance of the application.
A significant contribution of the SpotKube framework is the utilization of a genetic algorithm for Pareto optimization, which facilitates an exploration of the cost-performance trade-offs to identify optimal deployment configurations. The experimental evaluation of this approach highlights its efficacy in identifying efficient solutions, with a particular focus on the algorithm’s execution time. According to the Time Comparison graph, Pareto optimization consistently determines the most cost-effective and performance-optimal spot instances that should be attached to the cluster within a nearly uniform duration across various deployment scenarios. This aspect of the optimization algorithm, which strategically determines the most cost-effective set of spot instances while maximizing the count of instances to distribute the workload broadly, represents a proactive strategy to mitigate the risk associated with the abrupt termination of spot instances.
The capability of the cluster autoscaler to dynamically scale clusters is evident, yet it is not without its limitations. Specifically, in the context of Amazon EKS, the autoscaler requires a minimum of 2 minutes to integrate a new node into the cluster, with the process potentially extending up to 8 minutes. Conversely, experimental observations have indicated that the Spotkube Elastic Scaler averages a scaling-up period of about 6-8 minutes. These experiments were conducted using an Ubuntu AMI, onto which all necessary software packages were installed via Ansible. This approach significantly leads to the extended duration required for scaling operations. We assume that employing a custom AMI, pre-equipped with all requisite packages, could notably accelerate the scaling process.
V-C Integration of Spot Pricing and Cost -Effectiveness of SpotKube
SpotKube’s most significant innovation lies in its strategic use of spot instances within cloud environments to optimize microservices deployment costs. Unlike traditional cost optimization approaches that may not fully leverage the cost-saving potential of spot pricing due to its inherent volatility, SpotKube integrates spot instance pricing models with Kubernetes. This enables dynamic cluster autoscaling that significantly reduces operational costs while maintaining service performance. A notable feature of SpotKube is its machine learning-based, real-time spot price prediction mechanism, which thoroughly analyzes the spot market for each instance type. The robustness of this predictive approach is evidenced by the low Root Mean Square Error (RMSE) values obtained from experimental validations.
Abrupt termination of spot instances is a significant challenge that can cause substantial downtime in the cluster, directly impacting system availability. To mitigate this, SpotKube employs a mix of novel and traditional techniques. One strategy is to strategically request spot instances at a bid higher than the forecasted spot price, yet still below the cost of on-demand instances. Another technique involves allocating a mix of spot instances from different instance families and availability zones. Furthermore, our optimization strategy focuses on minimizing costs while maximizing the total node count. By maximizing node count, SpotKube distributes the workload as much as possible, thereby maintaining system availability even with the sudden termination of a node. Additionally, SpotKube utilizes AWS’s abrupt termination signals to handle node termination and pod rescheduling gracefully. This is managed by the elastic scaler and optimization engine.
The findings illustrate SpotKube’s efficiency in achieving cost reductions of over 25% compared to other spot-instance-based deployment methodologies, specifically within the context of Amazon Elastic Kubernetes Service (EKS).
VI CONCLUSIONS and FUTURE WORKS
In this paper, we present SpotKube, an open-source Kubernetes-managed service that optimizes the deployment cost of microservices applications in public cloud environments. SpotKube facilitates the deployment of microservices by analyzing application characteristics to maximize cost savings through cluster autoscaling and transient pricing models like AWS spot pricing. It also effectively handles abrupt spot instance terminations to maintain high availability. Our experimental results demonstrate that SpotKube can achieve cost savings of up to 25% compared to other spot-instance-based approaches while still meeting user-defined SLOs.
As future work, we plan to enhance SpotKube’s capabilities to support for heterogeneous pod deployment. which will enable SpotKube to optimize the deployment of applications that use different hardware configurations, enabling better resource utilization and cost savings. We aim to enhance the performance of Elastic Scalar by minimizing the time it takes for scaling operations.
In summary, this research demonstrates the potential of leveraging spot pricing in public cloud environments to reduce costs through cluster auto scaling while maintaining application performance, and future works aim to improve and expand SpotKube’s capabilities to further optimize microservices deployment in cost-optimized manner.
References
- [1] SoftClouds, “The future of software development with microservices.” https://softclouds.medium.com/the-future-of-software-development-with-microservices-5f4d263272b0, Feb 2020.
- [2] A. Jindal, V. Podolskiy, and M. Gerndt, “Performance modeling for cloud microservice applications,” in Proceedings of the 2019 ACM/SPEC International Conference on Performance Engineering, pp. 25–32, 2019.
- [3] J. Han, Y. Hong, and J. Kim, “Refining microservices placement employing workload profiling over multiple kubernetes clusters,” IEEE access, vol. 8, pp. 192543–192556, 2020.
- [4] J. Altmann and M. M. Kashef, “Cost model based service placement in federated hybrid clouds,” Future Generation Computer Systems, vol. 41, pp. 79–90, 2014.
- [5] A. Baldominos Gómez, Y. Saez, D. Quintana, and P. Isasi, “Aws predspot: Machine learning for predicting the price of spot instances in aws cloud,” 2022.
- [6] “Kubernetes.” https://kubernetes.io/. (Accessed on 11/16/2022).
- [7] H. Sami, A. Mourad, H. Otrok, and J. Bentahar, “Fscaler: Automatic resource scaling of containers in fog clusters using reinforcement learning,” in 2020 international wireless communications and mobile computing (IWCMC), pp. 1824–1829, IEEE, 2020.
- [8] M. Rodriguez and R. Buyya, “Container orchestration with cost-efficient autoscaling in cloud computing environments,” in Handbook of research on multimedia cyber security, pp. 190–213, IGI global, 2020.
- [9] M. Yan, X. Liang, Z. Lu, J. Wu, and W. Zhang, “Hansel: Adaptive horizontal scaling of microservices using bi-lstm,” Applied Soft Computing, vol. 105, p. 107216, 2021.
- [10] B. Thurgood and R. G. Lennon, “Cloud computing with kubernetes cluster elastic scaling,” in Proceedings of the 3rd International Conference on Future Networks and Distributed Systems, pp. 1–7, 2019.
- [11] S. G. Domanal and G. R. M. Reddy, “An efficient cost optimized scheduling for spot instances in heterogeneous cloud environment,” Future Generation Computer Systems, vol. 84, pp. 11–21, 2018.
- [12] H. Gu, X. Li, M. Liu, and S. Wang, “Scheduling method with adaptive learning for microservice workflows with hybrid resource provisioning,” International Journal of Machine Learning and Cybernetics, vol. 12, no. 10, pp. 3037–3048, 2021.
- [13] A. Bento, F. Araujo, and R. Barbosa, “Cost-availability aware scaling: Towards optimal scaling of cloud services - journal of grid computing,” Dec 2023.
- [14] “Locust - a modern load testing framework.” https://locust.io/. (Accessed on 04/05/2023).
- [15] “Prometheus - monitoring system & time series database.” https://prometheus.io/. (Accessed on 04/05/2023).
- [16] “describe-spot-price-history — aws cli 1.27.116 command reference.” https://docs.aws.amazon.com/cli/latest/reference/ec2/describe-spot-price-history.html. (Accessed on 04/21/2023).
- [17] C. B. A. Satrio, W. Darmawan, B. U. Nadia, and N. Hanafiah, “Time series analysis and forecasting of coronavirus disease in indonesia using arima model and prophet,” Procedia Computer Science, vol. 179, pp. 524–532, 2021.
- [18] “A fast and elitist multiobjective genetic algorithm: Nsga-ii — ieee journals & magazine — ieee xplore.” https://ieeexplore.ieee.org/document/996017. (Accessed on 05/16/2023).
- [19] Amazon Web Services, “AWS/AWS-node-termination-handler: Gracefully handle EC2 instance shutdown within kubernetes.” https://github.com/aws/aws-node-termination-handler. Accessed: Feb. 19, 2024.
- [20] B. R. Kanthimathinathan, Reducing instance acquisition lag to improve scaling out in the kubernetes cluster. PhD thesis, Dublin, National College of Ireland, 2022.
- [21] Amazon Web Services, “Cluster autoscaler - eks best practices guides.” https://aws.github.io/aws-eks-best-practices/cluster-autoscaling/.