XXXX-XXXX
Medium effects of charged-hadron production in and collisions at LHC energies using modified Tsallis distribution
Abstract
The transverse momentum () spectra of charged hadrons in , and collisions
at TeV are presented here within the rapidity
range of . We study the medium effects, which is produced by heavy ion collisions,
on the behaviour of charged hadrons, by using a phenomenological fit function. These effects are attributed to two main factors:
the transverse collective flow and the the energy loss of charged hadrons due to multiple scatterings. We observe the transverse
collective flow at low and intermediate region and the energy loss at high region.
Here we take all the published data from the ATLAS collaboration.
Charged hadron spectra, Quark Gluon Plasma, Collective Flow, Energy loss
1 Introduction
The RHIC (Relativistic Heavy Ion Collider) RHIC1 ; RHIC2 and the LHC (Large Hadron Collider) LHC are
designed to study an elusive state of matter known as Quark Gluon Plasma (QGP) Shuryak .
The QGP is a thermalized state of matter where quarks and gluons are deconfined and free to move independently.
Scientists believe that such a state would have existed in the early Universe shortly after the Big Bang Olive ; Schwarz .
There are many heavy-ion collisions performed at RHIC such as , , etc
and many at LHC as , etc. The collisions are taken as a baseline for collisions involving heavy ions PPPROD .
The particles produced in both and heavy ion () collisions are the results of multiple
scatterings among partons. The distribution of spectra in
collisions provides insights into the state of the matter when particles stop interacting at freeze-out state.
Recent high-multiplicity collisions data from the LHC HighMul ; HighMul2 predicts the formation of a quark-gluon plasma-like medium.
In high energy collisions between heavy ions (like lead or gold), the momentum distribution of emitted hadrons
exhibits extra effects that happen after the initial collision. These effects include the collective flow Collective_flow
of hadrons, caused by the expansion of a hot Recom_Model1 ; Recom_Model2 , dense matter formed in the collision and
jet quenching Jet_Quenching , where high energy sprays of particles lose energy as they travel through the dense environment.
In collisions, researchers analyze the spectra of hadrons using a Tsallis distribution Tsallis:1987eu ; Biro:2008hz
characterized by two parameters and PPG099 . While the parameter corresponds to the kinetic freeze-out temperature
in heavy ion collisions, where particles stop interacting elastically, its interpretation in collisions is less clear
compared to different types of collisions. The parameter , known as the nonextensive parameter indicates how much the system
deviates from complete thermalization q_Tsallis . It captures variations in the system’s temperature
IJMPA_Khandai ; Wong:2012zr ; Wong:2013sca . The Tsallis distribution, which models systems close to thermal equilibrium,
resembles Hagedorn’s power law, which is employed in hard scattering processes in QCD Hagedorn:1983wk ; Blankenbecler:1974tm .
This work focuses on the distribution of charged hadrons in , and collisions at TeV from the data of ATLAS collaboration ATLAS:2022kqu in the rapidity range of . We employ the new Modified Tsallis distribution to describe the transverse flow and in medium energy loss JPC_Kapil ; Khandai of hadrons in the medium. Both systematic and statistical uncertainties are combined and incorporated into the fitting process.
2 Tsallis/Hagedorn distribution function and the modification
The transverse mass () distribution of particles produced in hadronic collisions can be described by the Hagedorn function which is a QCD-inspired summed power law Hagedorn:1983wk given as
| (1) |
This function describes both the bulk spectra in the low region and the particles produced in QCD hard scatterings reflected in the high region. Let us compare this function with the Tsallis distribution Tsallis:1987eu ; Biro:2008hz of thermodynamic origin given by
| (2) |
The Tsallis distribution describes near-thermal systems in terms of Tsallis parameter and the parameter which measures degree of non-thermalization q_Tsallis . The functions in Eq. 1 and in Eq. (2) have similar mathematical forms with and . Larger values of correspond to smaller values of . Both and have been interchangeably used in Tsallis distribution Biro:2008hz ; Adare:2010fe ; Cleymans:2012ya ; Adare:2011vy ; Abelev:2006cs . Phenomenological studies suggest that, for quark-quark point scattering, Blankenbecler:1975ct ; Brodsky:2005fza , which grows larger if multiple scattering centers are involved. The study in Ref. Zheng:2015mhz suggests that both the forms given in Eq. 1 and in Eq. (2) give equally good fit to the hadron spectra in collisions. We use Eq. (2) in case of collisions.
Tsallis/Hagedorn function is able to describe spectra in collisions practically at all generations of proton colliders. There have been many attempts to use the Tsallis distribution in heavy ion collisions as well by including the transverse collective flow Tang:2008ud ; Khandai:2013fwa ; Sett:2015lja . In addition, in heavy ion collisions, particle spectra at high are known to be modified due to in-medium energy loss. The Tsallis/Hagedorn distribution can be modified by including these final state effects in different regions as follows:
| (3a) | ||||
| (3b) | ||||
The first function (Eq. 3a) is shown to govern the thermal and collective part of the hadron spectrum with the temperature and the average transverse flow velocity Khandai:2013fwa .
The second function (Eq. 3b) is obtained after shifting the distribution in Eq.1 by energy loss in the medium as
| (4) |
The energy loss is proportional to at low and in general can be parameterized similar to the work in Ref. Spousta:2016agr as
| (5) |
Here, the parameter quantifies different energy loss regimes for light quarks in the medium Baier:2000mf ; De:2011fe . The parameter is proportional to the medium size and is an arbitrary scale set as 1 GeV. Using Eq. (5) in Eq. 4 and ignoring 1 we get Eq. (3b) applicable for high . In our study, we find that this function describes the particle spectra at above 7 GeV/. Fits to the data would constrain the value of and thus is not an independent parameter. The empirical parton energy loss in nuclear collisions at RHIC energies is found to be proportional to Wang:2008se .
3 Results and discussions
3.1 collisions at = 5.02 TeV
Figure (1) shows the invariant yields of the charged particles as a function of for collisions at = 5.02 TeV measured by the ATLAS experiment ATLAS:2022kqu . The solid curves are the Tsallis distributions fitted to the spectra. The Tsallis distribution function gives good description of the data for both the collision energies which can be inferred from the values of given in the Table (1).
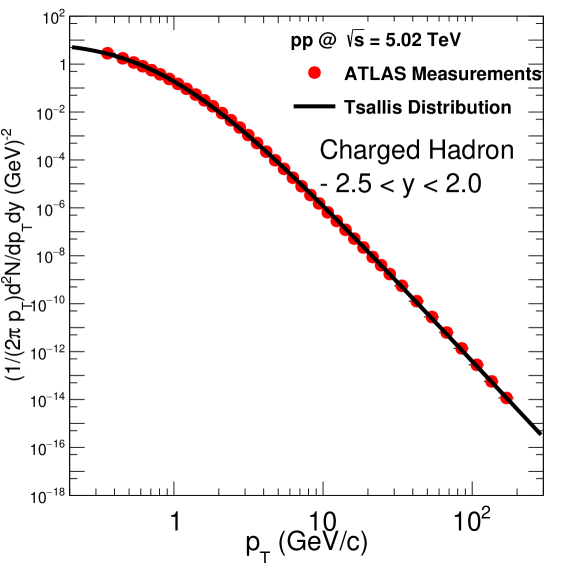
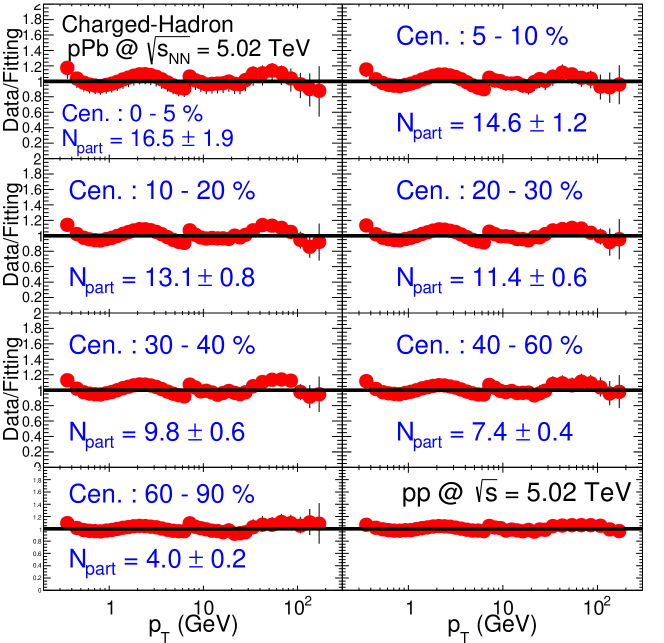
Figure (2) shows the invariant yields of the charged particles as a function of for different centrality classes in collisions at = 5.02 TeV measured by the ATLAS experiment ATLAS:2022kqu . The solid curves are the fitted Tsallis distributions. Figure (3) shows the ratio of the data and the fitted Tsallis distribution as a function of for collisions at = 5.02 TeV. ATLAS measured data of and collisions show deviations from the fit which can be inferred from the values of given in the Table (2).
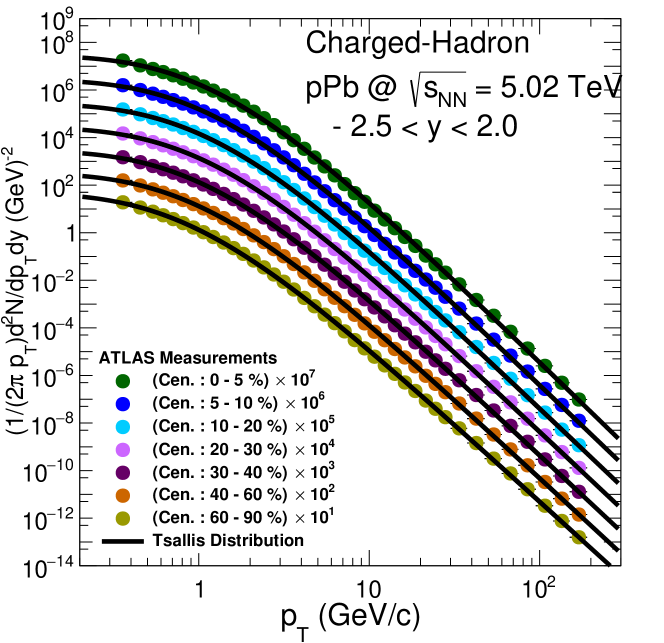
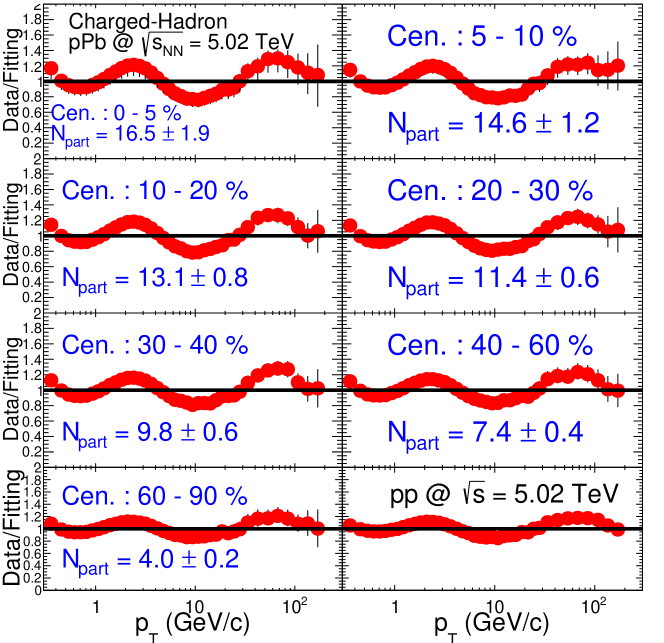
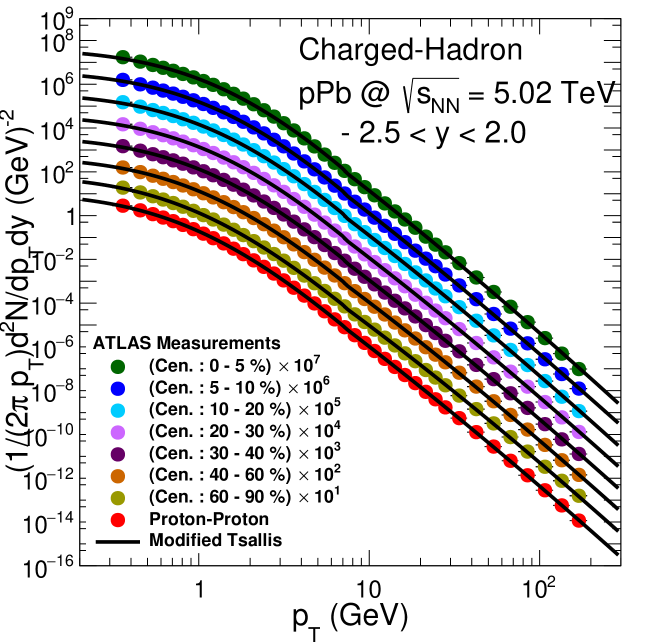
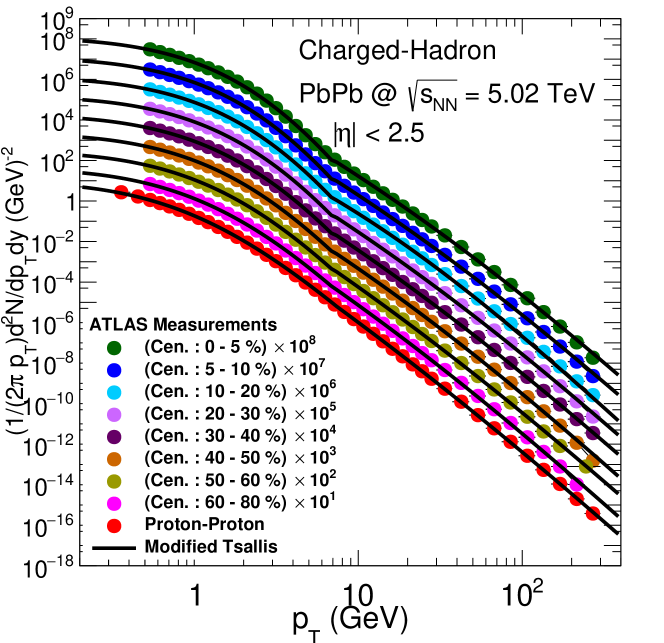
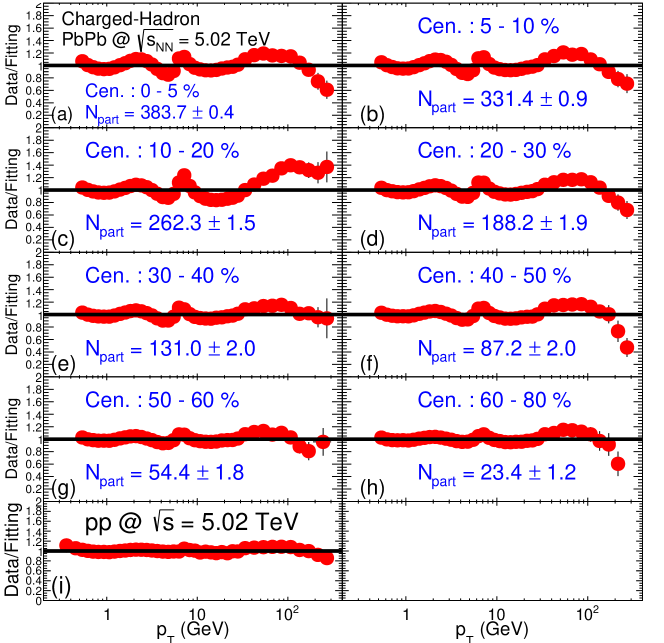
Figure (4) shows the invariant yields of the charged particles as a function of for different centrality classes in collisions at = 5.02 TeV measured by the ATLAS experiment ATLAS:2022kqu . The solid curves are the modified Tsallis distributions given by Eq. (3a and 3b). Figure (5) shows the ratio of the data and the fit function by the modified Tsallis distribution as a function of for different centrality classes in collisions at = 5.02 TeV. The ratio of the data and the fit function shows that modified Tsallis distribution function gives excellent description of the measured data in full range for all centrality classes. The parameters of the modified Tsallis distribution are given in the Table (3). The values of the first set of parameters (, , ) are constant for differnt ramge of pseudo-rapidities. While fitting the second function, we fix the parameter guided by value. The exponent which decides the variation of the energy loss of partons as a function of their energy remains same. In conclusion, the function given in Eq. ( 3a and 3b) gives excellent description of the hadron spectra over wide range of with its parameters indicating different physics effects in the collisions.
3.2 collisions at = 5.02 TeV
Figure (6) shows the invariant yields of the charged particles as a function of for collisions at = 5.02 TeV measured by the ATLAS experiment ATLAS:2022kqu . The solid curves are the Tsallis distributions fitted to the spectra. The Tsallis distribution function gives good description of the data for both the collision energies which can be inferred from the values of given in the Table (4).
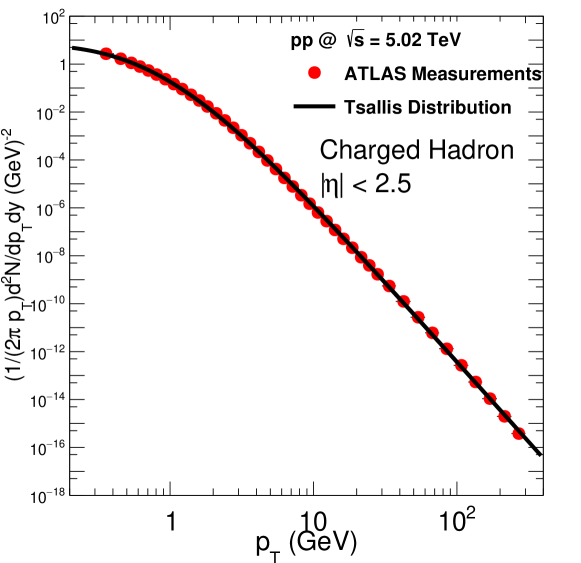
Figure (7) shows the invariant yields of the charged particles as a function of for different centrality classes in collisions at = 5.02 TeV measured by the ATLAS experiment ATLAS:2022kqu . The solid curves are the fitted Tsallis distributions. Figure (8) shows the ratio of the data and the fitted Tsallis distribution as a function of for collisions at = 5.02 TeV. ATLAS measured data of and collisions show deviations from the fit which can be inferred from the values of given in the Table (5).
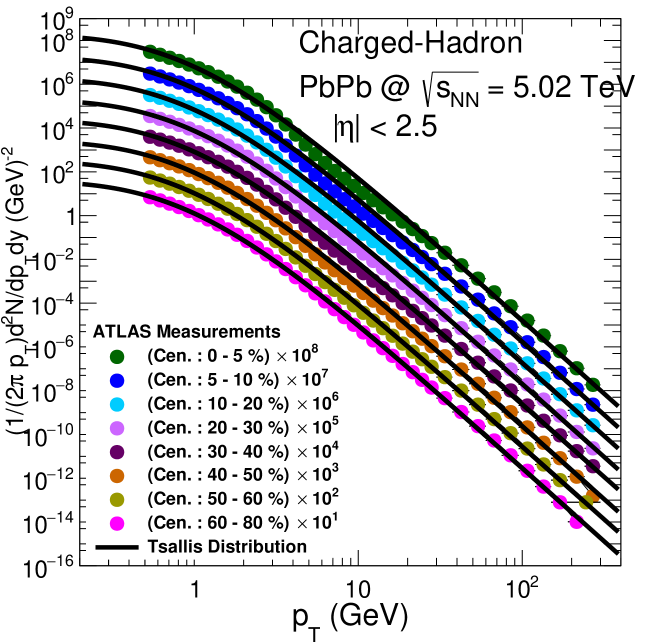
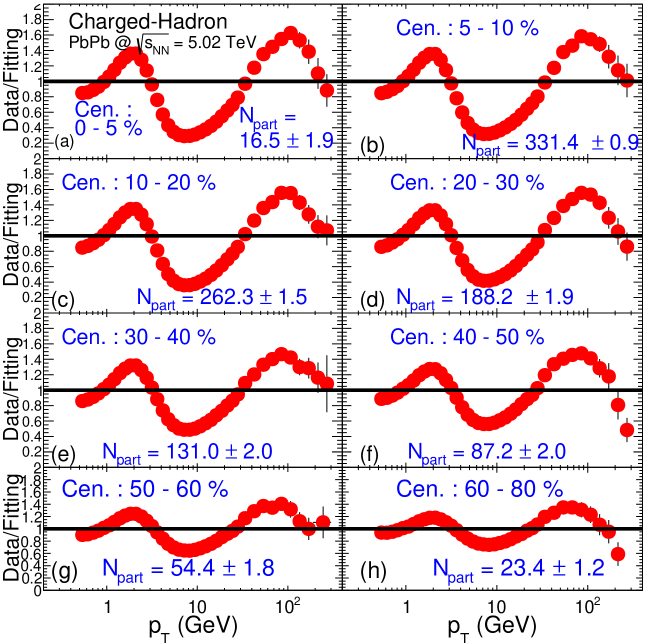
Figure (9) shows the invariant yields of the charged particles as a function of for different centrality classes in collisions at = 5.02 TeV measured by the ATLAS experiment ATLAS:2022kqu . The solid curves are the modified Tsallis distributions given by Eq. (3a and 3b). Figure (10) shows the ratio of the data and the fit function by the modified Tsallis distribution as a function of for different centrality classes in collisions at = 5.02 TeV. The ratio of the data and the fit function shows that modified Tsallis distribution function gives excellent description of the measured data in full range for all centrality classes. The parameters of the modified Tsallis distribution are given in the Table (6). The values of the first set of parameters (, , ) are constant for differnt ramge of pseudo-rapidities. While fitting the second function, we fix the parameter guided by value. The exponent which decides the variation of the energy loss of partons as a function of their energy remains same. In conclusion, the function given in Eq. ( 3a and 3b) gives excellent description of the hadron spectra over wide range of with its parameters indicating different physics effects in the collisions.
4 Conclusion
In the article, we carried out an analysis of transverse momentum spectra of charged hadron in , and collisions at = 5.02 TeV. We first use the Tsallis distribution to describe the spectra of charged hardons in and collisions. We found that Tsallis distribution does not describe the spectra properly. We see a suppression of spectra above 7GeV/c. To describe and explain the spectra of the charged hadrons, we use the modified Tsallis distribution by incorporating the medium effects. Here we fit the spectra of charged hadrons in different centralities of and collisons at = 5.02 TeV using modified Tsallis distribution. We observe the effect of transverse flow in the low-to-intermediate region ( 7.0 GeV/c) and in-medium energy loss in the high region ( 7GeV/c). We found that in the low (to intermediate) region the parameters and are more in central collisions and are gradually decreasing towards peripheral collisions. This is due to the larger number of multi-scatterings phenomena occurring among partons in the central collisions than the peripheral collisions. So there is a transverse collective flow observed among particles in this region. In the high region the exponent which decides the variation of the energy loss of partons as a function of their energy remains within 0.59 to 0.73 in collisions at = 5.02 TeV, 0.32 to 0.59 in collisions at = 5.02 TeV. So, finally, we can say that a simple modification in the Tsallis distribution gives excellent description of charged particle spectra with its parameters having potential to quantify various in-medium effects in and collisions.
5 Appendix :: Table : collisions = 5.02 TeV
| Rapidity | ||||
|---|---|---|---|---|
| () | (MeV) | |||
| - 2.5 2.0 | 7.67 0.10 | 1.13 | 84.78 5.46 | 0.05 |
| Centrality | |||||
|---|---|---|---|---|---|
| () | (MeV) | ||||
| 0 - 5 | 16.50 1.90 | 7.97 0.11 | 1.13 | 116.26 5.98 | 0.16 |
| 5 - 10 | 14.60 1.20 | 7.88 0.11 | 1.13 | 112.85 6.14 | 0.15 |
| 10 - 20 | 13.10 0.80 | 7.83 0.10 | 1.13 | 110.56 5.40 | 0.14 |
| 20 - 30 | 11.40 0.60 | 7.77 0.10 | 1.13 | 107.15 5.54 | 0.13 |
| 30 - 40 | 9.80 0.60 | 7.73 0.10 | 1.13 | 104.12 5.56 | 0.11 |
| 40 - 60 | 7.40 0.40 | 7.65 0.10 | 1.13 | 98.44 5.70 | 0.09 |
| 60 - 90 | 4.00 0.20 | 7.53 0.10 | 1.13 | 86.65 5.77 | 0.05 |
| System | Centrality | |||||||
|---|---|---|---|---|---|---|---|---|
| () | (GeV/) | (GeV/) | ||||||
| 0 - 5 | 16.50 1.90 | 7.69 2.21 | 1.38 1.55 | 0.13 0.55 | 0.59 0.27 | 2.40 0.75 | 0.05 | |
| 5 - 10 | 14.60 1.20 | 7.36 0.84 | 1.23 0.28 | 0.15 0.30 | 0.63 0.25 | 2.76 1.35 | 0.05 | |
| 10 - 20 | 13.10 0.80 | 7.32 1.88 | 1.22 0.79 | 0.13 0.12 | 0.59 0.13 | 2.72 0.47 | 0.05 | |
| 20 - 30 | 11.40 0.60 | 7.20 2.19 | 1.16 0.81 | 0.13 0.19 | 0.60 0.05 | 2.90 0.38 | 0.04 | |
| 30 - 40 | 9.80 0.60 | 7.12 1.96 | 1.11 0.68 | 0.13 0.10 | 0.60 0.05 | 2.95 0.38 | 0.04 | |
| 40 - 60 | 7.40 0.40 | 6.99 2.03 | 1.02 0.64 | 0.13 0.09 | 0.59 0.05 | 3.08 0.39 | 0.03 | |
| 60 - 90 | 4.00 0.20 | 6.78 2.30 | 0.86 0.45 | 0.12 0.10 | 0.57 0.04 | 3.26 0.39 | 0.02 | |
| - | - | 6.94 2.36 | 0.86 1.17 | 0.12 0.10 | 0.61 0.05 | 2.92 0.37 | 0.01 |
6 Appendix :: Table : collisions = 5.02 TeV
| Rapidity | ||||
|---|---|---|---|---|
| () | (MeV) | |||
| - 2.5 2.0 | 7.70 0.09 | 1.13 | 86.19 5.31 | 0.05 |
| Centrality | |||||
|---|---|---|---|---|---|
| () | (MeV) | ||||
| 0 - 5 | 383.70 0.40 | 7.71 0.07 | 1.13 | 94.07 5.22 | 1.05 |
| 5 - 10 | 331.40 0.90 | 7.70 0.10 | 1.13 | 95.28 8.90 | 0.98 |
| 10 - 20 | 262.30 1.50 | 7.70 0.12 | 1.13 | 95.85 11.09 | 0.87 |
| 20 - 30 | 188.20 1.90 | 7.71 0.10 | 1.13 | 96.33 8.36 | 0.73 |
| 30 - 40 | 131.00 2.00 | 7.67 0.09 | 1.13 | 94.27 7.99 | 0.58 |
| 40 - 50 | 87.20 2.00 | 7.71 0.10 | 1.13 | 95.12 7.83 | 0.43 |
| 50 - 60 | 54.40 1.80 | 7.68 0.11 | 1.13 | 92.76 7.63 | 0.29 |
| 60 - 80 | 23.40 1.20 | 7.72 0.11 | 1.13 | 92.51 7.39 | 0.16 |
| System | Centrality | |||||||
|---|---|---|---|---|---|---|---|---|
| () | (GeV/) | (GeV/) | ||||||
| 0 - 5 | 383.70 0.40 | 10.85 0.43 | 2.00 1.77 | 0.28 0.10 | 0.49 0.05 | 4.97 0.57 | 0.06 | |
| 5 - 10 | 331.40 0.90 | 10.72 0.44 | 2.00 1.06 | 0.27 0.10 | 0.50 0.13 | 4.83 0.71 | 1.29 | |
| 10 - 20 | 262.30 1.50 | 10.56 0.47 | 2.00 1.03 | 0.25 0.11 | 0.32 0.06 | 4.61 0.67 | 1.28 | |
| 20 - 30 | 188.20 1.90 | 10.35 0.72 | 2.00 1.23 | 0.21 0.12 | 0.50 0.14 | 4.26 0.60 | 0.07 | |
| 30 - 40 | 131.00 2.00 | 10.09 0.96 | 2.00 1.41 | 0.15 0.09 | 0.52 0.12 | 4.02 0.55 | 0.02 | |
| 40 - 50 | 87.20 2.00 | 8.61 4.54 | 1.43 1.27 | 0.24 0.13 | 0.48 0.17 | 3.61 0.49 | 1.16 | |
| 50 - 60 | 54.40 1.80 | 7.96 4.10 | 1.22 0.83 | 0.24 0.17 | 0.55 0.16 | 3.56 0.77 | 0.02 | |
| 60 - 80 | 23.40 1.20 | 7.60 2.35 | 1.11 0.85 | 0.19 0.13 | 0.52 0.21 | 3.01 0.52 | 0.02 | |
| - | - | 7.45 0.52 | 1.11 0.74 | 0.02 0.01 | 0.59 0.12 | 2.86 0.65 | 0.01 |
References
- (1) PHENIX Collab. (K. Adcox et. al.), Nucl. Phys. A 757, 184-283 (2005).
- (2) STAR Collab. (J. Adams et al.), Nucl. Phys. A 757, 102-183 (2005).
- (3) LHC Collab. (N. Armesto et al.), J. Phys. G 35, 054001 (2008).
- (4) E. V. Shuryak,Phys. Rept. 61, 71158 (1980).
- (5) K. A. Olive, Science 251, 11941199 (1991).
- (6) D. J. Schwarz, Annalen Phys 12, 220270 (2003).
- (7) F. Becattini and U. Heinz, Z. Phys. C 76, 269 (1997).
- (8) V. Khachatryan et al., (CMS Collaboration), JHEP 09, 091 (2010) arXiv:1009.4122 [hep-ex].
- (9) J. Adam et al. (ALICE Collaboration), Nature Phys. 13, 535 (2017).
- (10) T. Hirano and Y. Nara, Phys. Rev. C 69, 034908 (2004).
- (11) R. Fries et al. Ann. Rev. Nucl. Part. Sci. 58 177-205 (2008), Phys. Rev. Lett. 90, 202303 (2003), Phys. Rev. C 68, 044902 (2003), J. Phys. G 30 S223-S228 (2004).
- (12) R. Fries J. Phys. G 30 S853-S860 (2004).
- (13) X. N. Wang Phys. Lett. B 579, 299 (2004).
- (14) C. Tsallis, J. Statist. Phys. 52 479 (1988).
- (15) T. S. Biro, G. Purcsel and K. Urmossy, Eur. Phys. J. A 40 325 (2009. [arXiv:0812.2104 [hep-ph]].
- (16) A. Adare et al, PHENIX Collaboration, Phys.Rev. D 83 052004 (2011).
- (17) G. Wilk and Z. Wlodarczyk, Phys. Rev. Lett. 84, 2770 (2000).
- (18) P. K. Khandai, P. Sett, P. Shukla and V. Singh, Int. J. Mod. Phys. A 28 (2013) 1350066.
- (19) C. Y. Wong and G. Wilk, Acta Phys. Polon. B 43 2047 (2012), [arXiv:1210.3661 [hep-ph]].
- (20) C. Y. Wong and G. Wilk, Phys. Rev. D 87 114007 (2013), [arXiv:1305.2627 [hep-ph]].
- (21) R. Hagedorn, Riv. Nuovo Cim. 6N10 1 (1983).
- (22) R. Blankenbecler and S. J. Brodsky, Phys. Rev. D 10 2973 (1974).
- (23) [ATLAS], [arXiv:2211.15257 [hep-ex]].
- (24) K. Saraswat, P. Shukla and V. Singh, J. Phys. Commun. 2 035003 (2018).
- (25) P. Kumar, P. K. Khandai, Kapil Saraswat and V. Singh, Int. J. Mod. Phys. A 36 2150059 (2021),
- (26) J. Cleymans and D. Worku, Eur. Phys. J. A 48 (2012) 160, [arXiv:1203.4343 [hep-ph]].
- (27) A. Adare et al. [PHENIX Collaboration], Phys. Rev. C 83 (2011) 064903, [arXiv:1102.0753 [nucl-ex]].
- (28) B. I. Abelev et al. [STAR Collaboration], Phys. Rev. C 75 (2007) 064901, [nucl-ex/0607033].
- (29) A. Adare et al. [PHENIX Collaboration], Phys. Rev. D 83 (2011) 052004, [arXiv:1005.3674 [hep-ex]].
- (30) R. Blankenbecler, S. J. Brodsky and J. F. Gunion, Phys. Rev. D 12 (1975) 3469.
- (31) S. J. Brodsky, H. J. Pirner and J. Raufeisen, Phys. Lett. B 637 (2006) 58, [hep-ph/0510315].
- (32) H. Zheng and L. Zhu, Adv. High Energy Phys. 2016 (2016) 9632126, [arXiv:1512.03555 [nucl-th]].
- (33) Z. Tang, Y. Xu, L. Ruan, G. van Buren, F. Wang and Z. Xu, Phys. Rev. C 79 (2009) 051901, [arXiv:0812.1609 [nucl-ex]].
- (34) P. K. Khandai, P. Sett, P. Shukla and V. Singh, J. Phys. G 41 (2014) 025105, [arXiv:1310.4022 [nucl-th]].
- (35) P. Sett and P. Shukla, Int. J. Mod. Phys. E 24 (2015) 1550046, [arXiv:1505.05258 [hep-ph]].
- (36) M. Spousta, Phys. Lett. B 767 (2017) 10, [arXiv:1606.00903 [hep-ph]].
- (37) R. Baier, D. Schiff and B. G. Zakharov, Ann. Rev. Nucl. Part. Sci. 50 (2000) 37, [hep-ph/0002198].
- (38) S. De and D. K. Srivastava, J. Phys. G 39 (2012) 015001, Erratum: [J. Phys. G 40 (2013) 049502], [arXiv:1107.5659 [nucl-th]].
- (39) G. Wang and H. Z. Huang, Phys. Lett. B 672 (2009) 30, [arXiv:0810.2822 [nucl-ex]].