empty
Sparse Attention-driven Quality Prediction for Production Process Optimization in Digital Twins
Abstract
In the process industry, optimizing production lines for long-term efficiency requires real-time monitoring and analysis of operation states to fine-tune production line parameters. However, the complexity in operational logic and the intricate coupling of production process parameters make it difficult to develop an accurate mathematical model for the entire process, thus hindering the deployment of efficient optimization mechanisms. In view of these difficulties, we propose to deploy a digital twin of the production line by digitally abstracting its physical layout and operational logic. By iteratively mapping the real-world data reflecting equipment operation status and product quality inspection in the digital twin, we adopt a quality prediction model for production process based on self-attention-enabled temporal convolutional neural networks. This model enables the data-driven state evolution of the digital twin. The digital twin takes a role of aggregating the information of actual operating conditions and the results of quality-sensitive analysis, which facilitates the optimization of process production quality with virtual-reality evolution under multi-dimensional constraints. Leveraging the digital twin model as an information-flow carrier, we extract temporal features from key process indicators and establish a production process quality prediction model based on the proposed composite neural network. Our operation experiments on a specific tobacco shredding line demonstrate that the proposed digital twin-based production process optimization method fosters seamless integration between virtual and real production lines. This integration achieves an average operating status prediction accuracy of over 98% and near-optimal production process control.
Index Terms:
Digital twin, self-attention, production line, predictive optimization, machine learning.I Introduction
The process industry serves as a core component across diverse industrial sectors including chemicals, food, pharmaceuticals and petroleum [1]. The operation of process production lines directly impacts product quality and production efficiency, consequently influencing enterprise profits [2]. Nevertheless, ensuring long-term stability and optimal operation of production processes poses a significant challenge, given the involvement of multiple intricate production stages, equipment units and numerous production parameters. Recently, emerging concepts such as intelligent manufacturing, big data-driven state analysis and digital twins have been integrated into the management of the process industry [3, 4]. These advancements offer novel approaches to guarantee long-term stable and optimized operation, specifically related to production quality in the process industry. In light of these developments, conducting research in this domain becomes crucial as it sheds light on new perspectives and solutions for production process optimization, ultimately helping industrial sectors improve product quality while minimizing production costs.
Unlike traditional discrete manufacturing [5], process manufacturing involves a complex sequence of functional stages, where production control often confronts a challenging dynamic optimization problem due to inter-process parameter coupling and conflicts among multiple objectives [6]. These complexities significantly hinder efforts to further improve production quality and resource utilization efficiency in process manufacturing. Fortunately, the emergence of intelligent, data-driven optimization, as a novel decision-making approach, has demonstrated its effectiveness in handling large datasets and facilitating swift, accurate decisions. By integrating data-driven intelligence into manufacturing management, the key to manufacturing process optimization now lies in real-time monitoring of various changes in both production process and product quality, followed by properly coordinating/optimizing all production stages through possibly high-dimensional feedbacks.
Process data in production lines typically manifests as a series of real-time, high-dimensional, and periodic data streams originating from multiple sources. These data streams encode the temporal-spatial interactions among various elements in the production process, and thus can be utilized to model parameter coupling in the industry process [7]. In this study, we integrate different elements of the production process, including materials, equipment, process parameters, and process requirements, into a closely coordinated data-driven model. Our approach relies on the deployment of a digital twin, through establishing a connection and facilitating information exchange between the physical entity of a process production line and its virtual counterpart [4]. By doing so, we propose a production process state-prediction model based on a composite neural network, taking the data of production line evolution from the digital twin as inputs. This approach enables the parallel operation of the digital twin production line and the physical production line. By comparing the output of the digital twin with its physical counterpart, we are able to improve the physical production line through predicting production quality and recommending optimized process parameters without risking the real product quality.
The main contributions of our work are as follows:
-
1)
We propose an iterative framework for real-time state prediction and optimization of process parameters based on digital twins. The digital twin enables collaborative interaction between virtual and physical production lines, thus making it possible for operation optimization of the physical lines through iterative feed-ins from the digital twin side.
-
2)
We integrate the task of production line parameter adjustment into the process of real-time state monitoring and product quality prediction, and propose an heuristic parameter searching approach based on digital twins to address the conflict between quality control and decision efficiency toward optimal production line operation.
-
3)
In this study, we deployed a real digital twin system on a test production line for tobacco shredding. We provide a full scketch of the framework design for our twin system, which demonstates a promising approach for integrating end sensors and actuators in the IoT network, the Manufacturing Execution System (MES), the information processing middleware and the AI functionalities. Our experimental study on the test line showed that the proposed digital twin framework can significantly improve production efficiency and, therefore, can serve as a prototype for applications in other industrial sectors.
The rest of the paper is organized as follows. Section II presents a brief summary of the related works. In Section III, we present the proposed digital twin production line framework and highlight key components for the implementation. Section IV introduces a real-time product quality prediction mechanism based on a composite neural network. Section V then proposes a heuristic parameter optimization method for the production line with multiple constraints, which is built upon the line state prediction using the proposed neural network model. After that, section VI describes system implementation details and validates the efficiency of our proposed framework. Finally, section VIII concludes the paper.
II Related Work
II-A Data-Driven Quality Prediction and Quality Control in Process Industries
In recent years, the evolution of industrial Internet technology has enabled process manufacturing enterprises to gather substantial historical data on production process characteristics, equipment operation, and quality indicators, utilizing Industrial Internet of Things (IIoT) networks [3]. This enables the researchers to conduct data-driven studies on quality prediction and process parameter optimization. For process quality prediction, Xie et al. [8] proposed a self-adjusting structural radial basis function neural network to address the difficulty of online measurement of quality indicators in wet zinc smelting plants, which is used to predict the outlet ferrous ion concentration online. Peng et al. [9] used lower/upper-bound estimation to obtain the prediction interval for mechanical performance of hot rolled strip, and optimized the weight parameters of the learning system using the artificial bee colony algorithm to predict the mechanical performance of hot rolled steel. In [10], a quality prediction framework for process industries based on IoT-oriented cyber-physical system was proposed. Therein, key process indicators were selected through information gain, and sensitivity parameter analysis was incorporated into a random forest-integrated Bayesian optimization scheme. Regarding a real industrial hydrocracking process, Chen et al. [11] proposed to utilize a regularized stacked autoencoder based on soft sensors to characterize the key process parameters.
For data-driven production parameter control, Yin et al. [12] constructed a multi-stage model for predicting process parameters and quality indicators through two different connection strategies. They then proposed a multi-gene genetic programming and multi-objective particle swarm optimization algorithm to address the multi-stage and latency issues in the optimization of process manufacturing. A case study of coal preparation demonstrates the efficiency of their proposed method. In [13], Hu et al. focused on carbon efficiency in iron ore sintering process. They predict the comprehensive carbon ratio by integrating the fuzzy clustering method, a least-square support vector machine, and the Takagi-Sugeno fusion scheme. Based on the carbon efficiency prediction model, an online searching scheme using chaos particle swarm optimization was implemented to achieve the carbon ratio optimization.
Despite the development of quality prediction/control techniques, the implementation of the above-mentioned research in complex process manufacturing sectors still encounters the subsequent obstacles. Firstly, quality forecasting and management of production lines typically rely on training with limited-size offline data, leading to potential accuracy degradation over long-term operation. Secondly, in the data-driven quality prediction and control approach of the process industry, the lack of interactive feedback loops incorporating online data updates poses a challenge in achieving a systematic enhancement of operation quality in alignment with the initial production line.
II-B Digital Twins in Process Industries
The concept of Digital Twins (DTs) involves establishing a mutual-mapping, with full information exchange, between the physical entity of a process production line and its virtual counterpart [4]. DT has been considered a revolutionary opportunity in the digital transformation of process industries [14]. The current research on DTs are primarily focused on their application in areas such as data management, fault diagnosis and prediction, dynamic scheduling in workshops, and quality prediction for discrete manufacturing products. In [15], a cloud-edge collaboration framework was proposed to manage the full lifecycle data of metal additive manufacturing. With the proposed framework, efficient data communication is guaranteed between field-level manufacturing equipment, edge twin bodies, and cloud twin bodies, thus facilitating cloud-based and deep learning-enabled defect analysis. In [16], Zhang et al. conducted research on integrating data from physical entities and virtual entities. DT was utilized to fuse both real and simulated data and offer more comprehensive information for machine availability prediction, disturbance detection, and product line performance evaluation.
With the help of DT, applications such as Prognostics and Health Management (PHM) are able to utilize generative data on the virtual DT side to enhance the accuracy of prognosis and decisions, especially when techniques demanding large amount of data, such as deep learning, are employed. In [17], a DT-driven PHM system for complex equipment was proposed. Therein, a 5-dimensional (physical system, service, data and connection) DT model of a wind turbine generator was built through modeling the transmission relations among the wind wheel, gearbox, and generator. By fusing vibration and stress signals for fault prediction, a DT-based, simulation-driven fault prediction scheme was established. In [18], a digital twin-assisted fault diagnosis method using deep transfer learning was proposed, analyzing the operating state of machining tools. In [19], a deep learning-based method for die-casting operation status analysis and appearance defect prediction was proposed. By establishing a virtual die-casting module, a joint virtual-real debugging process for the controller joint was introduced, and with data acquisition using DT, two learning methods, i.e., XGBoost and a VGG16-based deep neural network, were adopted for quality prediction and appearance defect prediction, respectively.
Although significant efforts have been made to enhance data acquisition with DTs for tasks such as visualization and fault detection, there is still a noticeable lack of research focused on optimizing process parameters in production settings that involve temporal coupling among various subprocesses. Furthermore, there is a need for finding a better iterative operation mechanisms for DT production lines, which are expected to integrate quality prediction and quality control into the virtual product line evolution, and is able to evolve based on the interaction between the DT and the physical production line.
III Construction of DT Model for Process Production Lines
III-A The proposed DT Framework for Production Lines
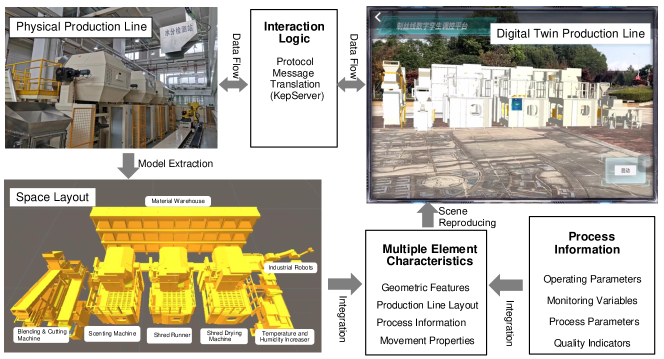
Deploying DT in process industries for quality prediction and line parameter optimization involves the following key steps. Firstly, process parameters are collected from different equipment units and then integrated with the DT data model. This step establishes the mapping between the physical equipment entities and the data model of the DT system. We note that it also converts the coupling between physical sub-processes into the coupling among DT model parameters. Secondly, online monitoring of process quality fluctuations is conducted in real time. In the proposed framework, data provision and transmission for the DT side are achieved by using the OLE for Process Control (OPC) Unified Architecture (UA) protocol, which utilizes the network communication programming interface to bridge different underlying sub-networks (e.g., non-IP based IIoT and Ethernet). In a typical scenario within an IIoT-enabled sub-network, IoT sensors publish production monitoring data using Message Queueing Telemetry Transport (MQTT) messaging protocol. The MQTT brokers, such as IIoT gateways, subscribe to the corresponding topics, format the received data into OPC-readable packets, and subsequently transmit them to the DT host for storage and further processing. Otherwise, if the sensor data are collected from Ethernet-supported sub-network, we can directly use the socket-based interface to establish the OPC UA links to the Ethernet/IP-compatible end devices.
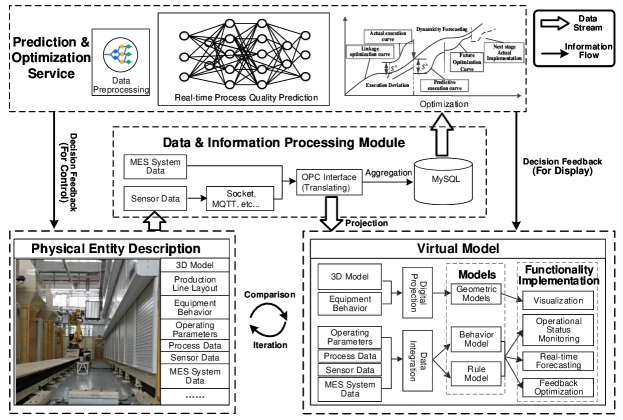
Using the process data collected at the DT side, we design a composite neural network model for predictive analysis of process quality indicators. The process state/quality predictions are compared with the actual working conditions in real time. Based on the comparison results, a multi-constraint optimization procedure is performed with respect to key process parameters. The parameter adjustment results are then fed back to the physical production line, aiming to improve the production efficiency and enhance the product quality. In Fig. 1, a high-level framework description is presented to illustrate the key modules of the DT for a process production line. This model highlights the functionalities of a DT system that are used for quality prediction and parameter optimization in multi-procedure process production. More specifically, the DT framework presented in Fig. 1 comprises four main parts:
-
(1)
Physical Entity Description: This layer provides the information about production scenes, equipment structure and layouts, assembly relations, and functional characteristics of the equipment involved. Proper description of these diverse physical entities ensures efficient operation of the virtual production line on the DT side.
-
(2)
Virtual Model: This part aims to form a digital model of the physical production line by coordinating different units provided by physical entity description. The virtual model mainly refers to the geometric model, behavior model and rule model. The geometric model digitally maps the associated layout and equipment structural information based on the mechanical domain knowledge. The behavior and rule models entail the abstraction of behavior rules, operating states and collaboration relations of physical entities. The modeling is implemented by event encapsulation based on the abstracted behavior rules and operating states.
-
(3)
Data and Information Processing Module: This module is primarily responsible for processing, converting, aggregating, and storing data to support the data-consuming modules such as the virtual model for DT and the service module. The data orignate from two main sources, i.e., the MES system and the sensor data from the network edge. Sensor data may be from different sub-networks. They are translated into the OPC-compatible format, aggregated into key-value pairs and then stored in a real-time database.
-
(4)
Prediction & Optimization Service: The module of prediction & optimization service encapsulates algorithms and models to provide production control service. The service can be divided into two parts: quality prediction and line optimization with feedbacks. The quality prediction service aims to forecast in advance whether a product will fail in terms of quality. If the predicted product quality does not meet the standard, the optimization service will be triggered. This service utilizes a multi-dimensional constraint optimization algorithm to adjust operating parameters. The adjustments made will then be fed back to the physical entity.
III-B Data Flow of the DT Production Line
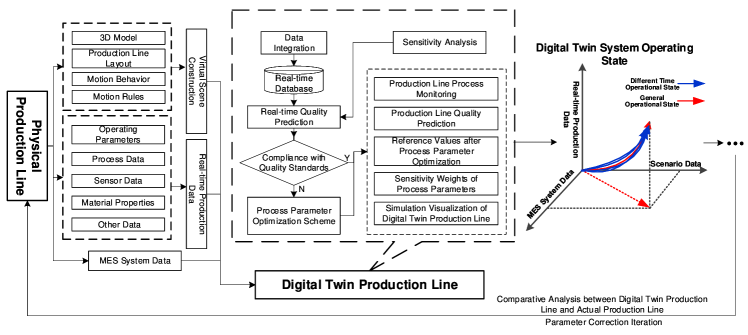
In this paper, we propose a coordinated optimization mechanism for the production process based on the DT system. The objective of this mechanism is to establish an effective connection between the production line equipment units and the DT system, enabling prompt detection of abnormal process-quality issues and providing control feedback to the physical entities. The processing flow of production process data and equipment data is depicted in Fig. 2.
We consider a process production scenario, e.g., tobacco shredding, that involves complex physico-chemical reactions. We note again that the construction of a DT production line requires not only geometric 3D modeling of equipment for visualization, but also modeling of operational behaviors of different production units/stages. From the system designer’s perspective, the DT data are collected from the MES and sensors using OPC communication protocols. The collected data is then converted into suitable formats and stored in a real-time database. We utilize the collected data to train a composite neural network model offline. It then functions as core of the computable DT for product quality prediction and sensitivity analysis using the real-time data fed in by the physical production line. To ensure the stability of the DT, which evolves parallelly to the physical entity, the DT production line needs to frequently compare the virtual state of the twin body with the real-time attributes/states of the physical production line. When the virtual state deviates from the physical production line, particularly if the deviation between the actual quality indicators of the production line and the predicted quality indicators surpasses a certain threshold, the prediction model will be retrained using transfer learning, which is performed based on the incrementally built training set from the real-time database. Finally, the DT production line determines the optimized process parameters based on the predictive model and then provide the parameter recommendation to the appropriate positions/steps within the physical production line. This enables the iterative convergence of the DT production line with the physical production line.
IV Quality Prediction and Parameter Optimization based on DT
IV-A Quality Prediction based on DT
In practical industrial scenarios, due to the complexity of process production, time series data of production processes typically display characteristics such as nonlinearity, non-stationarity as well as long-term dependencies. This causes difficulties in identifying the causal relationships between the sensed production line states and the product quality. Meanwhile, due to the high data dimensionality, it is usually difficulty to locate the source of noises and identify outliers, which may lead to inaccurate analysis results and misleading predictions about the production process.
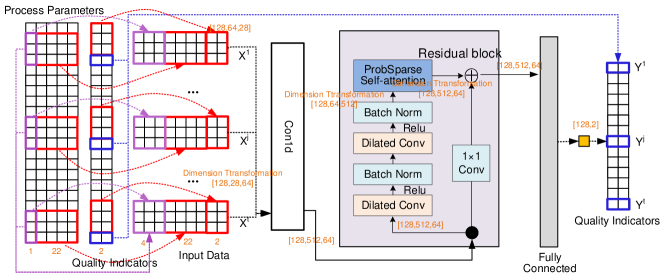
In view of the above-mentioned issues, we propose a composite deep neural network model for quality prediction to address the problems of nonlinearity and non-stationarity in our obtained process data. The quality prediction module resides on the service module of the DT (see Fig. 1). It receives data from the information processing middleware, utilizing historical data retrieved from the database for training and real-time data for making inferences. To reflect real-world production conditions, we first design a data cleaning scheme to pre-process the collected sensor data and handle the scenarios of machine stoppage and feedstock fluctuations at warm-up and downtime. This removes most of the noises and outliers in the collected sensor data while ensuring the data integrity. Using the data set obtained after pre-processing, we aim to address the long-term dependencies in the multidimensional sequential data in the product-quality forecasting task. The composite neural network model is built by incorporating the Probability Sparse self-Attention (PSA) mechanism [20] into the framework of Time Convolutional Networks (TCNs). The structure of the network is illustrated in Fig. 3, and is composed of three major components, i.e., input representation, TCN network module and prediction head.
IV-B Input Representation
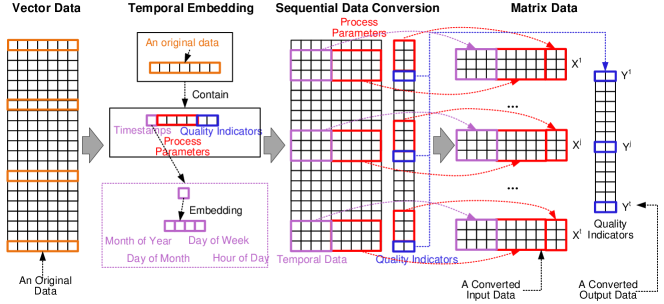
We observe that different stages in the production process often exhibit periodic characteristics. To preserve the correlated information between stages more effectively, the original input data, presented as a vector sequence, is converted into a consistent format of sequential matrix data through sequence merging and data normalization. As illustrated in Fig. 4, an original data vector contains its associated timestamp information, process parameters and corresponding quality indicator records. For each raw input sample, the timestamp element is encoded from its initial single-column format into a four-column representation, including the month of the year, day of the month, day of the week, and hour of the day. Subsequently, for a specific time instance , the -dimensional process parameters can be denoted as , and the -dimensional quality metric data can be expressed as . Given a fixed-length time window of samples, the target input data is constructed by concatenating sequential parameter data till the present time, i.e., and the historical quality indicators by shifting their corresponding quality indicators for one time step left, i.e, . The target label data is taken as the quality indicator for the current time instance . Formally, takes the following matrix form:
| (1) |
It is worth noting that all process parameters and quality indicators are normalized using the maximum-minimum normalization method into the range of , which handles the potential problem of vast difference between the quantities of process parameters and quality indicators obtained by numerous sensors. Also, instead of directly adding the positional embedding to the input data as in vanilla Transformer, we concatenate the normalized temporal encoding data (after broadcasting) into the front of .
IV-C TCN with Probability Sparse Self-Attention
As illustrated in Fig. 3, the re-organized input is fed into a 1D convolutional layer to fit its dimension with the required dimension of the TCN component. The dimension of the input data is expanded from (corresponding to the temporal encoding, parameters and quality indicators, respectively) into , whereas the time window length for the data sequence is kept as . This makes the input dimension of the TCN component to be . The 1D convolutional layer is connected to a PSA-enabled TCN (called TCN-PA), which is composed of four modules including dilated convolution, batch normalization, PSA and identity mapping, as illustrated in Fig. 5.
As shown in Fig. 5 (see bottom-left therein), by introducing a dilation factor in the dilated convolution module, the convolution kernel skips a certain number of elements on the input sequence for convolution. The convolution operation is performed at certain intervals on the time series. The calculation of dilated convolution can be expressed as follows:
| (2) |
where is the weight of the convolutional kernel of size , is the index of the weight, is the input sequence and is the time index. controls the operation spacing of each element in the convolution kernel within the input sequence.
The batch normalization module is used to improve the robustness of the model. It performs normalization operations on the input data of each batch, ensuring that its output has a mean of 0 and a variance of 1. The operation of batch normalization can be represented as follows:
| (3) |
where represents the result of batch normalization at time , is the output of dilated convolution, represents the batch normalization operation, is the mean value of the current batch input, and is the standard deviation of the current batch input.
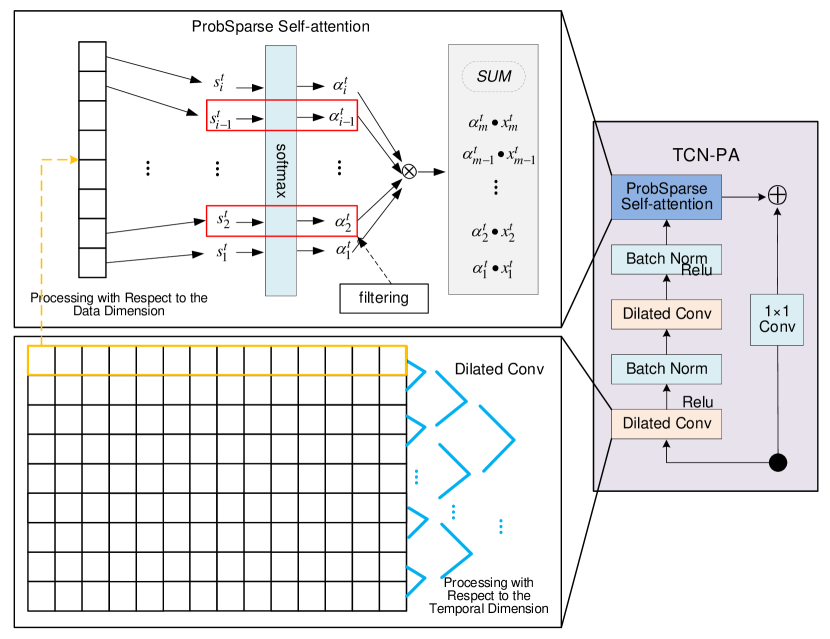
After stacking the operation of dilated convolution and batch normalization, which aims to expand the reception field, the output is used to generation the self-attention score. The reason for introducing the attention mechanism lies in the fact that traditional TCNs relies on changing the number of output channels to extract temporal dependence feature, whose capability of extracting the corresponding relationships between multiple variables of production process parameters is insufficient. To address the problem of high computational cost of self-attention, we propose to utilize the sparse self-attention mechanism [20] to improve the training efficiency. Similar to the traditional attention mechanism, the output of the final batch normalization layer undergoes a linear transformation to obtain the query matrix , key matrix , and value matrix as follow:
| (4) | |||
| (5) | |||
| (6) |
where , , and are learning weights of the transformation matrix. Let , and denote their column vector, respectively, which corresponds to the -th query, key and value in the process features. Then, we can compute the similarity between query and key to obtain a measure of the correlation between different process feature vector:
| (7) |
With the sparse self-attention mechanism, we use the following max-mean measurement to select to top- attention probabilities for query with , and set the rest attention probabilities to :
| (8) |
where represents the number of keys, and represents the dimensionality of the vectors. The non-zero similarities determines the attention probabilites with a softmax operation:
| (9) |
Using (9), the hidden states output from the TCN layer at each input produce the following context information state vector through weighted summation:
| (10) |
Finally, considering that process feature information is prone to loss or distortion after multiple layers of convolution and compression operations, a residual connection is introduced. This allows the network to retain information across layers, ensuring the preservation of original data-dependent information. A residual block consists of a direct mapping component for the TCN output and a residual component for the input :
| (11) |
where the 1D convolution operation fits the dimension of the input data with that of .
IV-D Prediction Head
The output of the TCN-PA module is connected to one or several fully connected layers to further manipulate the output dimensions, producing the final prediction of quality indicators in concern (see Fig. 3). We adopt the Mean Square Error (MSE) loss to train the proposed network.
V Production Line Optimization with Multi-objectives
V-A Objective Function Design
Intuitively, the quality indicators of the production process are directly influenced by the process operating parameters. With the proposed DT framework, our objective of process optimization is to minimize the deviation between the predicted and the target values of the production process quality indicators, by manipulating the operation parameters on the twin side. We take each quality indicator as a a single objective. Then, optimizing multiple quality indicators collectively forms a multi-objective optimization problem. Considering that the importance of each quality indicator varies, individual objective functions are weighted based on field experience. Additionally, given the significant differences in the fluctuation ranges of various quality indicators, normalization is applied to each single objective function. Omitting the time instance, the multi-objective optimization can be established as follows:
| (12) |
where is the input matrix of process parameter time series with rows and columns, denotes the output of the TCN-PA neural network described in Section IV, and it corresponds to an -dimensional quality indicator vector. is the weight of the -th objective. and are the maximum and minimum quality indicators recorded in the real-world production scenarios.
V-B Extraction of Process Parameters
For our experimental process production line, process parameters can be collected. However, not all of these parameters can be controlled. Generally, the collected process parameters can be divided into three categories. The first category includes environmental parameters that cannot be controlled or change passively, such as ambient temperature and humidity. The second category comprises parameters that are influenced by the adjustment of the third-category parameters and those that are not suitable for control in actual production, such as exhaust air volume and main steam temperature. The third category consists of parameters that have a significant impact on quality indicators, whose response can be quickly observed after adjustment, such as hot air temperature and inlet-material flow rate. The process parameters that we need to control belong to the third category. Therefore, we identify the first category of process parameters based on the actual on-site conditions and use the Sobol sensitivity analysis method [21] to distinguish between the second and third categories of process parameters.
V-C Multidimensional Constrained Optimization
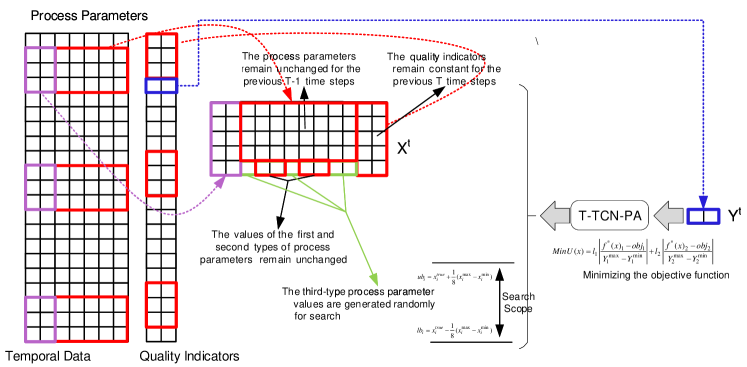
In practical scenarios of process production, the number of quality indicators is often relatively smaller than that of the observed process parameters. Moreover, it is typically challenging to establish a closed-form functional relationship between process parameters and quality indicators. In such cases, we can learn the a functional relationship between the two with our proposed neural networks. Due to the lack of an explicit relationship expression, we rely on swarm intelligence algorithms to heuristically search for the proper parameter solution using the neural network inference results. In conventional swarm intelligence algorithms, the number of particles generated in each iteration is limited, which may leads to inefficient search. Therefore, we introduce in this paper a Multidimensional Constrained Optimization Algorithm (MCOA) [22] to improve the search efficiency. After identifying the third type (i.e., controllable) of process parameters through sensitivity analysis, the current values of the noncontrollable process parameters can be temporarily fixed. Once the values of controllable process parameters are obtained for the current time instance , random numbers of particles are generated within a specified range for search initialization. Since excessive fluctuations cannot occur during product processing, limits can be imposed on the value range of the controllable parameters for . This ensures that product quality standards are met within the smallest adjustment range. Empirically, the fluctuation range of optimized process parameters cannot exceed of their maximum fluctuation range. The search rule for the parameters is specified in Fig. 6, and the upper and lower limits of particle search for the -th parameter are determined by
| (13) |
where and represent the lower bound and the upper bound of the search particle, respectively. is the true value of the -th process parameter. and are obtained from the historical records as the maximum and minimum value of that parameter.
After determining the search range for particles in all dimensions, the entire optimization search process can be simulated based on Archimedes’ buoyancy law [23]. In this simulation process, particles used to search for the optimal quality indicators corresponds to the optimal process parameters that ensure product quality in the current state of the production line. Except its position, each particle needs to determine its three additional attributes including the density, volume, and acceleration. These attributes are initialized in the following way ():
| (14) |
where represents the initialized value of the -th process parameter for the -th search particle, and and are obtained with (13). denotes the number of search particles for a single process parameter, and is a uniformly random number drawn in the range .
Let , and denote the attributes of density, volume, and acceleration,respectively. and are also initialized with a uniformly random number, and is initialized in a similar way as in (14). The computation is performed based on the initial population, and the value with the optimal fitness is selected as the target to determine the optimal attribute vector of the process parameters, , , and .
During the particle optimization process, it is inevitable that particles may search in colliding directions. In such cases, we simulate collisions between particles, and after evolution of a certain period of time, the objects will reach an equilibrium state [23], hence reducing unnecessary searches. To simulate this scenario, we introduce the transfer factor and the density factor . The transfer factor is computed as follows:
| (15) | |||
| (16) |
where is the current iteration number, is the maximum number of iterations.
Given the values of and , the acceleration of the search particles is updated through iteration. The particles are set in the exploration phase when , where collisions may occur between particles. In this case, the particle acceleration for the -th parameter is updated by randomly selecting the values of , and :
| (17) |
where , and are the randomly generated attributes of the particle.
When , the particles are developed and no collision occurs. Then, the particle acceleration is updated as
| (18) |
Subsequently, the particle acceleration is normalized, with parameters and limit the normalization range ( and are typically set to 0.9 and 0.1):
| (19) |
where and are the maximum and minimum allowable acceleration. determines the step size that each particle can change with. If the target particle is far from the global optimum, the acceleration value is higher, indicating that the target is in the exploration phase. Otherwise, the particle is in the exploitation phase. (19) also shows that the acceleration factor starts at a large value and decreases over time, demonstrating the transition of particles from the exploration phase to the exploitation phase. It also helps to prevent particles getting stuck in local optimal solutions.
Finally, the particle position is updates. Similarly, at the exploration state (), we have
| (20) |
where is a constant, is a random number. is the position of a randomly selected particle among particles. At the exploitation state (), we have
| (21) |
where is a constant, and is a random number as in (20). The parameters and are determined by:
| (22) |
where is a random value again and is a constant. Then, with we have
| (23) |
We note that the value of increases gradually with the number of iterations within the allowable range, and is directly proportional to the transfer factor . Initially, it starts with a certain percentage of the best position, which is very low during the earliest iterations. This leads to a large difference between the best position and the current position, resulting in a larger step size for random walks. As the search progresses, this percentage gradually increases, and the difference between the best position and the current position gradually decreases. The updating step size of the particle position evolves from large to small, ensuring that the particles find the best position as quickly as possible. The operation flow of the complete MCOA algorithm is shown in Fig. 7.

VI System Deployment
VI-A Deployment of DT on an Experimental Line
To validate the effectiveness of our DT-based production optimization framework, a tobacco shredding line, with a processing capacity of 20 kg/batch, was selected for a case study for real-time process monitoring and control. Based on the established data generation logic for key process indicators of tobacco leaf drying, the compliance of quality indicators for the specific “thin-plate drying” process was evaluated using the propose prediction model. If the predicted quality indicators were below standard, the optimization algorithm was activated to adjust the operation parameters on the DT side and provide feedback to the physical production line. Data was collected every 6 seconds on the test production line.
Our system is deployed based on the following equipment units: leaf moisturizing and feeding machine, leaf drying machine, scenting machine, micro-roller leaf cutter, blending cabinet, storage system with constant temperature and humidity, robotic arm system, as well as the DT software developed based on the following tool chain: Kepware, unity3D, MySQL and Python. The details of the system deployment are organized in the following steps:
-
(1)
Firstly, we use Kepware to develop a real-time data acquisition module. Key data include the moisture of inlet materials, opening levels of the exhaust damper, steam pressure into the thin plate, hot air temperature, HT steam pressure, and air volume of the rear chamber damper from multiple sensors on the tobacco shredding line. For every batch of inlet material processing, the process operation parameters are stored in the database on the cloud.
-
(2)
Then, the sensor data about the physical production line are processed offline by retrieving the database. This includes invalid data preprocessing, including outlier treatment, denoising, identification of the beginning and stoppage of material inlets, and data normalization.
-
(3)
The proposed composite neural network is deployed on the cloud and trained offline using dataset obtained with Step (2). After training is completed, the neural network is turned into online inference mode for real-time product quality prediction. Its inference output is used to invoke the MCOA algorithm to perform multi-dimensional constrained optimization on production process parameters, which are to be fed back to the physical production line.
-
(4)
The DT data obtained in the above steps are communicated to the visualization module through Socket tunnel, with Unity3D serving as the client. The XCharts plugin is used for online status displaying as well as visualization of prediction and control results.
-
(5)
Finally, the parameters of the physical production process are adjusted with PLC according to the feedback from the DT. This completes the four-phase DT-physical entity update through data collection, data visualization, parameter prediction, and process control. The new results from parameter adjustment are again stored into the on-cloud database, which can be used to expand the dataset for transfer learning of the prediction model.
VI-B Details of Data Collection and Pre-processing
| Determinant Factor | Conditions for Starting Counting | Conditions for Ending Counting |
|---|---|---|
| Accumulated material volume | The first sample of unchanging volume | The last sample of unchanging volume |
| Material flow rate | ||
| Inlet beginning and stoppage | Synchronized with the beginning of moisture contents at the outlet | Synchronized with the stoppage of material flows at the inlet |
The data used in this paper was acquired from the tobacco shredding test line of an anonymous process manufacturing enterprise. This line comprises six processes including humidity conditioning, primary feeding, secondary feeding, thin-plate drying, proportional material blending, and flavoring. The dataset used for training the prediction module includes over 200,000 records from 45 batches produced between June and December 2023.
As mentioned earlier in this paper, process manufacturing is featured by continuous production. A key aspect of preprocessing the production data is cleaning the head and tail data as well as the data collected from line stoppages and breaks. The rules for identifying non-steady-state data at the start and end of production are outlined in Table I. The data truncation is enabled by the following three conditions: (1) If there is no increase in the “accumulated material volume” within the data segment; (2) if the detected material flow rate is less than 30; (3) If the first data sample in the segment synchronizes with the beginning of the moisture contents at the process outlet.
VI-C Construction of Visualization Module
We use 3D laser scanners to collect information such as the size and shape of equipment parts, equipment structure, assembly relationships, and production line layout. Then, the collected data are processed with the UG modeling software to create scale models of parts, equipment, and production lines for establishing high-precision 3D models of the production line. Additionally, we use 3ds MAX to add texture properties to the models, which are then rendered and lightweighted. On this basis, we use Unity 3D for scene construction, as shown in Fig. 8, realizing a high-precision 3D visualization model for the tobacco shredding test line.
Based on the constructed 3D visualization model of the DT production line, connections are first established between Kepware and equipment such as PLCs and DCSs on the production line. Kepware then transmits real-time operational data, process state data, and other information from the physical production line to the remote database through a Socket interface. Unity3D uses C# language to bind the models, and interacts with the database to obtain real-time heterogeneous data about the production line. This provides a foundation for achieving process quality prediction and parameter optimization of the test line in concern.
VII Results and Discussion
VII-A Experiment Parameters
We take the “thin-plate drying” process as an example, which has a total of 28 measurements, for demonstrating the efficiency of our proposed system. Among the measurements, there are 22 production process parameters, including inlet material moisture, inlet material temperature, exhaust air volume, roller wall temperature, exhaust damper opening level, hot air temperature, etc. Besides, there are 2 quality indicators, namely the moisture at the thin-plate drying outlet and the processing strength of thin-plate drying, and 4 encoded timestamps.
For the composite neural network, we set the ratio of the training set, validation set, and test set as 6:2:2, with 28 selected features and a time series of 32 samples as one input. The output channels of the 1D CNN is set as 512. We adopt a TCN with 5 layers, with each layer has 512 channels for both the input and output. The convolution kernel size is set to 2, and the dilation distances between each element within the convolution kernel are set to . We choose a dropout rate of 0.25. The sparse self-attention module is set to have 8 heads. The numbers of neurons in the 2 fully connected layers are chosen as and , respectively. The default learning rate is set as 0.001, the learning decay rate is set as 0.99, the training batch size is 128 and the number of iterations is 50. We choose Adam as the optimizer.
VII-B Ablation Experiment
This experiment aims to verify the effectiveness of the proposed TCN model with sparse self-attention in improving prediction accuracy. The models designed for comparison in the ablation experiments include the Time encoding combined with TCN (T-TCN), TCN combined with Probability sparse self-Attention mechanism (TCN-PA), and T-TCN combined with Probability sparse self-Attention mechanism (T-TCN-PA). Under the same experimental conditions, the aforementioned models were trained, and the experimental results are presented in Table II.
| Algorithm | Quality indicators | MSE | MAE | |||||||||
|---|---|---|---|---|---|---|---|---|---|---|---|---|
| T-TCN |
|
|
|
|
||||||||
| TCN-PA |
|
|
|
|
||||||||
| T-TCN-PA |
|
|
|
|
To comprehensively evaluate the prediction performance of the algorithms, three evaluation metrics were selected: MSE, MAE, and score. From the comparison results in Table II, it can be observed that among the three methods, the proposed composite neural network achieves the best prediction performance. With T-TCN-PA, the scores for the two quality indicators are 0.986 and 0.981, respectively, indicating that the algorithm’s fitting scores are higher than those of the two other models. The MSE are 0.000136 and 0.000922, respectively, indicating that its prediction errors are smaller than those of other models. This proves the superiority of the prediction performance by our proposed model, hence the effectiveness of the corresponding network structure.
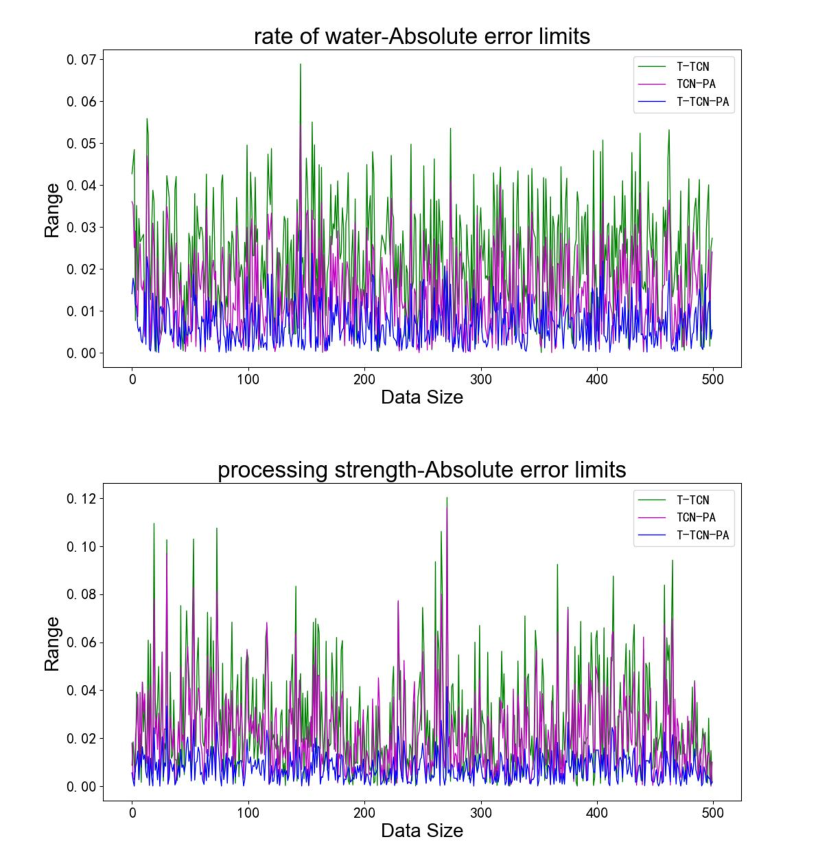
Fig. 9 compares the absolute prediction errors of three networks regarding two quality indicators, i.e, the content moisture at the outlet and the processing strength. From Fig. 9, it is clear to see the fitting errors of each network. It shows that the T-TCN-PA composite network has the smallest error against the true quality values.
VII-C Comparison Experiment between Different Networks
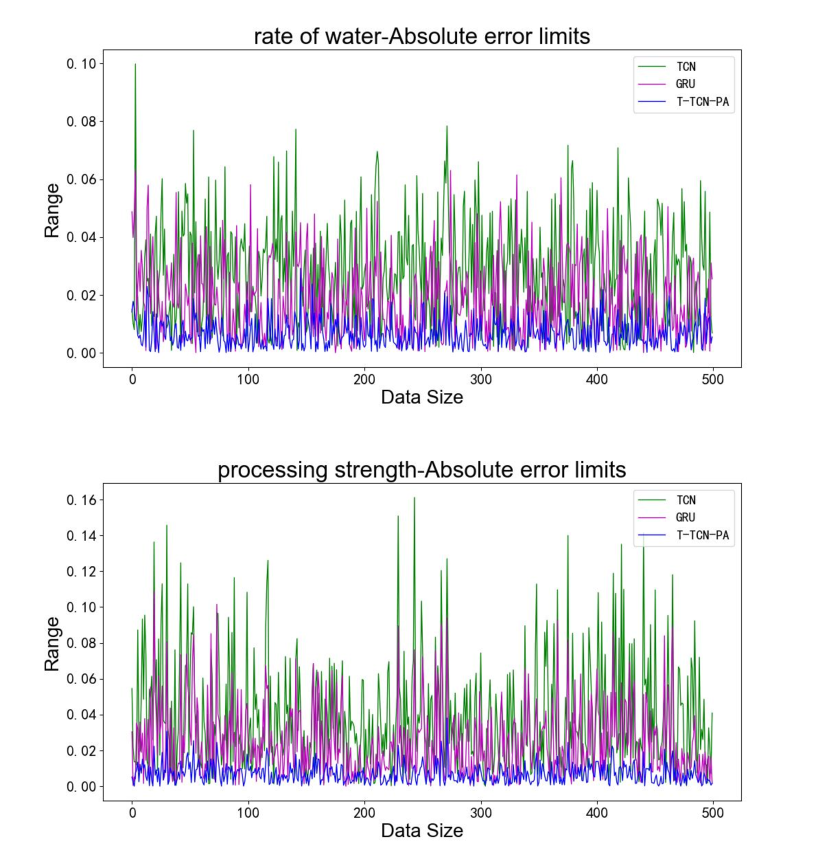
To verify the prediction efficiency of the proposed T-TCN-PA network in process production, two quality indicators, content moisture at the outlet, and processing strength, are selected as prediction indicators. Comparative experiments are conducted using the canonical TCN and GRU networks, which have demonstrated good prediction performance in recent years. The same evaluation metrics, MSE, MAE, and , are used to assess the prediction performance of the algorithms. Under the same experimental conditions, the experimental results are presented in Table 3. From the results in Table III, it can be observed that among the several methods compared, the proposed composite neural network exhibits the best prediction performance. The prediction accuracy for both quality indicators is higher than that of the other two network models, demonstrating the superior predictive capability and the effectiveness of the proposed network structure.
| Algorithm | Quality indicators | MSE | MAE | |||||||||
|---|---|---|---|---|---|---|---|---|---|---|---|---|
| TCN |
|
|
|
|
||||||||
| GRU |
|
|
|
|
||||||||
| T-TCN-PA |
|
|
|
|
Fig. 10 compares the absolute error limits of the three networks in terms of the content moisture at the outlet and the processing strength. Fig. 10 provides a clearer comparison of the fitting errors of each network. Comparison demonstrates that the proposed T-TCN-PA network has the smallest error (in blue) against the true quality indicator value.
VII-D Performance Analysis of the Multi-constrained Optimization Algorithm
According to sensitivity analysis in actual situations, the processing parameters can be divided into three categories (see Table IV as well as our discussion in Section V-B).
| Categories (non-controllable) | Parameters |
|---|---|
| First category (non-controllable) | Content moisture at inlet, inlet temperature, ambient temperature, ambient humidity |
| Second category | Exhaust air volume, roller wall temperature (front), roller wall temperature (middle), roller wall temperature (rear), main steam pressure, hot air volume at the front chamber, average roller wall temperature, main steam temperature, thin plate steam temperature |
| Third category | Exhaust damper opening level, hot air temperature, HT steam pressure, rear chamber damper opening level, thin plate steam pressure at inlet, front chamber damper opening level, material flow rate at inlet |
A random number of particles are generated at different directions for parameter searching based on the obtained values of the third-type parameters. To verify the efficiency of the proposed MCOA algorithm, its performance is compared with the Butterfly Optimization Algorithm (BOA) [24], the Harris Hawks optimization Algorithm (HHA) [25] and the Marine Predators Algorithm (MPA) [26], which all demonstrate good performance in recent years. Among them, the optimization objective for process quality is set as according to quality requirements. The quality indicators are mapped to a normalized space, and the maximum number of iterations is set to 100. All algorithms are run 25 times for comparison, and the results are shown in Table V and Fig. 11.
| BOA | HHO | MPA | MCOA | |
| Best solution | ||||
| Average | ||||
| Standard deviation | ||||
| Success rate | 52% | 96% | 92% | 100% |
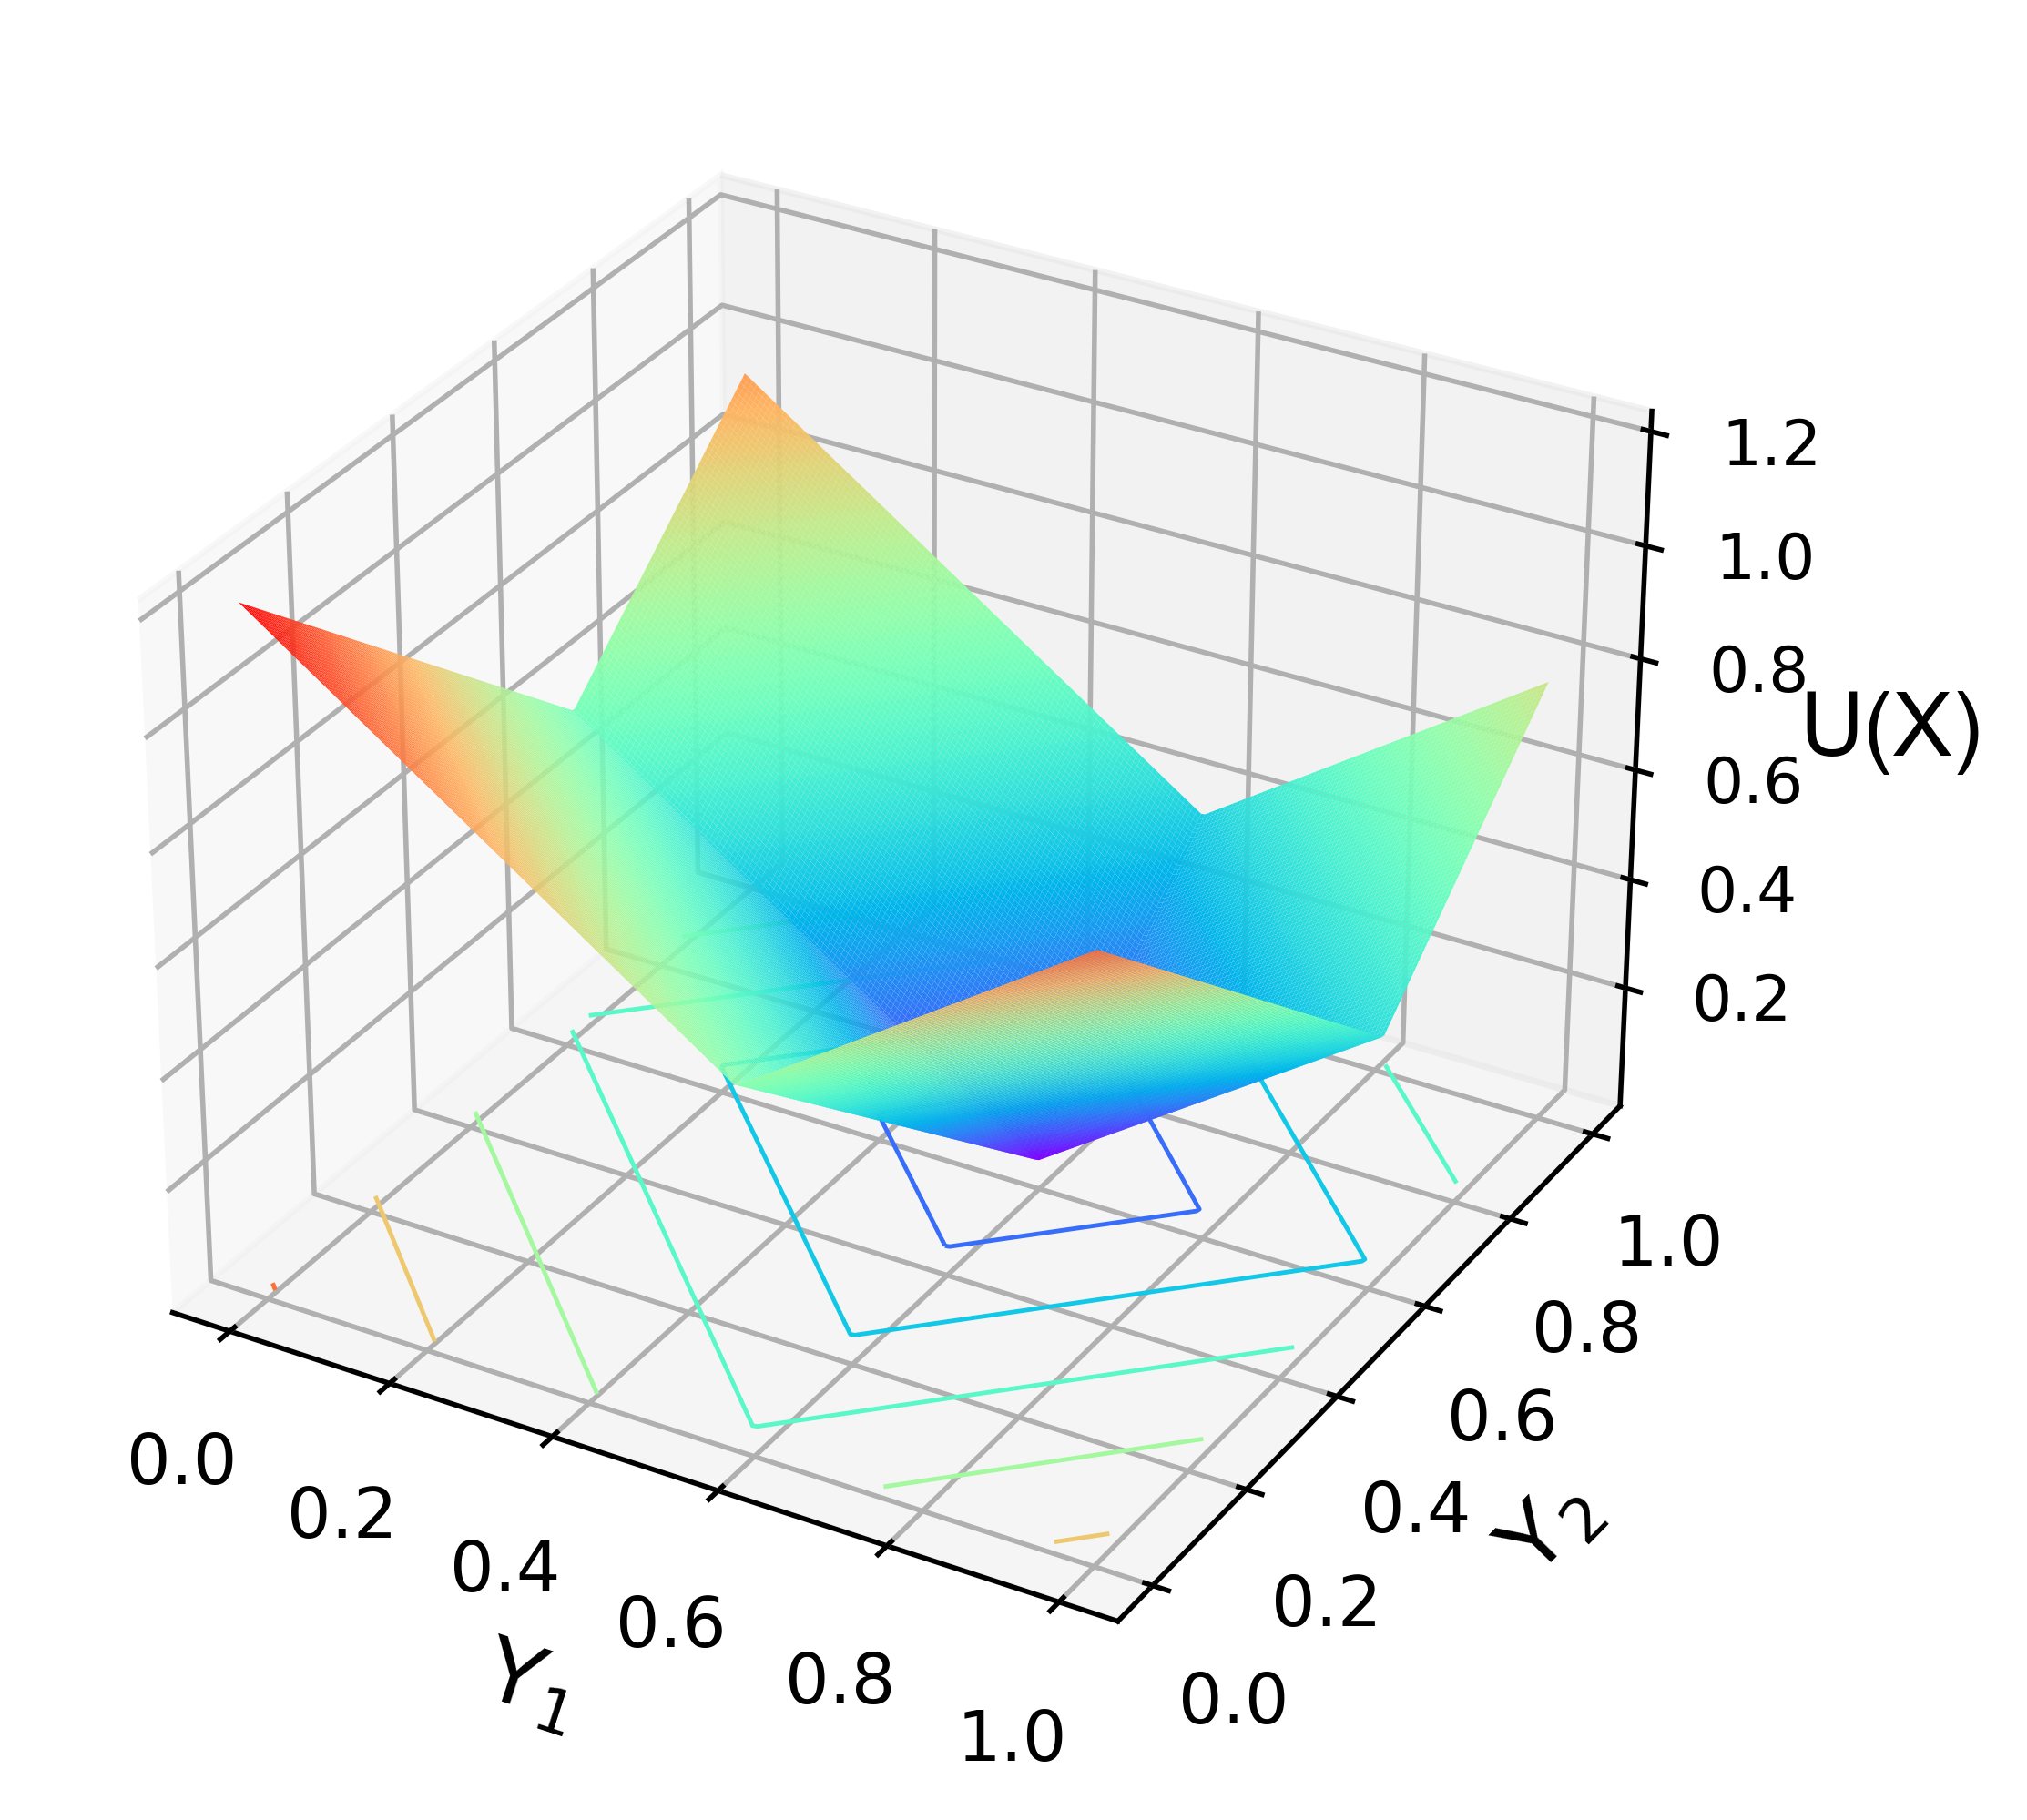
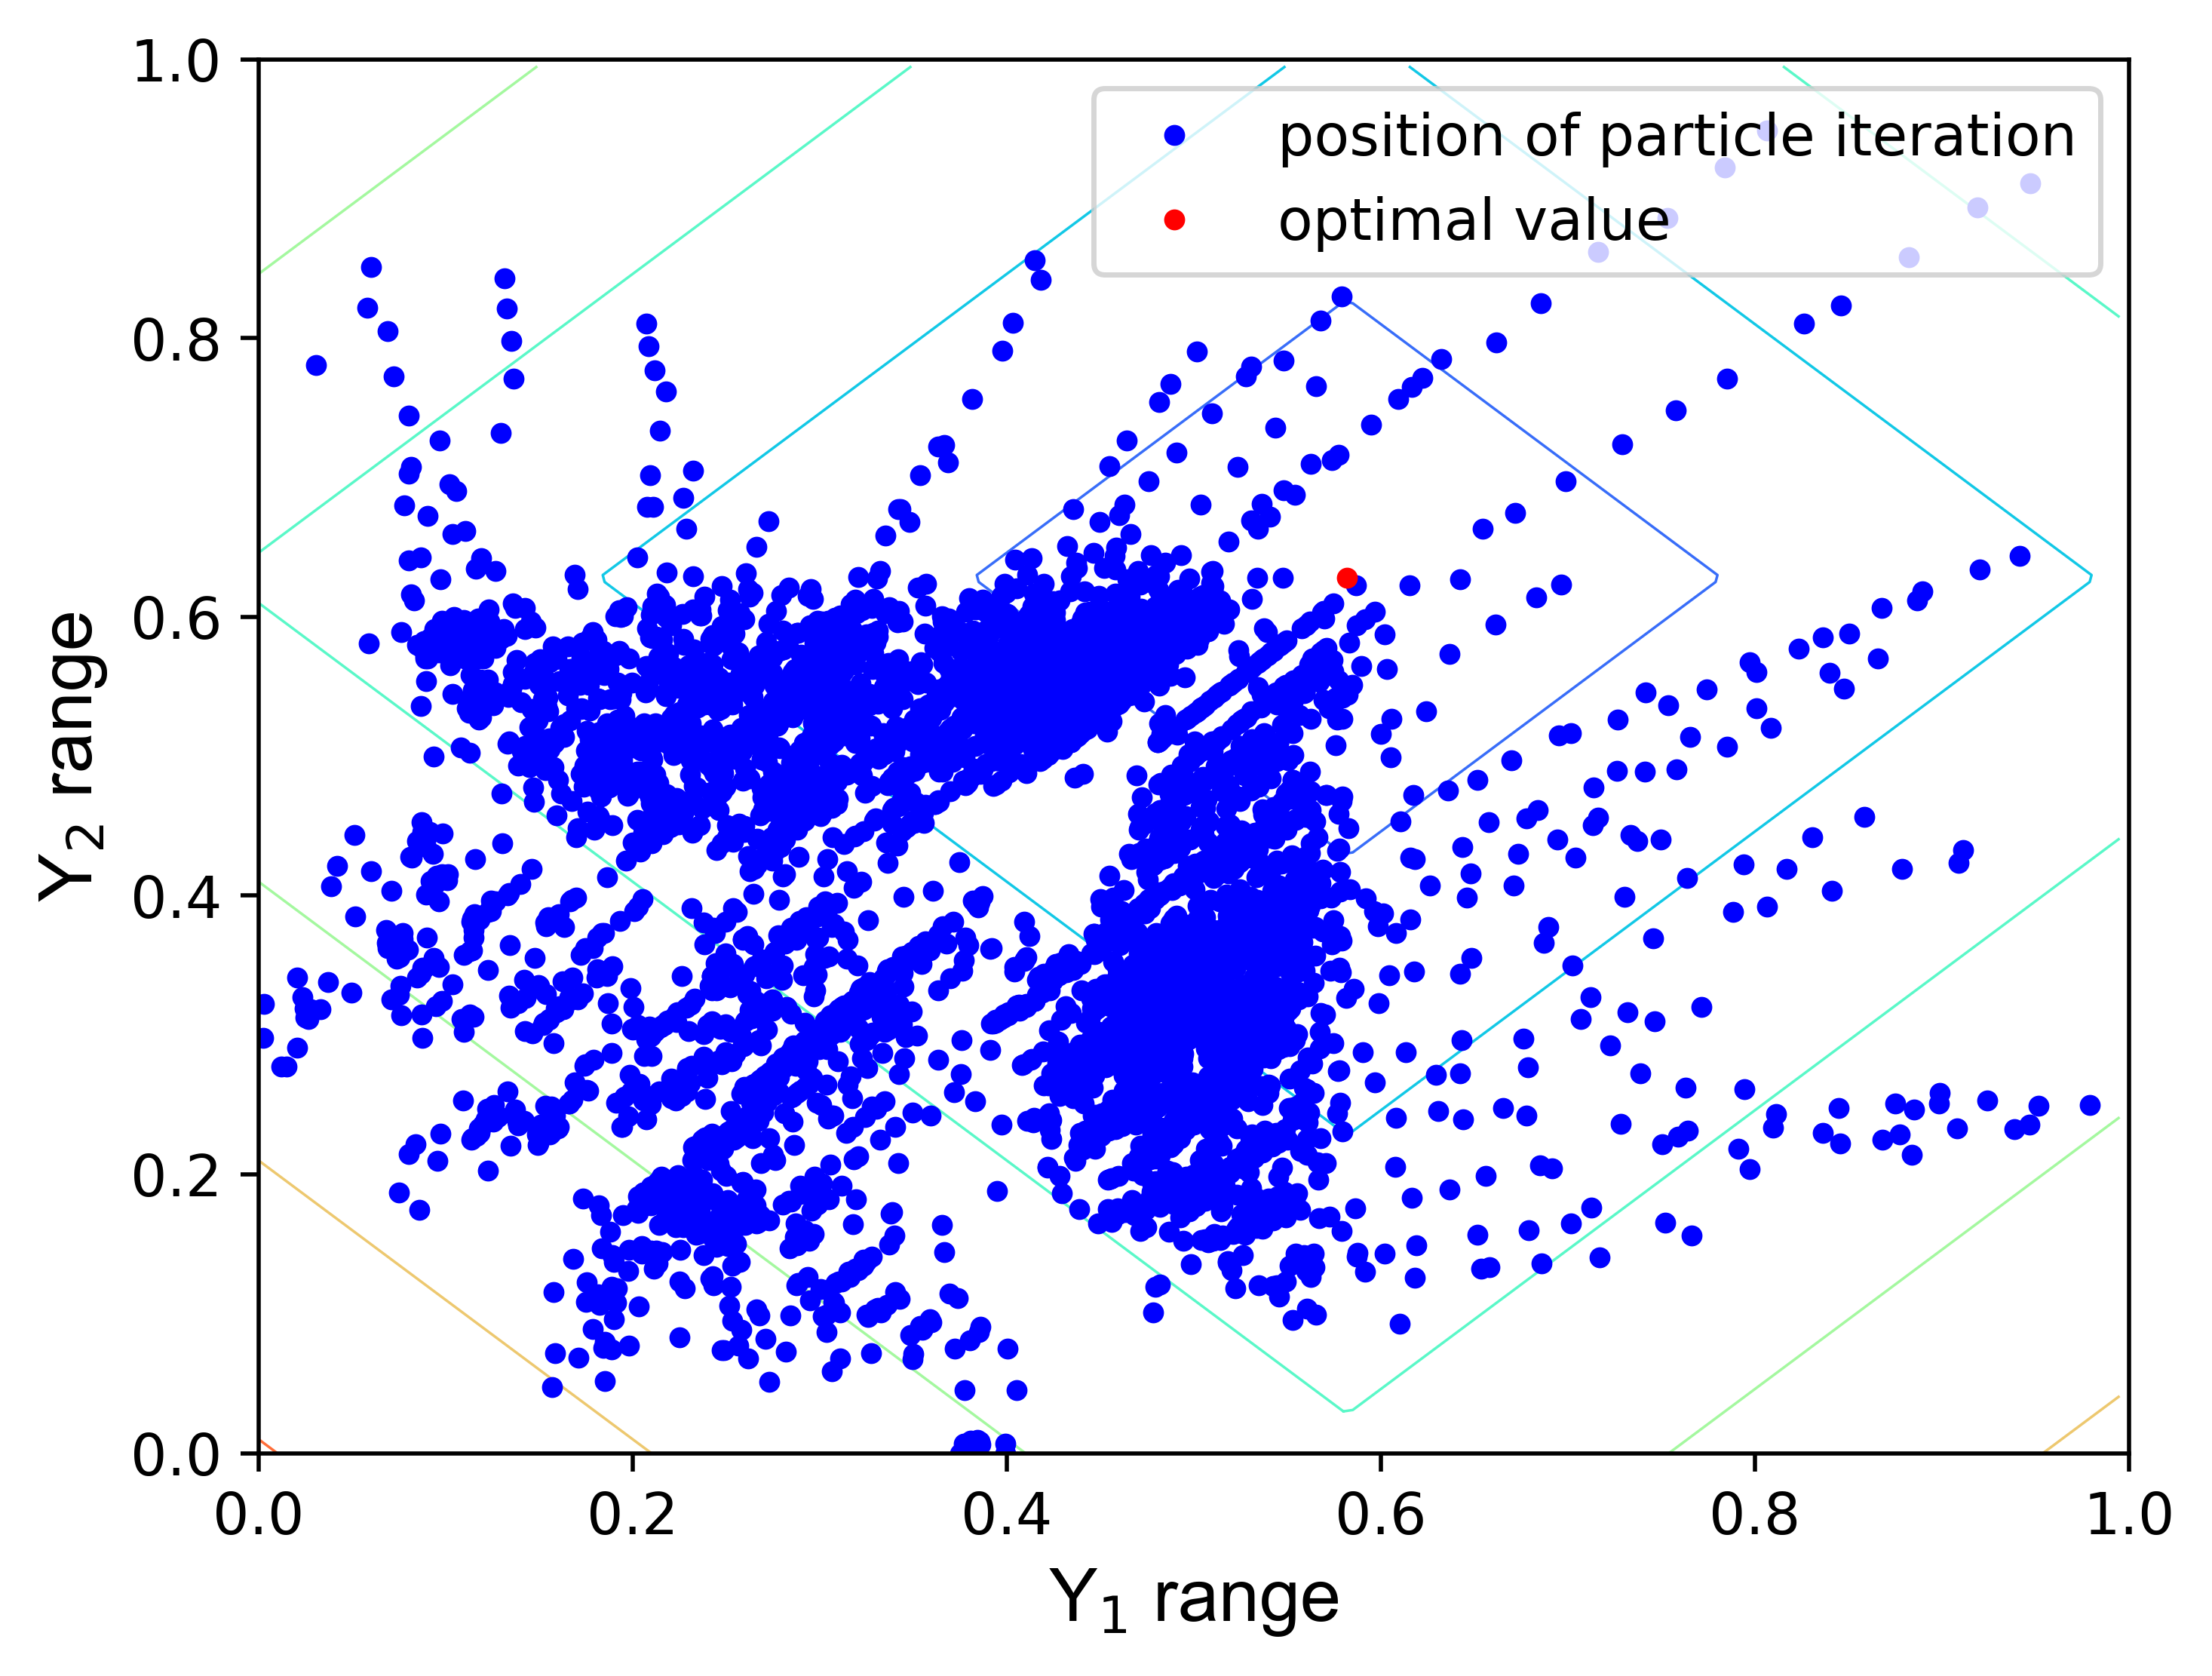
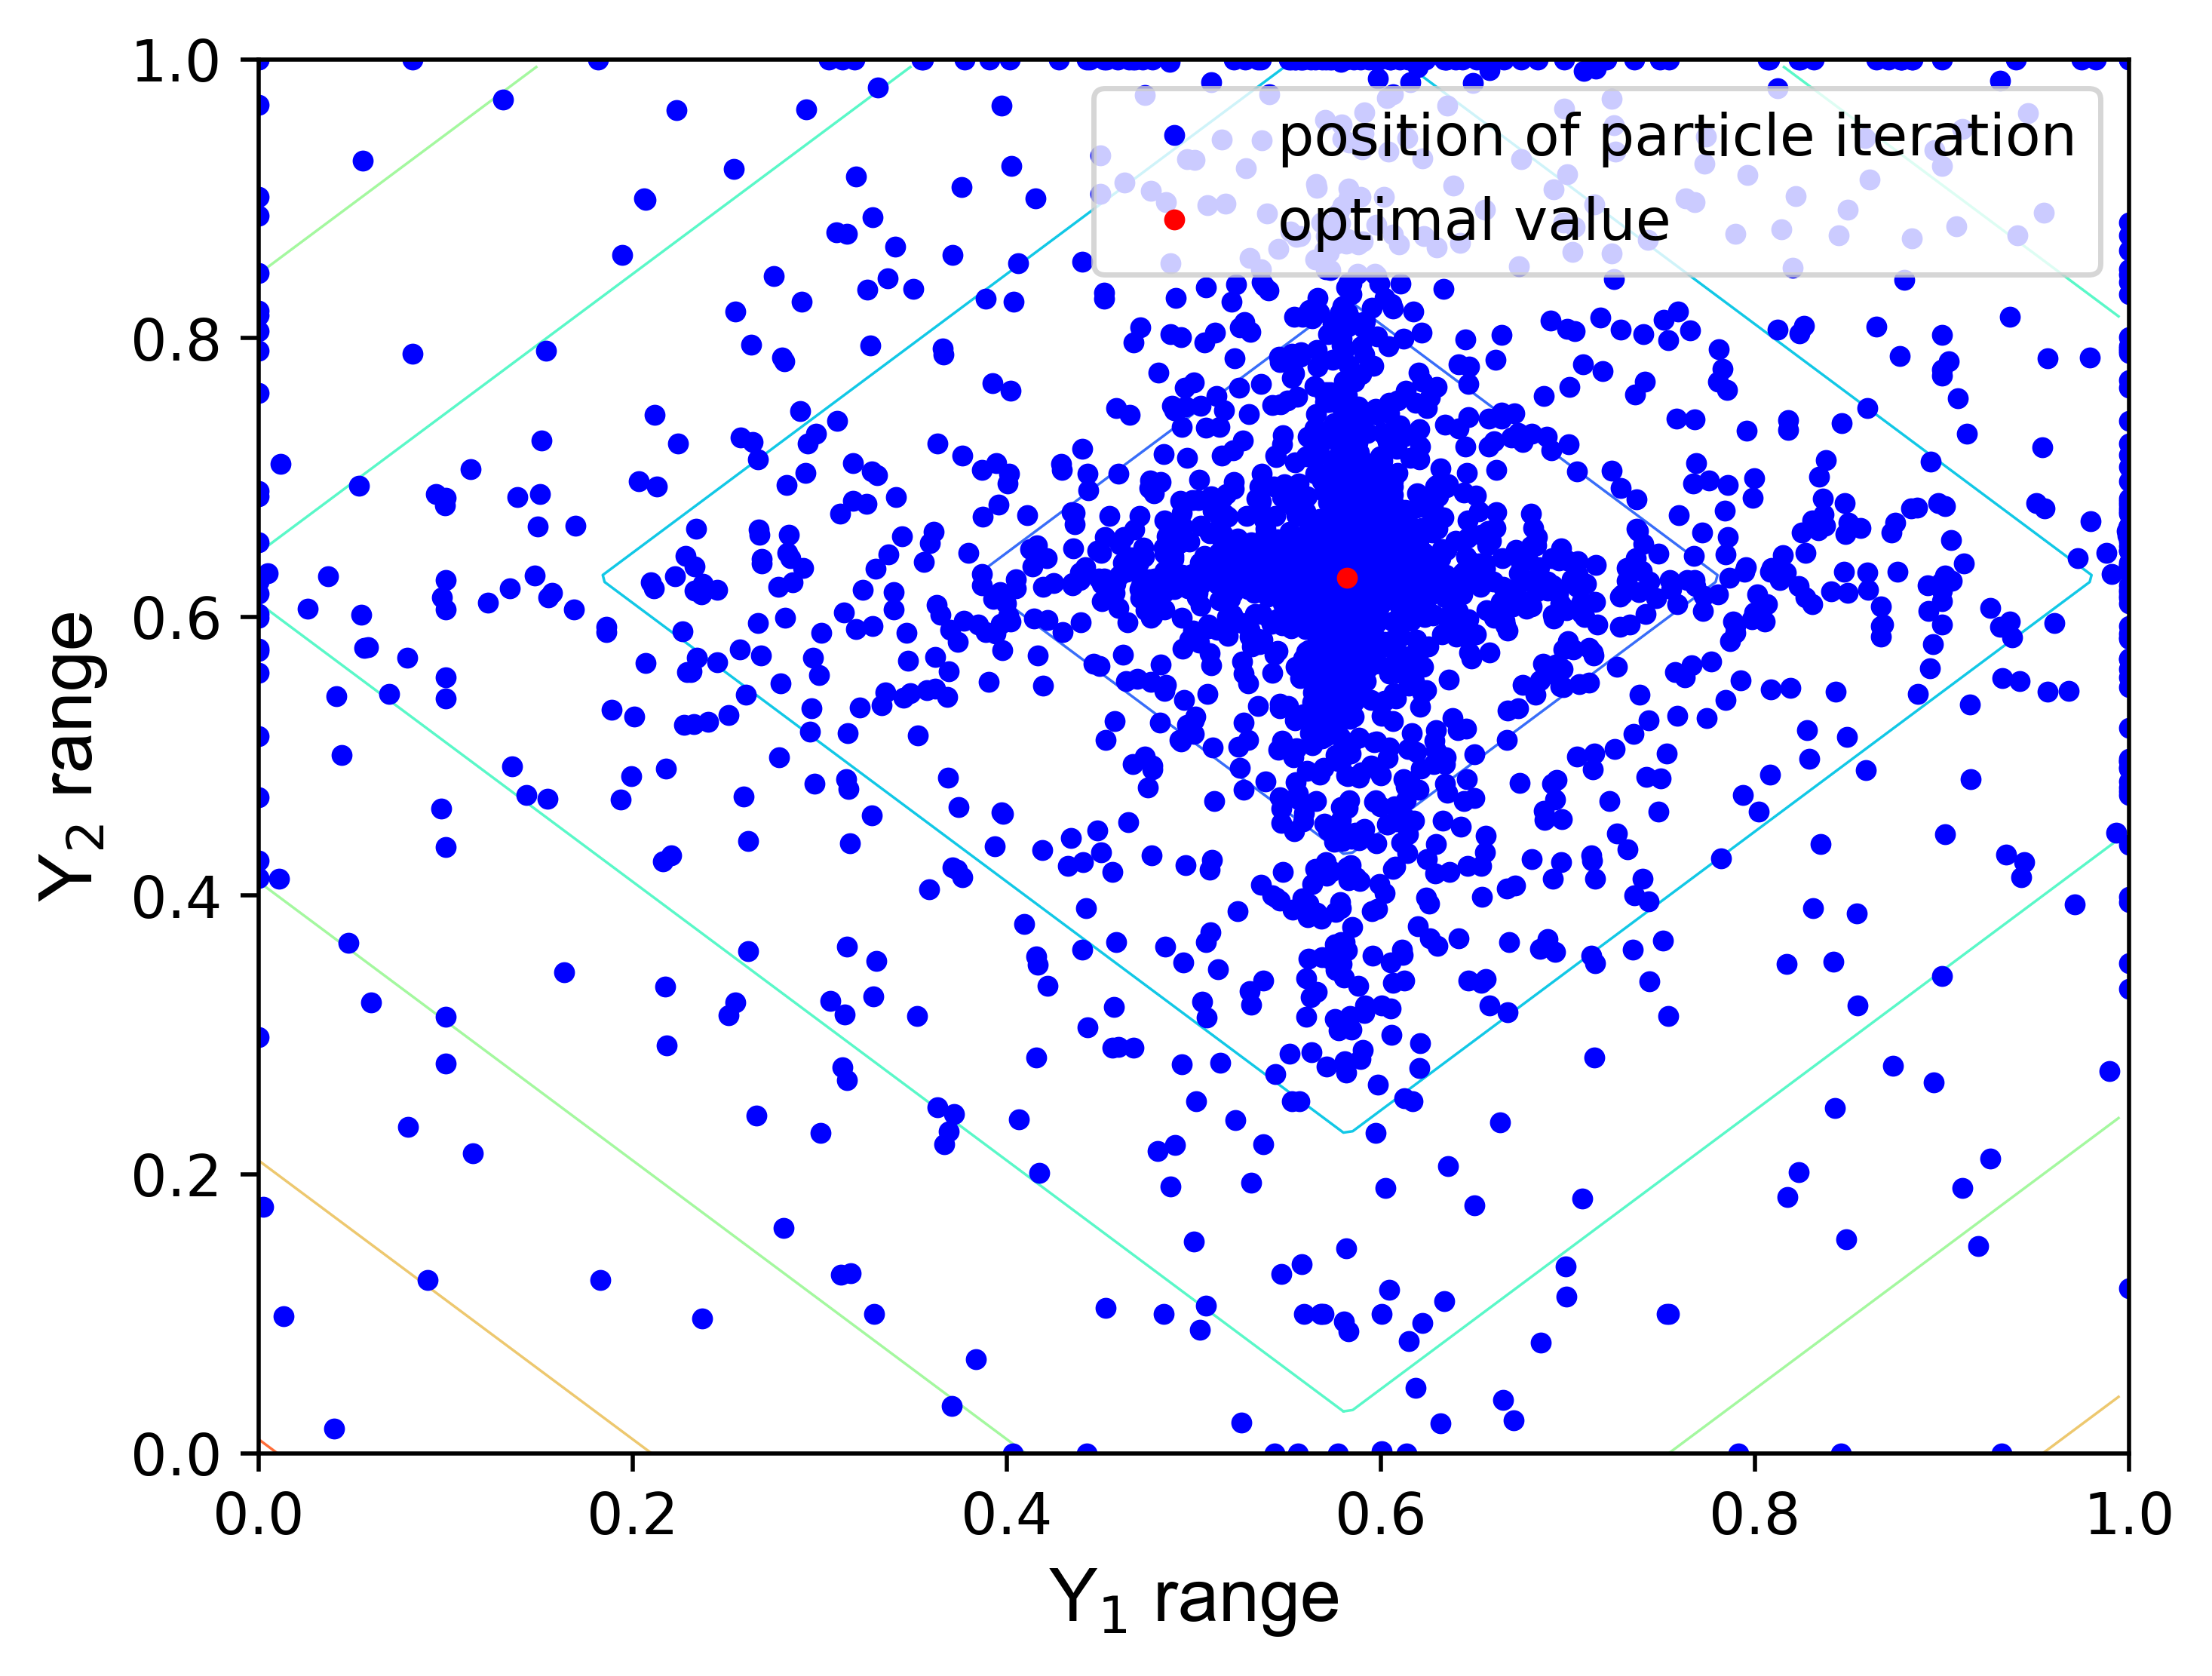
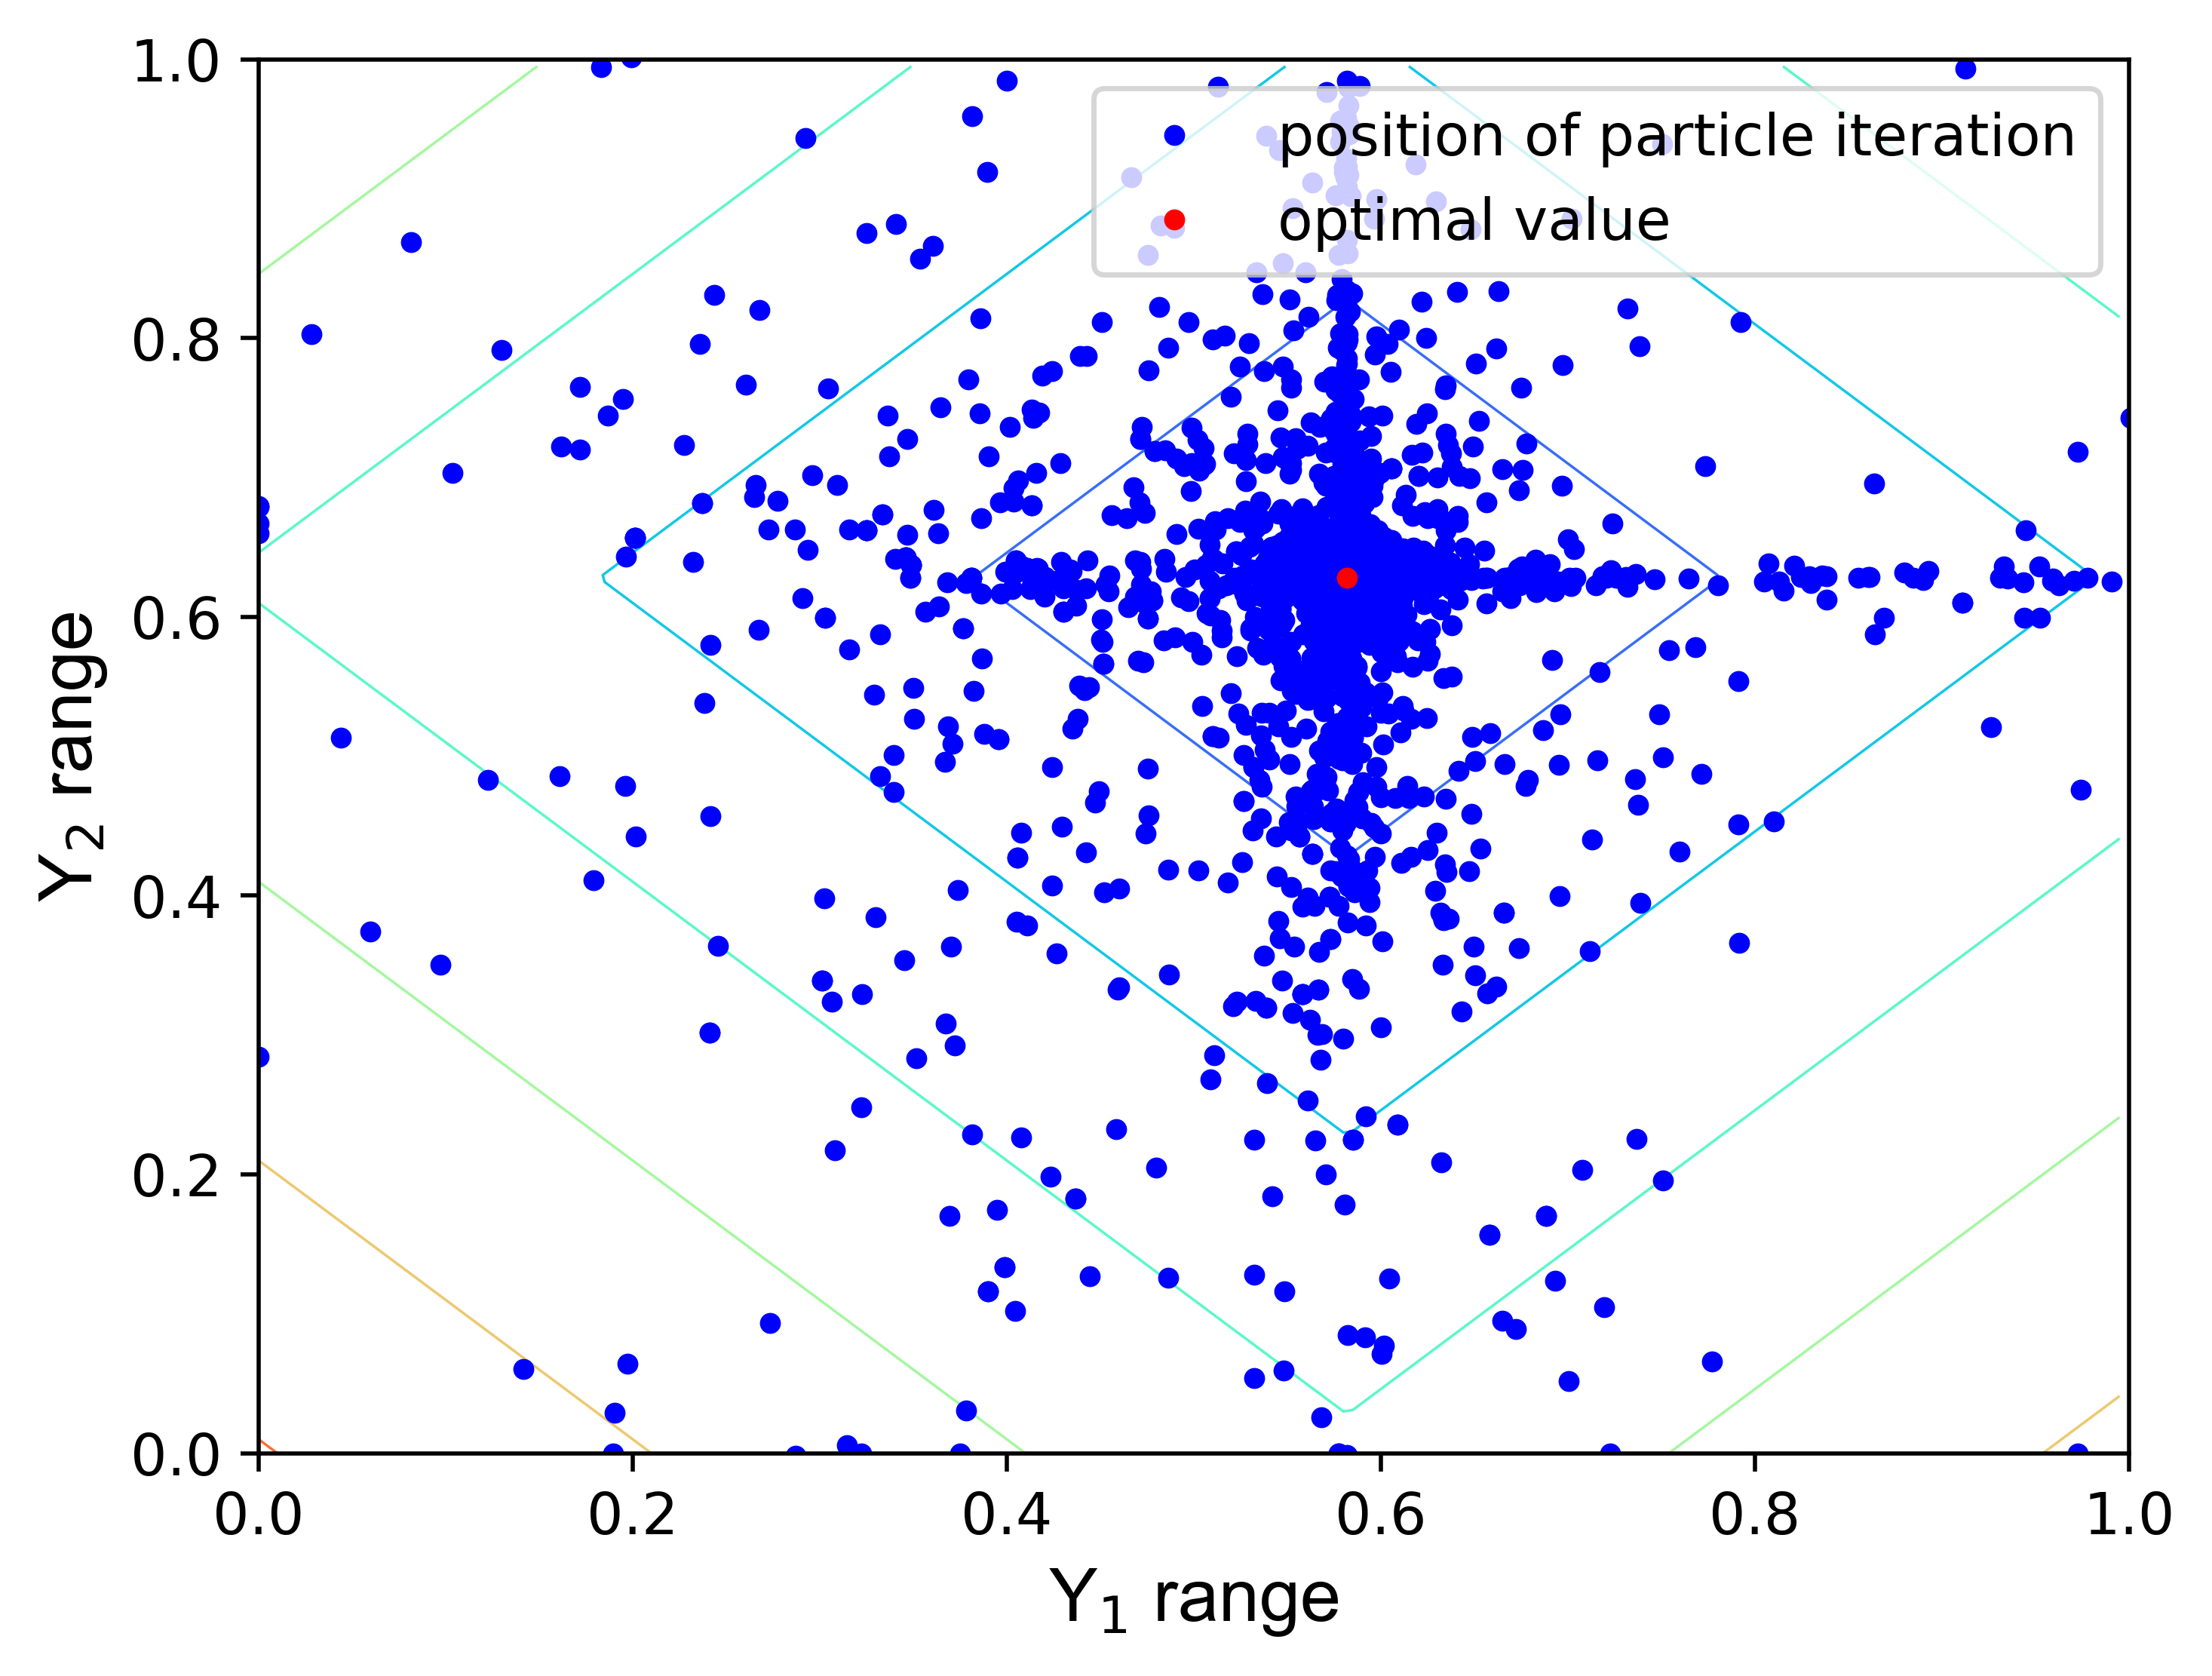
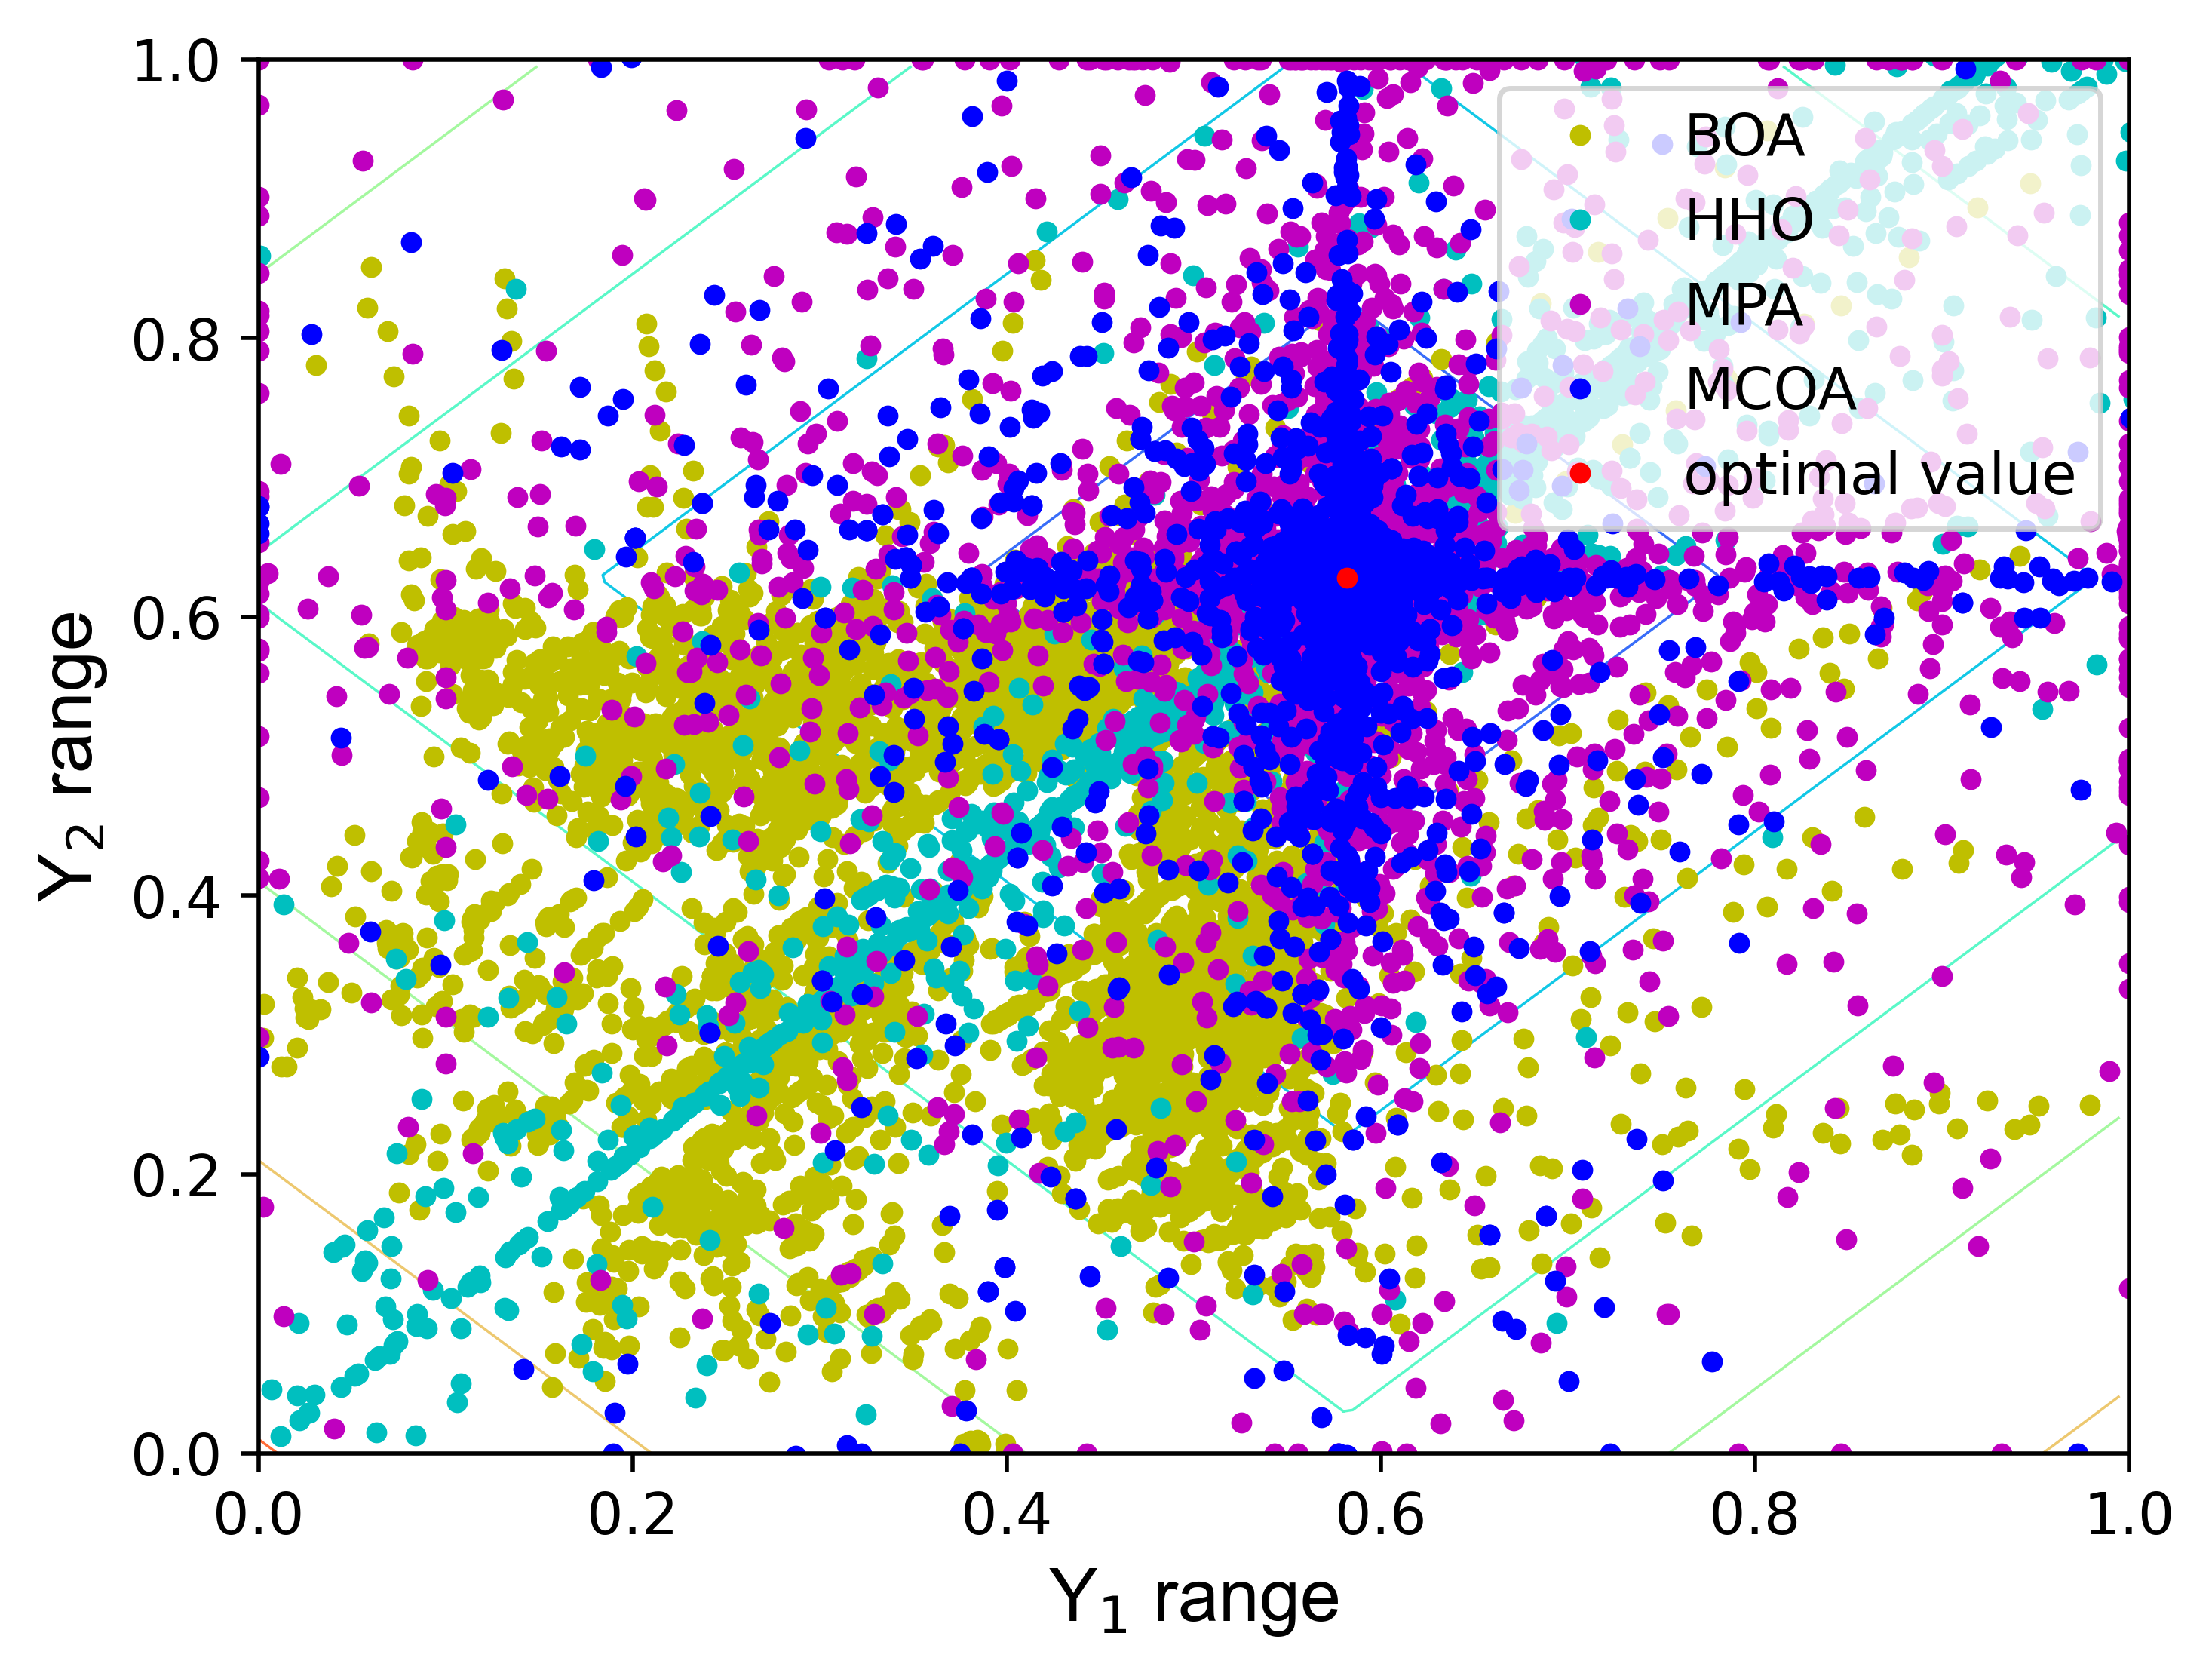
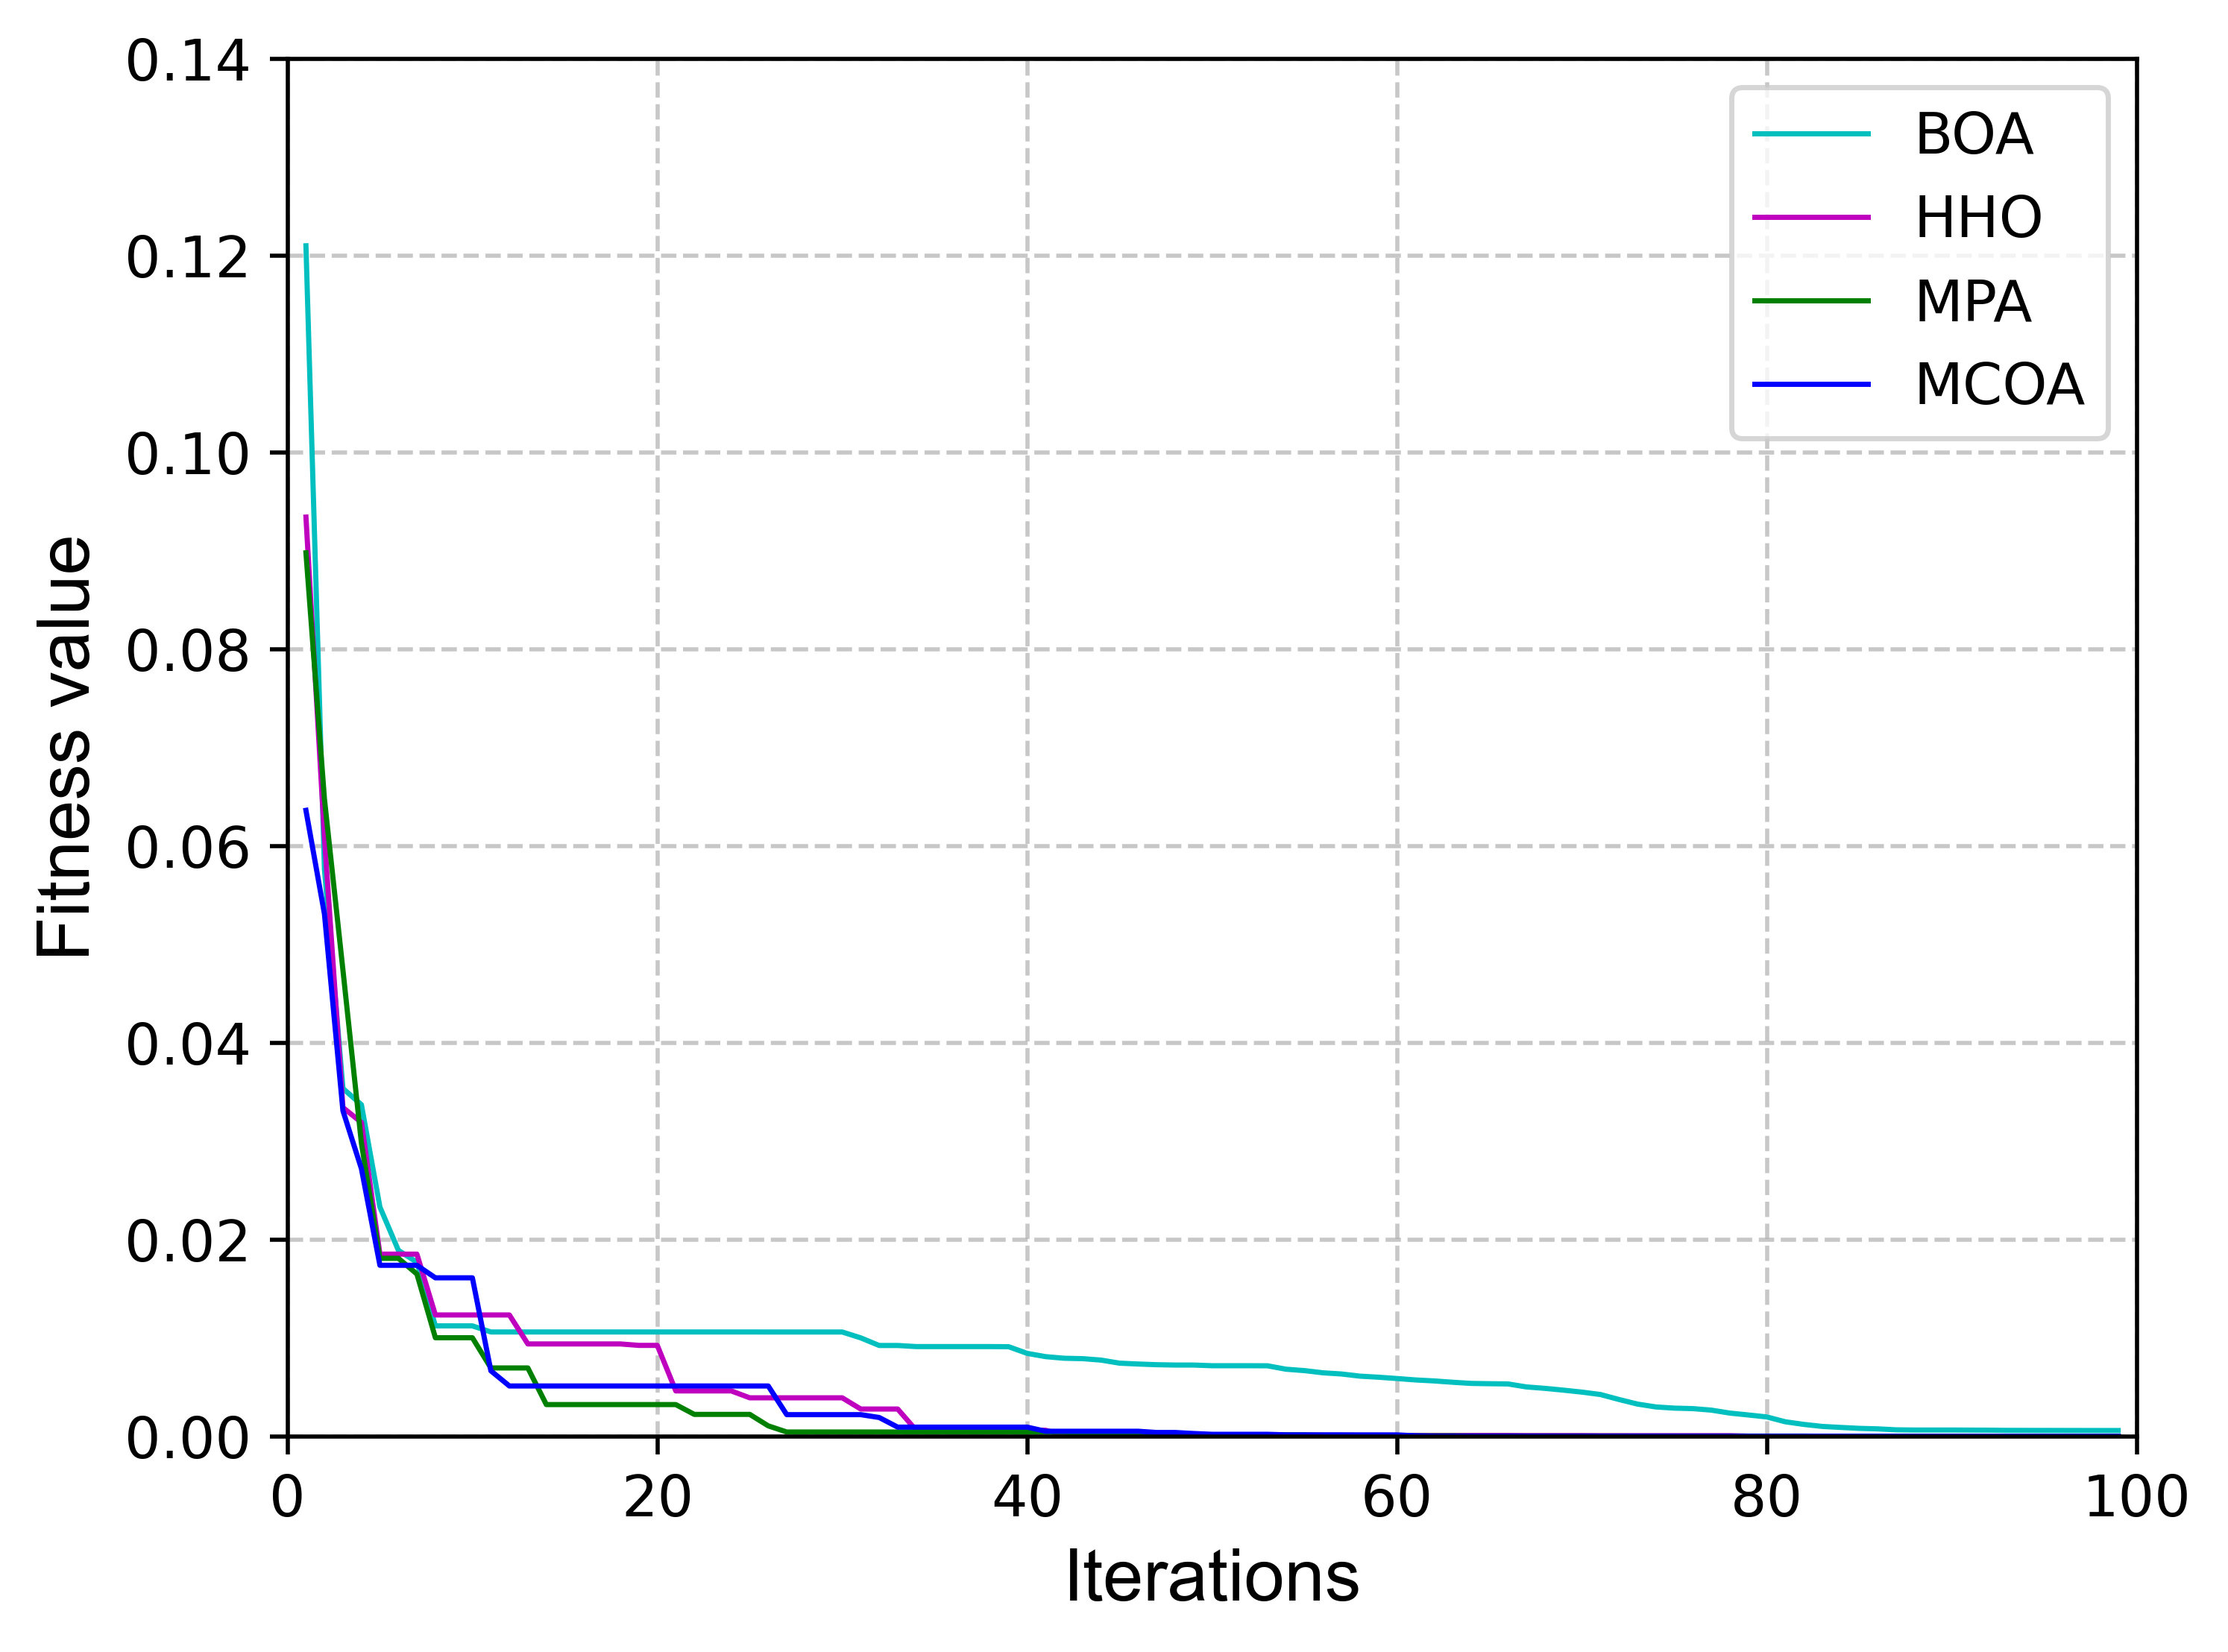
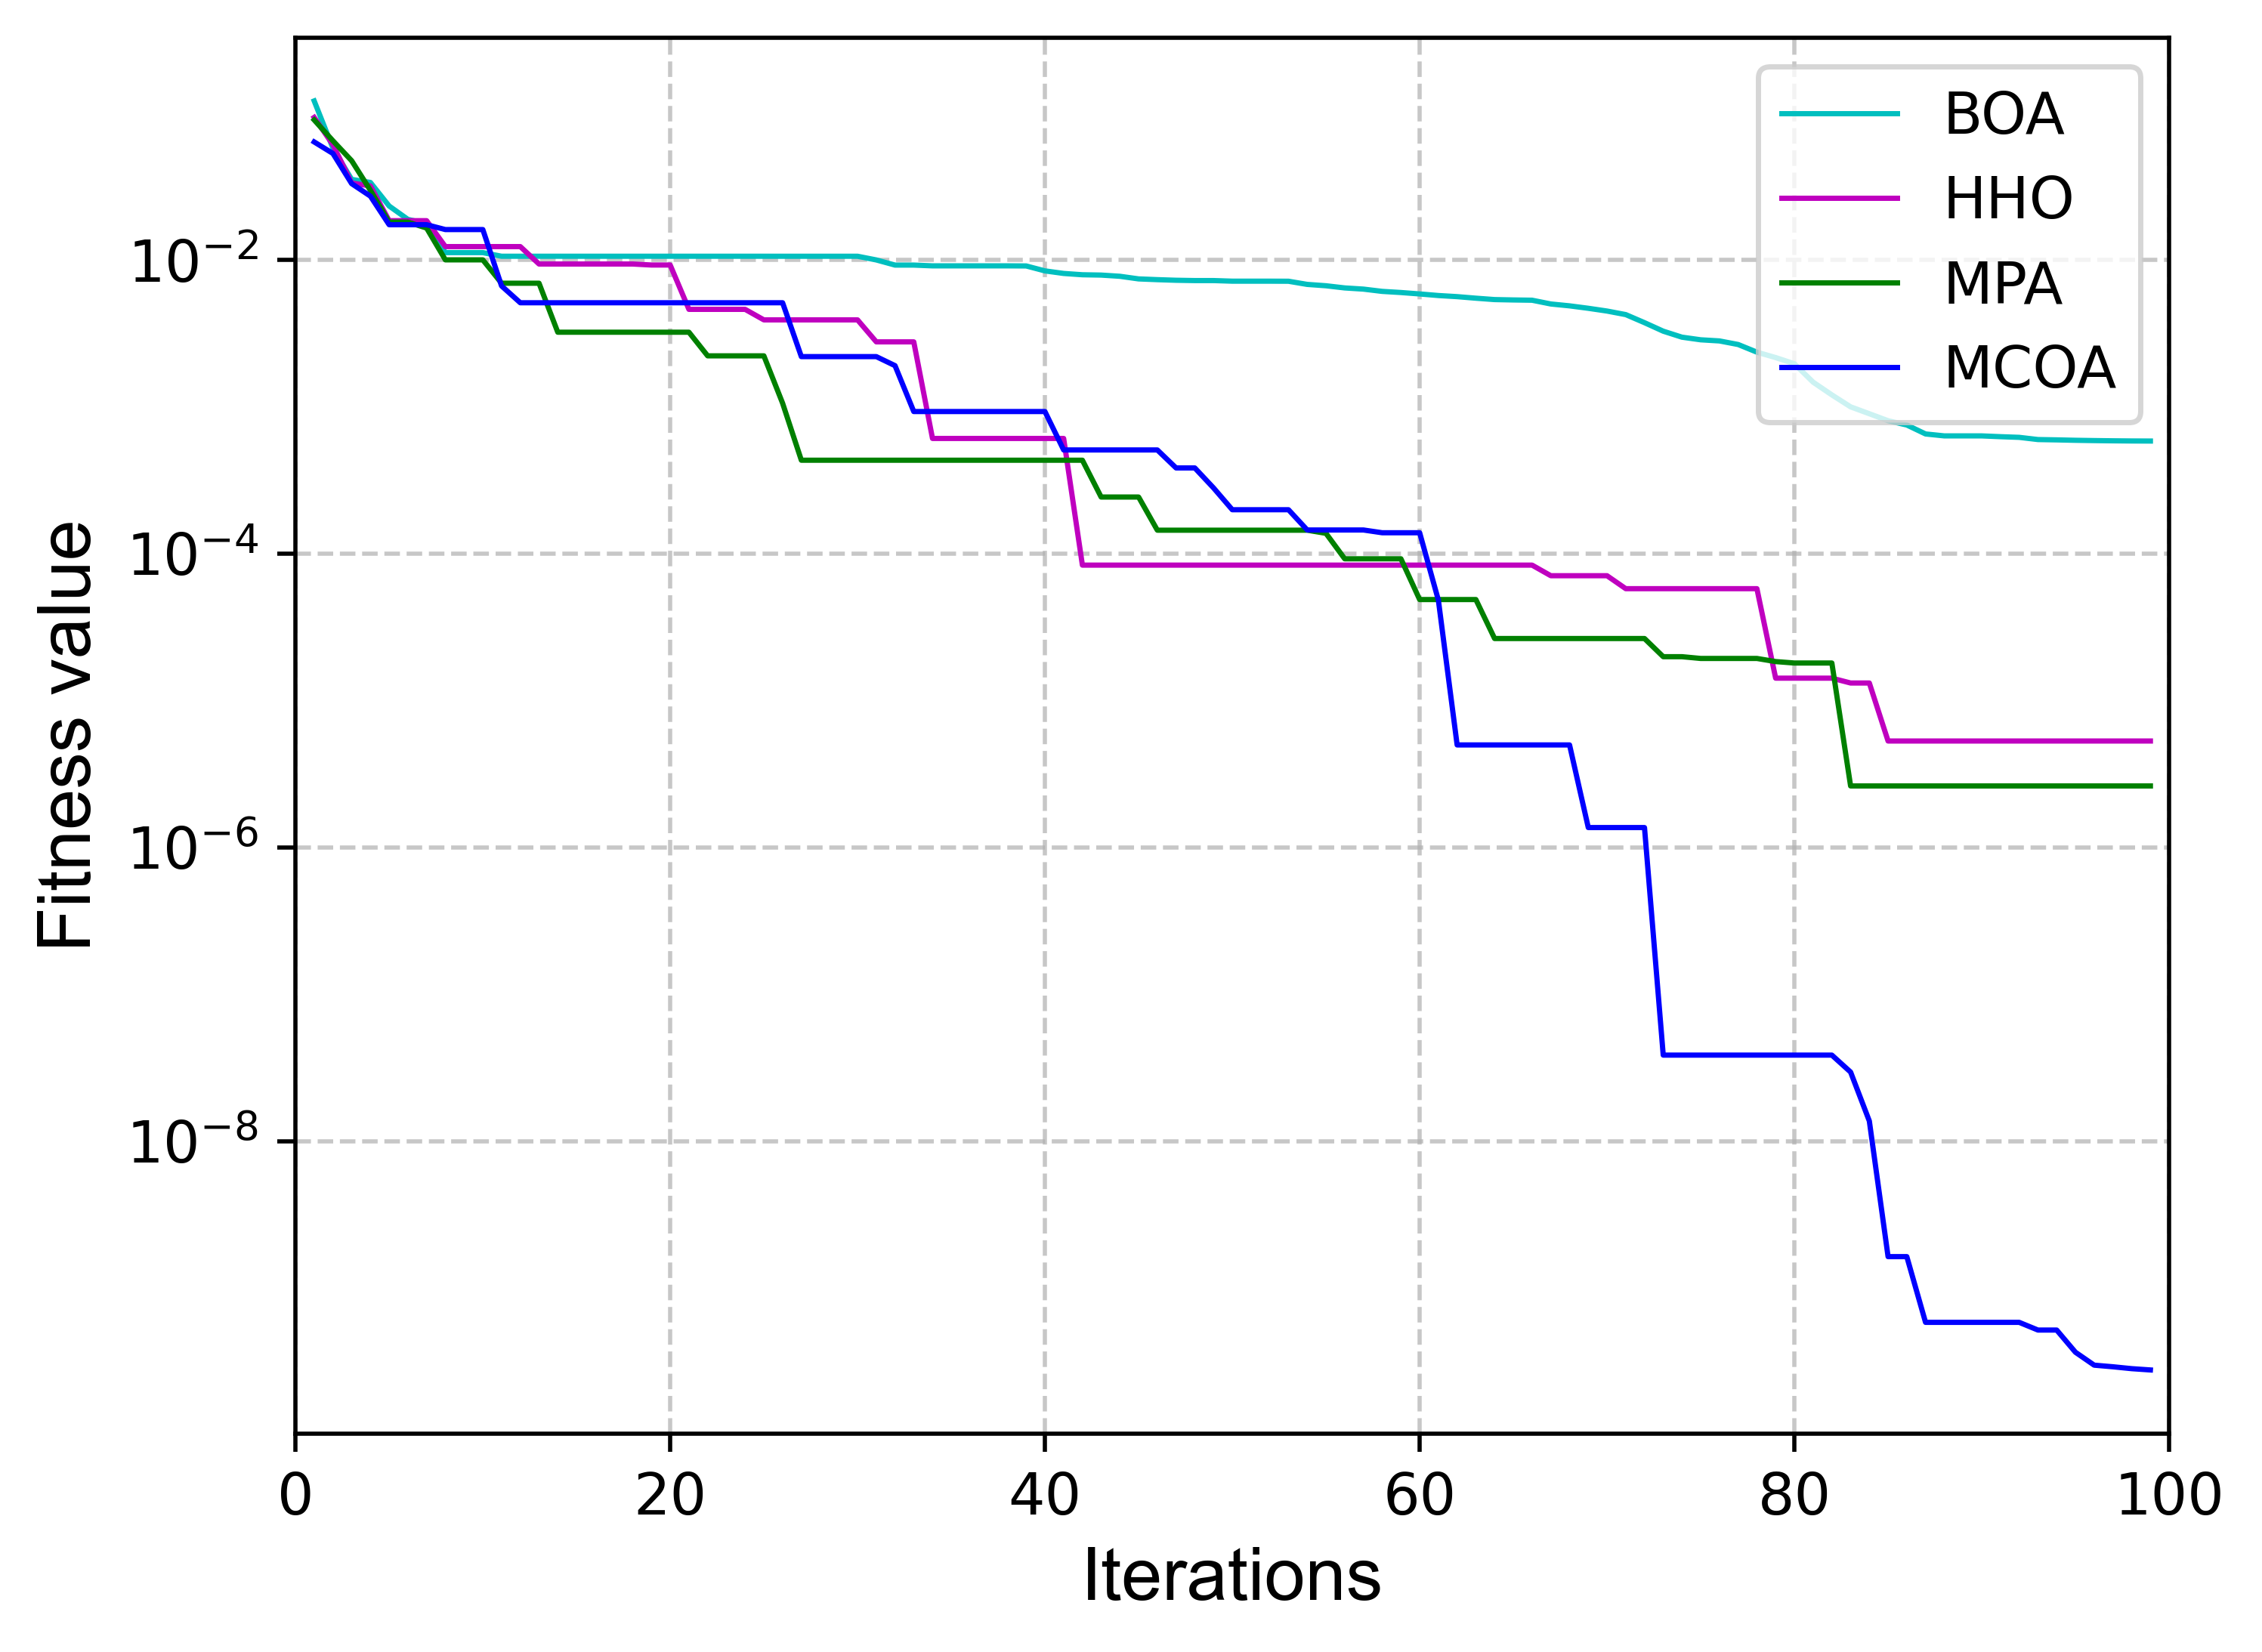
Fig. 11(a) shows the value of the objective function obtained from exhaustive search, and Figs. 11(b)-11(e) show the search trajectory (i.e., historical optimization position) information of the particles in a two-dimensional space over 100 iterations for BOA, HHO, MPA, and our proposed MCOA algorithm, respectively. Fig. 11(f) compares the historical particle optimization position information among the four algorithms over 100 iterations. Fig. 11(g) displays the convergence tendency of the four algorithms in the objective space as the number of iterations increases, and Fig. 11(h) is a logspace representation of Fig. 11(g). By observing Figs. 11(a)-11(f), it can be seen that the search path of the BOA algorithm diverges, making it difficult to find the optimal value. The search path of HHO is diagonal, and tends to overlook the optimal value. Both MPA and the proposed MCOA have search paths that contract from the periphery towards the center, but our proposed algorithm has a more concentrated convergence range and a faster convergence rate. From Figs. 11(g) and 11(h), it can be seen that the BOA algorithm struggles to find the optimal value for the objective function in concern, while both HHO and MPA can locate the optimal value. However, compared to the other algorithms, the proposed MCOA achieves a higher precision and a faster convergence speed.
VII-E Stability Testing of the DT of Tobacco Shredding Line
Because the visualization module is the sink of the data flow of the entire DT system, we can utilize the performance testing module provided by Unity3D for analysis of the resource consumption (such as memory, CPU, GPU, and rendering rate) and processing delay of the DT. After establishing a communication connection between the virtual scene and the entire tobacco shredding line, five groups of comparative tests are conducted on the same process of thin-plate drying. Each group of tests records the data of average frame time used for synchronizing the process data, the quality data, and the movement of the industrial robots in thin-plate drying at the DT side. The stability of the system operation was evaluated through comparative analysis of the data in Table VI.
| Test Group | Synchronization of process data | Synchronization of quality data | Synchronization of robotic movement data |
|---|---|---|---|
| 1 | 9.11 | 9.21 | 25.63 |
| 2 | 8.98 | 9.15 | 26.22 |
| 3 | 9.56 | 9.58 | 25.87 |
| 4 | 9.42 | 9.87 | 25.99 |
| 5 | 9.36 | 9.43 | 26.64 |
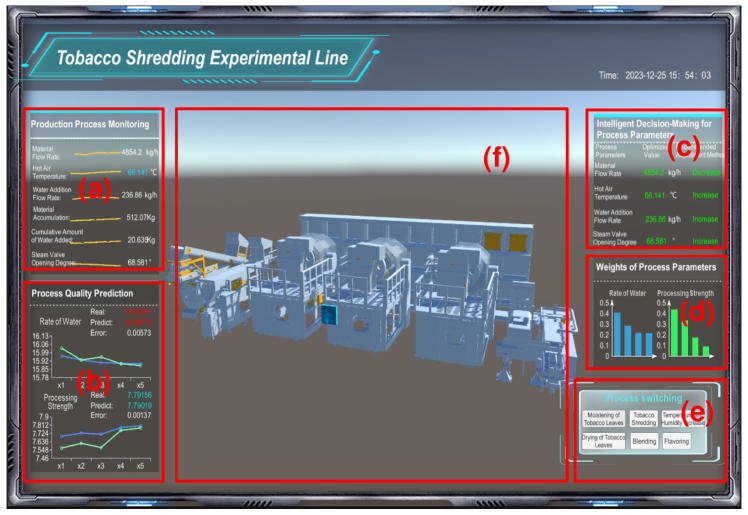
The average frame interval recorded in Table VI indicates the time taken for the visualization interface to refresh one frame with all data synchronized. Typically, human eyes need 30fps to perceive a smooth stream of images. By comparing the five sets of test data, it can be seen that the digital twin system operates stably during the data synchronization and motion stages of the tobacco production line, but there is a significant performance degradation during the mechanical motion visualization stage due to the relatively complex sensor/operation data transmission from the industrial robots, resulting in longer response time. Comparing the data recorded in the five sets, it can be seen that the average frame interval for each operation is relatively stable with negligible fluctuations. Specifically, the average frame interval for motion updates of the production line’s robotic arm is around 25ms, which translates to a frame rate of approximately 40fps, thus meeting the requirements for smooth visualization. The above test results demonstrate that the proposed DT system exhibits good implementability, high accuracy of equipment modeling, excellent visualization/motion response, and low data delays. The 3D visualization module of this DT system can enhance the monitoring efficiency and enable engineers to promptly detect abnormal conditions in production line operations. A snapshot of the human-machine interface of the DT production line is shown in Fig. 12.
VIII Conclusions
To tackle the difficulty in providing an efficient control scheme of the process production lines, this paper propose a Digital Twin (DT)-based framework for product-quality prediction and real-time production parameter optimization. The DT provides a full digital mapping of the physical structure of the process production line. It also serves as a mathematical abstraction of the physical production line by mapping the parameter coupling in the physical processes into the parameters coupling into the virtual domain. Then, based on the real-time prediction of product quality using our proposed composite neural network, we have been able to provide the advice on optimal line parameter adjustment from the twin side to the physical side. Experiments demonstrate that our proposed system is able to achieve an average accuracy of 98% for online product quality control.
The proposed DT-based quality-control framework is easily adaptable for enhancing the production efficiency and process quality of various manufacturing lines, making it suitable for applications in relevant process manufacturing industries. In future research, we plan to combine theories such as heat transfer and fluid mechanics with artificial intelligence methods to establish a partially model-based digital twin production lines, fused with mechanistic modeling, aiming to further improve the accuracy and stability of digital twins under different operating conditions.
References
- [1] T. Yang, X. Yi, S. Lu, K. H. Johansson, and T. Chai, “Intelligent manufacturing for the process industry driven by industrial artificial intelligence,” Engineering, vol. 7, no. 9, pp. 1224–1230, 2021.
- [2] E. Oztemel and S. Gursev, “Literature review of industry 4.0 and related technologies,” Journal of Intelligent Manufacturing, vol. 31, pp. 127–182, 2020.
- [3] L. Yao and Z. Ge, “Big data quality prediction in the process industry: A distributed parallel modeling framework,” Journal of Process Control, vol. 68, pp. 1–13, 2018.
- [4] Y. Lu, C. Liu, I. Kevin, K. Wang, H. Huang, and X. Xu, “Digital twin-driven smart manufacturing: Connotation, reference model, applications and research issues,” Robotics and Computer-Integrated Manufacturing, vol. 61, p. 101837, 2020.
- [5] T. Stock and G. Seliger, “Opportunities of sustainable manufacturing in industry 4.0,” Procedia CIRP, vol. 40, pp. 536–541, 2016, 13th Global Conference on Sustainable Manufacturing – Decoupling Growth from Resource Use.
- [6] J. Fan, S. Hu, D. Chen, Q. Zhang, J. Li, G. Li, X. Song, Y. Jin, B. Chen, and R. Yin, “A study on the essence of process manufacturing,” Strategic Study of Chinese Academy of Engineering, vol. 19, no. 3, pp. 80–88, 2017.
- [7] C. Klingenberg, M. Borges, and J. Antunes, “Industry 4.0 as a data-driven paradigm: A systematic literature review on technologies,” Journal of Manufacturing Technology Management, vol. 32, no. 3, pp. 570–592, 06 2019.
- [8] Y. Xie, J. Yu, S. Xie, T. Huang, and W. Gui, “On-line prediction of ferrous ion concentration in goethite process based on self-adjusting structure rbf neural network,” Neural Networks, vol. 116, p. 1—10, August 2019.
- [9] G. Peng, Y. Chen, Y. Zhang, J. Sun, H. Wang, W. Shen, and et al., “Industrial big data-driven mechanical performance prediction for hot-rolling steel using lower upper bound estimation method,” Journal of Manufacturing Systems, vol. 65, pp. 104–114, 2022.
- [10] T. Wang, X. Wang, R. Ma, X. Li, X. Hu, F. T. S. Chan, and J. Ruan, “Random forest-bayesian optimization for product quality prediction with large-scale dimensions in process industrial cyber–physical systems,” IEEE Internet of Things Journal, vol. 7, no. 9, pp. 8641–8653, 2020.
- [11] C. Ou, H. Zhu, Y. A. W. Shardt, L. Ye, X. Yuan, Y. Wang, and C. Yang, “Quality-driven regularization for deep learning networks and its application to industrial soft sensors,” IEEE Transactions on Neural Networks and Learning Systems, pp. 1–11, 2022.
- [12] X. Yin, Z. Niu, Z. He, Z. Li, and D. Lee, “An integrated computational intelligence technique based operating parameters optimization scheme for quality improvement oriented process-manufacturing system,” Computers & Industrial Engineering, vol. 140, p. 106284, 2020.
- [13] J. Hu, M. Wu, X. Chen, S. Du, W. Cao, and J. She, “Hybrid modeling and online optimization strategy for improving carbon efficiency in iron ore sintering process,” Information Sciences, vol. 483, pp. 232–246, 2019.
- [14] Q. Qi and F. Tao, “Digital twin and big data towards smart manufacturing and industry 4.0: 360 degree comparison,” IEEE Access, vol. 6, pp. 3585–3593, 2018.
- [15] C. Liu, L. Le Roux, C. Körner, O. Tabaste, F. Lacan, and S. Bigot, “Digital twin-enabled collaborative data management for metal additive manufacturing systems,” Journal of Manufacturing Systems, vol. 62, pp. 857–874, 2022.
- [16] M. Zhang, F. Tao, and A. Nee, “Digital twin enhanced dynamic job-shop scheduling,” Journal of Manufacturing Systems, vol. 58, pp. 146–156, 2021.
- [17] F. Tao, M. Zhang, Y. Liu, and A. Nee, “Digital twin driven prognostics and health management for complex equipment,” CIRP Annals, vol. 67, no. 1, pp. 169–172, 2018.
- [18] B. D. Deebak and F. Al-Turjman, “Digital-twin assisted: Fault diagnosis using deep transfer learning for machining tool condition,” International Journal of Intelligent Systems, vol. 37, no. 12, pp. 10 289–10 316, 2022.
- [19] D. Liu, Y. Du, W. Chai, C. Lu, and M. Cong, “Digital twin and data-driven quality prediction of complex die-casting manufacturing,” IEEE Transactions on Industrial Informatics, vol. 18, no. 11, pp. 8119–8128, 2022.
- [20] H. Zhou, S. Zhang, J. Peng, S. Zhang, J. Li, H. Xiong, and W. Zhang, “Informer: Beyond efficient transformer for long sequence time-series forecasting,” in Proceedings of the AAAI Conference on Artificial Intelligence, vol. 35, no. 12, 2021, pp. 11 106–11 115.
- [21] X.-Y. Zhang, M. N. Trame, L. J. Lesko, and S. Schmidt, “Sobol sensitivity analysis: a tool to guide the development and evaluation of systems pharmacology models,” CPT: pharmacometrics & systems pharmacology, vol. 4, no. 2, pp. 69–79, 2015.
- [22] J. Liang, X. Ban, K. Yu, B. Qu, K. Qiao, C. Yue, K. Chen, and K. C. Tan, “A survey on evolutionary constrained multiobjective optimization,” IEEE Transactions on Evolutionary Computation, vol. 27, no. 2, pp. 201–221, 2023.
- [23] F. A. Hashim, K. Hussain, E. H. Houssein, M. S. Mabrouk, and W. Al-Atabany, “Archimedes optimization algorithm: a new metaheuristic algorithm for solving optimization problems,” Applied Intelligence, pp. 1–21, 2020.
- [24] S. Arora and S. Singh, “Butterfly optimization algorithm: a novel approach for global optimization,” Soft computing, vol. 23, no. 3, pp. 715–734, 2019.
- [25] A. A. Heidari, S. Mirjalili, H. Faris, I. Aljarah, M. Mafarja, and H. Chen, “Harris hawks optimization: Algorithm and applications,” Future Generation Computer Systems, vol. 97, pp. 849–872, 2019.
- [26] A. Faramarzi, M. Heidarinejad, S. Mirjalili, and A. H. Gandomi, “Marine predators algorithm: A nature-inspired metaheuristic,” Expert Systems with Applications, vol. 152, p. 113377, 2020.