DESI constraints on varying electron mass model and axion-like early dark energy
Abstract
Baryon acoustic oscillation (BAO) is one of the important standard ruler in cosmology. The results of the latest BAO measurements by Dark Energy Spectroscopic Instrument (DESI) survey has been reported. Cosmology with the varying electron mass model and the early dark energy (EDE) models are regraded as interesting models to resolve the Hubble tension. We present constraints on the varying electron mass model and EDE models by including new DESI data as well as cosmic microwave background by Planck and the conventional BAO data from 6dF, MGS, and DR12 and supernovae light curve data into analysis. Since new DESI BAO data indicates slightly longer sound horizon than the other BAO observations, for the varying electron mass model, the larger kmsMpc is indicated.
I Introduction
The CDM model has been successful in explaining observations of the universe at various redshifts. However, as observations have become more precise, a discrepancy has emerged between the Hubble constants from distant (high redshifts) observations and local (low redshifts) observations. The spectrum of temperature anisotropy of the cosmic microwave background (CMB) infers the present Hubble parameter as Aghanim et al. (2020a). By combining CMB, baryon acoustic oscillations (BAO) and Big Bang nucleosynthesis (BBN) data, we find Schöneberg et al. (2022a). Other distant observations Dutcher et al. (2021); Aiola et al. (2020); Schöneberg et al. (2019) also report consistent values of with the Planck measurement. On the other hand, local measurements of the Hubble constant have reported as by the SH0ES Riess et al. (2022) and by the H0LiCOW Wong et al. (2020). The method of SNe Ia and the Tip of the Red Giant Branch (TRGB) observations reported a slightly lower Hubble constant, Freedman et al. (2020). This discrepancy is called the Hubble tension.
Among various ideas to solve the Hubble tension Di Valentino et al. (2021); Abdalla et al. (2022); Perivolaropoulos and Skara (2022); Freedman (2021); Schöneberg et al. (2022b); Vagnozzi (2023), the varying electron mass (varying ) model and the early dark energy (EDE) models are regarded as the most promising solutions Schöneberg et al. (2022b). If we assume that the electron mass was larger by a few percent than the present value keV before the recombination epoch , then the varying electron mass model seems a potential solution to the Hubble tension Ade et al. (2015); Sekiguchi and Takahashi (2021); Seto and Toda (2023); Hoshiya and Toda (2023); Solomon et al. (2022), because shorter sound horizon scale at the recombination epoch indicates smaller .
The EDE model Poulin et al. (2018, 2019); Braglia et al. (2020); Agrawal et al. (2023); Ye and Piao (2020); Smith et al. (2020); Lin et al. (2019); Niedermann and Sloth (2021, 2020) has been intensively also studied as a possible solution to the tension. In the EDE model, temporal energy of EDE before the recombination epoch makes the sound horizon shorter, which results in smaller inferred . The EDE models are constrained not to increase the amplitude of matter fluctuation Poulin et al. (2018) or the baryon density Seto and Toda (2021); Takahashi and Toda (2023).
Many models of EDE are proposed with different potentials, but in this paper, we focus on the axion-like EDE Poulin et al. (2018), which could explain the cosmic birefringence Capparelli et al. (2020); Murai et al. (2023) suggested by the recent analyses of the Planck data Minami and Komatsu (2020); Diego-Palazuelos et al. (2022).
Dark Energy Spectroscopic Instrument (DESI) survey has reported the results of the latest BAO measurements Adame et al. (2024a, b) and that the cosmological constant dark energy is discrepant with the combination analysis of DESISDSSCMBPantheonPlus Adame et al. (2024c), where is the derivative of the equation of the parameter with respect to the scale factor . To explain this result, many extended models of dark energy have been discussed Tada and Terada (2024); Cortês and Liddle (2024); Carloni et al. (2024); Giarè et al. (2024); Christiansen et al. (2024); Wang and Piao (2024); Qu et al. (2024); Poulot et al. (2024); Andriot et al. (2024); Pookkillath and Koyama (2024). In this paper, we discuss implication of the DESI BAO results to the varying model and the axion-like EDE model.
II Models
II.1 Varying electron mass
In the varying electron mass model, we assume that the value of the electron mass at early Universe differs from its present value and it dramatically changes to the current value after the recombination is complete. As discussed in the previous work Ade et al. (2015), the primary contribution of an increased electron mass is the increasing energy level of hydrogen and Lyman alpha photon, both of which are directly proportional to the electron mass . Since the energy level of hydrogen is higher, a photon energy at the standard recombination temperature is too small to excite the hydrogen. In theory with large electron mass, the recombination takes place earlier than the standard and the resultant sound horizon becomes shorter. Thus, to reproduce the same measured multiple moment of acoustic peaks of CMB power spectrum, the larger electron mass results in a shorter diameter distance and a higher .
Another consequence of the increased electron mass is Thomson scattering rate which is proportional to and suppresses the peak of high- CMB power spectrum. The other minor contributions include the photoionization cross-sections, the recombination coefficient, K-factors, Einstein A coefficients, and the two-photon decay rates (see Ref. Ade et al. (2015) for the detail).
The varying electron mass model can significantly relieve the Hubble tension without spoiling the CMB fitting because there is the degeneracy between cold dark matter density , baryon density , and the sound horizon scale in the CMB spectrum, which transformed into the degeneracy between and . On the other hand, the BAO bound can resolve this degeneracy, a negative model with positive spatial curvature weakens the BAO constraints on variation of nevertheless. Therefore, it is also important to consider the combination of varying Sekiguchi and Takahashi (2021).
To examine the varying electron mass model, we make all the above mentioned modifications to the recombination code recfast Scott and Moss (2009) and perform the MCMC analysis sampling in addition to the standard parameters.
II.2 Axion-like EDE
The potential of the axion-like EDE takes the form Poulin et al. (2018)
| (1) |
where is the energy scale of the potential, is the breaking scale of shift symmetry, and is the power index of the cosine function. As in the previous paper by Poulin et al Poulin et al. (2019), we use the three phenomenological parameters: , , and , which stand for the redshift when starts to oscillate, the initial value of the scalar field , and the energy fraction of EDE to the total energy density at . After the transition , the energy density of EDE decreases as for , which is faster than the background energy density does.
To examine the axion-like EDE, we use the camb Howlett et al. (2012) where axion-like EDE is already implemented and perform the MCMC analysis sampling , , and in addition to the 6 standard parameters.
III Data sets and methodology
We perform a Markov-chain Monte Carlo (MCMC) analysis on the time-varying electron mass model and the axion-like EDE, using the public MCMC code CosmoMC-planck2018 Lewis and Bridle (2002). We analyze the models by referring to the following cosmological observation and we call the above three data that are always included.
IV Results
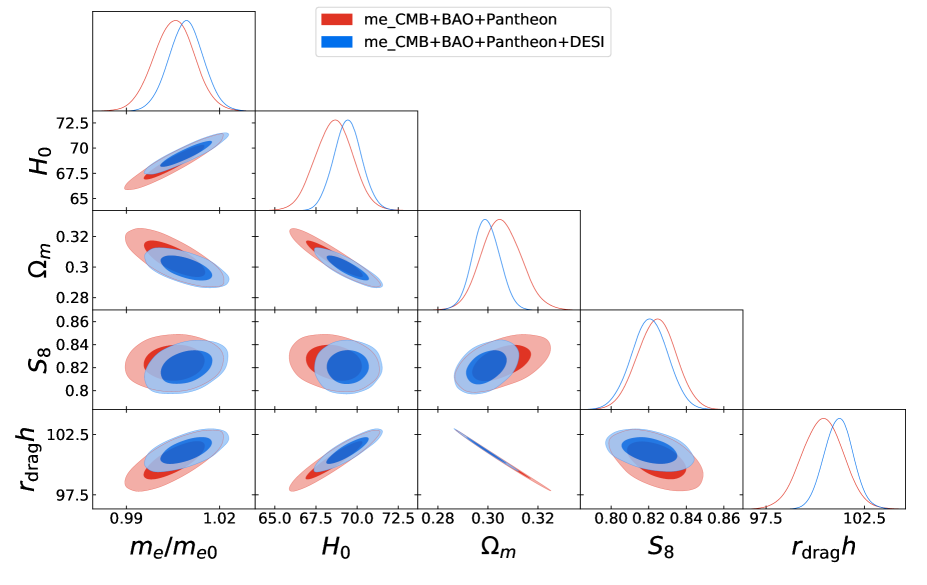
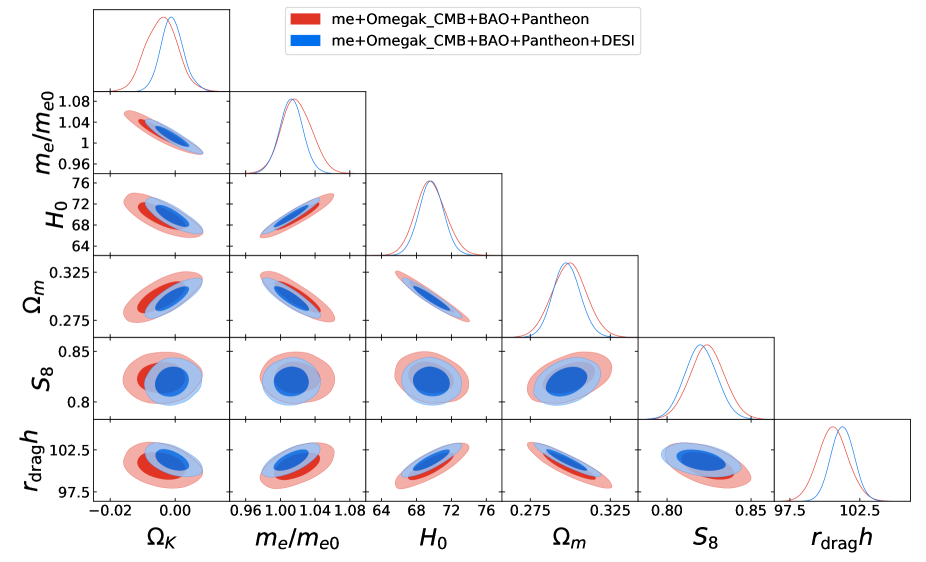
We present the results of models we have examined. Those likelihood are shown in Fig. 1 and parameter values in the best-fit points are listed in Tab. 1.
We find that the DESI BAO results disfavor lower and indicate slightly larger electron mass (CMB+BAO+DESI BAO). This indicates the shorter sound horizon at the recombination and larger than the analysis without DESI BAO. This is due to the measured sound horizon relative to the diameter distance by DESI BAO. Here, we define the sound horizon
| (2) | ||||
| (3) | ||||
| (4) |
and , where is the redshift of the drag epoch. Diameter distance is inversely proportional to the Hubble constant . Therefore, in the BAO measurements, a product of the sound horizon and the Hubble constant is constrained. For the greater electron mass, the Hubble constant increases while the sound horizon slightly decreases, and the product increases, which is preferred from DESI BAO measurements as in Fig. 1.
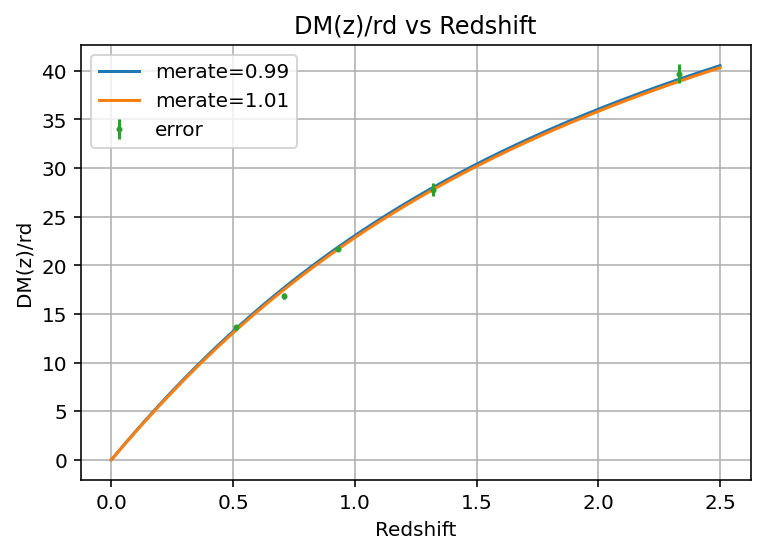
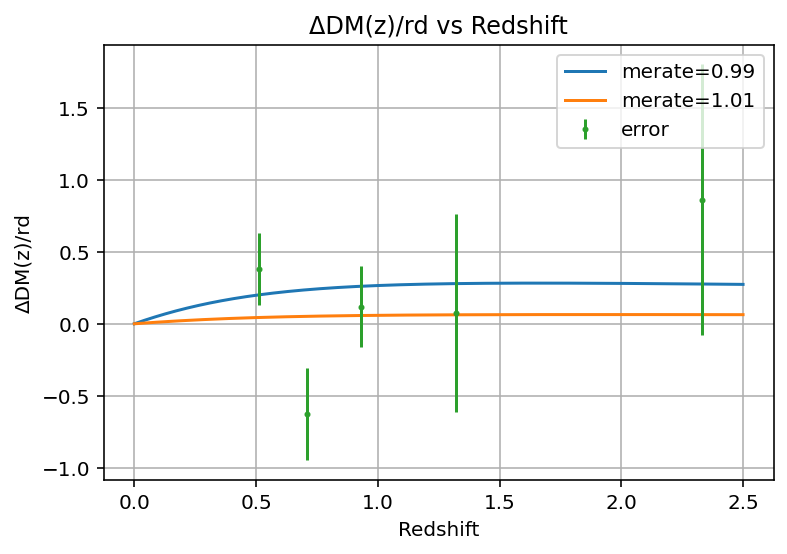
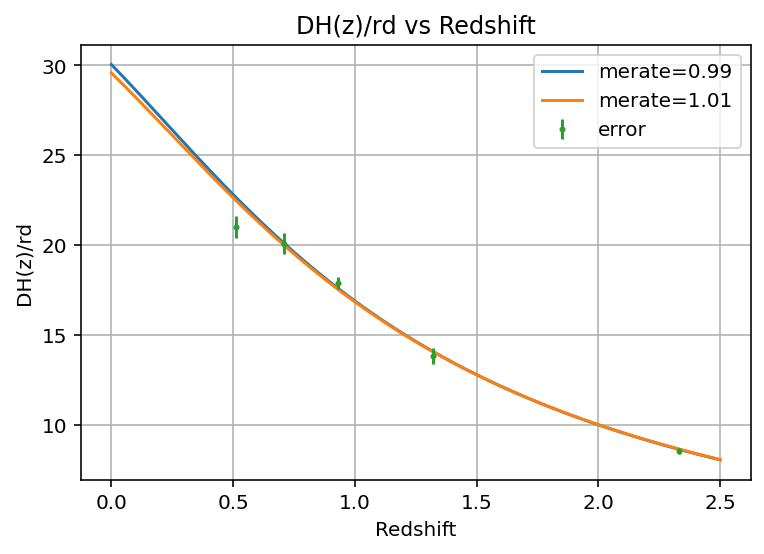
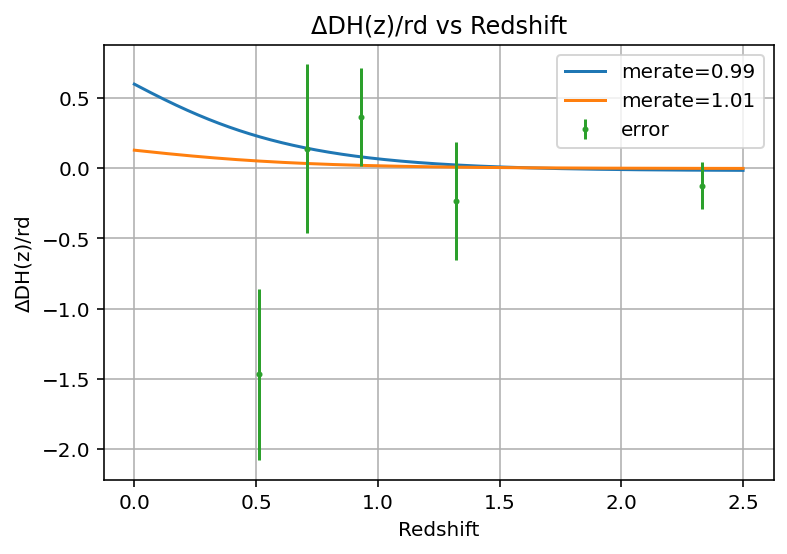
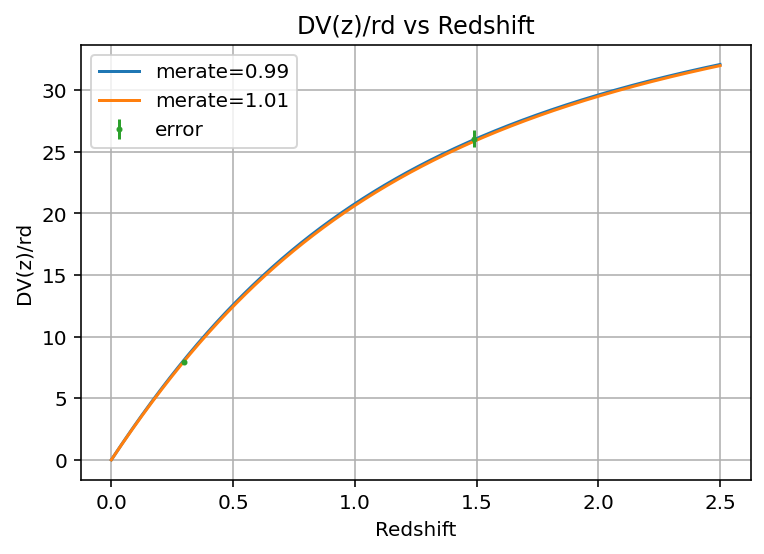
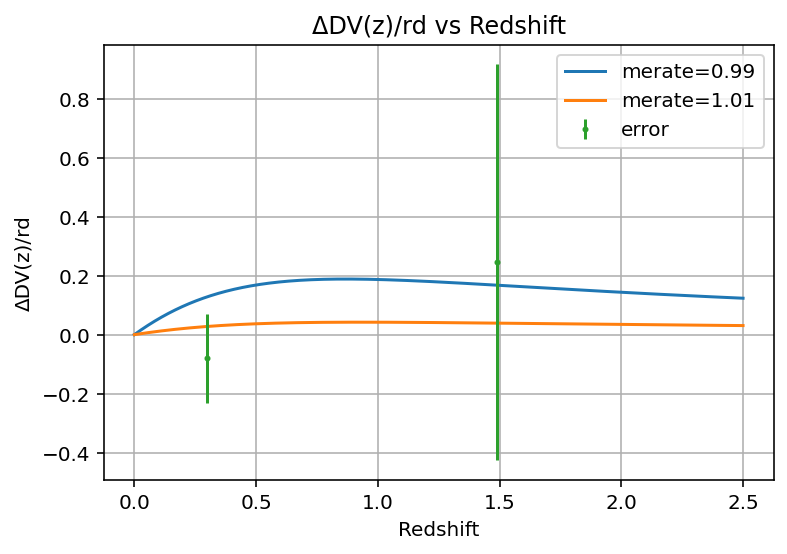
We show the best-fit point of km/s for and km/s for for the data combination of CMBBAOJLADESI BAO, in the Tab 2. As a result using only DESI BAO analysis, we quote km/s for the best-fit point of CDM model from the DESI paper Adame et al. (2024c). By comparing those, for the smaller electron mass, the Hubble constant becomes too small, and the sound horizon relative to the diameter distance becomes too short, which leads to poor DESI fitting. The difference in the values accounts for as in Tab 2. Figs. 2, 3, and 4 show the comoving diameter distance over the sound horizon at the drag epoch , the Hubble distance over the sound horizon at the drag epoch and the angle-average distance over the sound horizon at the drag epoch of and models, respectively, as the function of redshifts with the error bar of the DESI measurements.
Next, we discuss the results of varying in a curved Universe (the model). As is shown in the DESI paper Adame et al. (2024c), we also find that a positive curvature () model does not fit the DESI BAO data and a spatially flat () Universe is preferred when DESI BAO data are included. The central value of a Hubble constant shifts slightly when DESI BAO data are incorporated. The results are summarized in Fig. 5 and Tab. 1.
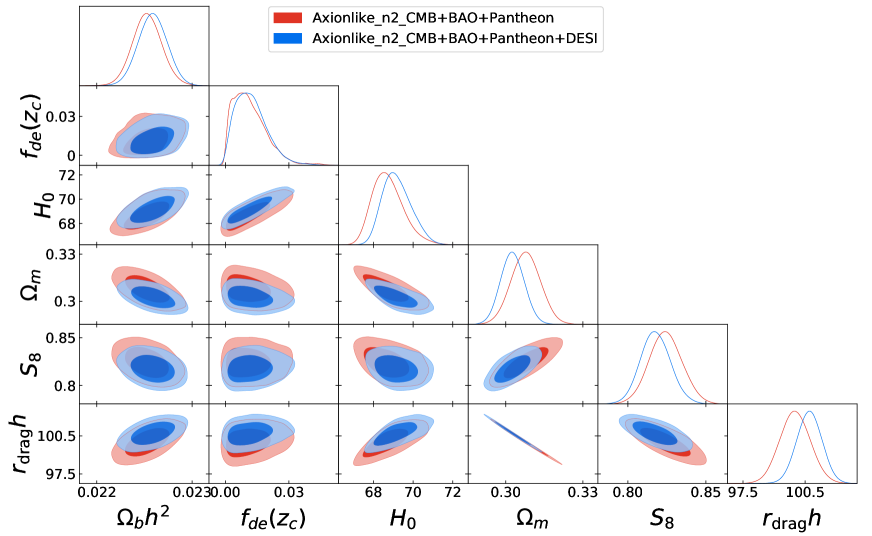
We present the results of axion-like early dark energy, which is given in Fig. 6 and Tab. 1. As in the varying model, we find a higher Hubble constant and a lower when DESI BAO data are included. This result is in agreement with the previous paper Qu et al. (2024), while authors of Ref. Qu et al. (2024) have considered the model and excluded other BAO data.
Finally, we calculate the Gaussian tension in Tab. 1 to make a fair comparison of the three models. The Gaussian tensions for , , and are respectively calculated as
| (5) |
for the Hubble tension with direct measurement Riess et al. (2022),
| (6) |
for the tension with DES Abbott et al. (2022).
From the viewpoint of the Hubble tension, as in Tab. 1, including DESI BAO data improves the tension in varying model and the EDE models because DESI BAO indicate slightly shorter . On the other hand, the tension increases for the varying model, because the center value does not change but the error is reduced by breaking the degeneracy. In the respect of the tension, including DESI BAO data improves the tension in all three models.
|
|
|
V Conclusions
In this paper, we examine the varying electron mass model and the axion-like early dark energy model, considering the recent DESI BAO measurements. In the analysis using a combination of CMB, conventional BAO and light curves (Pantheon), as in the previous studies, we find that the electron mass before the CMB era is in agreement with the current value in a confidence level. However, when the DESI BAO data is included, we find that the larger electron mass is preferred as,
| (7) | |||
| (8) |
Although the electron mass in the BAO era is assumed to be the same as today, the larger electron mass at CMB era leads to a higher Hubble constant and a product of a sound horizon and Hubble constant to fit the CMB power spectrum, bringing it closer to the DESI best-fit value. This is the reason why DESI BAO data prefers the larger electron mass in the CMB era. It is also known that both and increase when considering a closed universe, but we find that such the case is not preferred from DESI BAO measurements.
In the axion-like EDE () model, we also find that a larger amount of the EDE and a higher Hubble constant are preferred when the DESI BAO data is included.
Acknowledgements.
This work was supported by JSPS KAKENHI Grant Number 23K03402 (OS), and JST SPRING, Grant Number JPMJSP2119 (YT).References
- Aghanim et al. (2020a) N. Aghanim et al. (Planck), Astron. Astrophys. 641, A6 (2020a), [Erratum: Astron.Astrophys. 652, C4 (2021)], arXiv:1807.06209 [astro-ph.CO] .
- Schöneberg et al. (2022a) N. Schöneberg, L. Verde, H. Gil-Marín, and S. Brieden, JCAP 11, 039 (2022a), arXiv:2209.14330 [astro-ph.CO] .
- Dutcher et al. (2021) D. Dutcher et al. (SPT-3G), Phys. Rev. D 104, 022003 (2021), arXiv:2101.01684 [astro-ph.CO] .
- Aiola et al. (2020) S. Aiola et al. (ACT), JCAP 12, 047 (2020), arXiv:2007.07288 [astro-ph.CO] .
- Schöneberg et al. (2019) N. Schöneberg, J. Lesgourgues, and D. C. Hooper, JCAP 10, 029 (2019), arXiv:1907.11594 [astro-ph.CO] .
- Riess et al. (2022) A. G. Riess et al., Astrophys. J. Lett. 934, L7 (2022), arXiv:2112.04510 [astro-ph.CO] .
- Wong et al. (2020) K. C. Wong et al., Mon. Not. Roy. Astron. Soc. 498, 1420 (2020), arXiv:1907.04869 [astro-ph.CO] .
- Freedman et al. (2020) W. L. Freedman, B. F. Madore, T. Hoyt, I. S. Jang, R. Beaton, M. G. Lee, A. Monson, J. Neeley, and J. Rich, (2020), 10.3847/1538-4357/ab7339, arXiv:2002.01550 [astro-ph.GA] .
- Di Valentino et al. (2021) E. Di Valentino, O. Mena, S. Pan, L. Visinelli, W. Yang, A. Melchiorri, D. F. Mota, A. G. Riess, and J. Silk, Class. Quant. Grav. 38, 153001 (2021), arXiv:2103.01183 [astro-ph.CO] .
- Abdalla et al. (2022) E. Abdalla et al., JHEAp 34, 49 (2022), arXiv:2203.06142 [astro-ph.CO] .
- Perivolaropoulos and Skara (2022) L. Perivolaropoulos and F. Skara, New Astron. Rev. 95, 101659 (2022), arXiv:2105.05208 [astro-ph.CO] .
- Freedman (2021) W. L. Freedman, Astrophys. J. 919, 16 (2021), arXiv:2106.15656 [astro-ph.CO] .
- Schöneberg et al. (2022b) N. Schöneberg, G. Franco Abellán, A. Pérez Sánchez, S. J. Witte, V. Poulin, and J. Lesgourgues, Phys. Rept. 984, 1 (2022b), arXiv:2107.10291 [astro-ph.CO] .
- Vagnozzi (2023) S. Vagnozzi, Universe 9, 393 (2023), arXiv:2308.16628 [astro-ph.CO] .
- Ade et al. (2015) P. A. R. Ade et al. (Planck), Astron. Astrophys. 580, A22 (2015), arXiv:1406.7482 [astro-ph.CO] .
- Sekiguchi and Takahashi (2021) T. Sekiguchi and T. Takahashi, Phys. Rev. D 103, 083507 (2021), arXiv:2007.03381 [astro-ph.CO] .
- Seto and Toda (2023) O. Seto and Y. Toda, Phys. Rev. D 107, 083512 (2023), arXiv:2206.13209 [astro-ph.CO] .
- Hoshiya and Toda (2023) K. Hoshiya and Y. Toda, Phys. Rev. D 107, 043505 (2023), arXiv:2202.07714 [astro-ph.CO] .
- Solomon et al. (2022) R. Solomon, G. Agarwal, and D. Stojkovic, Phys. Rev. D 105, 103536 (2022), arXiv:2201.03127 [hep-ph] .
- Poulin et al. (2018) V. Poulin, T. L. Smith, D. Grin, T. Karwal, and M. Kamionkowski, Phys. Rev. D 98, 083525 (2018), arXiv:1806.10608 [astro-ph.CO] .
- Poulin et al. (2019) V. Poulin, T. L. Smith, T. Karwal, and M. Kamionkowski, Phys. Rev. Lett. 122, 221301 (2019), arXiv:1811.04083 [astro-ph.CO] .
- Braglia et al. (2020) M. Braglia, W. T. Emond, F. Finelli, A. E. Gumrukcuoglu, and K. Koyama, Phys. Rev. D 102, 083513 (2020), arXiv:2005.14053 [astro-ph.CO] .
- Agrawal et al. (2023) P. Agrawal, F.-Y. Cyr-Racine, D. Pinner, and L. Randall, Phys. Dark Univ. 42, 101347 (2023), arXiv:1904.01016 [astro-ph.CO] .
- Ye and Piao (2020) G. Ye and Y.-S. Piao, Phys. Rev. D 101, 083507 (2020), arXiv:2001.02451 [astro-ph.CO] .
- Smith et al. (2020) T. L. Smith, V. Poulin, and M. A. Amin, Phys. Rev. D 101, 063523 (2020), arXiv:1908.06995 [astro-ph.CO] .
- Lin et al. (2019) M.-X. Lin, G. Benevento, W. Hu, and M. Raveri, Phys. Rev. D 100, 063542 (2019), arXiv:1905.12618 [astro-ph.CO] .
- Niedermann and Sloth (2021) F. Niedermann and M. S. Sloth, Phys. Rev. D 103, L041303 (2021), arXiv:1910.10739 [astro-ph.CO] .
- Niedermann and Sloth (2020) F. Niedermann and M. S. Sloth, Phys. Rev. D 102, 063527 (2020), arXiv:2006.06686 [astro-ph.CO] .
- Seto and Toda (2021) O. Seto and Y. Toda, Phys. Rev. D 103, 123501 (2021), arXiv:2101.03740 [astro-ph.CO] .
- Takahashi and Toda (2023) T. Takahashi and Y. Toda, JCAP 11, 101 (2023), arXiv:2306.00454 [astro-ph.CO] .
- Capparelli et al. (2020) L. M. Capparelli, R. R. Caldwell, and A. Melchiorri, Phys. Rev. D 101, 123529 (2020), arXiv:1909.04621 [astro-ph.CO] .
- Murai et al. (2023) K. Murai, F. Naokawa, T. Namikawa, and E. Komatsu, Phys. Rev. D 107, L041302 (2023), arXiv:2209.07804 [astro-ph.CO] .
- Minami and Komatsu (2020) Y. Minami and E. Komatsu, Phys. Rev. Lett. 125, 221301 (2020), arXiv:2011.11254 [astro-ph.CO] .
- Diego-Palazuelos et al. (2022) P. Diego-Palazuelos et al., Phys. Rev. Lett. 128, 091302 (2022), arXiv:2201.07682 [astro-ph.CO] .
- Adame et al. (2024a) A. G. Adame et al. (DESI), (2024a), arXiv:2404.03000 [astro-ph.CO] .
- Adame et al. (2024b) A. G. Adame et al. (DESI), (2024b), arXiv:2404.03001 [astro-ph.CO] .
- Adame et al. (2024c) A. G. Adame et al. (DESI), (2024c), arXiv:2404.03002 [astro-ph.CO] .
- Tada and Terada (2024) Y. Tada and T. Terada, (2024), arXiv:2404.05722 [astro-ph.CO] .
- Cortês and Liddle (2024) M. Cortês and A. R. Liddle, (2024), arXiv:2404.08056 [astro-ph.CO] .
- Carloni et al. (2024) Y. Carloni, O. Luongo, and M. Muccino, (2024), arXiv:2404.12068 [astro-ph.CO] .
- Giarè et al. (2024) W. Giarè, M. A. Sabogal, R. C. Nunes, and E. Di Valentino, (2024), arXiv:2404.15232 [astro-ph.CO] .
- Christiansen et al. (2024) O. Christiansen, F. Hassani, and D. F. Mota, (2024), arXiv:2405.00668 [astro-ph.CO] .
- Wang and Piao (2024) H. Wang and Y.-S. Piao, (2024), arXiv:2404.18579 [astro-ph.CO] .
- Qu et al. (2024) F. J. Qu, K. M. Surrao, B. Bolliet, J. C. Hill, B. D. Sherwin, and H. T. Jense, (2024), arXiv:2404.16805 [astro-ph.CO] .
- Poulot et al. (2024) G. Poulot, E. M. Teixeira, C. van de Bruck, and N. J. Nunes, (2024), arXiv:2404.10524 [astro-ph.CO] .
- Andriot et al. (2024) D. Andriot, S. Parameswaran, D. Tsimpis, T. Wrase, and I. Zavala, (2024), arXiv:2405.09323 [hep-th] .
- Pookkillath and Koyama (2024) M. C. Pookkillath and K. Koyama, (2024), arXiv:2405.06565 [gr-qc] .
- Scott and Moss (2009) D. Scott and A. Moss, Mon. Not. Roy. Astron. Soc. 397, 445 (2009), arXiv:0902.3438 [astro-ph.CO] .
- Howlett et al. (2012) C. Howlett, A. Lewis, A. Hall, and A. Challinor, JCAP 04, 027 (2012), arXiv:1201.3654 [astro-ph.CO] .
- Lewis and Bridle (2002) A. Lewis and S. Bridle, Phys. Rev. D 66, 103511 (2002), arXiv:astro-ph/0205436 .
- Aghanim et al. (2020b) N. Aghanim et al. (Planck), Astron. Astrophys. 641, A8 (2020b), arXiv:1807.06210 [astro-ph.CO] .
- Beutler et al. (2011) F. Beutler, C. Blake, M. Colless, D. Jones, L. Staveley-Smith, L. Campbell, Q. Parker, W. Saunders, and F. Watson, Mon. Not. Roy. Astron. Soc. 416, 3017 (2011), arXiv:1106.3366 [astro-ph.CO] .
- Ross et al. (2015) A. J. Ross, L. Samushia, C. Howlett, W. J. Percival, A. Burden, and M. Manera, Mon. Not. Roy. Astron. Soc. 449, 835 (2015), arXiv:1409.3242 [astro-ph.CO] .
- Alam et al. (2017) S. Alam et al. (BOSS), Mon. Not. Roy. Astron. Soc. 470, 2617 (2017), arXiv:1607.03155 [astro-ph.CO] .
- Scolnic et al. (2018) D. M. Scolnic et al. (Pan-STARRS1), Astrophys. J. 859, 101 (2018), arXiv:1710.00845 [astro-ph.CO] .
- Abbott et al. (2022) T. M. C. Abbott et al. (DES), Phys. Rev. D 105, 023520 (2022), arXiv:2105.13549 [astro-ph.CO] .