Zamanov, Stoyanov, Marchev et al
*R. Zamanov
Size of the accretion disc in the recurrent nova T CrB
Abstract
We present high resolution (0.06 Å px-1) spectroscopic observations of the recurrent nova T Coronae Borealis obtained during the last 1.5 years (September 2022 – January 2024), with the 2.0m RCC telecope of the Rozhen National Astronomical Observatory, Bulgaria. Double-peaked emission is visible in the line after the end of the superactive state. We subtract the red giant contribution and measure the distance between the peaks () of the line. For the period July 2023 – January 2024, we find that is in range km s-1. Assuming that the emission is from the accretion disc around the white dwarf, we find average radius of the accretion disc R⊙, which is approximately equal to the Roche lobe size of the white dwarf. Our results indicate that tidal torque plays an important role but that the disc can extend up to the Roche lobe of the accreting star.
keywords:
Stars: binaries: symbiotic – accretion, accretion discs – novae, cataclysmic variables – stars: individual: T CrB1 Introduction
T CrB (HD 143454, NOVA CrB 1946, NOVA CrB 1866) is a famous recurrent nova having recorded eruptions in 1866, in 1946 and possibly in 1217 and 1787 (Schaefer 2023a). A new outburst can be expected in the near future (Luna et el. 2020; Maslennikova et al. 2024; Schaefer 2023b), which will make T CrB the brightest nova outburst since Nova 1500 Cyg in 1975.
The nature of the binary system T CrB was revealed when (i) Sanford (1949) discovered that the radial velocity of the M giant varies with a period of 230.5 days; (ii) Peel (1985) and Lines et al. (1988) found that the red giant is ellipsoidally shaped; and (iii) Selvelli et al. (1992) using spectra identified that the hot component of the system is an accreting white dwarf. T CrB is a member of a small group of symbiotic recurrent novae with only six confirmed members – RS Oph, T CrB, V3890 Sgr, V745 Sco, LMC S154 and V618 Sgr (Ilkiewicz et al. 2019; Merc et al. 2023).
In our previous paper (Zamanov et al. 2023a) we analysed UBV photometry to investigate the evolution of the hot component of T CrB through the superactive state and linked this to the proposed upcoming recurrent nova outburst. Here we analyse optical spectroscopic observations and estimate the accretion disc radius.

2 Observations
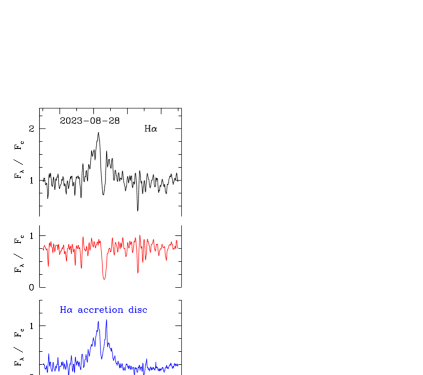
73 optical spectra of T CrB on 21 nights were secured with the ESpeRo Echelle spectrograph (Bonev et al. 2017) on the 2.0 m RCC telescope in the Rozhen National Astronomical Observatory, Bulgaria. On each spectrum we measure the equivalent width of the H line. The typical error is %. We then subtract the spectrum of HD134807, which is the red giant used in Stanishev et al. (2004). An example of the subtraction of the red giant is shown in Fig. 1 The double-peaked nature of the line is visible before the subtraction on most of the spectra, however the subtraction reveals this more clearly and gives us the possibility to measure accurately the separation of the peaks.
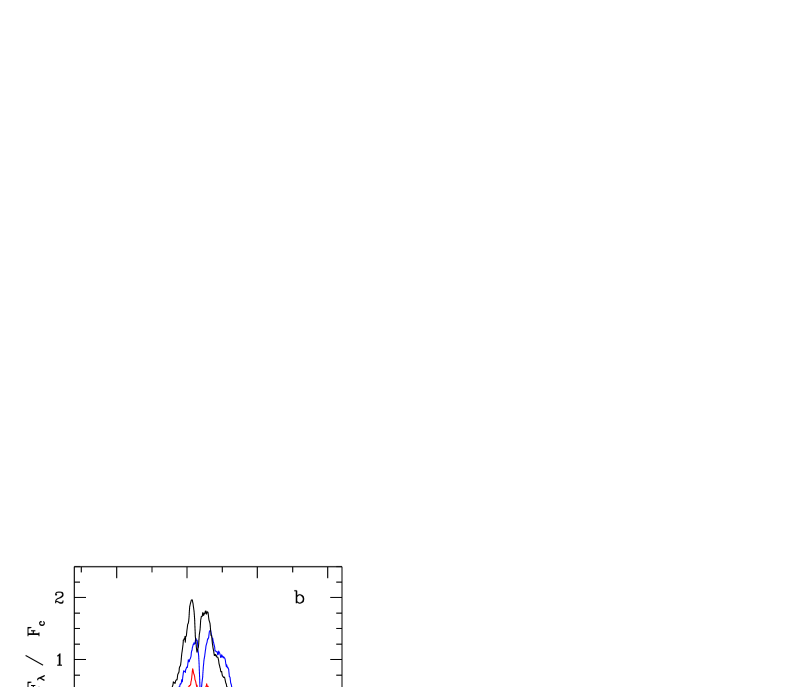
The variability of the H emission line of T CrB is presented in Fig. 2 The spectra are normalized to the local continuum and a constant is added to each spectrum. In Fig. 2 are plotted three spectra after the subtraction of the red giant contribution. Double-peaked emission coming from the hot component is clearly visible.
The spectroscopic observations of T CrB are summarized in Table 1 In the table are given the start of the observation (in the format YYYY-MM-DD HH:MM), number of exposures and exposure time in minutes, the equivalent width of H line, , the distance between the peaks of H, , and the calculated disc size (see also Sect.3.1). In Table 1 are given the average values for each night. In Table 2 are given the measurements of for each spectrum. The distance between the peaks is measured in a way identical to that in Zamanov et al. (2023b).
| date-obs | phase | exp.time | EW(H) | |||
| [min] | [Å] | [km s-1] | [] | |||
| 2022-09-14 17:41 | 0.365 | 60 | 28.2 | |||
| 2023-01-04 02:57 | 0.855 | 60 | 28.4 | |||
| 2023-01-07 03:00 | 0.868 | 60 | 30.4 | |||
| 2023-02-10 00:58 | 0.017 | 60 | 24.9 | |||
| 2023-03-14 22:53 | 0.162 | 3x15 | 24.8 | |||
| 2023-03-29 21:58 | 0.228 | 60 | 28.8 | |||
| 2023-04-12 21:02 | 0.289 | 60 | 20.9 | |||
| 2023-06-07 20:23 | 0.535 | 60 | 10.9 | |||
| 2023-07-29 19:35 | 0.763 | 9x15 | 6.8 | |||
| 2023-07-30 18:48 | 0.767 | 6x15 | 7.2 | |||
| 2023-08-28 19:11 | 0.895 | 7x15 | 3.0 | |||
| 2023-08-29 18:37 | 0.899 | 10x15 | 3.2 | |||
| 2023-08-30 17:51 | 0.904 | 13x15 | 2.1 | |||
| 2023-08-31 19:31 | 0.908 | 3x15 | 2.4 | |||
| 2023-10-23 16:37 | 0.140 | 2x30 | 1.5 | |||
| 2023-12-25 02:51 | 0.415 | 2x45 | 3.5 | |||
| 2023-12-26 02:44 | 0.419 | 4x25 | 6.4 | |||
| 2023-12-27 02:45 | 0.424 | 1x50 | 4.1 | |||
| 2023-12-28 02:44 | 0.428 | 1x60 | 4.2 | |||
| 2024-01-22 03:00 | 0.542 | 1x30 | 7.3 | |||
| 2024-01-23 01:52 | 0.542 | 6x20 | 8.9 |
3 Results
From 2016 until March 2023, T CrB was in a superactive state (Munari et al. 2016; Munari 2023) characterised by an increase in the mean brightness and the appearance of high-ionization emission lines (HeII4686, [OIII]4959, 5007, [NeIII]3869, etc.) as well as a prominent soft X-ray component (Zhekov & Tomov 2019). Our spectroscopic observations are obtained during the last year of the superactive state and after it.
During the period September 2022 – April 2023, the H emission is strong with in the range from Å to Å. This is due to the brighter hot component, an increased ionization in the companion wind, and most of the H emission coming not from the accretion disc, but from the ionized wind of the red giant (Munari 2023). This also is visible in the radio observations, which indicate that during the superactive state T CrB displays higher emission in the radio, consistent with optically thick thermal bremsstrahlung emission from a photoionized source, and an increased ionization in the companion wind, driven by high accretion rate (Linford et al. 2019; Zamanov et al. 2023a). After the end of the superactive state the equivalent width of decreased to Å in June 2023, Å in July 2023, and Å in August-October 2023. A double-peaked emission profile is visible in our observations obtained during the period July 2023 – January 2024. The minimum of the H emission is in August-October 2023, when Å.
Hereafter we adopt for T CrB an orbital period 227.5687 d, (Fekel et al. 2000), mass of the white dwarf , mass of the red giant , inclination (Stanishev et al. 2004) and zero eccentricity (Kenyon & Garcia 1986).
3.1 Disc size
The subtraction of the red giant contribution reveals that on all the spectra in the period July 2023 – January 2024, the H emission line of the hot component displays a double-peaked profile (see Fig. 1 The two peaks have almost equal intensity. This is an indication that H is formed in a disc (e.g. Horne & Marsh 1986). We assume that this is a Keplerian accretion disc which surrounds the white dwarf.
For emission lines coming from a Keplerian disc, the peak separation () can be regarded as a measure of the outer radius () of the emitting disc (Huang 1972):
| (1) |
where is the gravitational constant, is the mass of the white dwarf and is the inclination angle of the disc axis to the line of sight.
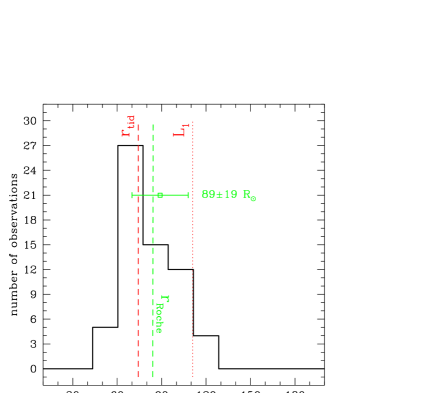
For our July 2023 – January 2024 observations (see Table 1, we measure km s-1, with average value km s-1. From Eq.1 we estimate the size of the H emitting disc as , with average value . The average values are calculated using the values given in Table 1 A histogram of the distribution (based on the data in Table 2 is presented in Fig. 3 The minimum of disc size is in August 2023, when we estimate R⊙ (see Table 1
3.2 Roche lobe size
With the binary parameters and the Kepler’s third law we calculate the distance between the components of T CrB . We estimate, that the inner Lagrangian point, , is located at a distance 111 R⊙ from the white dwarf. The Roche lobe radius of the accreting star is given by the formula (Eggleton 1983):
| (2) |
where is the mass ratio. Using this formula and mass ratio , we estimate and Roche lobe radius of the white dwarf 84.3 , which means that the average size of the accretion disc in July 2023 – January 2024 is approximately equal to the size of the Roche lobe of the white dwarf.
Another important important parameter is the tidal radius, which depends on the mass ratio and is described with a polynomial fit (Smak 2020):
| (3) |
where . According to this formula for T CrB we estimate and R⊙.
In Fig. 3, as well as the histogram of the calculated values of are plotted three vertical lines: the Roche lobe radius (, blue dashed line), the distance of from the white dwarf (red dotted line) and (red dashed line). The average disc size is marked in green and coincides with the radius of the Roche lobe around the white dwarf.
4 Discussion
The mass donor in T CrB is a red giant and the system is classified as a symbiotic star. The symbiotic stars are long-period interacting binary systems composed of a hot component, a cool giant and a nebula formed from material lost by the donor star and ionized by the radiation of the hot component (Mikolajewska 2012). Their orbital periods vary from a few hundred days up to 100 years. Depending on the orbital period and the distance between the components, the accretion onto the white dwarf can occur through gravitational capture of the slow stellar wind from the giant component, Bondi-Hoyle-Littleton accretion (Bondi & Hoyle 1944), wind Roche-lobe overflow, WRLOF (Mohamed & Podsiadlowski 2012), or a Roche lobe overflow when the system is semidetached.
In many S-type symbiotic stars (e.g. RW Hya, SY Mus, AR Pav, YY Her, CI Cyg, BF Cyg) with P d, modulations are detected in the light curves with half-orbital period. Such modulations are visible in the optical/near-IR bands and are due to ellipsoidal variations of the mass donor (Mikolajewska 2003; Yudin et al. 2005; Rutkowski et al. 2007). This is also the case in T CrB, where the ellipsoidal variations of the red giant are clearly visible in B, V, R, I bands when the hot component is in a low state (Munari et al. 2016). The mass transfer from a tidally distorted red giant filling the Roche Lobe is expected to form an accretion disc similar to that of the cataclysmic variables. Indeed, the behaviour of T CrB suggests that it is effectively a dwarf nova with an extremely long orbital period, closely related to SU UMa dwarf novae (Ilkiewicz et al. 2023).
Duschl (1986) estimated that the outer radius of the accretion disc in symbiotic systems is in the range 15 – 55 . Leedjarv et al. (1994) calculated the outer radius of the accretion disc of the symbiotic star CH Cyg 66 R⊙. Robinson et al. (1994) found acceptable fits to high resolution spectra for 3 symbiotic stars on the assumption that the double-peaked line profiles arose from accretion discs, where for T CrB the outer disc radius was estimated as R⊙; for CH Cyg R⊙; and for AG Dra R⊙. However, these authors note that it was highly unlikely that the lines in each case were emitted solely from a disc, and they did not for example subtract any contribution from the red giant in each system. Our estimates for lie within the general range of the estimates above.
Smak (2020) suggests that the outer radius of the disc in the case of Roche lobe overflow is controlled by tidal torques, which prevent the disc from expanding beyond the tidal radius. In Fig. 3 there is a well defined peak in the distribution of . The tendency for the disc size to cluster at a specific level is related to the truncation of the disc at specific disc radii (e.g. Coe et al. 2006). Not surprisingly the peak of the histogram corresponds to (Fig. 3 in agreement with the suggestions of Smak (2020), that tidal torque is an important factor in binaries with Roche lobe overflow. However our results also indicate that it does not prevent the disc extending to the Roche lobe and even in some cases to the inner Lagrangian point . The fact that we measure an average value indicates that the limiting factor for the disc size in T CrB is the Roche lobe. This suggests that in such cases there is probably no accretion stream from and the matter flow through enters almost immediately into the outer parts of the accretion disc.
5 Conclusions
From September 2022 to January 2024, we observed spectroscopically the recurrent nova T CrB. During the latter months (July 2023 – January 2024), double-peaked emission is visible. We performed 73 measurements of the distance between the peaks of H and estimate at each point the radius of the accretion disc thought to give rise to the line emission. We find that it is in the range R⊙, with average R⊙, which is . Our results indicate the tidal torque plays a role, however the key limiting factor for the disc size is the Roche lobe.
Acknowledgments
We acknowledge the anonymous referee for the useful comments. The research infrastructure is supported by the \fundingAgencyMinistry of Education and Science of Bulgaria (\fundingNumberBulgarian National Roadmap for Research Infrastructure). This work is partly supported by the \fundingAgencySpanish Ministerio de Ciencia e Innovacion, Agencia Estatal de Investigacion (Ref. \fundingNumberPID2022-136828NB-C42). D.M. acknowledges support by project RD-08-137/2024 from Shumen University Science Fund.
Conflict of interest
The authors declare no potential conflict of interests.
References
- [Bondi+..(1944)] Bondi, H., & Hoyle, F. 1944, MNRAS, 104, 273.
- [Bonev+..(2017)] Bonev, T., Markov, H., Tomov, T. et al. 2017, Bulgarian Astronomical Journal, 26, 67.
- [Coe+….(2006)] Coe, M. J., Reig, P., McBride, V. A., Galache, J. L., & Fabregat, J. 2006, MNRAS, 368, 447.
- [Duschl..(1986)] Duschl, W. J. 1986, A&A, 163, 61.
- [Eggleton(1983)] Eggleton, P. P. 1983, ApJ, 268, 368.
- [Fekel+..(2000)] Fekel, F. C., Joyce, R. R., Hinkle, K. H., & Skrutskie, M. F. 2000, AJ, 119, 1375.
- [Horne+..(1986)] Horne, K., & Marsh, T. R. 1986, MNRAS, 218, 761.
- [Huang…(1972)] Huang, S.-S. 1972, ApJ, 171, 549.
- [Ilkiewicz(2019)] Ilkiewicz, K., Mikolajewska, J., Miszalski, B., Gromadzki, M., Monard, B., & Amigo, P. 2019, A&A, 624, A133.
- [Ilkiewicz(2023)] Ilkiewicz, K., Mikolajewska, J., & Stoyanov, K. A. 2023, ApJ, 953, L7.
- [Kenyon+.(1986)] Kenyon, S. J., & Garcia, M. R. 1986, AJ, 91, 125.
- [Leedjarv+(1994)] Leedjarv, L., Mikolajewski, M., & Tomov, T. 1994, A&A, 287, 543.
- [Lines…(1988)] Lines, H. C., Lines, R. D., & McFaul, T. G. 1988, AJ, 95, 1505.
- [Linford.(2019)] Linford, J. D., Chomiuk, L., Sokoloski, J. L. et al. 2019, ApJ, 884, 8.
- [Luna….(2020)] Luna, G. J. M., Sokoloski, J. L., Mukai, K., & M. Kuin, N. P. 2020, ApJ, 902, L14.
- [Maslenni(2024)] Maslennikova, N. A., Tatarnikov, A. M., Tatarnikova, A. A. et al. 2024, Astronomy Letters, 49, 501.
- [Merc+…(2023)] Merc, J., Galis, R., Velez, P. et al. 2023, MNRAS, 523, 163
- [Mikolajw(2003)] Mikolajewska, J., Kolotilov, E. A., Shugarov, S. Y., Tatarnikova, A. A., & Yudin, B. F. 2003, R. L. M. Corradi, J. Mikolajewska, & T. J. Mahoney (Eds.), Symbiotic Stars Probing Stellar Evolution, ASP Conf. Vol. 303, p. 151.
- [Mikolaje(2012)] Mikolajewska, J. 2012, Baltic Astronomy, 21, 5.
- [Mohamed.(2012)] Mohamed, S., & Podsiadlowski, P. 2012, Baltic Astronomy, 21, 88.
- [Munari..(2016)] Munari, U., Dallaporta, S., & Cherini, G. 2016, New A, 47, 7.
- [Munari..(2023)] Munari, U. 2023, Research Notes of the American Astronomical Society, 7, 145.
- [Peel….(1985)] Peel, M. 1985, JAAVSO, 14, 8.
- [Robinson(1994)] Robinson, K., Bode, M. F., Skopal, A., Ivison, R. J., & Meaburn, J. 1994, MNRAS, 269, 1.
- [Rutkowski(2007)] Rutkowski, A., Mikolajewska, J., & Whitelock, P. A. 2007, Baltic Astronomy, 16, 49.
- [Sanford.(1949)] Sanford, R. F. 1949, ApJ, 109, 81.
- [Schaefe(2023a)] Schaefer, B. E. 2023a, Journal for the History of Astronomy, 54, 436.
- [Schaefe(2023b)] Schaefer, B. E. 2023b, MNRAS, 524, 3146.
- [Selvelli(1992)] Selvelli, P. L., Cassatella, A., & Gilmozzi, R. 1992, ApJ, 393, 289.
- [Smak….(2020)] Smak, J. 2020, Acta Astron., 70, 313.
- [Stanishe(2004)] Stanishev, V., Zamanov, R., Tomov, N., & Marziani, P. 2004, A&A, 415, 609.
- [Yudin+..(2005)] Yudin, B. F., Shenavrin, V. I., Kolotilov, E. A., Tatarnikova, A. A., & Tatarnikov, A. M. 2005, Astronomy Reports, 49, 232.
- [Zamanov(2023a)] Zamanov, R., Boeva, S., Latev, G. Y. et al. 2023a, A&A, 680, L18.
- [Zamanov(2023b)] Zamanov, R. K., Stoyanov, K. A., Stefanov, S. Y., Bode, M. F., & Minev, M. S. 2023b, Astronomische Nachrichten, 344, e20230022.
- [Zhekov+.(2019)] Zhekov, S. A., & Tomov, T. V. 2019, MNRAS, 489, 2930.
Appendix
Here is given Table 2 containing the measurements of the distance between the peaks of the H line and the calculated disc radius.
YYYY-MM-DD HH:SS), exposure time in minutes, the measured distance between the peaks of the H line, and the calculated radius of the H emitting disc.
| date-obs | exp-time | date-obs | expos. | |||||
|---|---|---|---|---|---|---|---|---|
| [min] | [km s-1] | [] | [min] | [km s-1] | [] | |||
| 2023-07-29 19:35 | 15 | 95.5 | 97.7 | 2023-08-31 19:31 | 15 | 123.1 | 58.8 | |
| 2023-07-29 19:50 | 15 | 103.7 | 82.9 | 2023-08-31 19:47 | 15 | 119.2 | 62.8 | |
| 2023-07-29 20:06 | 15 | 103.8 | 82.8 | 2023-08-31 20:03 | 15 | 118.1 | 64.0 | |
| 2023-07-29 20:22 | 15 | 103.7 | 83.0 | 2023-10-23 16:37 | 30 | 90.6 | 108.8 | |
| 2023-07-29 20:38 | 15 | 104.8 | 81.3 | 2023-10-23 17:08 | 30 | 88.9 | 112.8 | |
| 2023-07-29 20:53 | 15 | 102.9 | 84.3 | 2023-12-25 02:51 | 45 | 95.7 | 97.5 | |
| 2023-07-29 21:09 | 15 | 105.3 | 80.5 | 2023-12-25 03:37 | 45 | 97.6 | 93.7 | |
| 2023-07-29 21:24 | 15 | 108.1 | 76.3 | 2023-12-26 02:44 | 25 | 96.8 | 95.3 | |
| 2023-07-29 21:40 | 15 | 105.4 | 80.4 | 2023-12-26 03:09 | 25 | 90.9 | 107.9 | |
| 2023-07-30 18:48 | 15 | 104.4 | 81.9 | 2023-12-26 03:36 | 25 | 86.4 | 119.4 | |
| 2023-07-30 19:04 | 15 | 101.4 | 86.7 | 2023-12-26 04:02 | 25 | 85.6 | 121.8 | |
| 2023-07-30 19:20 | 15 | 102.3 | 85.2 | 2023-12-27 02:45 | 50 | 90.2 | 109.7 | |
| 2023-07-30 19:38 | 15 | 103.6 | 83.1 | 2023-12-28 02:44 | 60 | 98.9 | 91.2 | |
| 2023-07-30 19:54 | 15 | 99.2 | 90.7 | 2024-01-22 03:00 | 30 | 94.8 | 99.2 | |
| 2023-07-30 20:18 | 15 | 101.9 | 85.9 | 2024-01-23 01:52 | 20 | 89.7 | 110.9 | |
| 2023-08-28 19:11 | 15 | 115.1 | 67.3 | 2024-01-23 02:13 | 20 | 89.3 | 111.8 | |
| 2023-08-28 19:27 | 15 | 116.3 | 65.9 | 2024-01-23 02:34 | 20 | 91.7 | 106.2 | |
| 2023-08-28 19:44 | 15 | 122.3 | 59.7 | 2024-01-23 02:54 | 20 | 92.1 | 105.2 | |
| 2023-08-28 19:59 | 15 | 118.0 | 64.1 | 2024-01-23 03:15 | 20 | 90.6 | 108.8 | |
| 2023-08-28 20:15 | 15 | 114.3 | 68.3 | 2024-01-23 03:36 | 20 | 92.0 | 105.4 | |
| 2023-08-28 20:31 | 15 | 121.5 | 60.5 | |||||
| 2023-08-28 20:48 | 15 | 116.8 | 65.3 | |||||
| 2023-08-29 18:37 | 15 | 117.9 | 64.1 | |||||
| 2023-08-29 18:53 | 15 | 117.8 | 64.3 | |||||
| 2023-08-29 19:09 | 15 | 119.1 | 62.9 | |||||
| 2023-08-29 19:24 | 15 | 122.0 | 59.9 | |||||
| 2023-08-29 19:40 | 15 | 114.8 | 67.7 | |||||
| 2023-08-29 19:58 | 15 | 119.8 | 62.2 | |||||
| 2023-08-29 20:13 | 15 | 118.3 | 63.7 | |||||
| 2023-08-29 20:29 | 15 | 118.8 | 63.2 | |||||
| 2023-08-29 20:46 | 15 | 118.3 | 63.8 | |||||
| 2023-08-29 21:02 | 15 | 116.9 | 65.2 | |||||
| 2023-08-30 17:51 | 15 | 119.7 | 62.3 | |||||
| 2023-08-30 18:07 | 15 | 121.3 | 60.7 | |||||
| 2023-08-30 18:22 | 15 | 120.9 | 61.0 | |||||
| 2023-08-30 18:38 | 15 | 115.2 | 67.2 | |||||
| 2023-08-30 18:53 | 15 | 115.1 | 67.4 | |||||
| 2023-08-30 19:09 | 15 | 120.5 | 61.4 | |||||
| 2023-08-30 19:24 | 15 | 115.5 | 66.9 | |||||
| 2023-08-30 19:40 | 15 | 117.4 | 64.7 | |||||
| 2023-08-30 19:55 | 15 | 119.7 | 62.3 | |||||
| 2023-08-30 20:11 | 15 | 124.3 | 57.7 | |||||
| 2023-08-30 20:27 | 15 | 118.3 | 63.7 |