Solar Models and Astrophysical -factors Constrained by Helioseismic Results and Updated Neutrino Fluxes
Abstract
The ratio of metal abundance to hydrogen abundance of the solar photosphere, , has been revised several times. Standard solar models, based on these revised solar abundances, are in disagreement with seismically inferred results. Recently, Magg et al. introduced a new value for , which is still in debate in the community. The solar abundance problem or solar modeling problem remains a topic of ongoing debate. We constructed rotating solar models in accordance with various abundance scales where the effects of convection overshoot and enhanced diffusion were included. Among these models, those utilizing Magg’s abundance scale exhibit superior sound-speed and density profiles compared to models using other abundance scales. Additionally, they reproduce the observed frequency separation ratios and . These models also match the seismically inferred surface helium abundance and convection zone depth within level. Furthermore, the calculated neutrino fluxes from these models agree with detected ones at the level of . We found that neutrino fluxes and density profile are influenced by nuclear reactions, allowing us to use the combination of detected neutrino fluxes and seismically inferred density for diagnosing astrophysical -factors. This diagnostic approach shows that may be underestimated by , while may be overestimated by about in previous determinations. The -factors favored by updated neutrino fluxes and helioseismic results can lead to significant improvements in solar models.
1 INTRODUCTION
The metal abundance, the mass fraction of all elements heavier than helium, of a star is a key parameter that determines the evolution and structure of the star. The estimations of the metal abundance are related to the chemical element abundances of the Sun that are still in hot debate since Lodders (2003) and Asplund et al. (2005) revised the ratio of metal abundance to hydrogen abundance of the solar photosphere, , from the old 0.023 (Grevesse & Sauval, 1998, hereafter GS98) to 0.0177 or 0.0165. So far, the value of the ratio has been revised several times (Lodders et al., 2009; Asplund et al., 2009, 2021; Caffau et al., 2010, 2011; Lodders, 2020; Amarsi et al., 2021; Magg et al., 2022; Deshmukh et al., 2022). The helium abundance, , in the solar convection zone (CZ) and thus photosphere and the radius of the base of the CZ (BCZ), , are determined by helioseismology. The surface helium abundance and metallicity inferred by Vorontsov et al. (2014) are in the range of and , respectively. The widely accepted values of and are (Basu & Antia, 2004) and (Christensen-Dalsgaard et al., 1991) or (Basu & Antia, 1997), respectively.
Standard solar models (SSMs) constructed in accordance with these revised solar abundances (low metal abundances) disagree with the seismically inferred surface helium abundance, radius of the BCZ, sound speed profile, and density profile (Bahcall et al., 2004; Basu & Antia, 2004; Yang & Bi, 2007; Basu et al., 2009; Zhang & Li, 2012; Basu et al., 2015; Christensen-Dalsgaard, 2021), and the detected neutrino fluxes (Bahcall & Pinsonneault, 2004; Turck-Chièze et al., 2011; Serenelli et al., 2011; Yang, 2016, 2019, 2022; Zhang et al., 2019). In order to reconcile the low-Z models with helioseismology, an enhanced diffusion (Basu & Antia, 2004; Montalbán et al., 2004; Guzik et al., 2005) and the effects of rotation (Yang & Bi, 2007; Turck-Chièze et al., 2010; Yang, 2019, 2022), or other effects, such as increased opacity (Serenelli et al., 2009; Ayukov & Baturin, 2017; Buldgen et al., 2019; Kunitomo & Guillot, 2021) and mass accretion of helium-poor (Zhang et al., 2019) or metal-poor material (Kunitomo et al., 2022), are required.
Recently, Magg et al. (2022) analyzed the solar photospheric abundances and obtained . This ratio is almost higher than the estimate by Caffau et al. (2011), , mainly due to the higher carbon, nitrogen, and neon abundances. They claimed that the puzzling mismatch between the helioseismic constraints on the solar interior structure and the model can be resolved thanks to this new chemical composition. Moreover, Deshmukh et al. (2022) derived a photospheric solar silicon abundance of . Combining this with meteoritic abundances and photospheric abundances from Caffau et al. (2011), they obtained , which is in agreement with the result of Magg et al. (2022). However, if the photospheric abundances of Asplund et al. (2021) are used, they would obtain a smaller . Furthermore, Borexino Collaboration (2022) first estimated the abundance of C N in the Sun by using updated neutrinos. Their result is also in agreement with those of Magg et al. (2022) and GS98. However, the analyses of Li et al. (2021, 2023a, 2023b) found that the abundances of carbon, nitrogen, and oxygen are only marginally higher than those given by Amarsi et al. (2021). Pietrow et al. (2023) also obtained an oxygen abundance that is between the one of Amarsi et al. (2021) and that of Magg et al. (2022). Buldgen et al. (2023) argued that “higher metal abundances do not solve the solar problem”. Additionally, Buldgen et al. (2024) inferred that the value of lies in the range . In fact, the surface helium abundance of 0.2439 of the Magg et al. (2022) model constructed in accordance with their mixtures is lower than the inferred value of (Basu & Antia, 2004) and that inferred by Vorontsov et al. (2014). The solar abundance problem or solar modeling problem is still in debate.
Moreover, Mussack & Däppen (2011) studied dynamic screening in solar proton–proton reactions and found that the dynamic screening does not significantly change the reaction rate from that of the bare Coulomb potential. However, nuclear reaction rates are a fundamental yet uncertain ingredient in constructing stellar models (Bellinger & Christensen-Dalsgaard, 2022). There are usually several estimated values for a nuclear cross-section factor (astrophysical -factor) in literatures. For example, there exist 0.0243 (Bahcall & Ulrich, 1988), 0.0224 (Bahcall & Pinsonneault, 1992), 0.0202 (Schramm & Shi, 1994), 0.0274 (Liu et al., 1996), or 0.0208 (Adelberger et al., 2011, hereafter A11) keV Barns for of 7Be(, )8B reaction, and (Park et al., 2003), (Adelberger et al., 2011), (Chen et al., 2013), (Acharya et al., 2016), (Park & Rolfs, 1991; Acharya et al., 2023), or (De-Leon & Gazit, 2023) keV Barns for of reaction. The new theoretical predictions of (Acharya et al., 2016, 2023; De-Leon & Gazit, 2023) are higher than the previously accepted value of Adelberger et al. (2011) and differ in their uncertainty estimate (Chen et al., 2013). This indicates that there is an uncertainty in the theoretical calculation of . Moreover, for 3He(3He, 2)4He reaction, the value of is MeV Barns (Park & Rolfs, 1991), MeV Barns (Adelberger et al., 1998), MeV Barns (Adelberger et al., 2011) or MeV Barns at the Gamow peak. These values have a large uncertainty. The can affect I, II, and III reactions and thus all neutrino fluxes by the feedback effect of solar luminosity calibration of solar model. Bahcall & Pinsonneault (2004) argued that extrapolating to the low energies to obtain -factors relevant for solar fusion introduces a large uncertainty. The factor is not accurately predicted by the chiral effective-field-theory interactions at low chiral orders if the deuteron bound-state properties are not adequately reproduced (Acharya et al., 2023). Bellinger & Christensen-Dalsgaard (2022) showed that when other aspects of the solar model are improved, then it shall be possible using helioseismology and solar neutrinos to improve the precision of measurements of the nuclear cross-section factors in the chains and CNO cycles. Helioseismology, along with solar neutrinos, could even be utilized to determine the -factors.
In this work, we mainly focus on whether the rotating and non-rotating solar models constructed in accordance with Magg et al. (2022) mixtures are in agreement with seismically inferred results and updated neutrino fluxes (Bergström et al., 2016; Borexino Collaboration, 2018, 2020, 2022) and what -factors are favored by the seismically inferred results and updated neutrino fluxes. The paper is organized as follows. Input physics are presented in Section 2, calculation results are shown in Section 3, and the results are discussed and summarized in Section 4.
2 Input Physics
We used the Yale Rotating Stellar Evolution Code (Pinsonneault et al., 1989; Yang & Bi, 2007; Demarque et al., 2008) in its rotation and non-rotation configurations to construct solar models and the Guenther (1994) pulsation code to calculate the -mode frequencies of models. We utilized the OPAL equation-of-state (EOS2005) tables (Rogers & Nayfonov, 2002) and OP opacity tables (Seaton, 1987; The Opacity Project Team, 1995; Badnell et al., 2005; Delahaye et al., 2016), supplemented by the Ferguson et al. (2005) opacity tables at low temperature, which were reconstructed with Magg et al. (2022) mixtures. We employed the subroutine of Bahcall & Pinsonneault (1992, hereafter B92) and Bahcall et al. (1995, 2001) to compute the nuclear reaction rates, including neutrino fluxes. We calculated the diffusion and settling of both helium and heavy elements by using the diffusion coefficients of Thoul et al. (1994).
In the atmosphere, Krishna Swamy (1966) relation rather than Eddington relation was adopted. Choosing between the Krishna Swamy (1966) relation or Eddington relation can not change our results (Yang, 2022). The boundary of CZ was determined by the Schwarzschild criterion, and energy transfer by convection was treated according to the standard mixing-length theory (Böhm-Vitense, 1958). An overshoot of convection is required in order to recover the seismically inferred depth of the CZ in our rotating models. The overshoot region was assumed to be both adiabatically stratified (Christensen-Dalsgaard et al., 1991) and fully mixed. The depth of the overshoot region was determined by (Demarque et al., 2008), where is a free parameter and is the local pressure scale height.
In rotating models, Kawaler’s relation (Kawaler, 1988; Chaboyer et al, 1995) was used to calculate the angular-momentum loss from the CZ due to magnetic braking and the value of was 0.1. The redistribution processes of angular momentum and chemical compositions were treated as a diffusion process (Endal & Sofia, 1978), i.e.
| (1) |
for the transport of angular momentum and
| (2) |
for the change in the mass fraction of chemical species , where is the diffusion coefficient caused by rotational instabilities including the instabilities described by Pinsonneault et al. (1989) and the secular shear instability of Zahn (1993), the density, and the velocity of microscopic diffusion and settling given by Thoul et al. (1994). In the rotating models including the effects of magnetic fields, the also includes the diffusion coefficient of magnetic fields given by Yang & Bi (2006). The parameter was introduced to represent some inherent uncertainties in the diffusion equation, while the parameter was used to account for how the instabilities mix material less efficiently than they transport angular momentum. The default values of and are and (Yang, 2019), respectively. The parameter is a constant. It was used to enhance the rates of diffusion and settling, as Basu & Antia (2004), Guzik et al. (2005), and Yang & Bi (2007) have done, despite the fact that there is no obvious physical justification for such a multiplier. In SSMs, the value of is ; but for an enhanced diffusion model, it is larger than .
All rotating and non-rotating models were calibrated to the present solar luminosity erg , radius cm, mass g, and age Gyr (Bahcall et al., 1995). The initial hydrogen abundance , metal abundance , and mixing-length parameter are free parameters adjusted to match the constraints of luminosity and radius within around and an observed . The initial helium abundance is determined by . The initial rotation rate, , of rotating models is also a free parameter adjusted to reproduce the solar equatorial velocity of about km s-1. The values of these parameters are listed in Table 1.
3 CALCULATION RESULTS
3.1 Solar Models Constructed with the -factors of B92
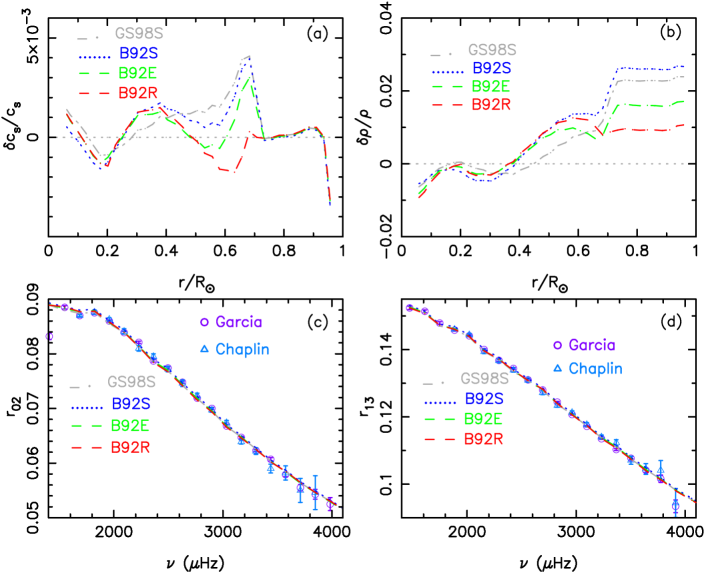
Using the nuclear cross-section factors provided by B92, which are listed in Table 2, we constructed an SSM B92S in accordance with Magg et al. (2022) mixtures. Tables 1 and 3 show the fundamental parameters and central density and temperature of the model, respectively. Table 4 presents the neutrino fluxes calculated from the model. The predicted neutrino fluxes are in agreement with those detected by Borexino Collaboration (2018, 2022) except that the 7Be neutrino flux of cm-2 s-1 is slightly lower than the detected cm-2 s-1 and the total fluxes, cm-2 s-1, of 13N, 15O, and 17F neutrinos are slightly higher than the detected ones (see Table 4). The value of of B92S is 811 (see Table 5), which is larger than 733 of the SSM GS98S constructed in accordance with GS98 mixtures. The sound-speed and density profiles of B92S are not as good as those of GS98S (see Figure 1). The CZ base radius of 0.718 and the surface helium abundance of 0.2400 also disagree with the seismically inferred ones. The position of the BCZ is too shallow and the surface helium abundance is too low. Thus SSM B92S does not agree with helioseismic results.
The enhanced diffusion and settling can significantly improve the sound-speed and density profiles of solar models, but leaves the surface helium abundance too low (Basu & Antia, 2004; Guzik et al., 2005; Yang & Bi, 2007). Rotational mixing can bring the helium in the deep interior of the Sun into outer layers. The gradient of helium abundance in the deep interior is larger than that of heavy-element abundances. The greater the gradient, the larger the impact of rotational mixing on element abundances is. Thus rotational mixing can more efficiently counteract the settling of helium than of heavy-element abundances. The low-helium problem could be resolved in rotating models. Thus we constructed an enhanced diffusion model B92E and a rotating model B92R, in which the rates of element diffusion and settling were increased by (, see Table 1).
For the enhanced diffusion model B92E, the amount of the surface helium settling was increased by about ( by mass fraction, see Table 1). The surface helium abundance of is too low. However, in the rotating model B92R, rotational mixing partially counteracted the diffusion and settling of helium and heavy elements. Thus the amount of the surface helium settling was reduced by about in comparison with that of B92E, which is basically consistent with the result of Proffitt & Michaud (1991), who found that macroscopic turbulent mixing can reduce the amount of the surface helium settling by around . As a consequence, the surface helium abundance of 0.2484 of B92R is in good agreement with the seismically inferred value of (Basu & Antia, 2004). The CZ base radius of of B92R is also consistent with the seismically inferred value of (Christensen-Dalsgaard et al., 1991).
The relative sound-speed difference, , and density difference, , between the Sun and B92R are less than and , respectively. In radiative region, the absolute value of is smaller than . The value of of of B92R is obviously smaller than those of B92S and B92E (see Table 5). The sound-speed and density profiles of B92R are noticeably better than those of B92S, B92E, and GS98S (see Figure 1). Moreover, the ratios of small to large frequency separations, and (Roxburgh & Vorontsov, 2003), calculated from the theoretical frequencies of B92R are in agreement with those computed from observed frequencies of Chaplin et al. (1999b) or García et al. (2011) (see panels and of Figure 1 or Table 5).
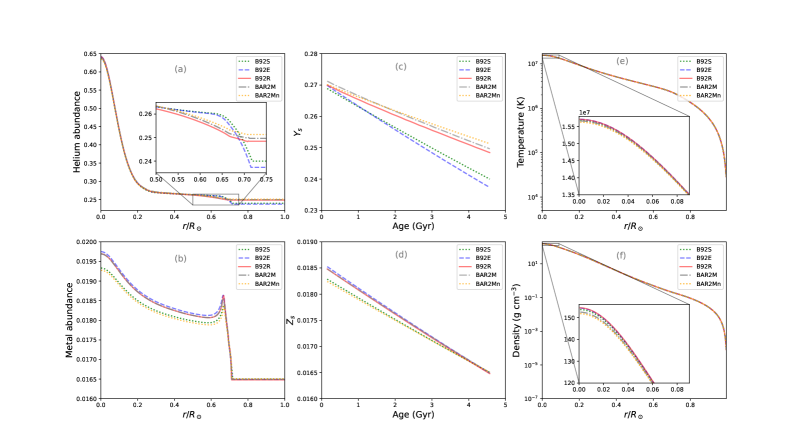
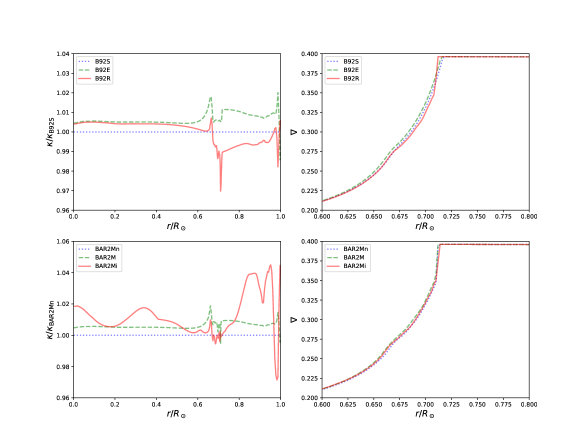
The enhanced diffusion results in B92E having a higher initial metal abundance and more metals in the radiative region, alongside a lower helium abundance in the CZ (see Table 1 and Figure 2). The Rosseland mean opacity increases with an increase in metal abundance. For a given temperature, density, and , it also increases with an increase in hydrogen abundance. Thus the enhanced diffusion leads to the fact that B92E has a larger opacity and temperature gradient compared to B92S (see Figure 3). The large opacity significantly improves solar models. This indicates that a higher opacity is required in the radiative zone of low models to reconcile the low-Z models with helioseismology, which can be achieved by having more metals in the deep layers or by increasing the opacity itself. Rotational mixing enhances the helium abundance and density in the CZ, while it reduces the helium abundance and thus mean molecular weight around (see Figures 1 and 2) compared to B92E. The changes in the distributions of element abundances alter the opacity and temperature gradient of rotating models. Rotating models have a steeper temperature gradient at the BCZ. The squared sound speed is in inverse proportion to . Thus rotating models has a higher sound speed around .
The fluxes of , , , 7Be, and 8B neutrinos computed from B92R are in good agreement with those detected by Borexino Collaboration (2018), while the and fluxes are also consistent with those determined by Bergström et al. (2016) at the level of (see Table 4). However, the total fluxes of 13N, 15O, and 17F neutrinos calculated from B92R are cm-2 s-1, which are larger than the detected cm-2 s-1 (Borexino Collaboration, 2022). This could be due to overestimating the factor of N reaction. The value of adopted by B92 is keV Barns. But that given by Angulo & Descouvemont (2001) and Adelberger et al. (2011) is and keV Barns, respectively. When the value of is decreased from keV Barns to keV Barns, the total fluxes of B92R are cm-2 s-1, which are consistent with the detected one at the level of . Thus rotating model B92R is able to reproduce the updated neutrino fluxes at the level of . It is better than the SSMs GS98S and B92S.
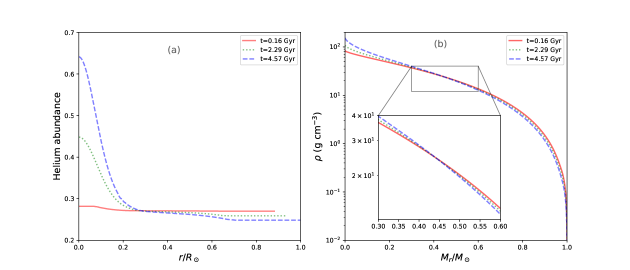
However, panel () of Figure 1 displays that the predicted density is larger than the seismically inferred one in the central region with but smaller than the inferred one in the region with . Figure 4 shows the distributions of helium abundance and density of model B92R at different ages as a function of radius or mass, which reveals that helium abundance in the central region increases rapidly with an increase in age mainly due to nuclear fusion reaction, and that density increases with age in the central region but decreases with age in outer layers (the outer layers expand with age). The discrepancies between the seismically inferred density and the predicted one imply that both the contraction of core and the expansion of envelope of the models exceed what is needed to match those of the Sun. In the central region, the change of helium abundance caused by nuclear reaction is much larger than those deriving from element settling and rotational mixing. Additionally, the central abundances of solar models are influenced by the feedback effect on the initial conditions of models for solar calibration. Rotational mixing mainly affects the density profile in the CZ and at the base of the CZ (see Figures 1 and 2). The effects of element settling and mixing do not eliminate the discrepancies.
According to the definition of Bahcall (1989), an increase in an -factor must result in an increase in fusion cross section and make the corresponding nuclear fusion reaction take place more easily or generate more energies and neutrino fluxes under the same conditions (the same temperature and density). Due to the fact that the luminosity of the Sun is dominated by the energy generated by I branch and the burning of 7Be through electron capture, an increase in , , and (for 3HeHe reaction) will lead to the fact that the solar luminosity can be reproduced by a model with a lower temperature and density in the region with where nuclear reactions take place. If the values of , , and are underestimated, the fusion cross sections will be underestimated, the solar model will need a higher density (more constraction) in the nuclear reaction region to reproduce the solar luminosity at the age of 4.57 Gyr. The more the core contracts, the more pronounced the expansion of outer layers becomes (see panel of Figure 4). As a consequence, the density is too high in the central region but too low in outer layers. Thus the improper nuclear cross-section factors can lead to the density profiles of models deviating from the seismically inferred one.
An increase in the energy released by a reaction must lead to a relative decrease in the energies in conjunction with neutrino fluxes generated by other nuclear fusion reactions because the solar luminosity is constant at the age of 4.57 Gyr. In branch, the energy generated by 3HeHe reaction is approximately equal to those released by and 2H reactions. In other words, the luminosity is dominated by the energy generated by 3HeHe reaction. The 3HeHe reaction does not produce any solar neutrinos. Thus increasing must lead to a decrease in the fluxes of , , , 7Be, 8B, 13N, 15O, and 17F neutrinos and a reduction in density in the central region with . Increasing will result in an elevation in and neutrino fluxes and a reduction in other neutrino fluxes and density in the central region. Similarly, an overestimate of will induce an increase in 7Be and 8B neutrino fluxes while causing a decrease in other neutrino fluxes and density in the central region. Other -factors primarily influence neutrino fluxes directly associated with their respective -factors.
The impact of overestimating on neutrino fluxes can be counteracted by the effects of overestimating other -factors. However, these overestimations inevitably result in a density in the central region that is too low. Conversely, underestimations would lead to the density in the central region being too high. The density profile of the Sun can be inferred through helioseismology (Basu et al., 2009). These distinctive characteristics make the combination of detected neutrino fluxes and seismically inferred density a potential tool for diagnosing the nuclear cross-section factors. The densities in the central regions of B92S, B92E, and B92R are lower than the inferred ones (see Figure 1), which may stem from underestimating the values of , , and .
3.2 Solar Models Constructed with the -factors of A11
The values of , , and given by Adelberger et al. (2011) are , , and keV Barns, respectively, which are larger than those adopted by B92, despite the fact that they agree with each other at the level of (see Table 2). Using these factors and the given by Angulo & Descouvemont (2001), we constructed a rotating model A11R.
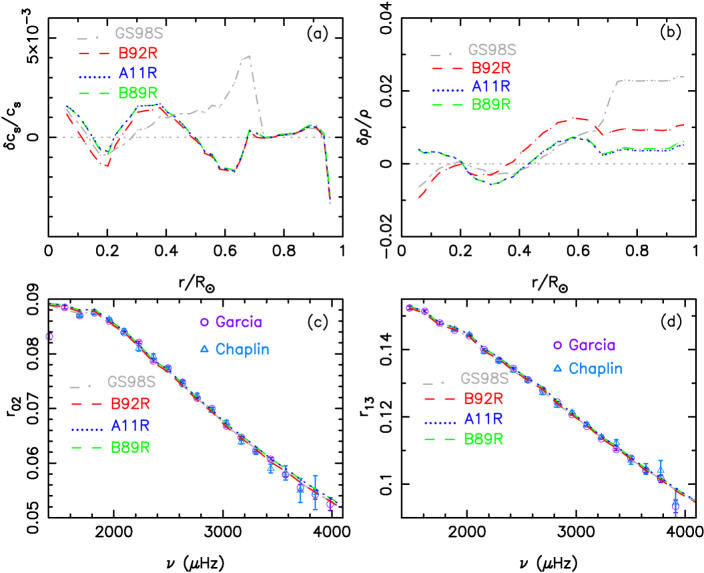
The surface helium abundance and the CZ base radius of A11R are 0.2501 and 0.712 , respectively, which agree with the seismically inferred ones at the level of . Figure 5 exhibits the distributions of , , , and of the model, which shows that the increases in the -factors ( and ) markedly improve the density profile, but they slightly worsen the ratios and in comparison to those of the model B92R. Model A11R has a smaller but a larger than B92R (see Table 5). This indicates that even a small change (within ) in the -factors can lead to a marked change in solar models.
The total fluxes predicted by A11R are cm-2 s-1, which are in good agreement with those detected by Borexino Collaboration (2022) but lower than those predicted by B92R due to the fact that the value of given by Angulo & Descouvemont (2001) is smaller than that adopted by B92. However, the fluxes of and neutrinos predicted by A11R are obviously lower than those determined by Bergström et al. (2016) (see Table 4), despite the fact that the fluxes are consistent with those detected by Borexino Collaboration (2018) at the level of . Moreover, the flux of cm2 s-1 of 8B neutrino predicted by the model is lower than that reported by Bergström et al. (2016) and the one detected by Borexino Collaboration (2018).
The reaction rate is proportional to the reaction rate (see Equation (3.17) of Bahcall (1989)). The fluxes of and neutrinos calculated from A11R are lower than those determined by Bergström et al. (2016), which may result from underestimating . However, if the values of and are overestimated, the 3HeHe and 3HeHe reactions will take place more easily. Due to the fact that the luminosity of the Sun is constant at the age of 4.57 Gyr, the overestimate will lead to a decrease in the energy and neutrino fluxes generated by other reactions. Therefore, the low and neutrino fluxes could also derive from overestimating the values of and .
The 3HeHe reaction produces , and then electron capture produces and proton capture produces . Thus the fluxes of both 7Be and 8B neutrinos are proportional to the ambient density of 7Be ions, i.e. the value of can affect the fluxes of both 7Be and 8B neutrinos at the same time. The 7Be neutrino flux of A11R is in agreement with that determined by Bergström et al. (2016) and the one detected by Borexino Collaboration (2018), but the 8B neutrino flux of A11R is lower than those determined by Bergström et al. (2016) and Borexino Collaboration (2018). These suggest that the factor could not be overestimated but the factor of proton capture could be underestimated by A11. As a consequence, the low and neutrino fluxes could derive from underestimating the value of and overestimating the value of ; and the low 8B neutrino flux could result from underestimating the value of .
In order to reproduce the and 8B neutrino fluxes of Bergström et al. (2016), the values of and of Adelberger et al. (2011) should be increased to about (an increase of about ) and (an increase of about ) keV Barns, respectively, which are in good agreement with the new value of given by De-Leon & Gazit (2023) and the value of of Bahcall & Pinsonneault (1992). The change in is much larger than the uncertainty of recommended by Adelberger et al. (2011). However, the density in the central region with of this model is too low compared to the seismically inferred one and the 7Be and 8B neutrino fluxes calculated from this model are obviously low than those detected by Borexino Collaboration (2018). The helioseismic results and updated neutrino fluxes are not in favour of keV Barns and MeV Barns. Reducing the value of by about would result in significant improvements to both the predicted neutrino fluxes and density profile. The value of of Adelberger et al. (2011) has a large uncertainty. Extrapolating to the low energies to obtain -factors of the solar fusion could introduce a large uncertainty. The value of of Bahcall (1989) is larger than that of Adelberger et al. (2011) and in good agreement with the new theoretical results of Acharya et al. (2016, 2023) and De-Leon & Gazit (2023). And the value of MeV Barns of of Bahcall (1989) is lower than that of Adelberger et al. (2011). Thus using the -factors of B89 (see Table 2), we constructed a rotating model B89R.
3.3 Solar Models Constructed with the -factors of B89
The surface helium abundance of and the CZ base radius of of B89R are in good agreement with the seismically inferred values. Figure 5 shows that B89R exhibits superior sound-speed and density profiles (smaller ) compared to GS98S and B92R. The absolute values of and between the Sun and B89R are less than and , respectively. The values of and of B89R are and , which are almost equal to those of A11R (see Table 5). B89R and A11R have almost the same ratios and , and sound-speed and density profiles.
The fluxes of and neutrinos calculated from B89R are obviously larger than those computed from A11R and in agreement with those determined by Bergström et al. (2016) at the level of about (see Table 4). The total fluxes predicted by B89R amount to cm-2 s-1, aligning with the detected cm-2 s-1 at the level.
However, the 7Be and 8B neutrino fluxes calculated from B89R fall short of simultaneously matching those determined by Bergström et al. (2016) or Borexino Collaboration (2018). The 7Be neutrino flux of cm-2 s-1 of B89R is notably lower than that detected by Borexino Collaboration (2018). This can be attributed to the fact that the value of of B89R was underestimated by about . The 8B neutrino flux of cm-2 s-1 of B89R is in agreement with that detected by Borexino Collaboration (2018) but obviously larger than the one determined by Bergström et al. (2016). The predicted fluxes of both 7Be and 8B neutrinos are proportional to the value of . The increase in must lead to the fact that the predicted 8B neutrino flux is much larger than those determined by Bergström et al. (2016) and Ahmed et al. (2004). Thus the value of of B89 could be overestimated by about .
The value of of Bahcall (1989) is twice as much as that of Adelberger et al. (2011). Extrapolating to the low energies to obtain -factors relevant for solar fusion could introduce a large uncertainty. Thus we tested both the -factors of CNO cycles of Bahcall (1989) and those of Adelberger et al. (2011). Due to the fact that detected fluxes of 13N, 15O, and 17F neutrinos have a large uncertainty, both the CNO -factors of Bahcall (1989) and those of Adelberger et al. (2011) can reproduce the detected fluxes at the level of . The detected fluxes can not provide a rigorous constraint on the -factors of CNO cycles. But the CNO -factors of Adelberger et al. (2011) are more favored by the detected fluxes. More precise measurements are necessary to effectively utilize neutrino fluxes for constraining the -factors of CNO cycles, which could be achieved by the Jiangmen Underground Neutrino Observatory (JUNO) (Abusleme et al., 2023). In following calculations, we will adopt the -factors of CNO cycles of Adelberger et al. (2011).
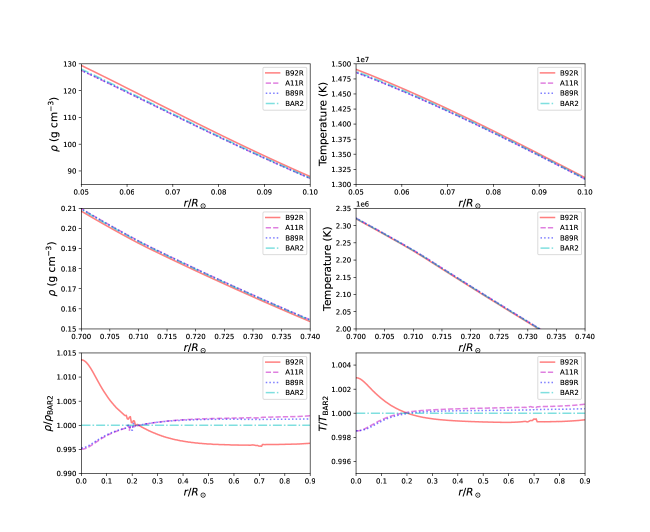
An increase in affects only the 8B neutrino flux. However, the increases in , , and will lead to the fact that the solar luminosity can be reproduced by a model with a lower temperature and density in the nuclear reaction region. Thus the temperatures and densities of A11R and B89R are lower than those of B92R in the central region with (see Table 3 and Figure 6). The lower the density in the central region, the higher the density in outer layers is, i.e the less the core contracts, the less pronounced the expansion of outer layers becomes (see Figures 4 and 6). Thus the increase in , , and markedly improved the density profiles of A11R and B89R in comparison to that of B92R. The density profile of B89R is almost as good as that of A11R but the neutrino fluxes calculated from B89R are more consistent with the detected ones than those computed from A11R. The value of of B89 is smaller than that of A11. This further indicates that the value of may be overestimated by A11.
3.4 The Nuclear Cross-section Factors with the Constraints of Detected Neutrino Fluxes and Helioseismic Results
Model A11R shows that Adelberger et al. (2011) might overestimate the value of and underestimate the values of and . But B89R shows that Bahcall (1989) might underestimate the value of and overestimate the value of . Using of Bahcall (1989) and of Bahcall & Pinsonneault (1992) to replace the corresponding -factors of A11R (see Table 2), we constructed a rotating model BAR1. In order to reproduce the and neutrino fluxes determined by Bergström et al. (2016), the value of need to be increased to keV Barns, which is in consistent with the new results of De-Leon & Gazit (2023) and Acharya et al. (2023) at the level of . The surface helium abundance and radius of BAR1 agree with the seismically inferred ones at the level of (see Table 1). Due to the fact that the impact of the increase of on density is partially counteracted by the effect of the decrease of , the changes in the -factors have a comparatively small effect on sound-speed and density profiles in comparison to those of A11R. Thus BAR1 and A11R have almost the same and (see Table 5). But they have different neutrino fluxes (see Table 4) due to the fact that both a decrease in and an increase in can lead to an increase in and neutrino fluxes.
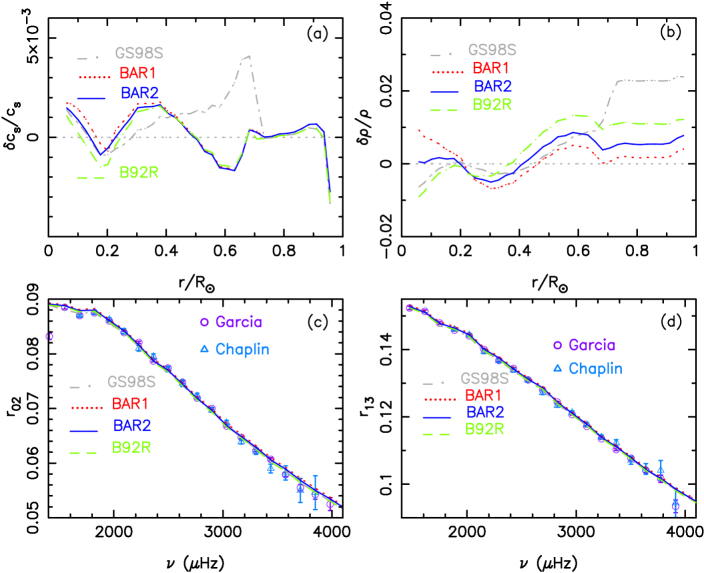
Table 4 shows that the fluxes of , , 7Be, and 8B neutrinos calculated from BAR1 are consistent with those determined by Bergström et al. (2016) at the level of . The total fluxes of 13N, 15O, and 17F neutrinos of BAR1 amount to cm-2 s-1, which are in good agreement with the cm-2 s-1 detected by Borexino Collaboration (2018). However, the 7Be and 8B neutrino fluxes of BAR1 are obviously lower than those detected by Borexino Collaboration (2018).
Increasing of BAR1 alone can bring the 7Be and 8B neutrino fluxes into better agreement with those detected by Borexino Collaboration (2018) but will worsen the density profile in the central region with . In addition, Figure 7 reveals that the density in the central region of BAR1 is lower than that inferred by Basu et al. (2009). This indicates that the values of and are not favored by helioseismic results. The values of and are overestimated by BAR1.
Decreasing can lead to an increase in all neutrino fluxes and a rise in density in the central region. In order to keep the neutrino flux agreeing with the one determined by Bergström et al. (2016), the value of also should be decreased at the same time. Decreasing from keV Barns of BAR1 to keV Barns and from 5.15 MeV Barns to 5.05 MeV Barns, we constructed the rotating model BAR2. The values of other -factors of BAR2 are same as those of BAR1 and shown in Table 2. The surface helium abundance and the radius of the BCZ of BAR2 are 0.2495 and 0.712 , respectively, which agree with the seismically inferred ones at the level of . The values of and of BAR2 are 217 and 1.8, respectively. Figure 7 shows that BAR2 has better sound-speed and density profiles than GS98S and B92R, and reproduces the distributions of ratios and calculated from observed frequencies. The changes in , , and significantly improve the density profile in the region with in comparison to those of B92R and BAR1.
The neutrino fluxes calculated from BAR2 are cm-2 s-1, cm-2 s-1, cm-2 s-1, cm-2 s-1, cm-2 s-1, and cm-2 s-1. These fluxes are in good agreement with those determined by Bergström et al. (2016) and Borexino Collaboration (2018, 2022) at the level of except the neutrino flux that has a large uncertainty in detection (see Table 4). Thus the values of the -factors of BAR2 are favored by helioseismic results and updated neutrino fluxes.
3.5 Rotating Model Including the Effects of Magnetic Fields
The surface lithium and beryllium abundances of the Sun are and dex (Lodders et al., 2021), respectively. At the time of the birth of the Sun, the Li and Be abundances are about and dex, respectively. The solar Li depletion is about dex in the pre-main-sequence stage, depending on whether the convection overshoot or other mechanism is included. There is almost no depletion for Be in the pre-main-sequence stage. The typical temperatures for 7Li and 9Be proton-capture reaction are about K and K, respectively, which are higher than the temperature of the BCZ of a solar model. Thus the Li and Be elements in the CZ of an SSM cannot be destroyed in main sequence stage. As a consequence, the Li abundances predicted by GS98S and B92S are about times as large as the observed one.
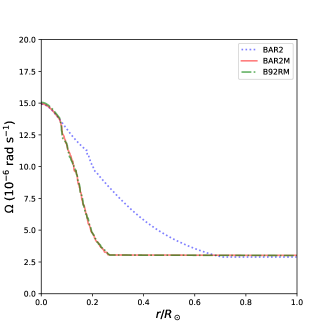
Rotational mixing can bring the helium in the radiative region into the CZ and transport the material in the CZ into the radiative region. Thus it can simultaneously enhance the surface helium abundance and decrease the surface Li and Be abundances. The Li and Be abundances predicted by rotating models B92R and BAR2 are 1.13 and 1.31 dex, respectively, which are consistent with the results of Lodders et al. (2021). However, the rotating models cannot reproduce the seismically inferred flat rotation profile in the external part of the radiative region (see Figure 8). These indicate that B92R and BAR2 nearly mimic the material mixing processes but do not mimic angular momentum transport of the Sun.
In order to obtain a flat rotation profile, we considered the effects of magnetic fields that were described in detail by Yang & Bi (2006) and Yang (2016), where an adjustable parameter was introduced to represent some inherent uncertainties in diffusion equation and was used to account for how the magnetic fields mix material less efficiently than they transport angular momentum. With the -factors of BAR2 and and , we constructed a rotating model BAR2M0. This model has a flat rotation profile. But the surface helium abundance of is too large, and the surface Li and Be abundances of A(Li) and A(Be) are too low (see Table 1), indicating that there is too much material exchanged between the radiative region and the CZ of BAR2M0, i.e. the efficiency of mixing is too high.
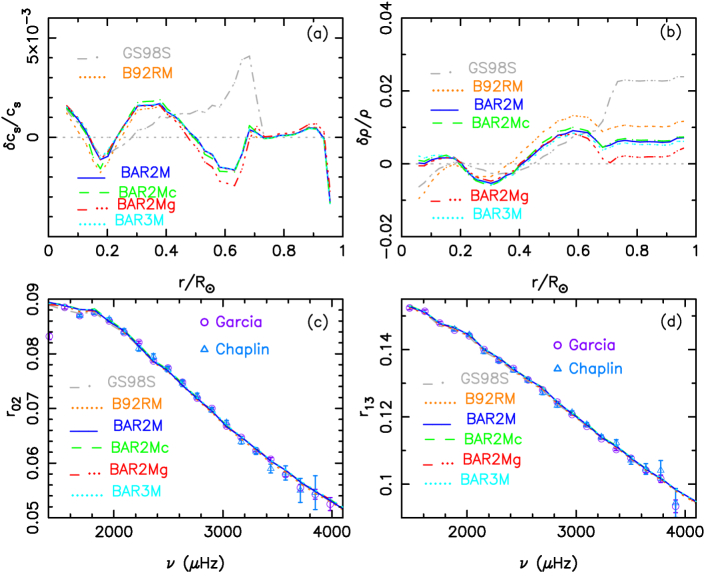
In order to simultaneously obtain a nearly flat rotation profile and the observed Li and Be abundances, with and , we constructed rotating models B92RM and BAR2M. These models predict both a nearly flat rotation profile in the external part of the radiative zone and an increase in the rotation rate in the solar core (see Figure 8), which are in good agreement with the predictions of the magnetic model of Eggenberger et al. (2019) and that inferred by helioseismology (Thompson et al., 2003). Both B92RM and BAR2M reproduce the inferred surface He, Li, and Be abundances and CZ depth (see Table 1). But the sound-speed and density profiles of BAR2M are in better agreement with seismically inferred ones than those of B92RM and GS98S (see Figure 9). The neutrino fluxes calculated from BAR2M are almost the same as those computed from BAR2, and are more consistent with ones determined by Bergström et al. (2016) and Borexino Collaboration (2018, 2022) than those computed from B92RM (see Table 4). Thus the effects of magnetic fields solve the problem of rotation profile of BAR2 but do not change the results obtained from B92R and BAR2.
The value of keV Barns of is slightly lower than the central value of keV Barns given by Acharya et al. (2023) and keV Barns given by De-Leon & Gazit (2023). With and keV Barns, we constructed a rotating model BAR3M. Other -factors are same as those of BAR2M and shown in Table 2. The neutrino flux calculated from this model is cm2 s-1. The predicted neutrino fluxes are in agreement with the detected ones at the level of (see Table 4). The sound speed and density profiles of this model are as good as those of BAR2M (see Figure 9). The values of supported by helioseismic data and updated neutrino fluxes align well with recent theoretical findings (Acharya et al., 2016, 2023; De-Leon & Gazit, 2023) but larger than the previously accepted value of Adelberger et al. (2011). The increase in is much larger than the uncertainty of the recommended by Adelberger et al. (2011). This indicates that Adelberger et al. (2011) underestimated the value of by about and overestimated the value of by about .
An increase in would reduce the predicted 7Be neutrino flux and decrease the density in the central region. For example, the 7Be neutrino flux calculated from a model with and keV Barns is cm2 s-1. And a model having a larger generally exhibits having a larger and a lower density in nuclear reaction region. Thus the 7Be neutrino flux detected by Borexino Collaboration (2018) and helioseismic results do not favor a model having and keV Barns at the same time.
3.6 Solar Models Constructed with Other Mixtures
Using the -factors of BAR2, we also constructed magnetic models BAR2Mc in accordance with the Caffau et al. (2011) mixtures and BAR2Mg in accordance with GS98 mixtures. The changes in metallicity can affect the fluxes of 13N and 15O neutrinos (see Table 5). The total fluxes of 13N, 15O, and 17F neutrinos are cm-2 s-1 for BAR2Mc, cm-2 s-1 for BAR2M, and cm-2 s-1 for BAR2Mg. The total fluxes increase with an increase in metal abundances but they are all in agreement with the detected ones at the level of . The relative differences between the predicted fluxes are about . If the precision of measurements of the fluxes can reach the level of about , the solar models constructed in accordance with different abundance scales would be distinguished by the fluxes of 13N and 15O neutrinos.
Figure 9 shows that the sound-speed and density profiles of BAR2M are slightly better than those of BAR2Mc and BAR2Mg. Calculations also show that the value of of BAR2M is smaller than those of BAR2Mc and BAR2Mg (see Table 5). This indicates that the model constructed in accordance with Magg’s mixtures is slightly better than those constructed in accordance with the Caffau et al. (2011) or GS98 mixtures.
4 Discussion and Summary
In enhanced diffusion models, the velocities of diffusion and settling were increased by . In non-rotating models, the enhanced diffusion worsens the surface helium abundance. But in rotating models, the effect of the enhanced diffusion on the surface helium abundance was completely counteracted by rotational mixing (see Figure 2). However, we have no obvious physical justification for the increase. Moreover, the effects of radiative accelerations on settling were not included in our models. The radiative effects can lead to the heavy-element abundance and the mixture of the heavy elements vary as a function of stellar age and position in the Sun (Turcotte et al., 1998). The radiative acceleration effect could be counteracted by the effects of rotation and magnetic fields.
The rotational history of the Sun is still unknown. We only considered the slow rotating case and the angular momentum loss mechanism of Kawaler (1988) in this work. Faster rotation and more efficient angular momentum loss could accompany by more efficient material mixing that can lead to Li and Be depletion. Different magnetic winds, such as that of Matt et al. (2015), could affect the values of and that depend on Li and Be abundances and derserve more detail study. The rotating model of Eggenberger et al. (2019) has a larger initial velocity and a higher angular momentum loss rate than ours. The surface He abundance of Buldgen et al. (2023)’s model including macroscopic mixing and convection overshoot is 0.2516, which is slightly higher than 0.2496 of BAR2M. The surface Li and Be abundances of the Buldgen et al. (2023) model are about 0.9 and 1.0, respectively, which are lower than 1.1 and 1.3 of BAR2M. This indicates that the mixing of Buldgen et al. (2023) models is more efficient than that of our models. In the deep layers, our models have a higher metal abundance than the Buldgen et al. (2023) model. The lithium abundance of the Sun determined by Wang et al. (2023) is . The lithium abundances predicted by our models are higher than the reported value. Additionally, the models show that there is some beryllium depletion with respect to the initial value. This depletion could offer a more stringent constraint on material mixing during the main sequence stage, as beryllium depletion occurs during this phase as well.
The enhanced diffusion models have a higher initial metal abundance and more metals in the radiative region. Thus they have a larger opacity. The rotating model BAR2Mn without enhanced diffusion has a lower initial metal abundance and less metals in the radiative region. The values of and of BAR2Mn are larger than those of B92E. The calculations show that a non-rotating model with enhanced diffusion is better than a rotating model without enhanced diffusion except the surface helium abundance. Thus a higher opacity is required in the radiative zone of low Z models to reconcile the low-Z models with helioseismology, which can be achieved by having more metals in the deep layers or by increasing the opacity itself. The almost same conclusions about the -factors can also be obtained from non-rotating models with enhanced diffusion. Therefore, the results about -factors can not be changed by the uncertainty of mixing.
Kunitomo & Guillot (2021) and Kunitomo et al. (2022) shows that accretion with a variable composition due to planet formation processes induces a higher central metallicity of the present-day Sun by up to , which also can improve solar model and predicted neutrino fluxes. The effects of the accretion is not considered in our models. The enhanced diffusion in our models leads to an increase of about in the central metallicity in comparison to that of SSM (see Table 3).
Figure 6 shows the density distributions of models. The differences in the densities have nothing to do with the variations in radii of the models. Taking a smaller radius, such as that inferred by Takata & Gough (2024), mainly affects the density and sound speed above and leads to a larger , which can not change our results.
OP opacity is slightly larger than OPAL opacity at the base of the CZ, but no more than (Badnell et al., 2005). The solar models constructed by using OPAL opacity tables are not as good as those constructed by using OP opacity tables unless OPAL opacities for the regions of the Sun with K K are increased linearly by no more than centered at K (Yang, 2022). By using this increased OPAL opacity, we constructed a magnetic model BAR2Mi with , , , , , and . This model is slightly better than BAR2M. The small increase in OPAL opacity improved solar models but did not change our results. The effects of an increase in opacity on solar models were also studied by Ayukov & Baturin (2017) and Kunitomo & Guillot (2021). They concluded that an increase in opacity is required to reconcile the low-Z models with helioseismology. The solar model constructed by using OPAL opacity generally has a slightly higher helium abundance in the CZ than that constructed by using OP opacity. An increase of OP opacity in the deep layers can also lead to an increase of helium in the CZ (see model Cop11ri of Yang (2022)).
The fluxes of predicted by models are lower than that determined by Bergström et al. (2016). If the value of keV Barns (Wolfs et al., 1989) is adopted, the values of the fluxes predicted by BAR2M and BAR3M are about cm-2 s-1, which are in agreement with that determined by Bergström et al. (2016) at the level of . The flux of 8B neutrino predicted by BAR2M is in good agreement with that detected by Borexino Collaboration (2018) but not consistent with that determined by Bergström et al. (2016). The value of given by Adelberger et al. (2011) is keV Barns. If the value of keV Barns is adopted, the 8B neutrino flux of BAR2M is cm-2 s-1, which is in good agreement with the one determined by Bergström et al. (2016). The changes in and affect only the and 8B neutrino fluxes, respectively. They can not affect the sound-speed and density profiles and thus can not change our results. Thus BAR2M is able to reproduce all neutrino fluxes at the level of .
Simultaneously increasing , , and has almost no effect on the predicted fluxes of , , 7Be, and 8B neutrinos. But the increases can lead to a reduction in the predicted fluxes of , 13N, 15O, and 17F neutrinos and a decrease of density in the central region. However, the detected fluxes of , 13N, 15O, and 17F neutrinos can not provide a constraint on the changes in , , and due to the large uncertainties in current detections. Thus, the neutrino fluxes alone cannot be used to constrain the changes in the -factors. If the uncertainties of the fluxes of 13N, 15O, and 17F neutrinos are less than , they will impose a solid constraint on , , and .
The predicted fluxes of both 7Be and 8B neutrinos are dependent on the value of , while the 8B neutrino flux also depends on . They are also affected by and . An increase in either or will lead to a decrease in the fluxes of predicted 7Be and 8B neutrinos. Model BAR1 and BAR2 share the same values for and but have different 7Be and 8B neutrino fluxes, which results from the differences in and . The fluxes calculated from BAR1 agree with those determined by Bergström et al. (2016). However, if eV Barns is taken, the 8B neutrino flux calculated from BAR1 is about cm-2 s-1, which is lower than that determined by Bergström et al. (2016). This indicates that the and of BAR1 are too large.
The reaction rate between two nuclear species is proportional to the number densities of particles (nuclei) and the average product of interaction cross section of the particles times velocity. The density is proportional to the number densities of nuclei. The average product can be written as a formula that is proportional to the nuclear cross-section factor (see the Equations (3.5), (3.12), and (3.13) of Bahcall (1989)). The solar luminosity is constant at the age of 4.57 Gyr. And the solar energy is mainly generated by I and II branches. The larger the nuclear cross-section factors, the more easily the corresponding nuclear reactions occur under the same conditions. Overestimating , , and would necessitate a lower density to maintain the total energy generation rate unchanged at the age of 4.57 Gyr. This would consequently lead to the density of models being lower than the seismically inferred one in the region where nuclear fusion reactions take place. Conversely, underestimating , , and would result in the density being too high. The solar density can be constrained down to about by helioseismology. As a consequence, the combination of detected neutrino fluxes and seismically inferred density profile in the region with imposes a solid constraint on the values of , , and .
Ayukov & Baturin (2017) concluded that the value of of Adelberger et al. (2011) should be increased by several percent, in order to obtain a solar model with low Z that is in agreement with the results of helioseismology and detected solar neutrino fluxes. However, the updated neutrino fluxes and seismically inferred density do not favor an larger than keV Barns or smaller than keV Barns and an larger than MeV Barns or smaller than MeV Barns. The calculations show that the updated neutrino fluxes and seismically inferred density favor an keV Barns and an between about 5.05 and 5.10 MeV Barns. The value of the favored by helioseismic results and updated neutrino fluxes is in good agreement with the new value of keV Barns predicted by chiral effective field theory (Acharya et al., 2023) and keV Barns predicted by pionless effective field theory (De-Leon & Gazit, 2023). The increase of predicted by theories compared to previous calculations is mainly driven by an increase in the recommended value for the axial coupling constant (Acharya et al., 2023). The precise from the Sun may be useful in driving down the uncertainties in the constants of the theories and hence improve our understanding of the relevant theories (Bellinger & Christensen-Dalsgaard, 2022).
In this work, using the -factors provided by B92, A11, and B89, we constructed standard and rotating solar models in accordance with Magg’s mixtures. The surface helium abundance and the CZ depth of the SSMs do not agree with the seismically inferred ones. The SSMs are not as good as the SSM GS98S constructed in accordance with GS98 mixtures. In the rotating models, we included the effects of convection overshoot and enhanced diffusion. A convection overshoot of is required in rotating models to recover the seismically inferred CZ depth. The combination of enhanced diffusion and rotation brings the surface helium abundance into agreement with the seismically inferred value at the level of , and make rotating models have better sound-speed and density profiles than SSMs. However, in order to obtain a nearly flat rotation profile in the external part of the radiative region (above 0.2 ), the effects of magnetic fields are required. As a consequence, we obtained a rotating model, B92RM, which is better than the earlier SSMs and rotating models constructed in accordance with GS98 or Caffau’s mixtures. Model B92RM has better sound-speed and density profiles (smaller ) than the earlier models. The surface helium abundance and radius of the BCZ of B92RM agree with the seismically inferred ones at the level of . Additionally, the neutrino fluxes calculated from B92RM are consistent with those updated by Bergström et al. (2016) and Borexino Collaboration (2018, 2020) at the level of .
A small increase or decrease (around ) in nuclear cross-section factors , , and can result in a significant change in the predicted neutrino fluxes and density profile, particularly affecting the density in the central region with . An increase in may decrease the density in the central region and reduce the fluxes of , , , 7Be, 8B, 13N, 15O, and 17F neutrinos. An increase in would raise the fluxes of and neutrinos but decrease other neutrino fluxes and the central density. Similarly, an increase in would elevate the fluxes of 7Be and 8B neutrinos but diminish other neutrino fluxes and the central density. The effects of an increase in on the fluxes of , , 7Be, and 8B neutrinos can be counteracted by the effects of an increase in and . However, these increases must lead to a decrease in density in the region where nuclear fusion reactions take place. Conversely, if , , and are underestimated, the underestimation must result in the central density being too high. These distinctive characteristics make the combination of updated neutrino fluxes and seismically inferred density profile a powerful tool for diagnosing the -factors.
Using this diagnostic approach, we found that Bahcall & Pinsonneault (1992) could underestimate the values of , , and by about , while Adelberger et al. (2011) could overestimate the value of by about but underestimate the value of by around . The updated neutrino fluxes and the seismically inferred density profile favor the -factors: keV Barns, MeV Barns, keV Barns, and eV Barns. These factors agree with different measurements at the level of . Using these factors, we obtained a rotating model, BAR2M or BAR3M, that is better than B92RM and the earlier models. The sound-speed and density profiles of this model are better than those of B92RM and thus better than those of the models constructed in accordance with GS98 or Caffau et al. (2011) mixtures. The surface metal abundance of BAR2M is . The surface helium abundance of and the radius of the BCZ of are consistent with the seismically inferred values at the level of . The initial helium abundance is , which is consistent with the value of inferred by Serenelli & Basu (2010). The ratios and of BAR2M agree with those calculated from observed frequencies. Moreover, the fluxes of , , , 7Be, and 8B neutrinos and the total fluxes of 13N, 15O, and 17F neutrinos computed from BAR2M agree with those determined by Bergström et al. (2016) and Borexino Collaboration (2018, 2020, 2022) at the level of . This model predicts both a nearly flat rotation profile in the external part of the radiative region and an increase in the rotation rate in the solar core, which are in good agreement with the results of Eggenberger et al. (2019). The results about the -factors are not affected by choosing OPAL or OP opacity tables and choosing Magg’s or Caffau’s mixtures.
References
- Abusleme et al. (2023) Abusleme, A., Adam, T., Ahmad, S., et al. 2023, JCAP, 10, 022
- Acharya et al. (2016) Acharya, B., Carlsson, B. D., Ekström, A., Forssén, C., and Platter, L. 2016, PhLB, 760, 584
- Acharya et al. (2023) Acharya, B., Marcucci, L. E., Platter, L. 2023, JPhG, 50, 095102
- Adelberger et al. (1998) Adelberger, E. G., Austin, S. M., Bahcall, J. N. et al. 1998, RvMP, 70, 1265
- Adelberger et al. (2011) Adelberger, E. G., Garcia, A., Robertson, R. G. H., et al. 2011, RvMP, 83, 195 (A11)
- Ahmed et al. (2004) Ahmed, S. N., Anthony, A. E., Beier, E. W. et al. 2004, PhRvL, 92, 1301
- Amarsi et al. (2021) Amarsi, A. M., Grevesse, N., Asplund, M., Collet, R. 2021, A&A, 656, 113
- Angulo & Descouvemont (2001) Angulo, C., Descouvemont, P. 2001, Nuclear Physics A, 690, 755
- Asplund et al. (2021) Asplund, M., Amarsi, A. M., Grevesse, N. 2021, A&A, 653, 141
- Asplund et al. (2005) Asplund, M., Grevesesse, N., Sauval, A. J., Allende Prieto, C., & Blomme, R. 2005, A&A, 431, 693
- Asplund et al. (2009) Asplund, M., Grevesse, N., Sauval, A., & Scott, P. 2009, ARA&A, 47, 481
- Ayukov & Baturin (2017) Ayukov, S. V., & Baturin, V. A. 2017, ARep., 61, 901
- Badnell et al. (2005) Badnell, N. R., Bautista, M. A., Butler, K., et al. 2005, MNRAS, 360, 458
- Bahcall (1989) Bahcall, J. N. , 1989, Neutrino Astrophysics (Cambridge: Cambridge Univ. Press, England) (B89).
- Bahcall & Pinsonneault (1992) Bahcall, J. N., & Pinsonneault, M. H. 1992, RvMP, 64, 885 (BP92)
- Bahcall & Pinsonneault (2004) Bahcall, J. N., & Pinsonneault, M. H. 2004, Phys. Rev. Lett., 92, 121301
- Bahcall et al. (2001) Bahcall, J. N., Pinsonneault, M. H., & Basu, S, 2001, ApJ, 555, 990
- Bahcall et al. (1995) Bahcall J. N., Pinsonneault M. H., & Wasserburg G. J. 1995, RvMP, 67, 781
- Bahcall et al. (2004) Bahcall, J. N., Serenelli, A. M., & Pinsonneault, M. H. 2004, ApJ, 614, 464
- Bahcall & Ulrich (1988) Bahcall, J. N., & Ulrich, R. 1988, RvMP, 60, 297
- Basu & Antia (1997) Basu, S., & Antia, H. M. 1997, MNRAS, 287, 189
- Basu & Antia (2004) Basu, S., & Antia, H. M. 2004, ApJL, 606, L85
- Basu et al. (2009) Basu, S., Chaplin, W. J., Elsworth, Y., New, R., & Serenelli, A. M. 2009, ApJ, 699, 1403
- Basu et al. (2015) Basu, S., Grevesse, N., Mathis, S., Turck-Chièze, S. 2015, SSRv, 196, 49
- Bellinger & Christensen-Dalsgaard (2022) Bellinger, E. P., Christensen-Dalsgaard, J., 2022, MNRAS 517, 5281
- Bellini et al. (2011) Bellini, G. Benziger, J. Bick, D. et al. 2011, PhRvL, 107, 141302
- Bellini et al. (2012) Bellini, G. Benziger, J. Bick, D. et al. 2012, PhRvL, 108, 51302
- Bergström et al. (2016) Bergström, J., Gonzalez-Garcia, M. C., Maltoni, M., et al. 2016, JHEP, 3, 132
- Böhm-Vitense (1958) Böhm-Vitense, E. 1958, ZAp, 46, 108
- Borexino Collaboration (2018) Borexino Collaboration (Agostini, M., Altenmüller, K., Appel, S., et al.) 2018, Nature, 562, 505
- Borexino Collaboration (2020) Borexino Collaboration (Agostini, M., Altenmüller, K., Appel, S., et al.) 2020, Nature, 587, 577
- Borexino Collaboration (2022) Borexino Collaboration (Appel, A., Bagdasarian, Z., Basilico, D., et al.) 2022, PhRvL, 129, 252701
- Buldgen et al. (2019) Buldgen, G., Salmon, S. J. A. J., Noels, A., et al. 2019, A&A, 621, 33
- Buldgen et al. (2023) Buldgen, G., Eggenberger, P., Noels, A., Scuflaire, R., Amarsi, A. M., Grevesse, N., Salmon, S. 2023, A&A 669, L9
- Buldgen et al. (2024) Buldgen, G., Noels, A., Baturin, V. A., et al. 2024, A&A, 681, A57
- Caffau et al. (2010) Caffau, E., Ludwig, H.-G., Bonifacio, P., et al. 2010, A&A, 514, A92
- Caffau et al. (2011) Caffau, E., Ludwig, H.-G., Steffen, M., Freytag, B., Bonifacio, P. 2011, SoPh, 268, 255
- Chaboyer et al (1995) Chaboyer, B., Demarque, P., Pinsonneault, M. H. 1995, ApJ, 441, 865
- Chaplin et al. (1999a) Chaplin, W. J., Christensen-Dalsgaard, J., Elsworth, Y., et al. 1999a, MNRAS, 308, 405
- Chaplin et al. (1999b) Chaplin, W. J., Elsworth, Y., Isaak, G. R., Miller, B. A., & New, R. 1999b, MNRAS, 308, 424
- Chen et al. (2013) Chen, J. W., Liu, C. P., & Yu, S. H. 2013, Phys. Lett. B, 720, 385
- Christensen-Dalsgaard et al. (1991) Christensen-Dalsgaard, J., Gough, D. O., & Thompson, M. J. 1991, ApJ, 378, 413
- Christensen-Dalsgaard (2021) Christensen-Dalsgaard, J. 2021, Living Reviews in Solar Physics, 18, 2
- Delahaye et al. (2016) Delahaye, F., Zwölf, C. M., Zeippen, C. J., Mendoza, C. 2016, JQSRT, 171, 66
- De-Leon & Gazit (2023) De-Leon, H., & Gazit, D. 2023, PhLB, 844, 138093
- Demarque et al. (2008) Demarque, P., Guenther, D. B., Li, L. H., Mazumdar, A., Straka, C. W. 2008, Ap&SS, 316, 31
- Deshmukh et al. (2022) Deshmukh, S. A., Ludwig, H. G., Kučinskas, A., et al., 2022, A&A 668, A48
- Endal & Sofia (1978) Endal, A. S., & Sofia, S. 1978, ApJ, 220, 279
- Eggenberger et al. (2019) Eggenberger, P., Buldgen1, G., Salmon, S. J. A. J. 2019, A&A 626, L1
- Ferguson et al. (2005) Ferguson, J. W., Alexander, D. R., Allard, F. et al. 2005, ApJ, 623, 585
- García et al. (2011) García, R. A., Salabert, D., & Ballot, J. et al. 2011, JPhCS, 271, 012049
- Grevesse & Sauval (1998) Grevesse, N., & Sauval, A. J. 1998, in Solar Composition and Its Evolution, ed. C. Fröhlich et al. (Dordrecht: Kluwer), 161 (GS98)
- Guenther (1994) Guenther D. B. 1994, ApJ, 422, 400
- Guzik et al. (2005) Guzik, J. A., Watson, L. S. & Cox, A. N. 2005, ApJ, 627, 1049
- Iglesias & Rogers (1996) Iglesias, C., Rogers, F. J. 1996, ApJ, 464, 943
- Kawaler (1988) Kawaler, S. D. 1988, ApJ, 333, 236
- Krishna Swamy (1966) Krishna Swamy, K. S. 1966, ApJ, 145, 174
- Kunitomo & Guillot (2021) Kunitomo, M., & Guillot, T. 2021, A&A, 655, A51
- Kunitomo et al. (2022) Kunitomo, M., Guillot, T., Buldgen, G. 2022, A&A, 667, L2
- Li et al. (2021) Li, W., Amarsi, A. M., Papoulia, A., Ekman, J., Jönsson, P. 2021, MNRAS, 502, 3780
- Li et al. (2023a) Li, W., Jönsson, P., Amarsi, A. M., Li, M. C., Grumer, J. 2023a, A&A, 674, 54
- Li et al. (2023b) Li, M. C., Li, W., Jönsson, P., Amarsi, A. M., Grumer, J. 2023b, ApJS, 265, 26
- Liu et al. (1996) Liu, W., Bai, X., Zhou, S., et al. 1996, PhRvL, 77, 611
- Lodders (2003) Lodders, K. 2003, ApJ, 591, 1220
- Lodders et al. (2021) Lodders, K. 2021, Space Science Reviews, 217, 44
- Lodders et al. (2009) Lodders, K., Palme, H., Gail, H-P. 2009, LanB, 4B, 712
- Lodders (2020) Lodders, K. 2020, Solar elemental abundances, in Online Oxford Research Encyclopedia of Planetary Science. https://doi.org/10.1093/acrefore/9780190647926.013.145. arXiv:1912.00844
- Magg et al. (2022) Magg, E., Bergemann, M., Serenelli, A., et al., 2022, A&A 661, A140
- Marcucci et al. (2000) Marcucci, L. E., Schiavilla, R., Viviani, M., Kievski, A., & Rosati, S. 2000, PhRvL, 84, 5959
- Matt et al. (2015) Matt, S. P., Brun, A. S., Baraffe, I., Bouvier, J., Chabrier, G. 2015, ApJ, 799, 23
- Montalbán et al. (2004) Montalbán, J., Miglio, A., Noels, A., Grevesse, N., Di Mauro, M. P. 2004, in Helio- and Asteroseismology: Towards a Golden Future, Proc. of the SOHO 14 /GONG 2004 Workshop, ESA SP-559, ed. D. Danesy (Noordwijk: ESA), 574
- Mussack & Däppen (2011) Mussack, K., & Däppen, W., 2011, ApJ, 729, 96
- Park et al. (2003) Park, T. S., Marcucci, L. E., Schiavilla, R. et al. 2003, PhRvC, 67, 055206
- Park & Rolfs (1991) Parker, P. D., and Rolfs, C. 1991, in The Solar Interior and Atmosphere, edited by A. Cox, W. C. Livingston, and M. S. Matthews (University of Arizona, Tucson), p. 31
- Pietrow et al. (2023) Pietrow, A. G. M., Hoppe, R., Bergemann, M., Calvo, F. 2023, A&A, 672, L6
- Pinsonneault et al. (1989) Pinsonneault, M. H., Kawaler, S. D., Sofia, S., & Demarqure, P. 1989, ApJ, 338, 424
- Proffitt & Michaud (1991) Proffitt, C. R., & Michaud, G. 1991, ApJ, 380, 238
- Rogers & Nayfonov (2002) Rogers, F., & Nayfonov, A. 2002, ApJ, 576, 1064
- Roxburgh & Vorontsov (2003) Roxburgh, I. W., & Vorontsov, S. V. 2003, A&A, 411, 215
- Schiavilla et al. (1994) Schiavilla, R., Wiringa, R. B., Pandharipande, V. R., and Carlson, J. 1992, PhRvC, 45, 2628
- Schramm & Shi (1994) Schramm, D. N., & Shi, X. 1994, NuPhS, 35, 321
- Seaton (1987) Seaton, M. J. 1987, JPhB, 20, 6363
- Serenelli & Basu (2010) Serenelli, A., & Basu, S. 2010, ApJ, 719, 865
- Serenelli et al. (2009) Serenelli, A. M., Basu, S., Ferguson, J. W., & Asplund, M. 2009, ApJL, 705, L123
- Serenelli et al. (2011) Serenelli, A., Haxton, W. C., Peña-Garay, C. 2011, ApJ, 743, 24
- Takata & Gough (2024) Takata, M., & Gough, D. O. 2024, MNRAS, 527, 1283
- The Opacity Project Team (1995) The Opacity Project Team, 1995, The Opacity Project Vol. 1, Institute of Physics Publications, Bristol, UK
- Thompson et al. (2003) Thompson, M. J., Christensen-Dalsgaard, J., Miesch, M. S., Toomre, J. 2003, ARA&A, 41, 599
- Thoul et al. (1994) Thoul, A. A., Bahcall, J. N., Loeb, A. 1994, ApJ, 421, 828
- Turck-Chièze et al. (2010) Turck-Chièze, S., Palacios, A., Marques, J. P., Nghiem, P. A. P. 2010, ApJ, 715, 1539
- Turck-Chièze et al. (2011) Turck-Chièze, S., Piau, L., & Couvidat, S. 2011, ApJL, 731, L29
- Turcotte et al. (1998) Turcotte, S.,Richer, J., Michaud, G., Iglesias, C. A., and Rogers, F. J. 1998, ApJ, 504, 539
- Vorontsov et al. (2014) Vorontsov, S. V., Baturin, V. A., Ayukov, S. V., Gryaznov, V. K. 2014, MNRAS, 441, 3296
- Wang et al. (2023) Wang, E. X., Nordlander, T., Asplund, M., Amarsi, A. M., Lind, K., & Zhou, Y. 2023, MNRAS, 500, 2159
- Wolfs et al. (1989) Wolfs, F. L. H.,; Freedman, S. J., Nelson, J. E., Dewey, M. S., Greene, G. L. 1989, PhRvL, 63, 2721
- Yang (2016) Yang, W. 2016, ApJ, 821, 108
- Yang (2019) Yang, W. 2019, ApJ, 873, 18
- Yang (2022) Yang, W. 2022, ApJ, 939, 61
- Yang & Bi (2006) Yang, W. M., & Bi, S. L. 2006, A&A, 449, 1161
- Yang & Bi (2007) Yang, W. M., & Bi, S. L. 2007, ApJL, 658, L67
- Zahn (1993) Zahn, J. P. 1993, in Astrophysical Fluid Dynamics, Les Houches XLVII, ed. J.-P. Zahn & J. Zinn-Justin (New York: Elsevier), 561
- Zhang & Li (2012) Zhang, Q., & Li, Y. 2012, ApJ, 746, 50
- Zhang et al. (2019) Zhang, Q. S., Li, Y., Christensen-Dalsgaard, J. 2019, ApJ, 881, 103
| Model | A(Li)s | A(Be)s | |||||||||||
|---|---|---|---|---|---|---|---|---|---|---|---|---|---|
| GS98Sa | 0.27562 | 0.01940 | 2.1274 | 0 | 1.0 | 0.716 | 0.2451 | 0.0174 | 0.0236 | 0.0305 | 0 | 2.14 | 1.48 |
| B92S | 0.26994 | 0.01835 | 2.1010 | 0 | 1.0 | 0.718 | 0.2400 | 0.0165 | 0.0222 | 0.0299 | 0 | 2.15 | 1.48 |
| B92E | 0.27107 | 0.01860 | 2.1245 | 0 | 1.15 | 0.715 | 0.2373 | 0.0165 | 0.0221 | 0.0337 | 0 | 2.15 | 1.48 |
| B92R | 0.27097 | 0.01855 | 2.0821 | 0.1 | 1.15 | 0.711 | 0.2484 | 0.0165 | 0.0224 | 0.0226 | 10 | 1.13 | 1.31 |
| A11R | 0.27272 | 0.01857 | 2.0818 | 0.1 | 1.15 | 0.712 | 0.2501 | 0.0165 | 0.0225 | 0.0226 | 10 | 1.13 | 1.31 |
| B89R | 0.27255 | 0.01855 | 2.0818 | 0.1 | 1.15 | 0.712 | 0.2499 | 0.0165 | 0.0225 | 0.0227 | 10 | 1.13 | 1.31 |
| BAR1 | 0.27322 | 0.01855 | 2.0833 | 0.1 | 1.15 | 0.712 | 0.2509 | 0.0165 | 0.0225 | 0.0223 | 10 | 1.13 | 1.31 |
| BAR2 | 0.27215 | 0.01855 | 2.0823 | 0.1 | 1.15 | 0.712 | 0.2495 | 0.0165 | 0.0225 | 0.0226 | 10 | 1.13 | 1.31 |
| BAR2M0 | 0.27231 | 0.01855 | 2.0642 | 0.1 | 1.15 | 0.713 | 0.2531 | 0.0165 | 0.0226 | 0.0192 | 10 | 0.11 | 0.98 |
| B92RM | 0.27104 | 0.01855 | 2.0804 | 0.1 | 1.15 | 0.711 | 0.2486 | 0.0165 | 0.0224 | 0.0224 | 10 | 1.09 | 1.29 |
| BAR2M | 0.27217 | 0.01855 | 2.0806 | 0.1 | 1.15 | 0.712 | 0.2496 | 0.0165 | 0.0225 | 0.0226 | 10 | 1.08 | 1.29 |
| BAR2Mcb | 0.27064 | 0.01779 | 2.1016 | 0.1 | 1.36 | 0.712 | 0.2446 | 0.01548 | 0.0209 | 0.0260 | 10 | 1.05 | 1.27 |
| BAR2Mgc | 0.27272 | 0.01906 | 2.1147 | 0.05 | 1.15 | 0.714 | 0.2501 | 0.0169 | 0.0231 | 0.0226 | 10 | 1.09 | 1.29 |
| BAR2Mnd | 0.27102 | 0.01830 | 2.0624 | 0.1 | 1.0 | 0.712 | 0.2513 | 0.0165 | 0.0225 | 0.0197 | 10 | 1.11 | 1.29 |
| BAR2Mie | 0.27370 | 0.01855 | 2.0700 | 0.1 | 1.15 | 0.713 | 0.2510 | 0.0165 | 0.0225 | 0.0227 | 10 | 1.10 | 1.29 |
| BAR3M | 0.27238 | 0.01855 | 2.0779 | 0.1 | 1.0 | 0.712 | 0.2498 | 0.0165 | 0.0225 | 0.0226 | 10 | 1.09 | 1.29 |
| Reaction | B92’sa | A11’sb | B89’sc | BAR1 | BAR2 | BAR3 |
|---|---|---|---|---|---|---|
| 1H(, e )2H () | 4.00 | 4.07 | 4.13 | 4.07 | 4.10 | |
| 3He(3He, )4He () | 5.00 | 5.15 | 5.15 | 5.05 | 5.05 | |
| 3He(4He, )7Be | 0.533 | 0.54 | 0.56 | 0.56 | 0.56 | |
| 12C(, )13N | 1.45 | 1.45 | 1.34 | 1.34 | 1.34 | |
| 13C(, )14N | 5.50 | 5.50 | 7.6 | 7.6 | 7.6 | |
| 14N(, )15O | 3.32 | 3.32 | 1.77 | 1.77 | 1.77 | |
| 16O(, )17F | 9.4 | 9.4 | 10.6 | 10.6 | 10.6 | |
| 1H(, )2H | Eq.(17)e | Eq.(17) | Eq.(17) | Eq.(17) | Eq.(17) | Eq.(17) |
| 7Be(, )7Li | Eq.(18)f | Eq.(18) | Eq.(18) | Eq.(18) | Eq.(18) | Eq.(18) |
| 7Be(, )8B () | 22.4 | 20.8 | 24.3 | 22.4 | 22.4 | 22.4 |
| 3He(, e )4He () | 10.35g | 10.35 | 10.35 | 10.35 | 10.35 | 10.35 |
| Model | ||||
|---|---|---|---|---|
| GS98S | 15.770 | 154.2 | 0.6450 | 0.02045 |
| B92S | 15.676 | 153.7 | 0.6381 | 0.01933 |
| B92E | 15.714 | 154.4 | 0.6416 | 0.01975 |
| B92R | 15.712 | 154.5 | 0.6412 | 0.01969 |
| A11R | 15.643 | 151.7 | 0.6360 | 0.01971 |
| B89R | 15.643 | 151.7 | 0.6360 | 0.01969 |
| BAR1 | 15.615 | 150.6 | 0.6340 | 0.01969 |
| BAR2 | 15.666 | 152.5 | 0.6378 | 0.01969 |
| BAR2M0 | 15.668 | 152.7 | 0.6383 | 0.01969 |
| B92RM | 15.713 | 154.6 | 0.6415 | 0.01969 |
| BAR2M | 15.666 | 152.6 | 0.6380 | 0.01969 |
| BAR2Mc | 15.687 | 152.4 | 0.6396 | 0.01909 |
| BAR2Mg | 15.680 | 152.8 | 0.6387 | 0.02023 |
| BAR2Mn | 15.629 | 151.9 | 0.6345 | 0.01927 |
| BAR2Mi | 15.693 | 152.5 | 0.6395 | 0.01969 |
| BAR3M | 15.654 | 152.1 | 0.6370 | 0.01969 |
| Model | 7Be | 8B | 13N | 15O | 17F | |||
|---|---|---|---|---|---|---|---|---|
| Measured | 6.06 | 1.60.3b | … | 4.840.24a | 5.210.27c | … | … | … |
| B16d | 5.97 | 1.4480.013 | 19 | 4.80 | 5.16 | 13.7 | 2.8 | 85 |
| Borexinoe | 6.10.5 | 1.390.19 | 220 | 4.990.11 | 5.68 | 6.6 | ||
| GS98S | 5.92 | 1.428 | 9.65 | 5.02 | 6.01 | 5.64 | 4.91 | 4.51 |
| B92S | 5.96 | 1.449 | 9.82 | 4.82 | 5.45 | 4.70 | 4.06 | 5.13 |
| B92E | 5.95 | 1.444 | 9.76 | 4.91 | 5.68 | 4.95 | 4.31 | 5.45 |
| B92R | 5.96 | 1.448 | 9.76 | 4.90 | 5.66 | 4.94 | 4.29 | 5.43 |
| A11R | 5.86 | 1.409 | 9.64 | 4.91 | 5.02 | 4.24 | 2.10 | 5.60 |
| B89R | 5.95 | 1.432 | 9.64 | 4.73 | 5.65 | 4.58 | 3.93 | 4.96 |
| BAR1 | 5.98 | 1.435 | 9.59 | 4.81 | 5.20 | 4.10 | 2.02 | 5.39 |
| BAR2 | 5.97 | 1.441 | 9.67 | 4.98 | 5.58 | 4.33 | 2.16 | 5.75 |
| BAR2M0 | 5.98 | 1.444 | 9.67 | 4.98 | 5.58 | 4.34 | 2.16 | 5.77 |
| B92RM | 5.96 | 1.448 | 9.76 | 4.90 | 5.66 | 4.94 | 4.30 | 5.43 |
| BAR2M | 5.98 | 1.442 | 9.67 | 4.98 | 5.58 | 4.33 | 2.16 | 5.76 |
| BAR2Mc | 5.97 | 1.441 | 9.68 | 5.01 | 5.69 | 4.24 | 2.12 | 5.67 |
| BAR2Mg | 5.97 | 1.441 | 9.65 | 5.01 | 5.66 | 4.51 | 2.25 | 6.02 |
| BAR2Mn | 5.99 | 1.446 | 9.73 | 4.89 | 5.35 | 4.10 | 2.03 | 5.42 |
| BAR2Mi | 5.97 | 1.439 | 9.65 | 5.03 | 5.71 | 4.41 | 2.20 | 5.89 |
| BAR3M | 6.00 | 1.447 | 9.65 | 4.94 | 5.48 | 4.28 | 2.13 | 5.67 |
| Model | ||||
|---|---|---|---|---|
| GS98S | 733 | 1.2 | 1.83 | 0.94 |
| B92S | 811 | 2.3 | 0.85 | 5.90 |
| B92E | 376 | 1.4 | 0.66 | 10.24 |
| B92R | 289 | 1.5 | 0.61 | 0.00 |
| A11R | 219 | 2.4 | 4.45 | 0.21 |
| B89R | 215 | 2.4 | 1.60 | 0.16 |
| BAR1 | 220 | 3.3 | 1.07 | 0.36 |
| BAR2 | 217 | 1.8 | 0.24 | 0.08 |
| BAR2M0 | 251 | 2.0 | 0.22 | 1.73 |
| B92RM | 310 | 1.4 | 0.61 | 0.0 |
| BAR2M | 237 | 2.0 | 0.24 | 0.10 |
| BAR2Mc | 285 | 2.3 | 0.24 | 1.24 |
| BAR2Mg | 289 | 1.7 | 0.24 | 0.24 |
| BAR2Mn | 404 | 3.7 | 0.50 | 0.64 |
| BAR2Mi | 206 | 1.5 | 0.28 | 0.51 |
| BAR3M | 229 | 2.1 | 0.35 | 0.14 |